You are currently viewing a new version of our website. To view the old version click .
Applied Sciences
  • Article
  • Open Access

15 May 2022

A Hybrid Deep Residual Network for Efficient Transitional Activity Recognition Based on Wearable Sensors

,
and
1
Department of Computer Engineering, School of Information and Communication Technology, University of Phayao, Phayao 56000, Thailand
2
Image Information and Intelligence Laboratory, Department of Computer Engineering, Faculty of Engineering, Mahidol University, Nakhon Pathom 73170, Thailand
3
Department of Mathematics, Faculty of Applied Science, King Mongkut’s University of Technology North Bangkok, Bangkok 10800, Thailand
4
Intelligent and Nonlinear Dynamic Innovations Research Center, Science and Technology Research Institute, King Mongkut’s University of Technology North Bangkok, Bangkok 10800, Thailand
This article belongs to the Special Issue Movement Analysis for Health and Biometrics

Abstract

Numerous learning-based techniques for effective human behavior identification have emerged in recent years. These techniques focus only on fundamental human activities, excluding transitional activities due to their infrequent occurrence and short period. Nevertheless, postural transitions play a critical role in implementing a system for recognizing human activity and cannot be ignored. This study aims to present a hybrid deep residual model for transitional activity recognition utilizing signal data from wearable sensors. The developed model enhances the ResNet model with hybrid Squeeze-and-Excitation (SE) residual blocks combining a Bidirectional Gated Recurrent Unit (BiGRU) to extract deep spatio-temporal features hierarchically, and to distinguish transitional activities efficiently. To evaluate recognition performance, the experiments are conducted on two public benchmark datasets (HAPT and MobiAct v2.0). The proposed hybrid approach achieved classification accuracies of 98.03% and 98.92% for the HAPT and MobiAct v2.0 datasets, respectively. Moreover, the outcomes show that the proposed method is superior to the state-of-the-art methods in terms of overall accuracy. To analyze the improvement, we have investigated the effects of combining SE modules and BiGRUs into the deep residual network. The findings indicates that the SE module is efficient in improving transitional activity recognition.

1. Introduction

Human Activity Recognition (HAR) has received considerable interest in recent years because of its applicability in home automation systems, fall detection for the elderly, sports performance, healthcare rehabilitation, and misbehavior identification [1,2]. For instance, by studying the activities of elderly persons who live alone, fall behavior could be recognized in order to request assistance from family members in time. Fit individuals could collect their exercise data by tracking their steps and identifying their movement state to accomplish scientific exercising and fitness monitoring. Gait analysis could be used to identify individuals with knee problems. The rehabilitation strategy could well be changed during the rehabilitation process by the movement data collected from patients with lower limb illnesses. There are two types of HAR technologies: vision-based and sensor-based [3,4]. The vision-based technique extracts human activity information from the video stream by embedding a camera in the human environment. While this technique can see the minutiae of human activity, it has privacy implications and is performance-dependent on the quality of the environment lighting. Rather than that, the sensor-based method provides a plethora of benefits. It is unaffected by the surrounding environment and seems to have the potential to achieve greater precision. Additionally, it will not raise users’ privacy concerns. As a result, sensor-based techniques are more appropriate for recognizing human activities [5]. This work is primarily concerned with the issue of sensor-based HAR.
Sensor-based Human Activity Recognition (S-HAR) is concerned with identifying, interpreting, and evaluating human activities using sensor data. Wearable sensors, including an accelerometer, gyroscope, or other complex sensors, may be connected to various body areas to monitor movement patterns and behaviors. Numerous S-HAR systems have been developed to automate the applications mentioned above; nevertheless, creating a fully automated S-HAR framework could be a difficult challenge due to the massive quantities of movement data and the effective categorization techniques required. Additionally, it is a complex endeavor since a single motion could be executed in several ways [6].
Human activities are often defined as fundamental Activities in Daily Living (ADL) and the postural changes between or within these activities. Postural transition is a limited motion between two essential activities, which differs amongst persons in terms of time and actions. Most works do not consider the postural variations due to their short duration. However, while executing numerous tasks in a short time frame, they play a significant role in efficiently recognizing activities [7]. Consequently, transition activity recognition is vital for HAR mechanisms.
For S-HAR research, learning-based approaches such as machine learning techniques have been used effectively throughout the previous decade. Under controlled circumstances, behavior identification using conventional machine learning techniques such as K-Nearest Neighborhood [8], Support Vector Machine (SVM) [9], Decision Tree (DT) [10], and Random Forest (RF) [11] has been successfully implemented [12]. The accuracy of these standard machine learning models is highly dependent on the process of human-manually extracted and selected features.
Deep Learning (DL) algorithms have recently achieved notable advances in the field of S-HAR [13,14]. One of the most significant characteristics of deep learning is its ability to automatically determine and classify features with a high degree of accuracy, which influenced the HAR study [15]. Deep neural networks are capable of learning discriminative characteristics from raw data efficiently, and they have demonstrated immense promise for evaluating diverse data and a high capacity for generalization. Numerous uni-model and hybrid methods have been developed to capitalize on DL methods by compensating for the weaknesses of traditional machine learning and leveraging the multiple levels of information present at various levels of hierarchies [16]. A hierarchy of layers is employed in DL models to handle low/high-level features and linear/nonlinear feature modifications at different levels, which supports learning and adjusting features. To this end, models such as Recurrent Neural Networks (RNN) [17], Convolutional Neural Networks (CNN) [18], and Long Short-Term Memory (LSTM) [19], among others, are used to address the shortcomings of traditional machine learning algorithms that relied on manual feature selection/classification, in which incorrect feature selection/classification could have unfavorable effects. As a result, DL networks have realized a practical implementation in identification schemes and are often utilized for feature extraction in studies on action recognition [20]. One disadvantage of the DL paradigm, mainly when hybrid structures are being used, is the higher expense of computing the massive quantity of accessible information. Nevertheless, the cost is justified since an S-HAR system relies on accurate classification performance from DL models.
While the previous investigations have made substantial advances, two fundamental constraints remain. Conventional algorithms for transitional movement identification rely laboriously on handmade characteristics. Such techniques, nevertheless, are not durable and depend excessively on professional expertise. Several studies combined time-domain, frequency-domain, and nonlinear features to generate feature vectors, a laborious and error-prone process to extract efficient temporal characteristics from short-duration data of transitional events. Additionally, such characteristics are often task-specific and lack universality. Furthermore, inaccuracies in the feature extraction phase might spread to subsequent stages, impairing detection capability. Although a few deep learning-based techniques have been offered to investigate the information about transitions between ADL actions, their performance falls short of time-series ADL signal-based methods. Second, since the categorization borders between transitional movements are not apparent, they may be misidentified when using the same fixed-length windowing settings. Previous studies have found that there is much scope for development in identifying transitional activities.
To solve these concerns, this work proposes a hybrid DL model in which networks are trained to identify both fundamental and transitional human behaviors concurrently. The innovative components include the concurrent deployment of several DL models to improve classification accuracy and the addition of transitional behaviors to deliver a robust method of activity identification. A summary of the significant contributions of this study is presented as follows:
  • This work presents a hybrid deep residual model based on convolutional layers and bidirectional gated recurrent unit layers that is capable of autonomously learning local features and modeling their temporal dependency. The proposed method augments the deep residual model with hybrid Squeeze-and-Excitation (SE) residual blocks, allowing for hierarchical extraction of deep spatio-temporal characteristics and effective separation of transitional activities.
  • The proposed model achieved the recognition of transitional activities and basic ADL activities in short durations of continuous sensor data streams.
  • We investigated the effects of recognizing transitional activities in various issues including segmentation techniques and multimodal sensors.
  • We evaluated the exploratory findings in comparison to those obtained from other models using the same HAR dataset. The results indicate that the proposed strategy outperforms different sophisticated approaches.
The rest of the paper is divided into the following sections: Section 2 discusses state of the art in recognizing human activities using DL and current issues. Section 3 describes the hybrid deep residual learning methodology for transitional activity recognition presented in this article. Section 4 explains the experiment setting and shows the experimental results. This section also has a discussion of the experimental results. Finally, Section 5 is the conclusion and comments on future work.

3. Proposed Methodology

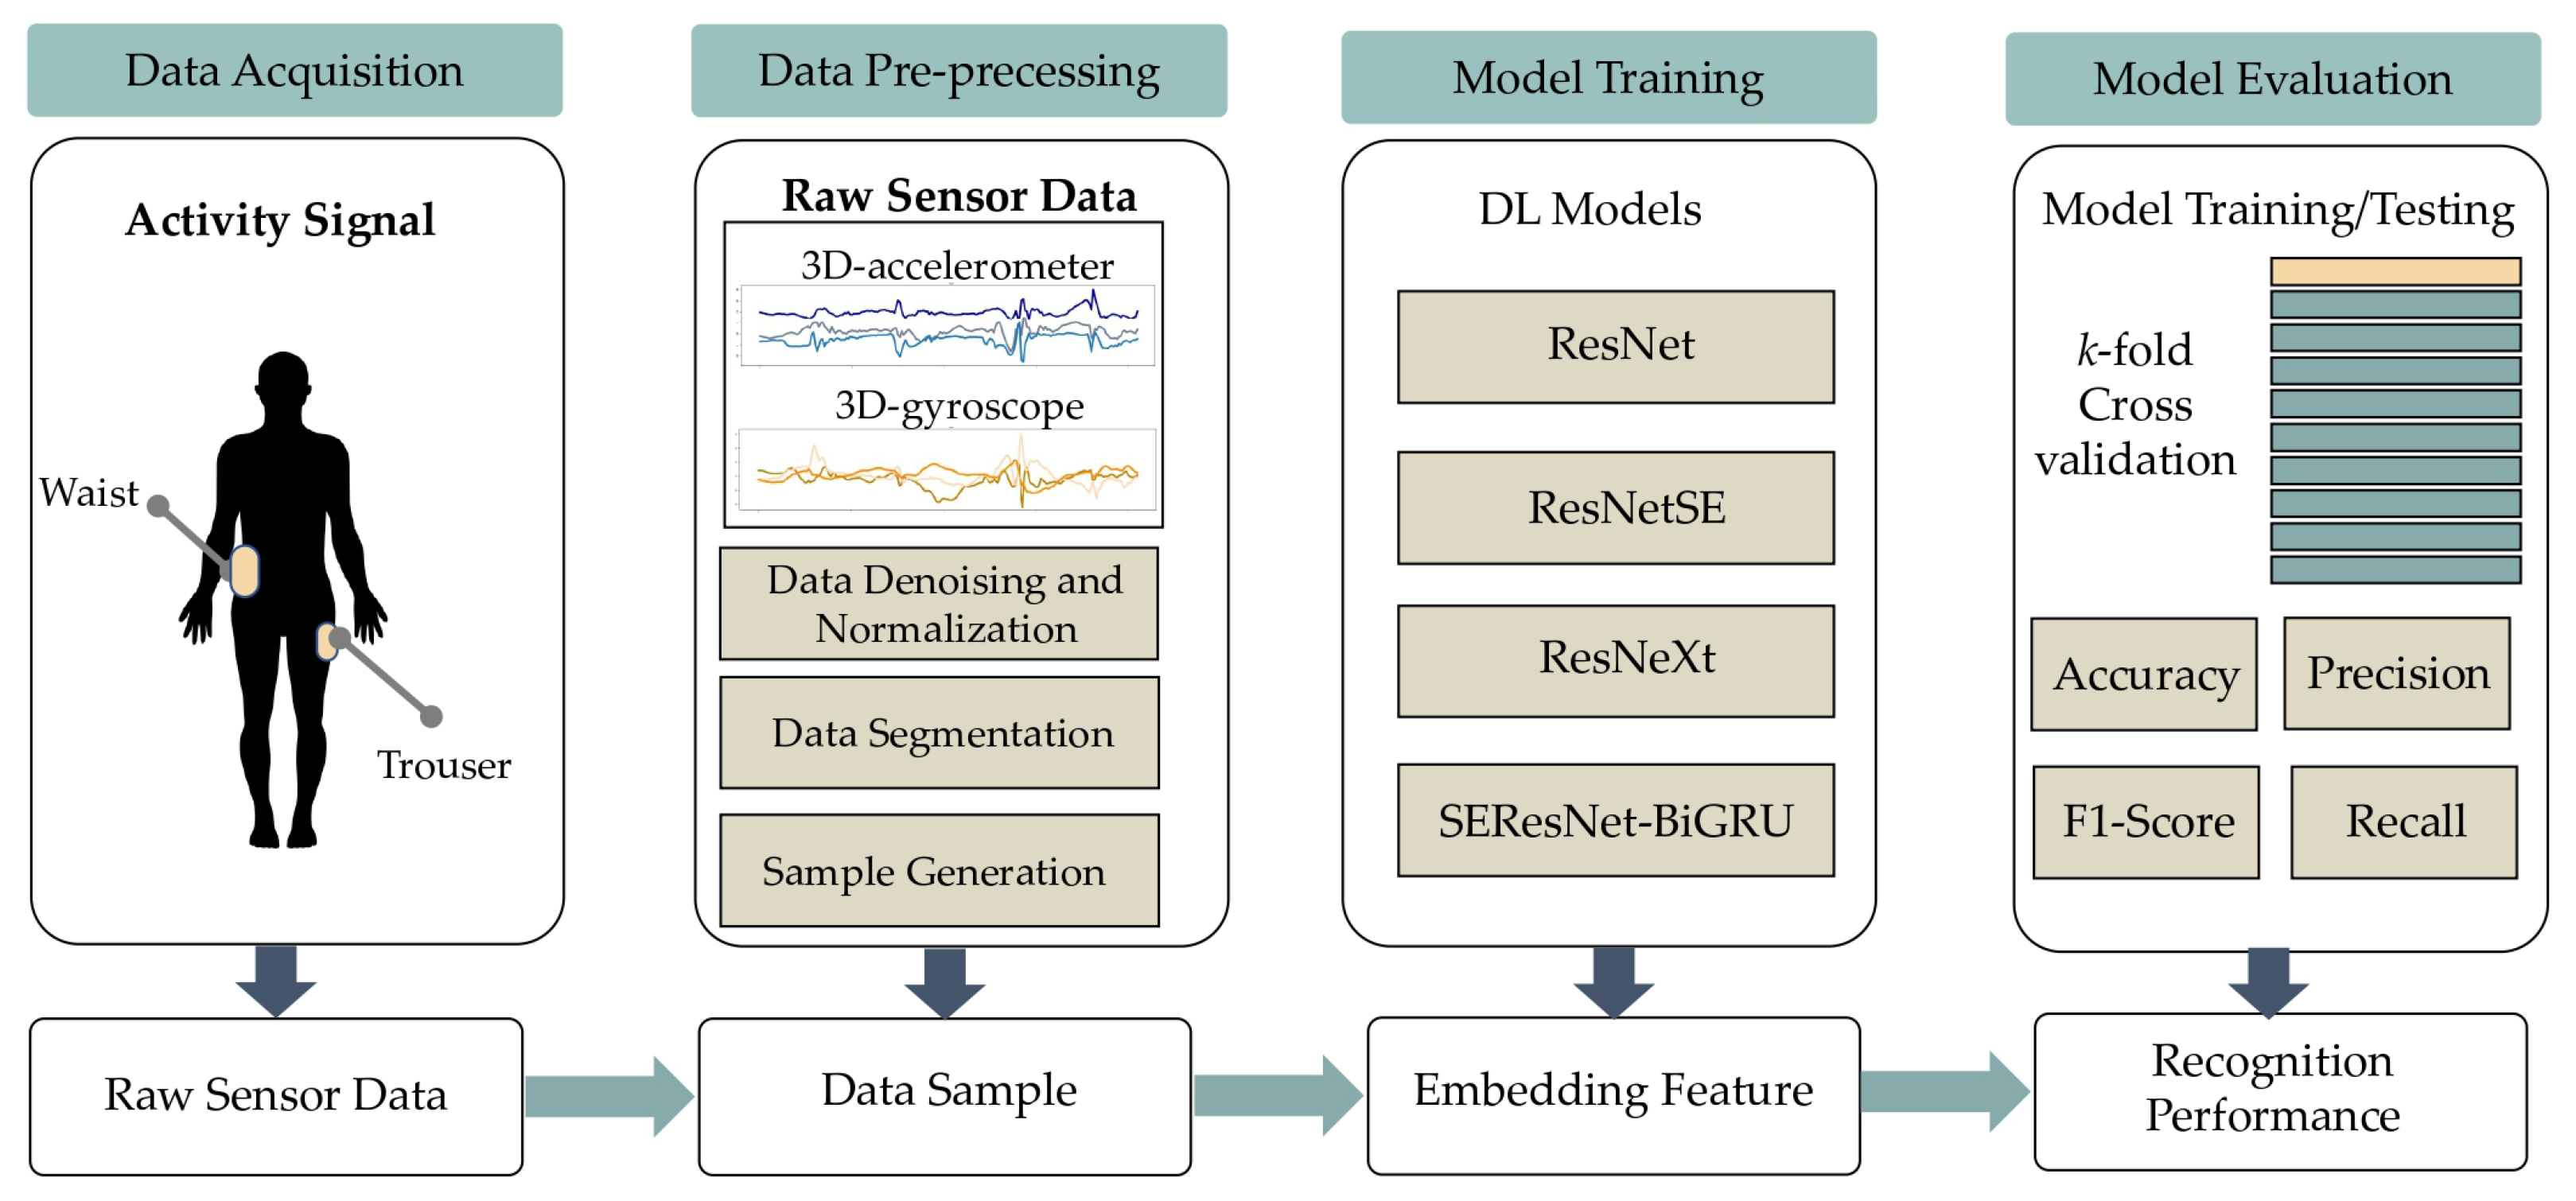
3.1. Overview of the HAR Framework Used in This Study

This research investigated S-HARs that are based on DL and use deep residual networks to extract the relevant abstract characteristics from raw sensor data. As seen in Figure 1, the examined S-HAR system comprises four key processes: data collecting, data preprocessing, model training, and model assessment.
Figure 1. The proposed S-HAR system.
To begin, we compiled HAR datasets, including wearable sensor data from fundamental and transitional actions. Following a literature survey, we have chosen two publicly accessible datasets to analyze in this research, namely HAPT and MobiAct. Sensor data include a three-dimensional accelerometer, a three-dimensional gyroscope, and three-dimensional orientation data. The sensor data were then denoised, normalized, and segmented using a sliding window method to create sample data for training and evaluating DL models. These samples are prepared using the k-fold cross-validation methodology. Finally, we evaluated and compared the trained models using four main HAR measurements. Each procedure is described in depth in the following subsections.

3.2. HAR Datasets

The research concentrates on building a model that can handle and utilize real-world circumstances where activities are carried out in a continuous way; thus, we selected two widely-used public datasets that provide raw data with sequences of actions and transitions: HAPT [31] and MobiAct v2.0 [43]. They comprised inertial data from the accelerometer and gyroscope sensors on smartphones. The data were gathered from individuals while they went about their regular routines. The features of these two datasets, which solely include the activities employed in this investigation, are summarized in Table 2. The chosen activities might be classified as static, dynamic, or transitional. The rationale for choosing these activities is that the identification system may be improved by including them since they are more prevalent in an individual’s everyday life.

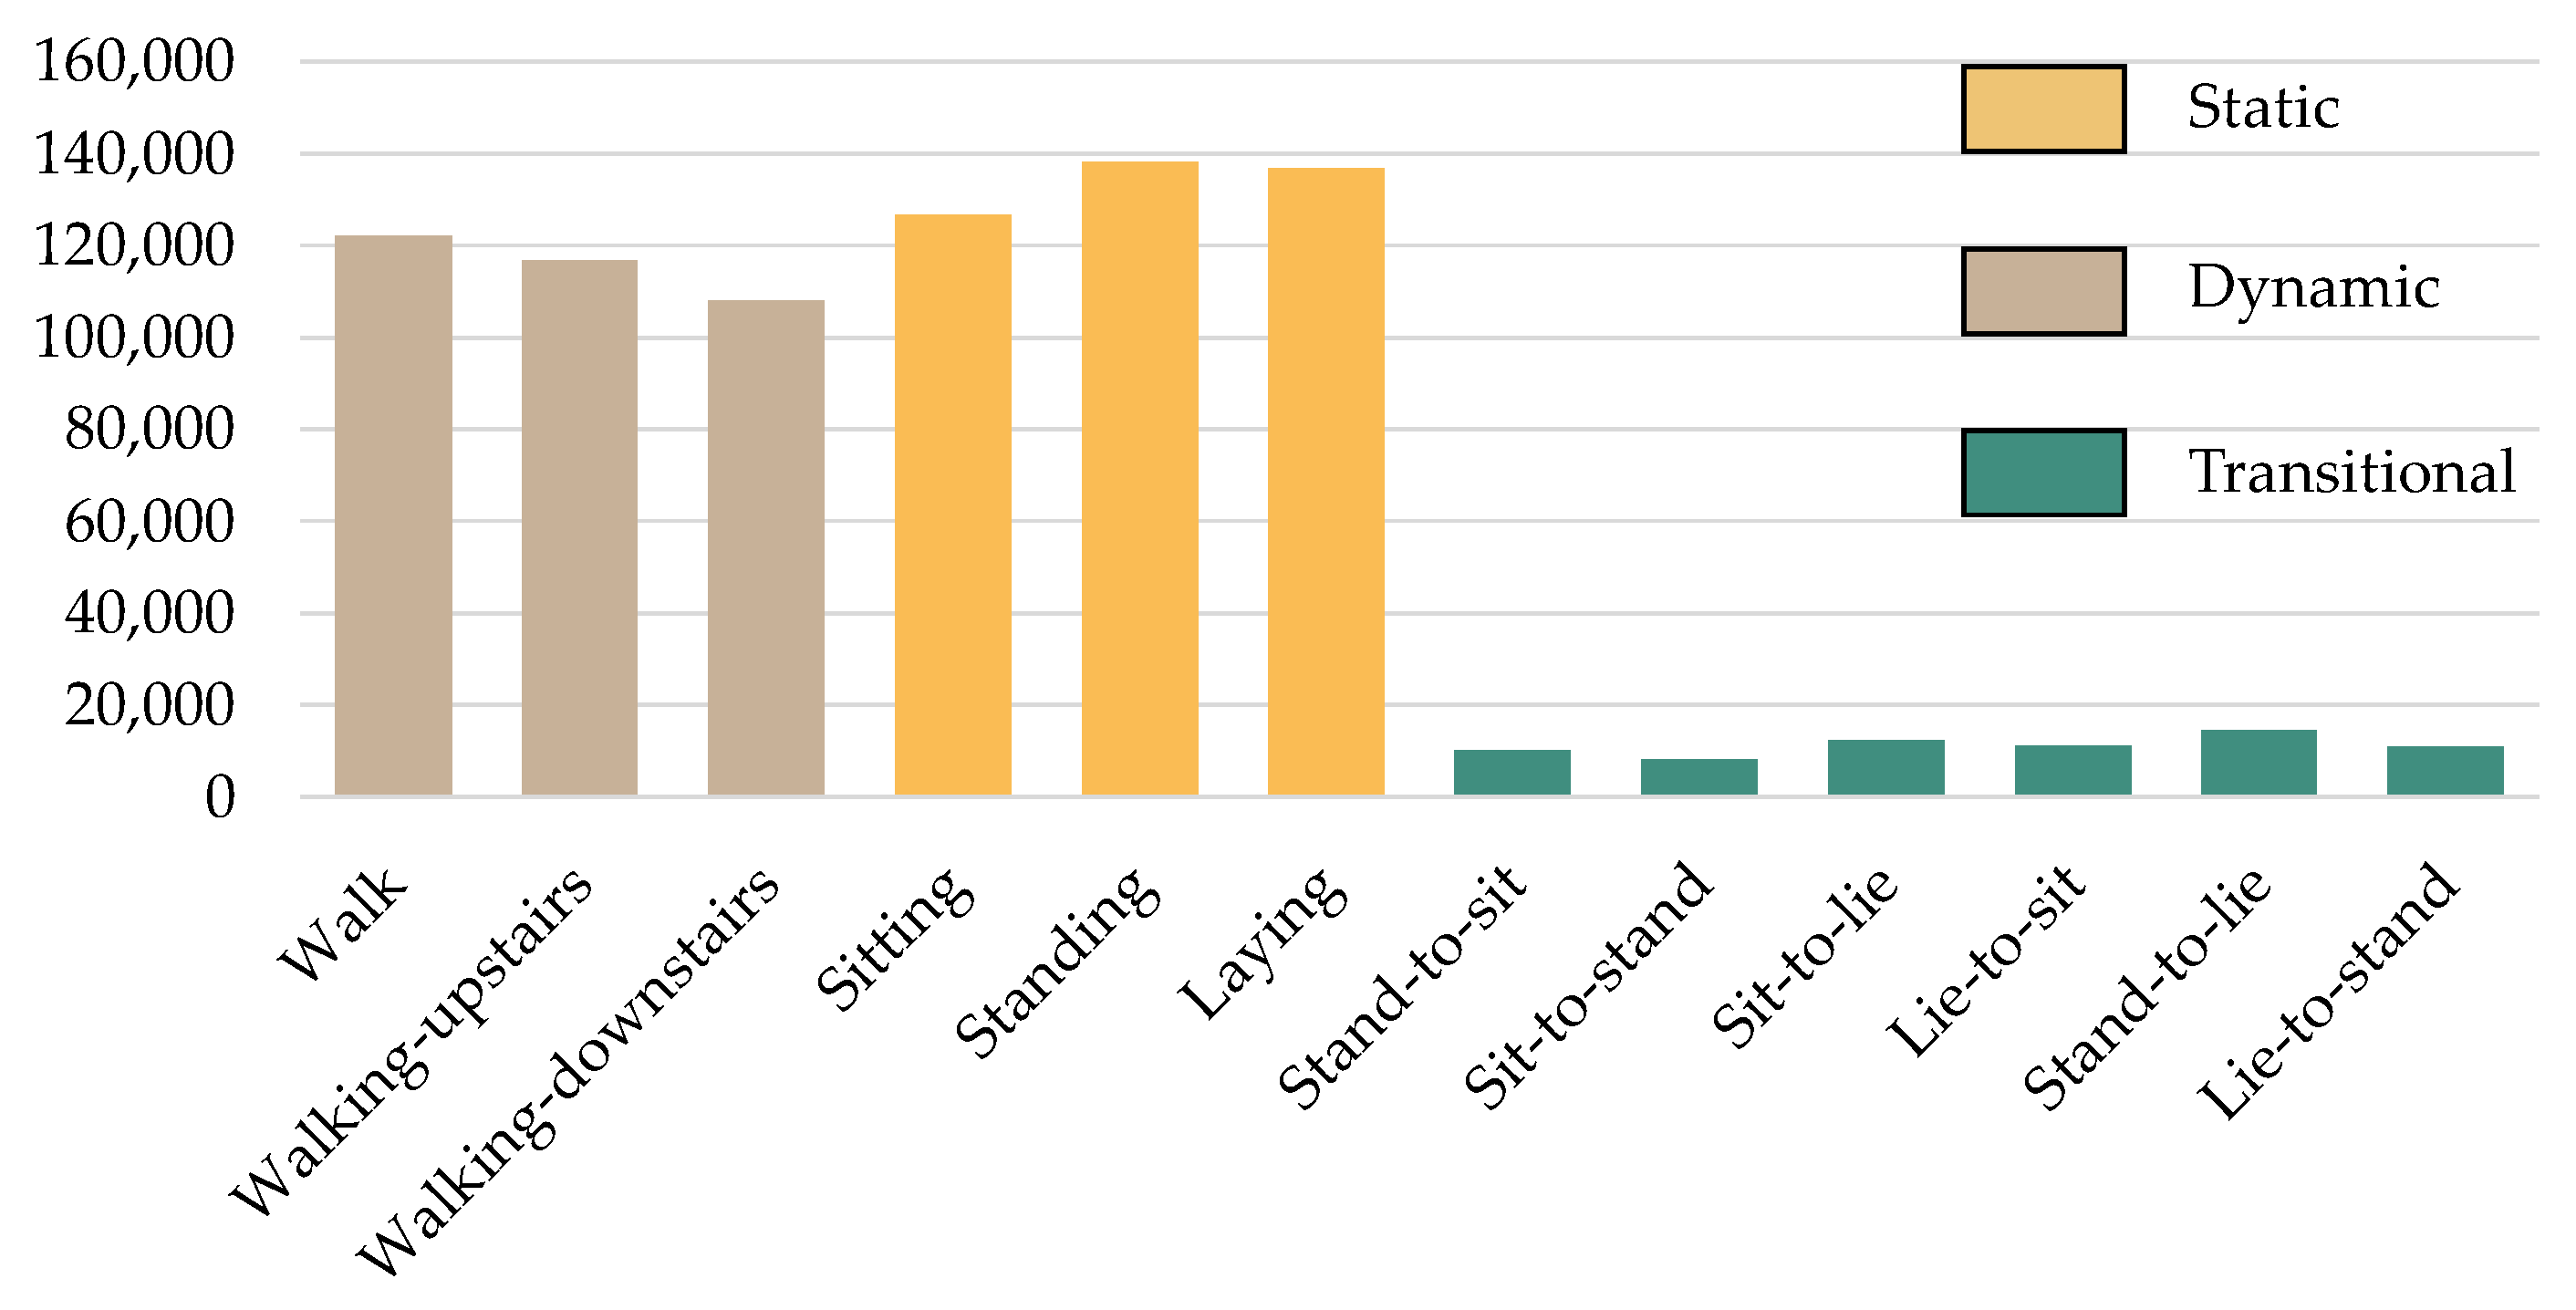
3.2.1. HAPT: Human Activities and Postural Transition Dataset

Extending the UCI HAR dataset [45], the HAPT dataset [31] enables an extra six postural changes in addition to the six standard activities. Unprocessed tri-axial signals from the inbuilt accelerometer and gyroscope sensors in a Samsung Galaxy II mobile make up the dataset, which is sampled at a rate of 50 Hz.
The findings are based on a study in which 30 people, ages 19 to 48, were asked to wear a smartphone around their waists. Twelve different tasks were given to these participants (six primary and six transitions). Moving from one activity to the next is documented as “standing to sit” and “lying to sit”, as well as the transitions between them. Walking is also included in the list of fundamental activities. Meanwhile, videos and photos of the investigation are being prepared for later data marking efficiency. Figure 2 depicts a summary of the HAPT dataset’s occurrences.
Figure 2. The number of activity samples in the HAPT dataset.

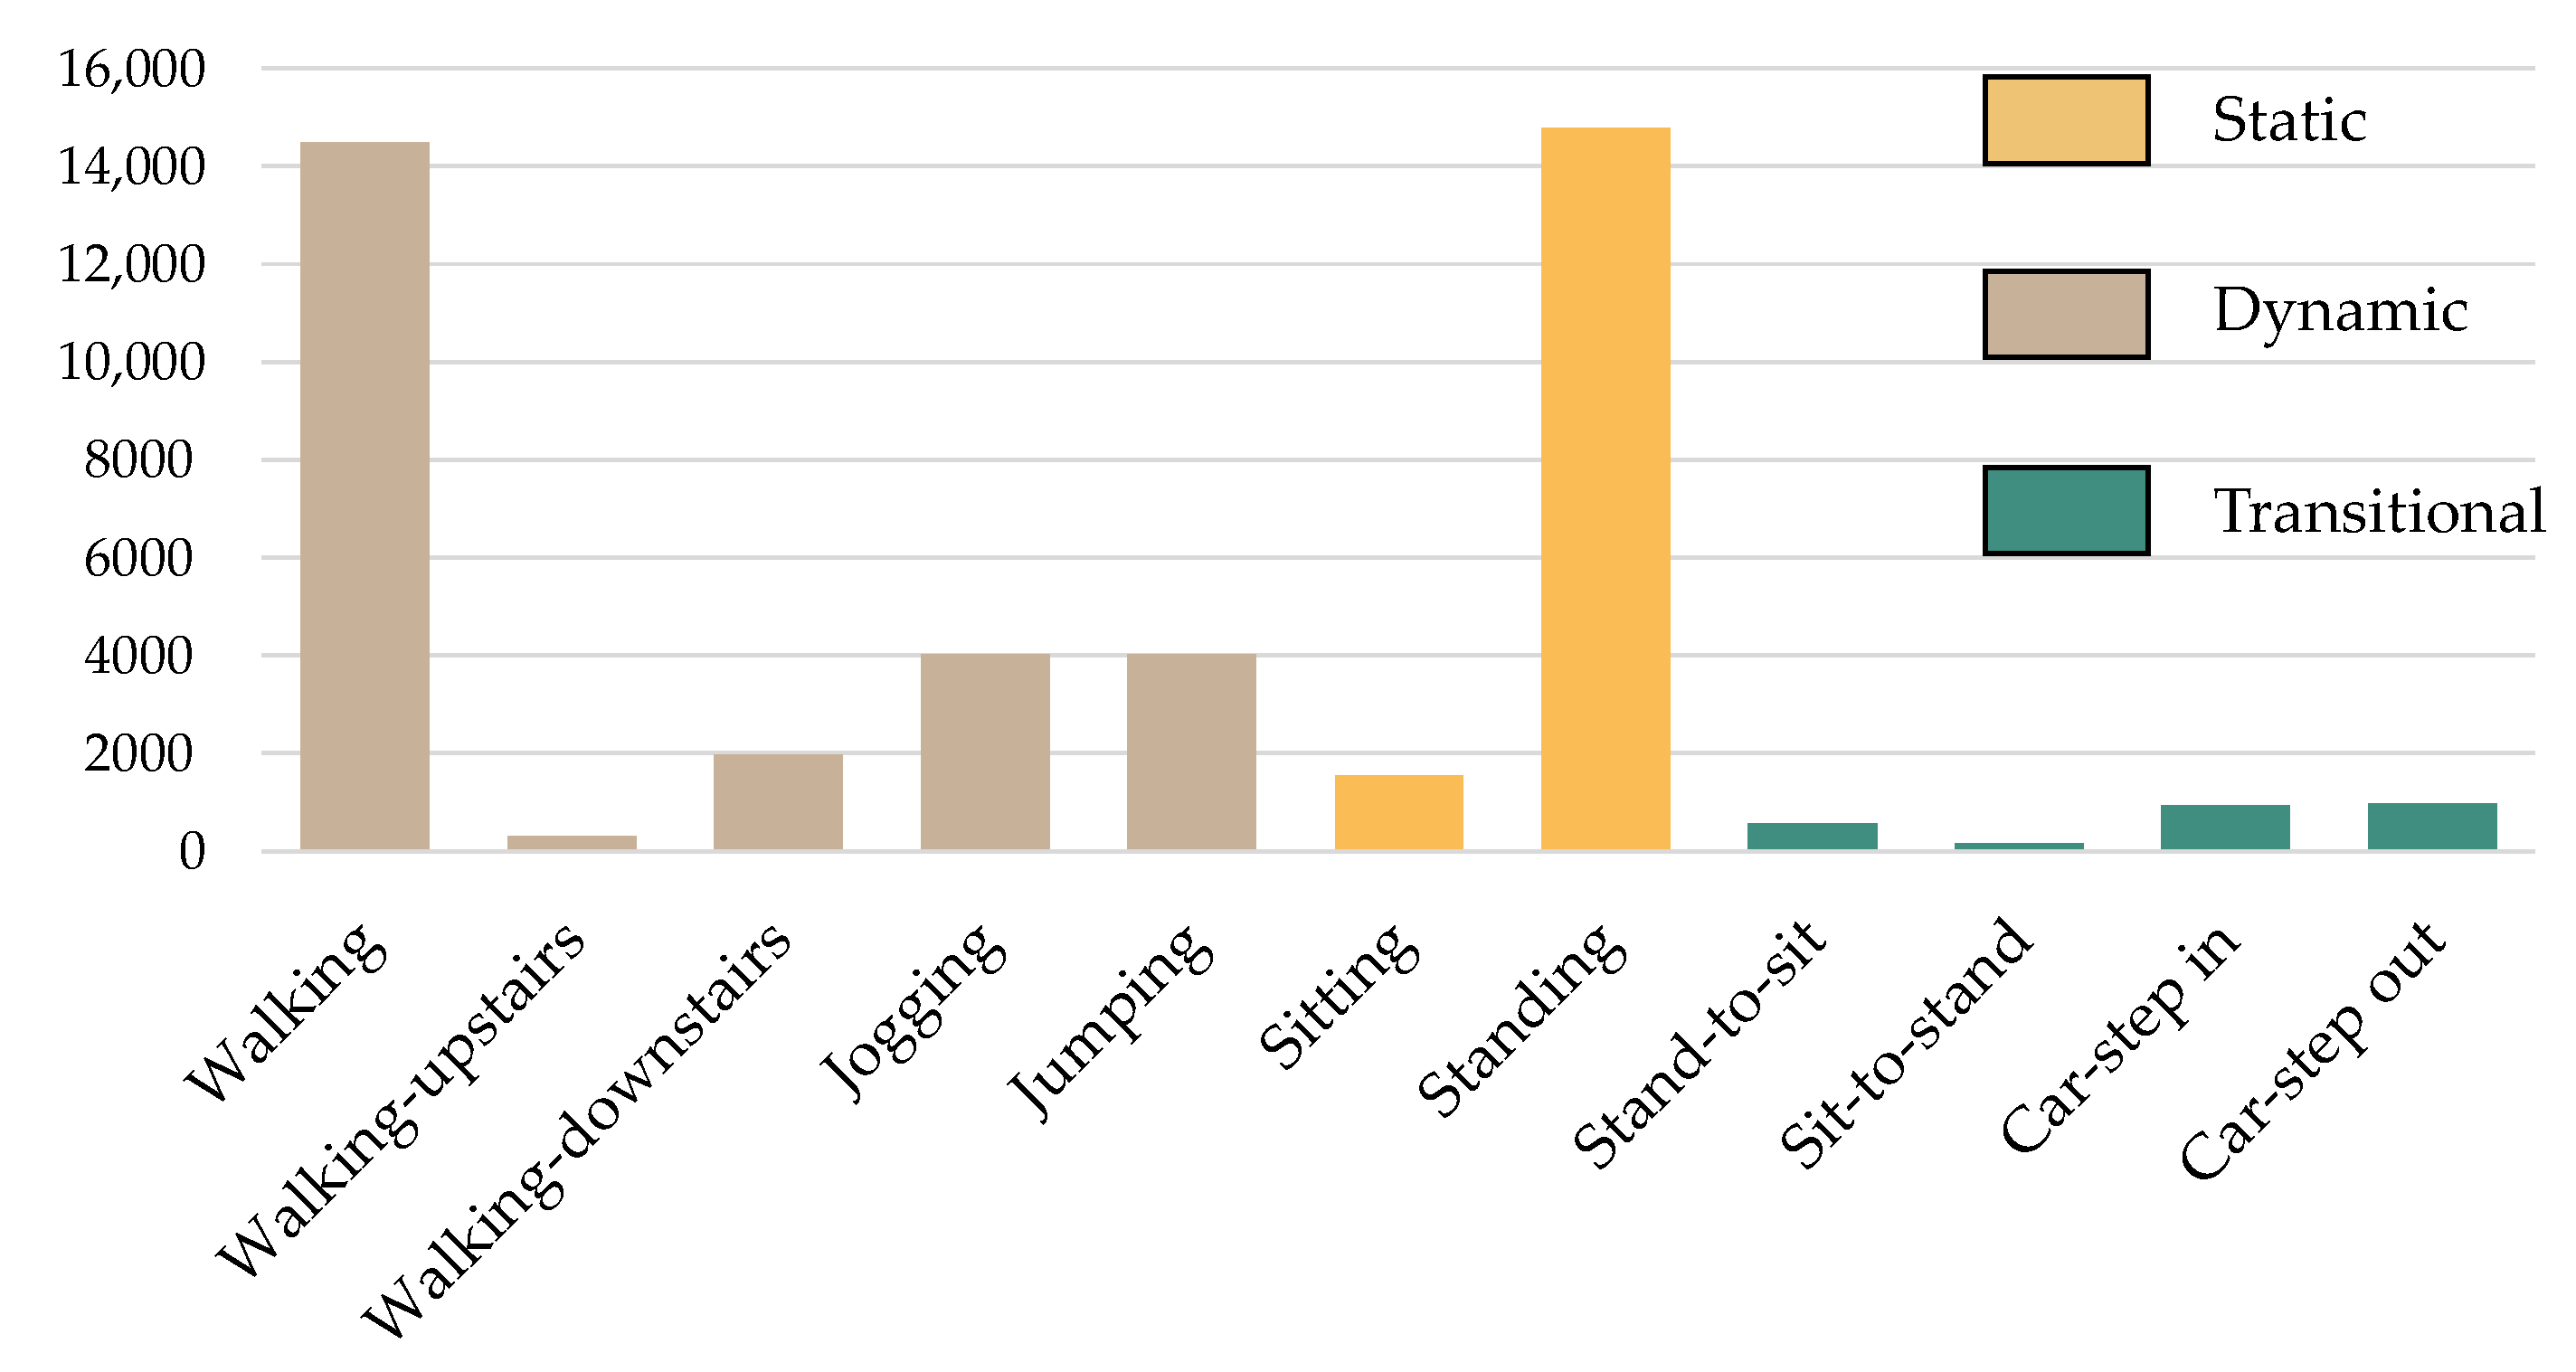
3.2.2. MobiAct v2.0 Dataset

The Biomedical Informatics and eHealth Laboratory (BMI lab) gathered and released the MobiAct dataset [43]. The dataset comprises raw sensor data from a smartphone taken as subjects engaged in various everyday actions and falls. The smartphone was placed in a trouser pocket selected randomly by the individual. We utilize only scenario data in this work to recreate real-world scenarios as suggested in [40]. The scenario data are divided into five sub-scenarios of everyday life: leaving home, being at work, leaving work, exercising, and coming home. The data were gathered from 19 participants as they engaged in 11 distinct activities: 7 fundamental ones (standing, sitting, walking, running, leaping, going downstairs, and walking upwards) and 4 transitions (stand-to-sit, sit-to-stand, car-step in, and car-step out). The source data were acquired using the smartphone’s maximum sampling rate, at around 200 samples per second (Hz). Figure 3 depicts a summary of the MobiAct dataset’s occurrences.
Figure 3. The number of activity samples in the MobiAct v2.0 dataset.

3.3. Data Preprocessing

3.3.1. Data Denoising

The raw sensor data contains process measurement noise or other unanticipated noise resulting from the individual’s lively motions during the investigations. A noisy signal distorts the signal’s actionable data. As a result, it was critical to decrease the influence of noise to recover relevant information from the signal for the production process. The most frequently used filtering techniques are the mean filter, the low-pass filter, the Wavelet filter, and the Gaussian filter [46]. Our investigation used a mean smoothing filter for the accelerometer and gyroscope sensors to denoise the signals.

3.3.2. Data Normalization

As seen in Equation (1), the raw sensor data are normalized to the range 0 to 1. This procedure assists in resolving the model learning issue by ensuring that all data values are within a close range. Consequently, gradient descents may achieve a higher rate of convergence.
X i n o r m = X i x i m i n x i m a x x i m i n , i = 1 , 2 , .
where X i n o r m denote the normalized data, n denoted the number of channels, x i m a x and x i m i n are the maximum and minimum values of the i-th channel, respectively.

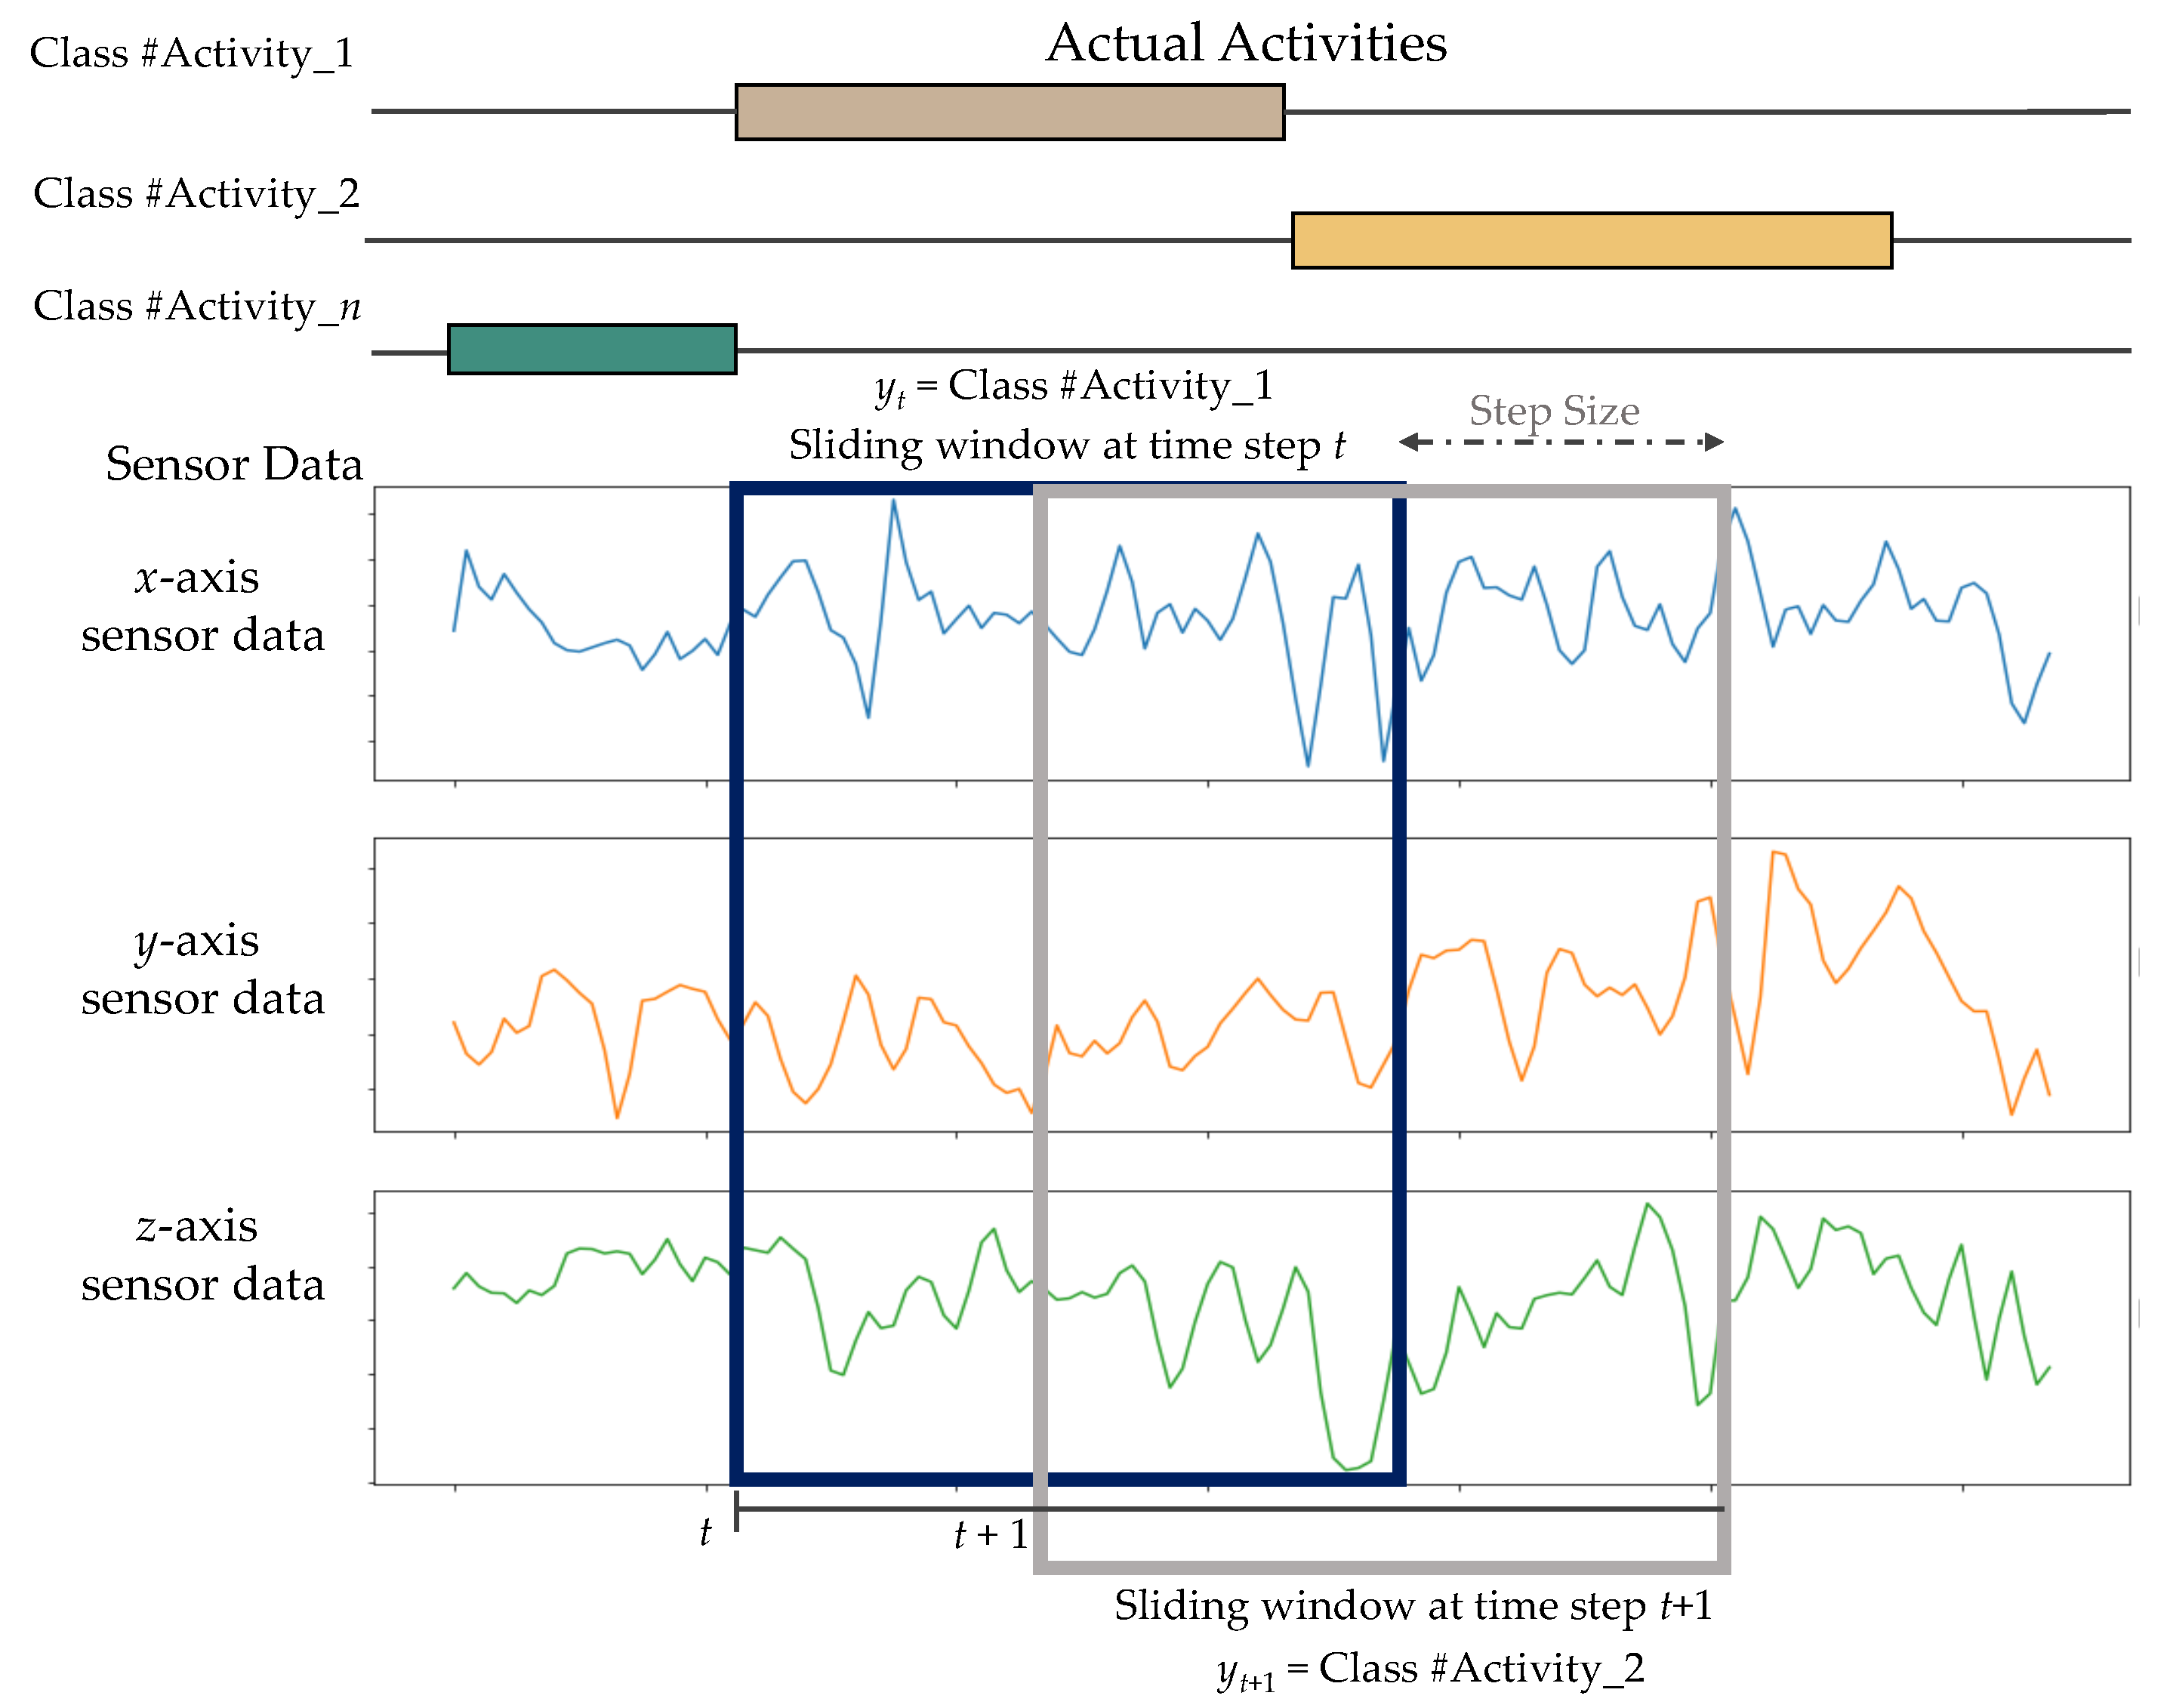
3.3.3. Data Segmentation

Due to the volume of signal information obtained by wearable sensors, it is impractical to incorporate all of the data into the HAR system at once. As a result, sliding window segmentation should be performed before feeding data into the model. The sliding window approach is widely employed in HAR for the detection of periodic actions (e.g., running, walking) and static actions (e.g., standing, sitting, and lying) [47]. The unprocessed sensor data are divided into fixed-length windows. A fraction of the neighboring windows overlaps to maximize the quantity of training data samples and prevent the loss of the transition from one activity to the next. Figure 4 illustrates the windowing procedure.
Figure 4. Fixed-length sliding window technique used in this work.
The sample data that is segmented by a sliding window with size N is a size of K × N . The sample W t is denoted as:
W t = a t 1 , a t 2 , , a t K R K × N
where column vector a t k = a t 1 k , a t 2 k , , a t N k is the signal data of sensor k at window time t, T is the transpose operator, K is the number of sensors and N is the length of the sliding window. To make use of window correlations and perform the training procedure, the window data is divided into the sequencing of windows:
S = W 1 , y 1 , W 2 , y 2 , , W T , y T
where T denotes the window sequence’s period, and y t represents the window’s matching action label of W. The most often occurring sample action will be used as the window’s label for windows with several activity classes.

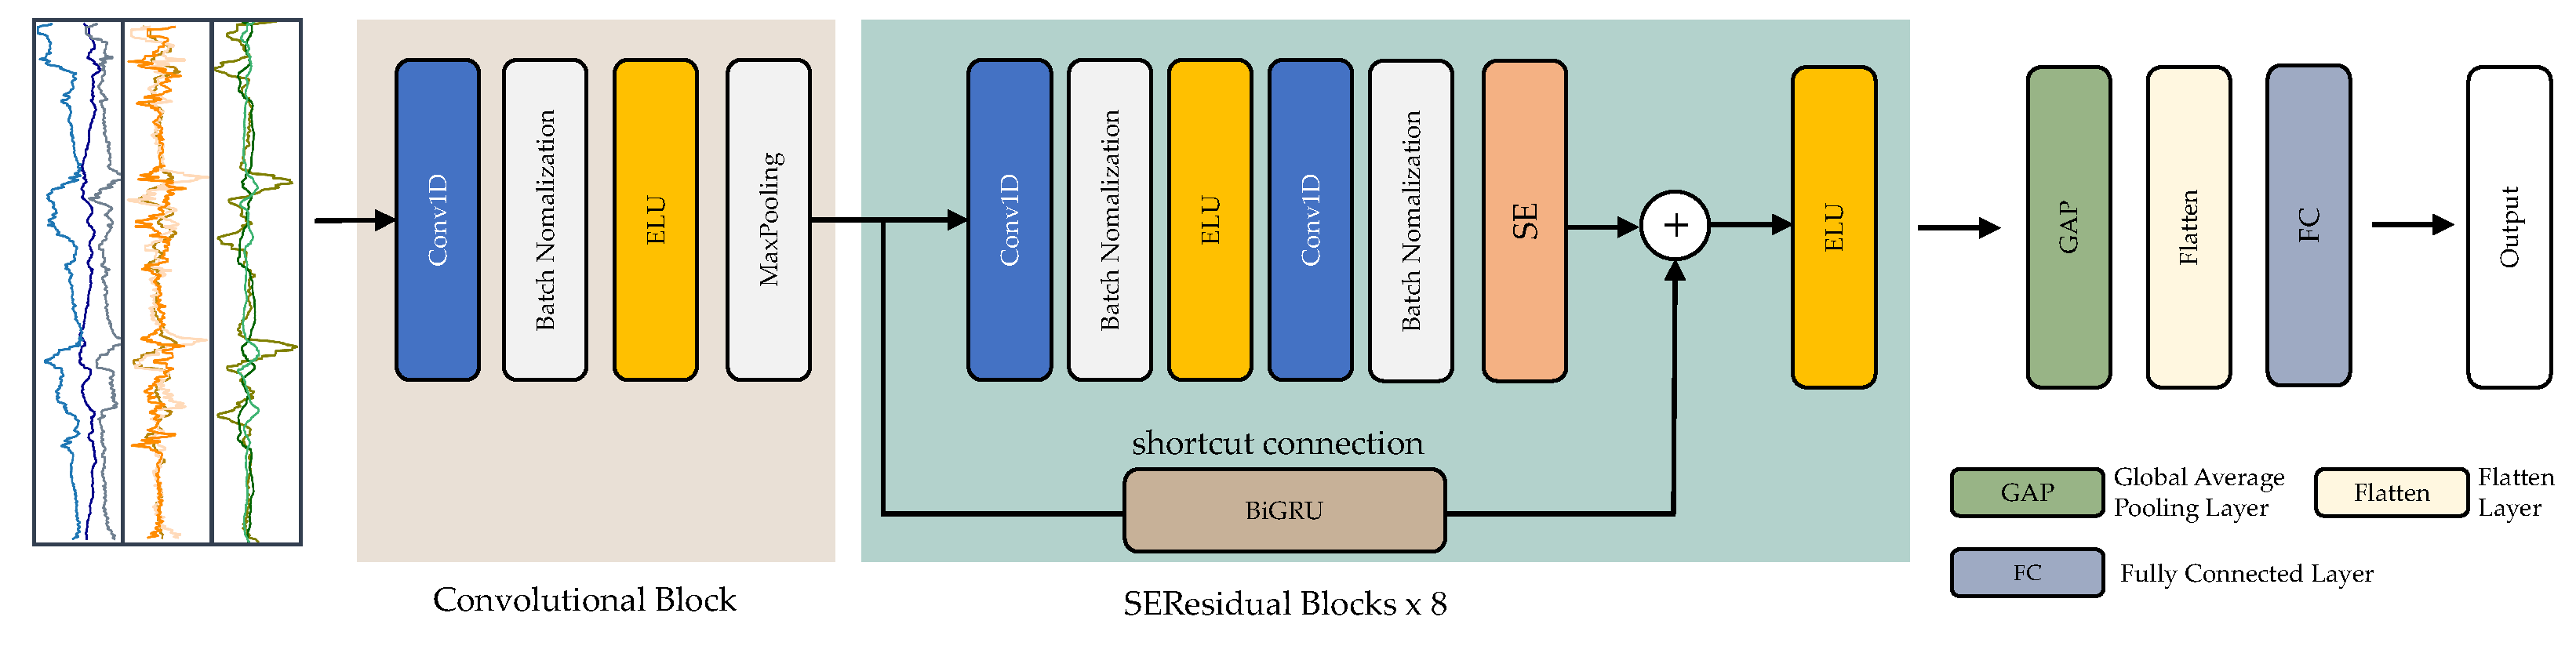
3.4. The Proposed SEResNet-BiGRU Model

In the proposed model, we develop an end-to-end deep-learning model as a form of hybrid deep residual architecture based on convolutional blocks and SE residual blocks. Figure 5 presents the overall architecture of the proposed model.
Figure 5. Detailed and unrolled architecture of the proposed SEResNet-BiGRU model.

3.4.1. Convolutional Block

A predefined set of elements is typically employed when a CNN is used. CNNs are often used in supervised learning. Typically, these neural networks link each neuron to every other neuron in the network’s succeeding layers. The neural network’s activation function converts the neurons’ input value to the output value. Two significant elements influence the effectiveness of the activation function. These include sparsity and the capacity of the neural network’s lower layers to tolerate the decreased gradient flow. CNNs frequently employ pooling as a technique for dimensionality reduction. Both the maximum and average pooling procedures are commonly utilized, known as max-pooling and average-pooling, respectively.
Convolutional blocks (ConvB) are utilized in this study to identify low-level characteristics from raw sensor data. As seen in Figure 5, ConvB comprise four layers: 1D-convolutional (Conv1D), batch normalization (BN), exponential linear unit (ELU), and max-pooling (MP). Multiple learnable convolutional kernels acquire distinct characteristics in the Conv1D, and each kernel produces a feature map. To stabilize and expedite the training phase, the BN layer was chosen. The ELU layer was utilized to boost the model’s expressive capability. The MP layer was used to compress the feature map while maintaining the most critical elements.

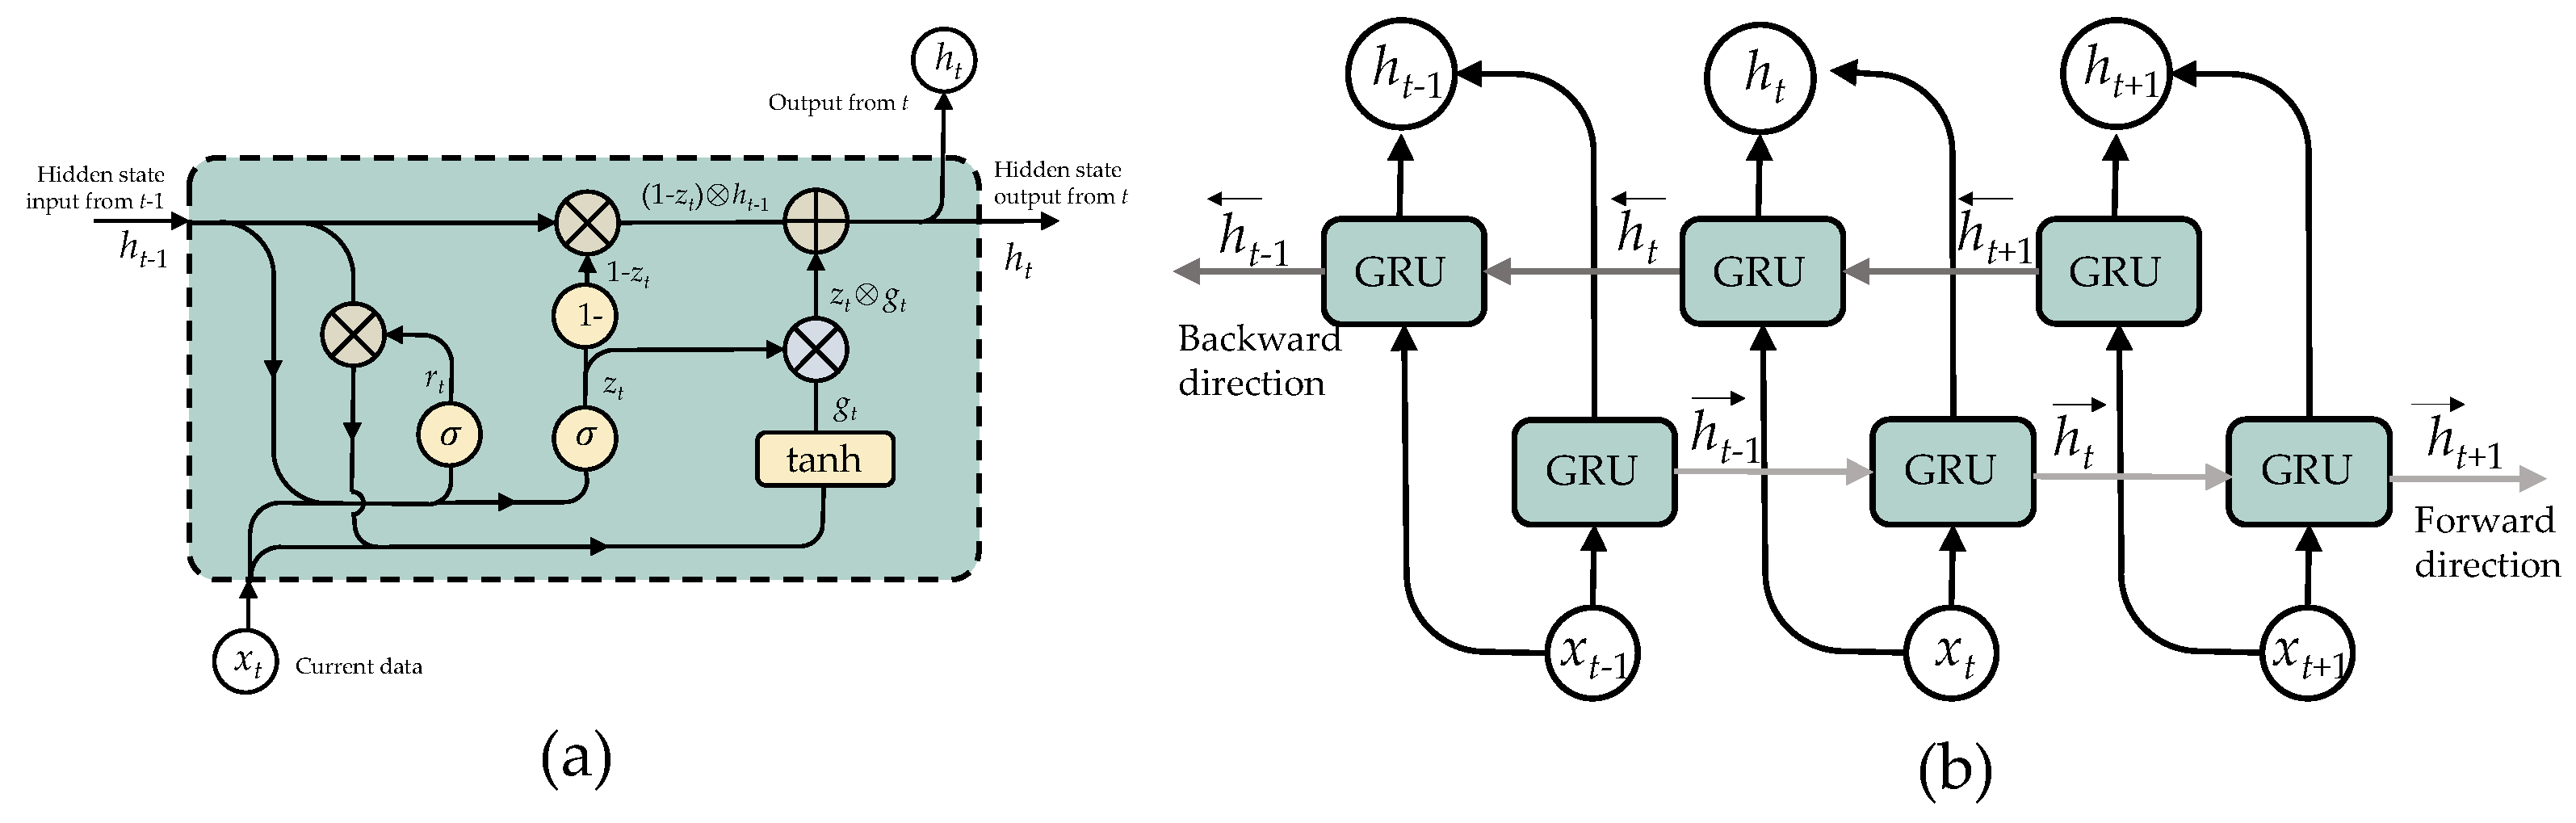
3.4.2. Structure of Gated Recurrent Unit

To alleviate the vanishing gradient issue, the Gate Recurrent Unit (GRU) was presented as a unique RNN-based paradigm; nevertheless, the memory cells in the design result in a memory capacity demand. The GRU is a simplified variation of the LSTM since it does not contain a distinct memory cell in its design [48]. A GRU network has an update and reset gate that manages the update level of each hidden state. It determines which data needs to be transferred to the next stage and which does not, as seen in Figure 6a. GRU gathers hidden state h t at time t from the output of the update gate z t , reset gate r t , current input x t , previous hidden state h t 1 is calculated as:
z t = σ ( W z x t U z h t 1 )
r t = σ ( W r x t U r h t 1 )
g t = t a n h ( W g x t U g ( r t h t 1 ) )
h t = ( ( 1 z t ) h t 1 ) ( z t g t )
where s is a sigmoid function and ⊕ is an elementary addition operation, and ⊗ is an elementary multiplication operation.
Figure 6. Structure of Bidirectional GRU (BiGRU): (a) GRU cell and (b) unroll BiGRU.
To address the limitations of a conventional (unidirectional) RNN, Schuster and Paliwal [49] created a bidirectional recurrent neural network (BiRNN) in 1997. Apart from the present input, the output incorporates past and future data at a given period. This is performed by concurrently training the network both forward and backward. To accomplish this, the neurons of a standard RNN are divided into two sections: one concerned with the forward direction and another for the backward direction. The positive neurons’ results are not related to the negative neurons’ results, and vice versa. This results in the overall structure depicted in Figure 6b. The following equations detail the computations required:
h t = G R U ( x t , h t 1 )
h t = G R U ( x t , h t + 1 )
h t = [ h t , h t ]

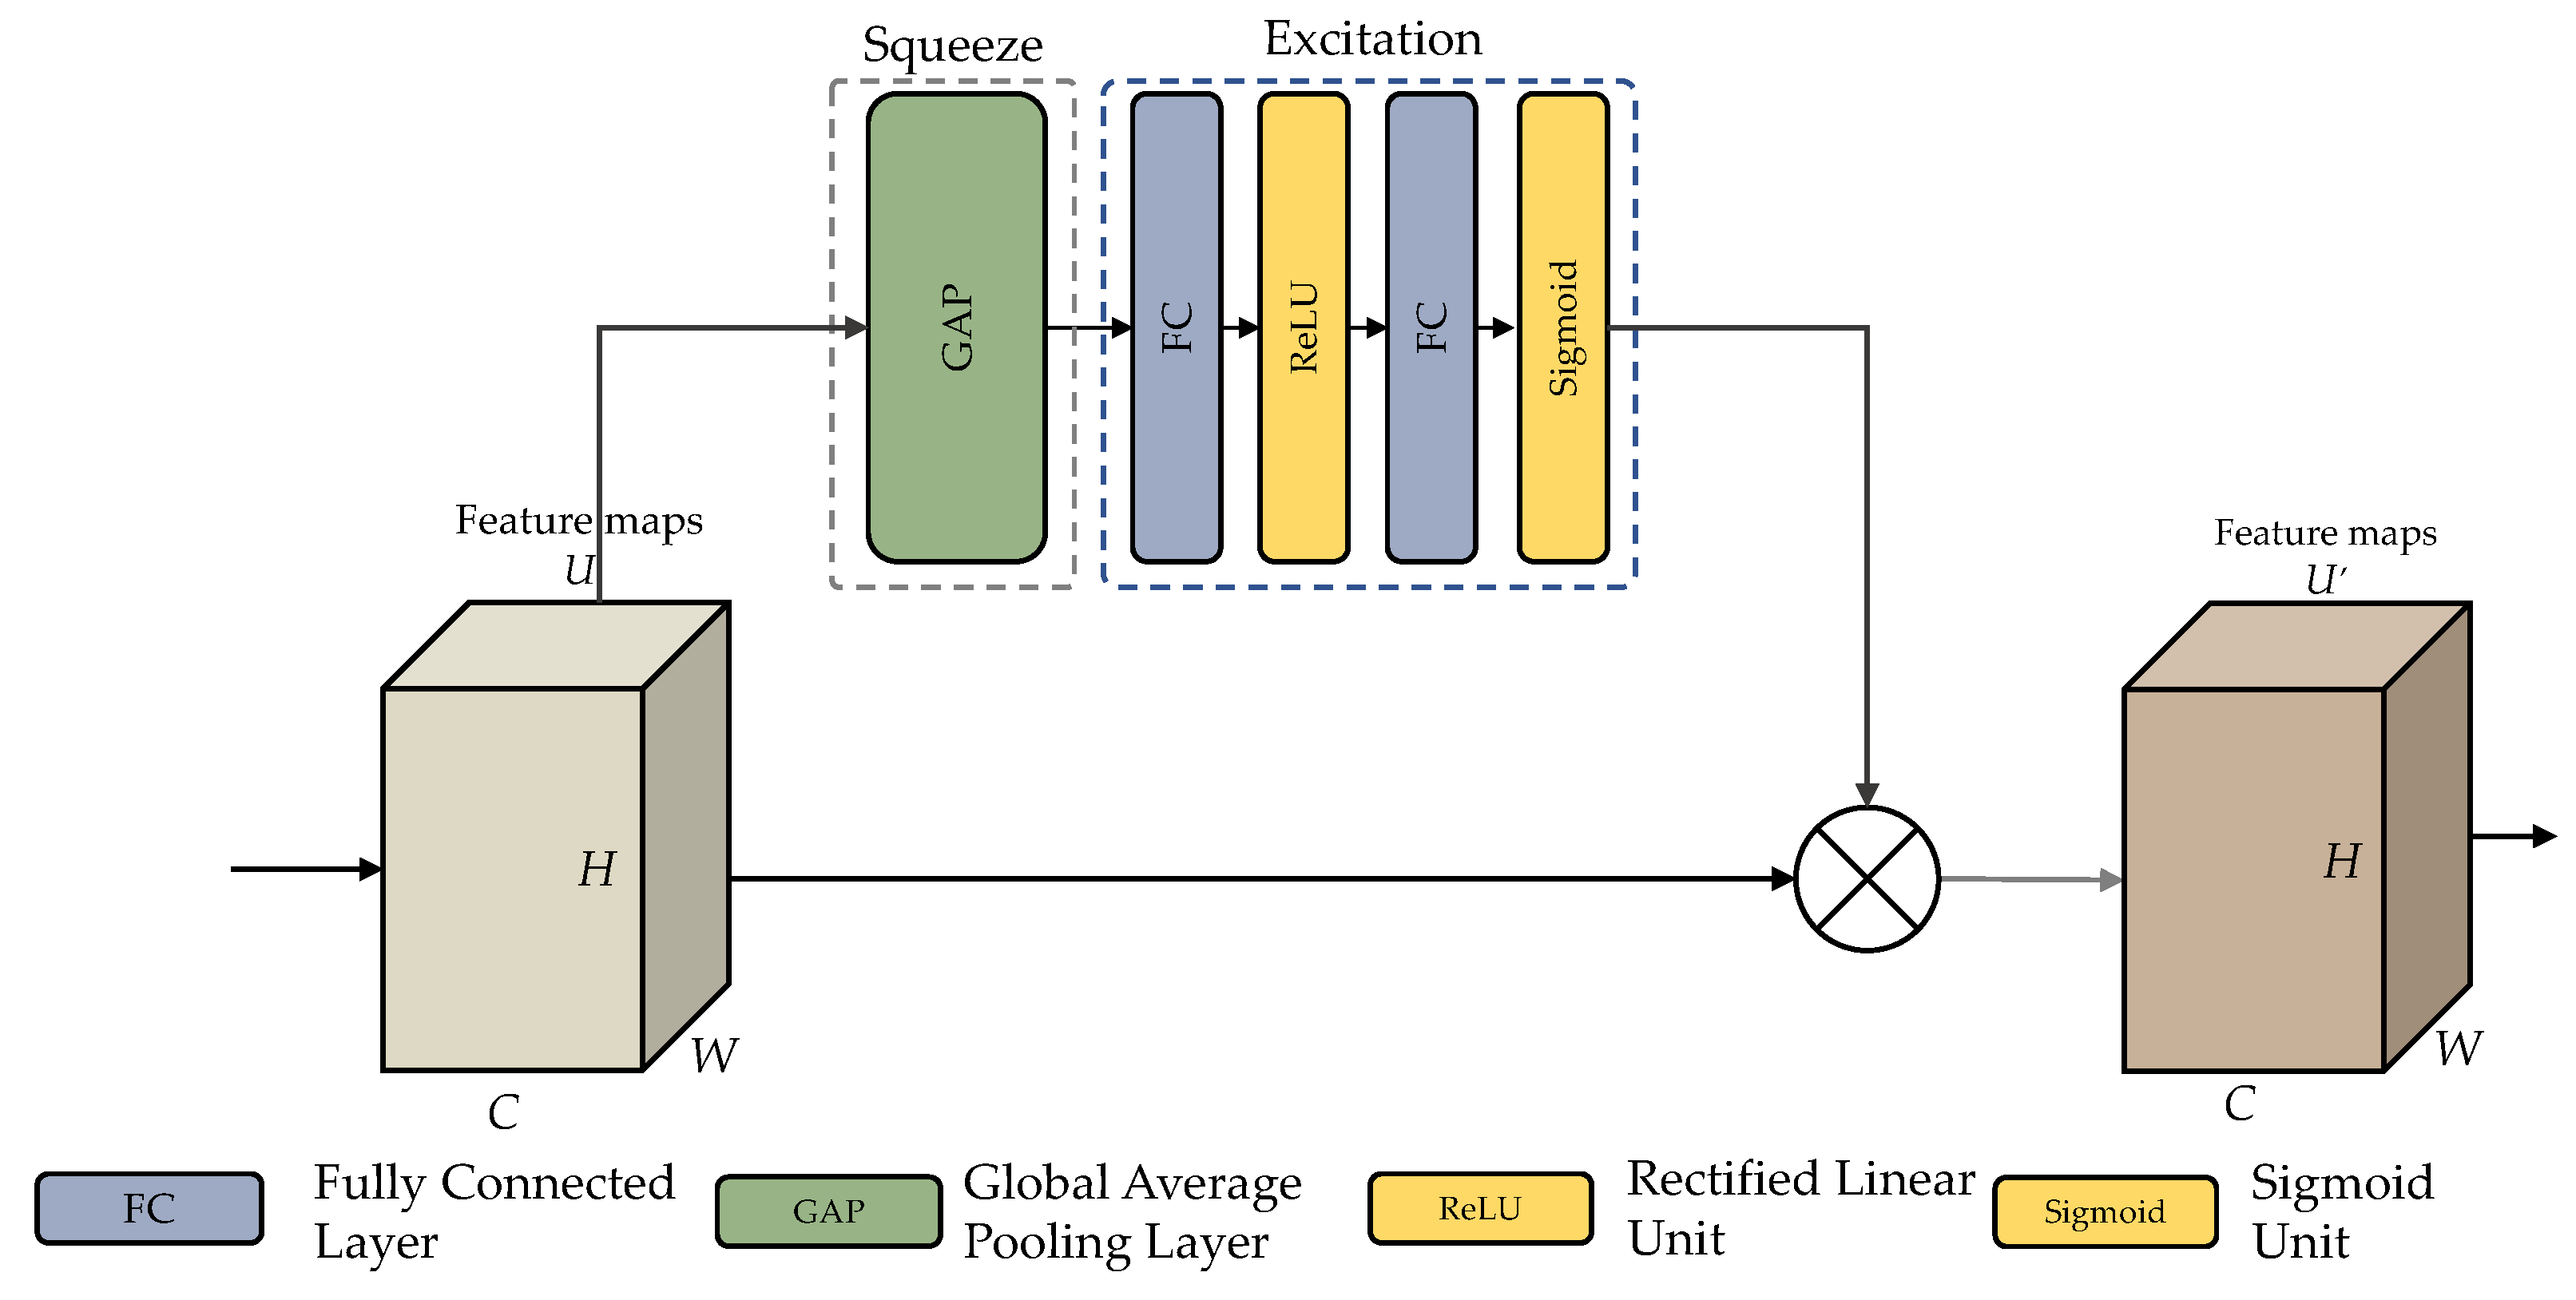
3.4.3. SEResidual Block

DL networks (LeNet, AlexNet, and VGGNet) frequently start with convolutional layers for detailed descriptions. They terminate with a fully-connected layer for categorization applications, which does not need to ignore connections. Sequential networks are architectures where each layer transmits data to the following layer. The complexity of disappearing or bursting gradients increases as the sequential network’s layer depth increases. To address this issue, the residual block in a ResNet enables the omission of interconnections between blocks of convolutional layers, improves gradient propagation, and enables the training of even deeper CNNs to avoid gradient vanishing concerns. The following formula could be used to represent a residual layer:
ELU ( x ) = x x 0 α × ( e x 1 ) x < 0
R ( x ) = ELU ( x + f ( x ) )
where f(x) represents the layer’s output, x represents the input, ELU(x) represents the exponential linear unit function and R(x) represents the output of the residual block. The residual component f(x) is provided in this block as two consecutive duplicates of three operations: convolution with a 3 × 1 filter, batch normalization, and ELU activation. Afterward, the feature map from f(x) is combined with the input x. Lastly, the combined features are processed to the ELU activation function.
In this study, we proposed the SEResidual block to retrieve hybrid features hierarchically by integrating spatio-temporal and channel-wise data [50]. As seen in Figure 5, this residual block was constructed of Conv1D layers, BN layers, ELU layers, SE components, and a direct connection to BiGRU. The SE modules were included to increase the recommended model’s representational capability in channel attention.
The architecture of an SE module is shown in Figure 7. Following the convolution procedure, many feature maps are obtained. Nevertheless, specific feature maps may include duplicated data. The SE module performs feature recalibration to improve significant features and disable less beneficial ones. This module is divided into two parts: squeeze and excitation stages.
Figure 7. Structure of the SE module.
Firstly, the squeeze stage excerpts all the data corresponding to their channels. The size C × H× W of the feature map U corresponding to one channel in U is H × W . Feature maps for each channel are squeezed into 1 × 1 feature maps employing a channel descriptor function, for example Global Average Pooling (GAP) [51]. This phase generates a scalar value, including global information about the channel. Equation (13) demonstrates the squeeze operation, where u c ( i , j ) signifies a feature map relating to channel c after X has gone through the convolution layer. The channel descriptor method F s q u e e z e was employed in this investigation, and GAP was included.
Z c = F s q u e e z e ( U c ) = 1 H × W i = 0 H j = 0 W U c ( i , j )
Then, during the excitation stage, the channel-wise dependencies are examined utilizing channel descriptors collected during the squeezing stage. This may be accomplished using fully-connected (FC) layers and non-linear functions. Equation (14) illustrates the excitation stage, where z is the squeezed value, W i is the ith FC layer, σ is the sigmoid function, and F e x c i t e is the excitation function. According to the sigmoid, the excitation step’s resulting value is 0 and 1. It can be utilized as a calibration factor. Excitation produces a new weight s, multiplied by the current feature map U. The SE module employed in this investigation is shown in Figure 7, along with the architecture of the squeeze and excitation stages inside the SE unit.
s = F e x c i t e ( z , W ) = σ ( g ( Z , W ) ) = σ ( W 2 R e L U ( W 1 z ) )
The last process reshapes the output U to deploy the activation to the side path network, where X = [ x 1 , x 2 , , x n ] . Where s n U n denotes the channel-by-channel multiplication of the scalar s n by the feature map. This procedure assigns adaptive weights to feature channels, the SE block’s concept [52].

3.5. Hyperparameters

In DL, the settings of hyperparameters are utilized to regulate the learning process. The proposed model makes use of the following hyperparameters: (1) epochs, (2) batch size, (3) learning rate, (4) optimization, and (5) loss function. To establish these hyperparameters, we specified the number of epochs to 200 and the batch size to 128. After 30 epochs, if no progress in the validation loss was seen, we implemented an early stopping call to bring the training process to an end. We began by setting the learning rate α to 0.001. After six subsequent epochs, we adjusted it to 75% of its original value if the suggested model validation accuracy did not increase. To reduce error, the Adam optimizer [53] was used with settings β 1 = 0.9, β 2 = 0.999, and ϵ = 1 × 10 8 . The optimizer uses the categorical cross-entropy function to determine the error. Cross-entropy surpasses other approaches, such as classification error and mean squared error [54].

3.6. Model Training and Performance Evaluation

3.6.1. Training

Following the specification of the modeling hyperparameters in the preceding section, the hybrid deep residual network was trained on the two datasets (HAPT and MobiAct v2.0). Instead of using a fixed train-test partition, we employed the five-fold cross-validation (CV) approach to evaluate the recommended model’s effectiveness. The five-fold CV procedure partitioned the whole dataset into five distinct, non-overlapping folds of equal size. It matched the models with four folds, leaving the new fold for interpretation measurement.

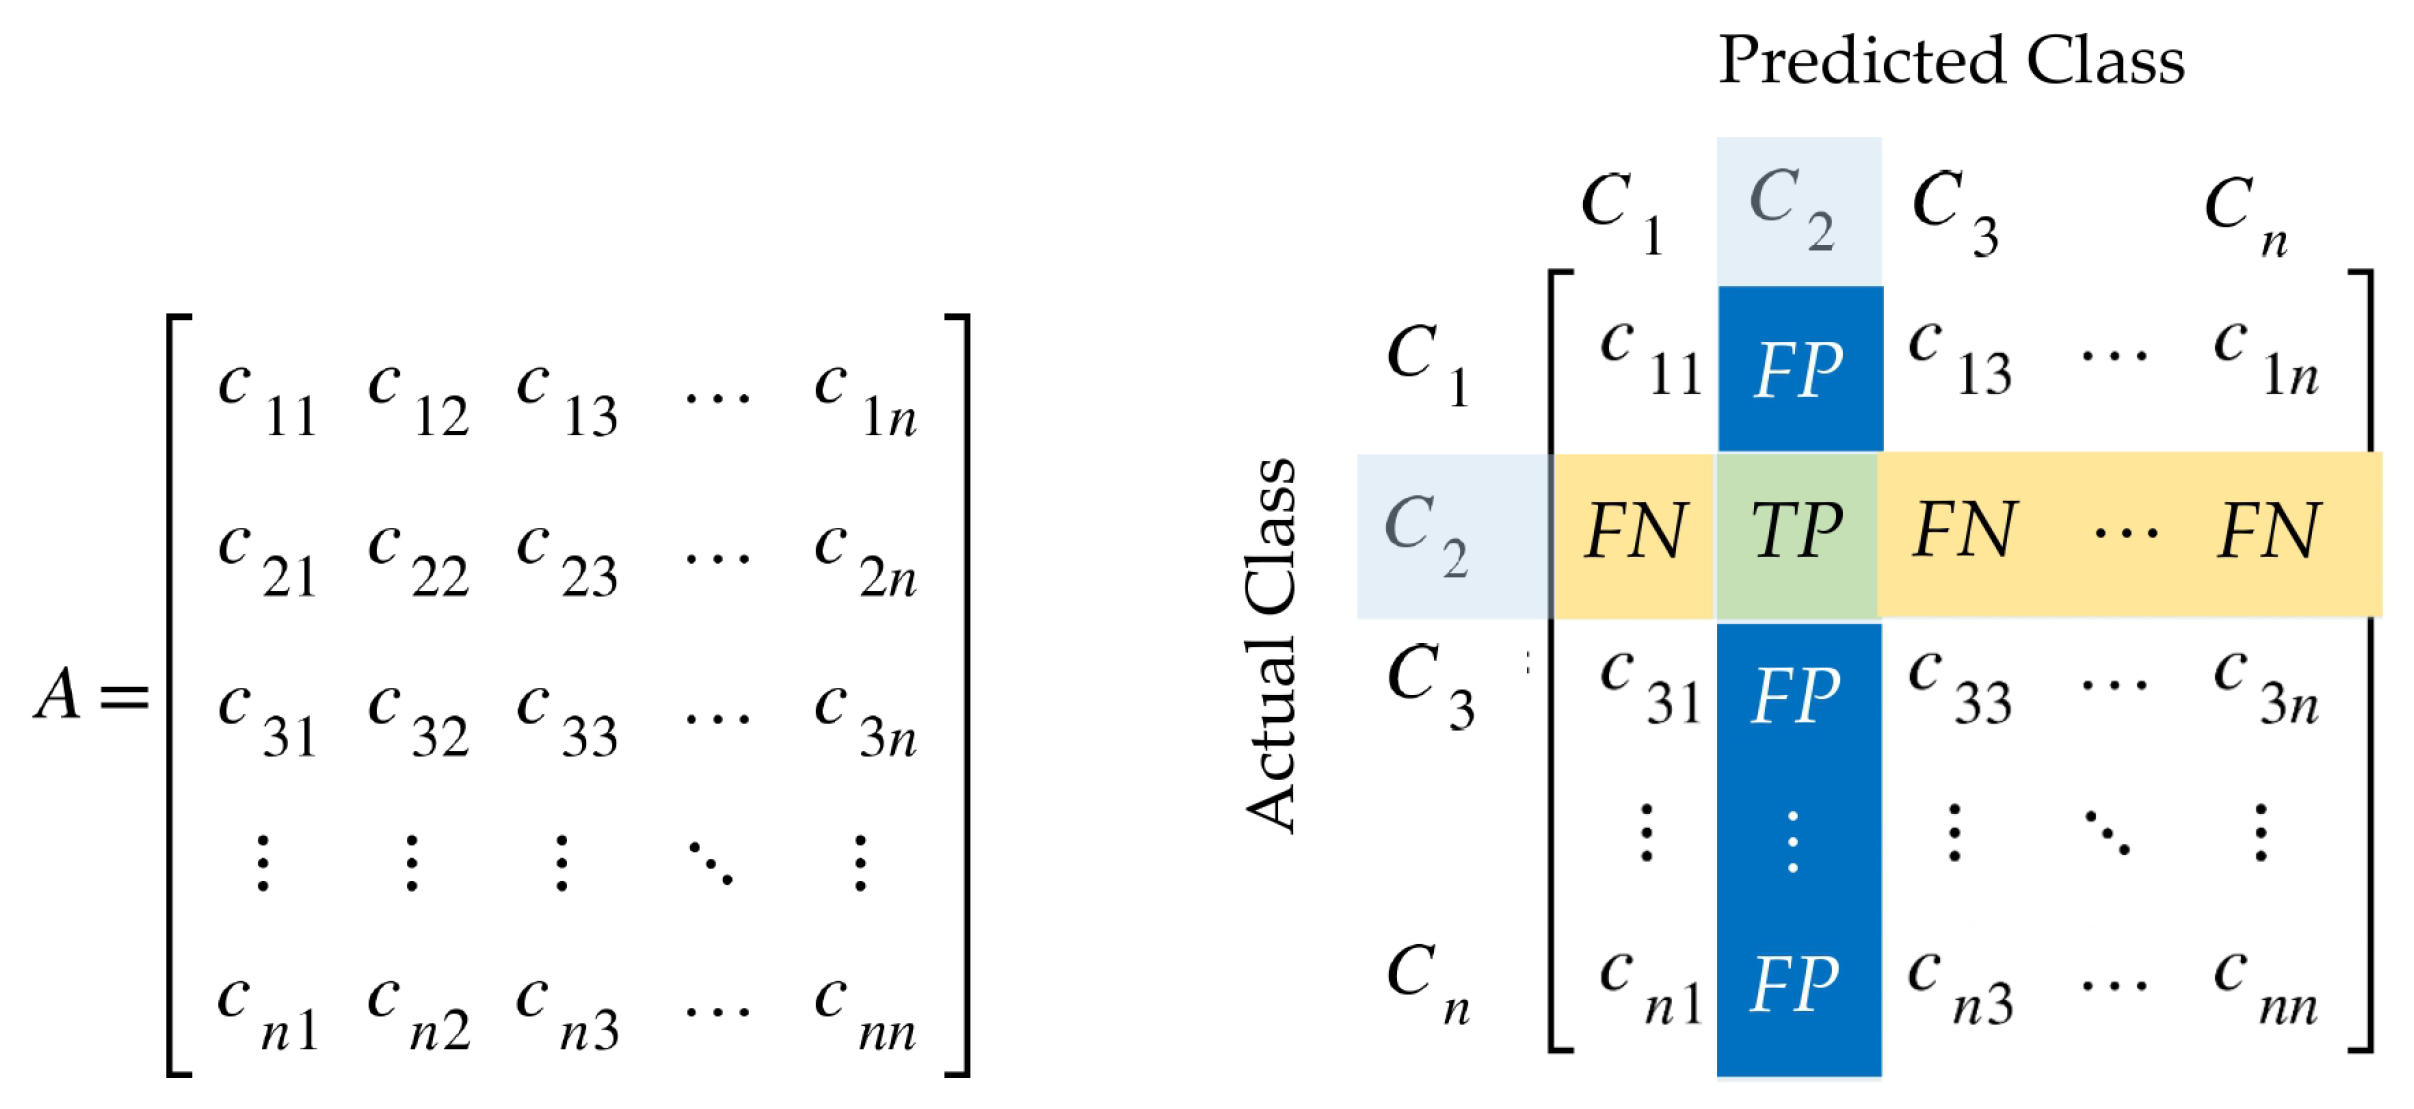
3.6.2. Evaluation Metrics

It is possible to classify transitional activities as a multi-class categorization. Accuracy and F1-score are commonly used measures for evaluating and comparing the efficiency of the proposed models. These performance indicators are derived using a confusion matrix to accurately determine the model’s ability to recognize transitional activities.
Given a multiclass classification issue using a collection A having n distinct class labels C i , ( i = 1 , 2 , 3 , , n ) represented by { C 1 , C 2 , C 3 , , C n } . For that situation, the confusion matrix is an n × n matrix, as seen in Figure 8. Each row of the matrix corresponds to an actual instance of a class, whereas each column corresponds to an anticipated instance of a class. At row i and column j, an element C i j of the confusion matrix specifies the number of cases for which the actual class is i and the signified class is j.
Figure 8. Confusion matrix for a multiclass classification problem.
True Positive ( T P ), False Positive ( F P ), True Negative ( T N ), and False Negative ( F N ) are all factors that can be extracted from the confusion matrix and used to determine performance measures. Given the label class C i , the following mathematical formulae are used to determine the metrics of T P i , F P i , F N i , and T N i .
T P ( C i ) = C i i
F P ( C i ) = l = 1 n C l i T P ( C i )
F N ( C i ) = l = 1 n C i l T P ( C i )
T N ( C i ) = l = 1 n k = 1 n C l k T P ( C i ) F P ( C i ) F N ( C i )
From Equations (15)–(18), we defined accuracy, precision, recall, and f1-score, for a multiclass confusion matrix as in Table 3.
Table 3. Performance metrics for a multiclass confusion matrix.

4. Experimental Results and Discussion

Subsections could be used to split this section. It should include a brief and accurate summary of the empirical evidence, assessment, and possible exploratory implications.

4.1. Experimental Setup

The tests in this research were performed using the Google Colab Pro+ platform. The Tesla V100-SXM2-16GB graphics processing unit (GPU) unit was operated to accelerate the training of the deep learning models. The suggested SEResNet-BiGRU model and other DL models were developed by Python using the TensorFlow backend (version 3.9.1) and CUDA (version 8.0.6). The GPU was utilized to accelerate the DL prototype training and testing.
We performed studies to demonstrate recognition interpretation using four deep residual models: ResNet, ResNetSE, ResNeXt, and the proposed SEResNet-BiGRU model. The ResNetSE model combines a ResNet-based model with an SE module in the shortcut connection. ResNeXt is a deep residual network that needs fewer hyperparameters than ordinary ResNet. This is achieved via their cardinality usage, a dimension added to the width and depth of ResNet [55].

4.2. Experimental Results

The purpose of this study was to examine the usage of S-HAR in conjunction with DL models to detect transitional behaviors. We utilized two HAR datasets, including fundamental and transitional actions, HAPT and MobiAct v2.0. Preprocessed accelerometer and gyroscope data were utilized for training and assessing the DL models using the five-fold cross-validation methodology. The average accuracy and Standard Deviation (SD) obtained from the experiments are considered to assess model performance. The experimental findings are exhibited as follows:
Following the specification of prototype hyperparameters in the preceding step, the hybrid deep residual network was trained on the two datasets (HAPT and MobiAct v2.0). Table 4 and Table 5 provide the exploratory outcomes.
Table 4. Recognition effectiveness of DL models on the HAPT dataset by using different sensor data.
Table 5. Recognition effectiveness of DL models on the MobiAct v2.0 dataset by using different sensor data.

4.3. Comparison of Results

To assess the proposed SEResNet-BiGRU model’s interpretation, we begin by comparing it to baseline classification models (CNN, LSTM, and BiGRU). Summary hyperparameters of all models conducted in this study are described in Appendix A. Table 6 summarizes the experiment’s findings. SEResNet-BiGRU outperforms other models with an overall accuracy of 98.03% and 98.92% on the HAPT and MobiAct v2.0 datasets, respectively. These findings demonstrate that the SEResNet-BiGRU combination outperforms the transitional HAR issues.
Table 6. Experimental findings of different DL models.

4.4. Comparison of Results with Previous Works

The SEResNet-BiGRU model is compared against state-of-the-art DL approaches in the scope of S-HAR. In Table 7, two conventional machine learning approaches (SVM and KNN) and three hybrid DL approaches are compared to the proposed SEResNet-BiGRU network: LSTM-CNN [56], Inno-HAR [25], and HiHAR [40]. Five applicable models are applied in this section based on the descriptions provided in the related articles. The findings reveal that DL techniques surpass conventional machine learning methods significantly in overall accuracy. The proposed SEResNet-BiGRU model obtained the highest performance on both datasets, with 98.03% and 98.92%, respectively, nearly 2% higher than the prior analyses’ hybrid DL models. These findings support our hypothesis that the local spatio-temporal and long-term context variables retrieved by our hybrid DL model provide a complete interpretation of sensor data, consequently increasing classification accuracy. The findings imply that deep residual models operate satisfactorily on raw signals. Nonetheless, SE and BiGRU modules enhance HAR effectiveness for transitional activity recognition.
Table 7. Comparison results of the proposed model and previous works.

4.5. Effect of SE and BiGRU Modules

We achieved additional investigations to explore SE modules and BiGRU modules in the SEResidual blocks of the proposed model. As shown in Table 8, both the SE module and BiGRU module can enhance the effectiveness of the recognition on the two standard datasets.
Table 8. Comparison results of ResNet-based models with or without the SE and BiGRU modules.
Due to the SE and BiGRU modules, the proposed SEResNet-BiGRU model has superior overall effectiveness. The complexity of a model is compared to the mean prediction time to determine the model’s efficiency. A collection of test data samples is fed into the Tensorflow Lite models, and the mean prediction time is calculated from this data due to this process. Table 9 compares the mean prediction times.
Table 9. Comparison of mean prediction times obtained from ResNet-based models with or without the SE and BiGRU modules.
Table 9 shows the results of this experiment with the mean prediction time in seconds to process one window of the deep learning models performing on the two datasets (HAPT and MobiAct v2.0). The comparative results show that the mean prediction times vary by added SE and BiGRU modules, and it was noticed that the BiGRU modules need more computational time than the SE module. The proposed SEResNet-BiGRU model shows the mean prediction time is 1.3208 ms. and 2.0047 ms. for HAPT and MobiAct v2.0, respectively.

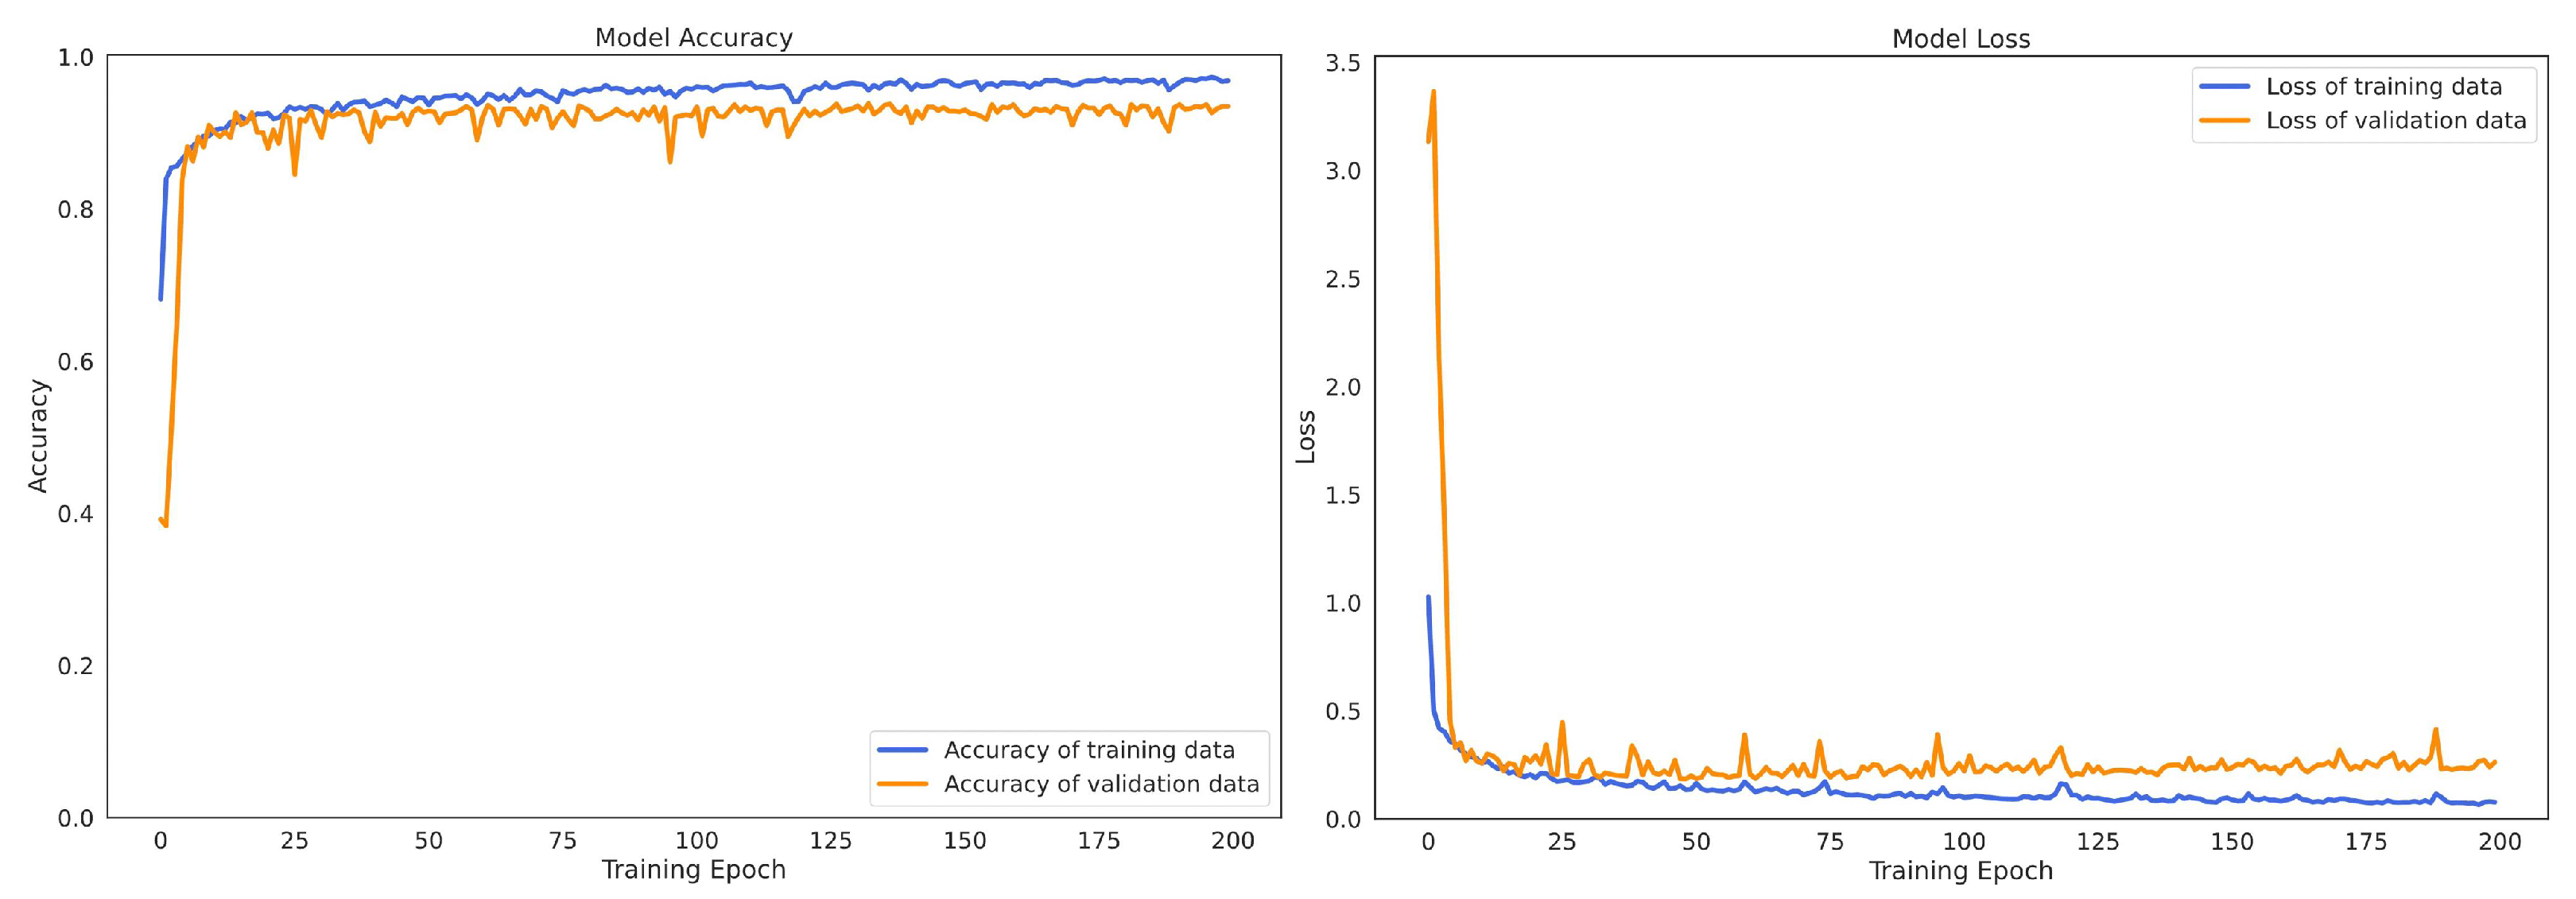
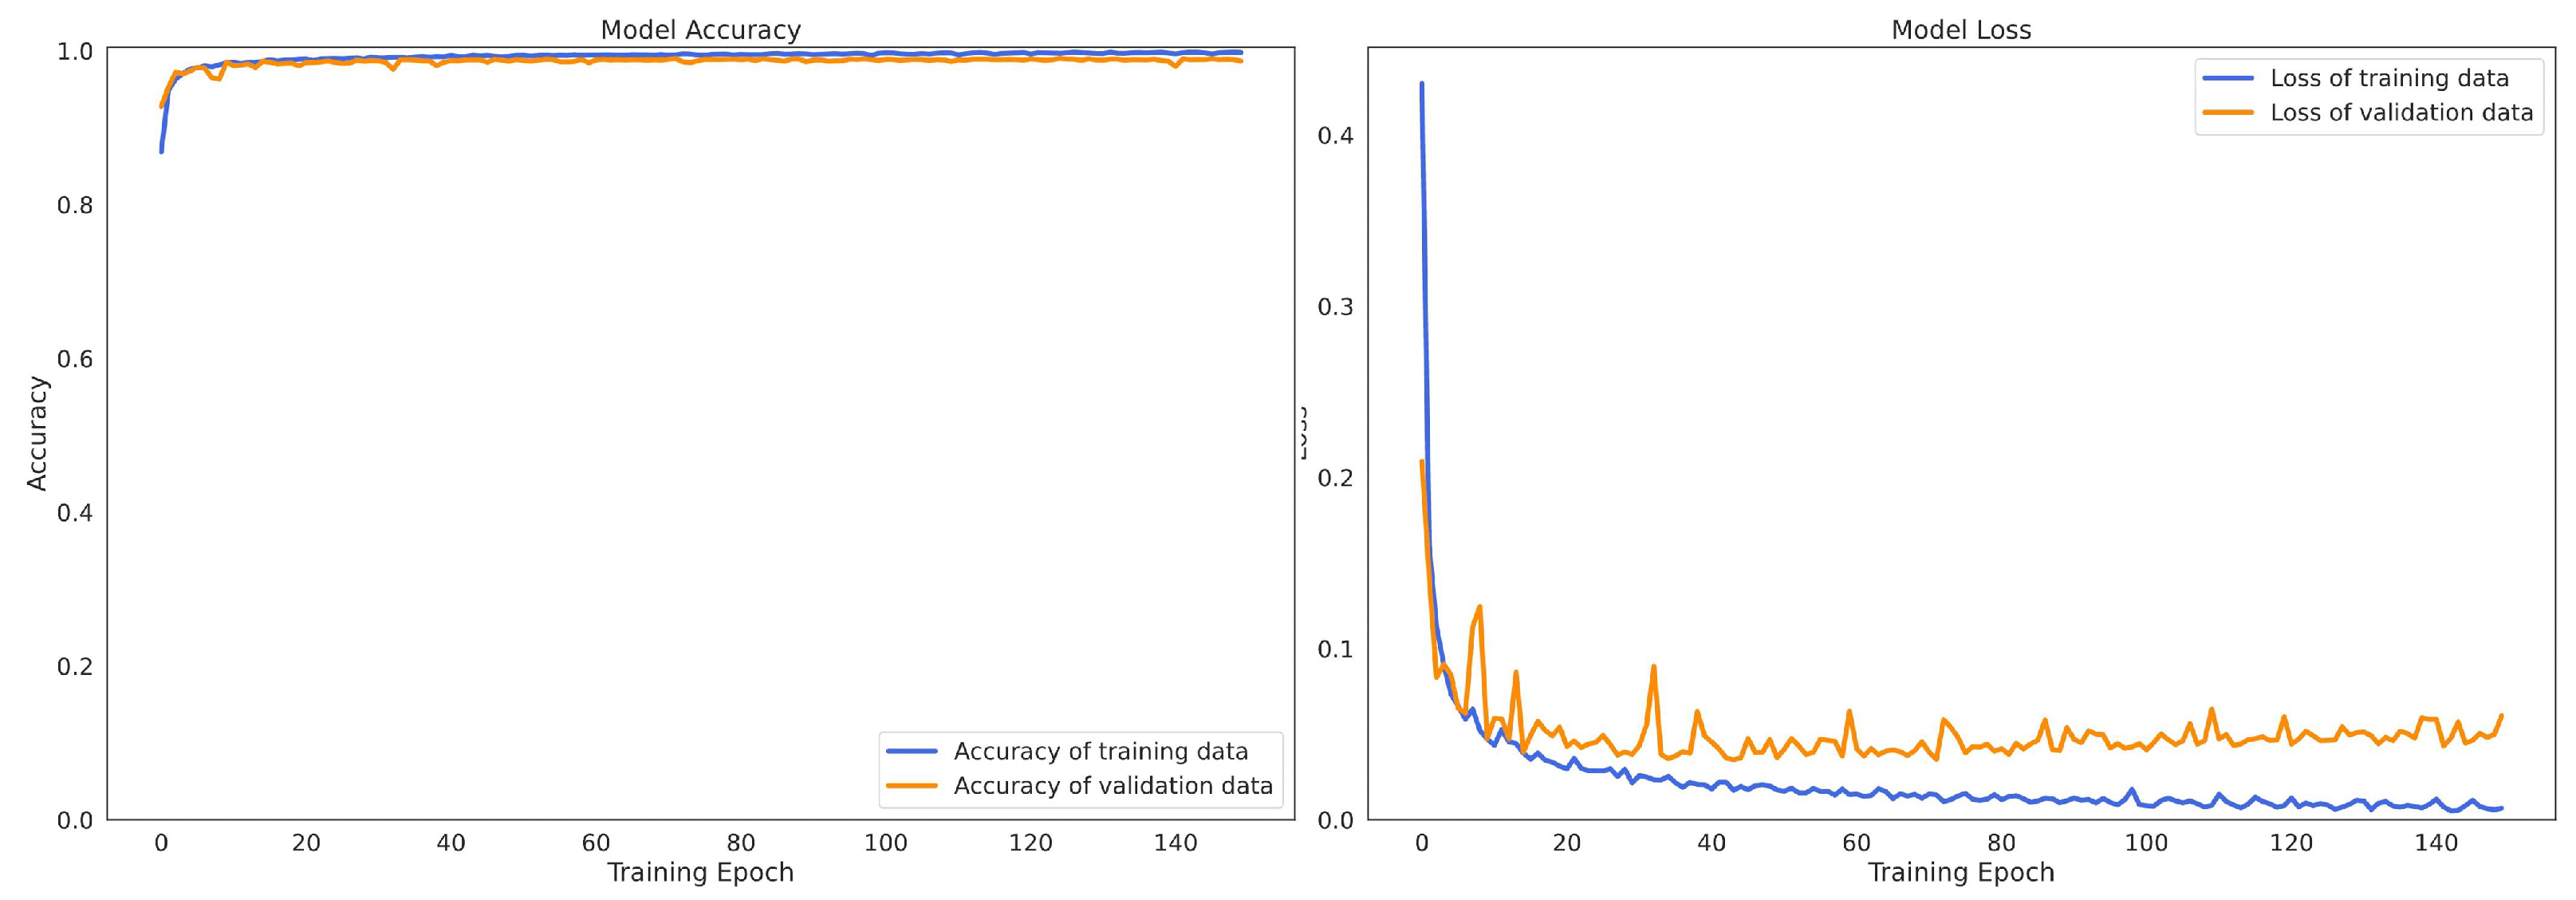
4.6. Convergence Process

Figure 9 and Figure 10 describe the convergence processes of the proposed SEResNet-BiGRU model on HAPT and MobiAct v2.0, respectively. The loss rate of the proposed model (figures on the right side) decreased gradually, and the accuracy rate increased smoothly without any appearance of dilemma. These findings demonstrate that the SEResNet-BiGRU model learns correctly and without any overfitting problems.
Figure 9. The change of model accuracy and loss in the training and validation data of the SEResNet-BiGRU on HAPT dataset.
Figure 10. The change of model accuracy and loss in the training and validation data of the SEResNet-BiGRU on MobiAct v2.0 dataset.

5. Conclusions and Future Works

This research aimed to investigate the recognition of transitional activities using DL and to develop the HAR model using a hybrid deep residual network. The proposed HAR model, named the SEResNet-BiGRU model, initially learns hybrid spatial features from raw sensor data via a convolutional block, and then learns spatio-temporal features via SEResidual blocks composed of an SE module in the main path and a BiGRU in the parallel path of the connection.
Physical activities identified in this article comprised everyday fundamental activities and transitional activities gathered from two benchmark datasets (HAPT and MobiAct v2.0). According to the experimental findings, the suggested hybrid model outperformed other models in the HAR challenge (98.03% for the HAPT dataset and 98.92% for the MobiAct v2.0 dataset). Additionally, we evaluated the suggested model in comparison to previously published models for the same transitional HAR problem. The comparison findings demonstrate that the SEResNet-BiGRU model outperforms all prior models.
Nevertheless, in the situation of the MobiAct scenario dataset, one constraint of the proposed model is visible. Because the smartphone is held on an arbitrary side of the pants and in an arbitrary orientation, there are certain instances in which the model cannot distinguish between walking, walking upstairs, and walking downstairs. In both datasets, transition classes are sometimes misclassified concerning their associated static postures. There is no precise border between the prior posture, the transition, and the subsequent posture, which creates the issue of many activities occurring inside the same data window.
In future studies, we will emphasize the generalization of our proposed model by incorporating additional data segmentation techniques to address the constraints: for instance, event-defined window strategies which require preprocessing to identify specific events that are then used to specify successive data partitioning, and activity-defined window strategies, which partition data based on activity adjustments.

Author Contributions

Conceptualization and model analysis, S.M.; resource, N.H.; data curation, A.J.; methodology, S.M.; validation, N.H.; data visualization and graphic improvement, A.J.; discussion and final editing, S.M.; writing—review and editing, S.M.; funding acquisition, A.J. and S.M. All authors have read and agreed to the published version of the manuscript.

Funding

This research project was supported by University of Phayao (Grant No. FF65-RIM041), Thailand Science Research and Innovation Fund, National Science, Research and Innovation Fund (NSRF), and King Mongkut’s University of Technology North Bangkok with Contract no. KMUTNB-FF-65-27.

Institutional Review Board Statement

Not applicable.

Data Availability Statement

Not applicable.

Conflicts of Interest

The authors declare no conflict of interest.

Appendix A. The Summary of Hyperparameters

Table A1. The summary of hyperparameters for the CNN network used in this work.
StageHyperparametersValues
Architecture1D-ConvolutionKernel Size5
Stride1
Filters64
Dropout 0.25
Max Pooling 2
Flatten -
TrainingLoss Function Cross-entropy
Optimizer Adam
Batch Size 64
Number of Epochs 200
Table A2. The summary of hyperparameters for the LSTM network used in this work.
StageHyperparametersValues
ArchitectureLSTM Unit128
Dropout0.25
Dense128
TrainingLoss FunctionCross-entropy
OptimizerAdam
Batch Size64
Number of Epochs200
Table A3. The summary of hyperparameters for the BiGRU network used in this work.
StageHyperparametersValues
ArchitectureBiGRU Unit128
Dropout0.25
Dense128
TrainingLoss FunctionCross-entropy
OptimizerAdam
Batch Size64
Number of Epochs200
Table A4. The summary of hyperparameters for the SEResNet-BiGRU network used in this work.
StageHyperparametersValues
ArchitectureConvolutional Block
1D-ConvolutionKernel Size5
Stride1
Filters64
Batch Normalization -
Activation ELU
Max Pooling 2
SE-ResNet Block × 8
(Main Path)
1D-ConvolutionKernel Size5
Stride1
Filters32
Batch Normalization -
Activation ELU
1D-ConvolutionKernel Size5
Stride1
Filters64
Batch Normalization -
SE Module -
(Parallel Path)
BiGRU Unit 128
Global Average Pooling -
Flatten -
Dense 128
TrainingLoss Function Cross-entropy
Optimizer Adam
Batch Size 64
Number of Epochs 200

References

  1. Qi, J.; Yang, P.; Hanneghan, M.; Tang, S.; Zhou, B. A Hybrid Hierarchical Framework for Gym Physical Activity Recognition and Measurement Using Wearable Sensors. IEEE Internet Things J. 2019, 6, 1384–1393. [Google Scholar] [CrossRef] [Green Version]
  2. Asghari, P.; Soleimani, E.; Nazerfard, E. Online human activity recognition employing hierarchical hidden Markov models. J. Ambient. Intell. Humaniz. Comput. 2020, 11, 1141–1152. [Google Scholar] [CrossRef] [Green Version]
  3. Minh Dang, L.; Min, K.; Wang, H.; Jalil Piran, M.; Hee Lee, C.; Moon, H. Sensor-based and vision-based human activity recognition: A comprehensive survey. Pattern Recognit. 2020, 108, 107561. [Google Scholar] [CrossRef]
  4. Wei, Z.; Nie, J.; Huang, L.; Wang, S.; Li, Z. A Review on Human Activity Recognition Using Vision-Based Method. J. Healthc. Eng. 2017, 2017, 3090343. [Google Scholar] [CrossRef]
  5. Casale, P.; Pujol, O.; Radeva, P. Human Activity Recognition from Accelerometer Data Using a Wearable Device. In Proceedings of the Pattern Recognition and Image Analysis; Vitrià, J., Sanches, J.M., Hernández, M., Eds.; Springer: Berlin/Heidelberg, Germany, 2011; pp. 289–296. [Google Scholar]
  6. Romaissa, B.; Nini, B.; Sabokrou, M.; Hadid, A. Vision-based human activity recognition: A survey. Multimed. Tools Appl. 2020, 79, 30509–30555. [Google Scholar] [CrossRef]
  7. Li, J.H.; Tian, L.; Wang, H.; An, Y.; Wang, K.; Yu, L. Segmentation and Recognition of Basic and Transitional Activities for Continuous Physical Human Activity. IEEE Access 2019, 7, 42565–42576. [Google Scholar] [CrossRef]
  8. Ferreira, P.J.S.; Cardoso, J.M.P.; Mendes-Moreira, J. kNN Prototyping Schemes for Embedded Human Activity Recognition with Online Learning. Computers 2020, 9, 96. [Google Scholar] [CrossRef]
  9. Palaniappan, A.; Bhargavi, R.; Vaidehi, V. Abnormal human activity recognition using SVM based approach. In Proceedings of the 2012 International Conference on Recent Trends in Information Technology, Chennai, India, 19–21 April 2012; pp. 97–102. [Google Scholar] [CrossRef]
  10. Fan, L.; Wang, Z.; Wang, H. Human Activity Recognition Model Based on Decision Tree. In Proceedings of the 2013 International Conference on Advanced Cloud and Big Data, Nanjing, China, 13–15 December 2013; pp. 64–68. [Google Scholar] [CrossRef]
  11. Nurwulan, N.; Selamaj, G. Random Forest for Human Daily Activity Recognition. J. Phys. Conf. Ser. 2020, 1655, 012087. [Google Scholar] [CrossRef]
  12. Cheng, L.; Guan, Y.; Zhu, K.; Li, Y. Recognition of human activities using machine learning methods with wearable sensors. In Proceedings of the 2017 IEEE 7th Annual Computing and Communication Workshop and Conference (CCWC), Las Vegas, NV, USA, 9–11 January 2017; pp. 1–7. [Google Scholar] [CrossRef]
  13. Mekruksavanich, S.; Jitpattanakul, A. Deep Residual Network for Smartwatch-Based User Identification through Complex Hand Movements. Sensors 2022, 22, 3094. [Google Scholar] [CrossRef]
  14. Mekruksavanich, S.; Jitpattanakul, A. Deep Convolutional Neural Network with RNNs for Complex Activity Recognition Using Wrist-Worn Wearable Sensor Data. Electronics 2021, 10, 1685. [Google Scholar] [CrossRef]
  15. Li, W.; Liu, X.; Liu, J.; Chen, P.; Wan, S.; Cui, X. On Improving the accuracy with Auto-Encoder on Conjunctivitis. Appl. Soft Comput. 2019, 81, 105489. [Google Scholar] [CrossRef]
  16. Mekruksavanich, S.; Jitpattanakul, A. LSTM Networks Using Smartphone Data for Sensor-Based Human Activity Recognition in Smart Homes. Sensors 2021, 21, 1636. [Google Scholar] [CrossRef] [PubMed]
  17. Wang, J. Analysis and design of a recurrent neural network for linear programming. IEEE Trans. Circuits Syst. Fundam. Theory Appl. 1993, 40, 613–618. [Google Scholar] [CrossRef]
  18. Albawi, S.; Mohammed, T.A.; Al-Zawi, S. Understanding of a convolutional neural network. In Proceedings of the 2017 International Conference on Engineering and Technology (ICET), Antalya, Turkey, 21–23 August 2017; pp. 1–6. [Google Scholar] [CrossRef]
  19. Greff, K.; Srivastava, R.K.; Koutník, J.; Steunebrink, B.R.; Schmidhuber, J. LSTM: A Search Space Odyssey. IEEE Trans. Neural Netw. Learn. Syst. 2017, 28, 2222–2232. [Google Scholar] [CrossRef] [PubMed] [Green Version]
  20. Michaelis, J.R.; Rupp, M.A.; Kozachuk, J.; Ho, B.; Zapata-Ocampo, D.; McConnell, D.S.; Smither, J.A. Describing the User Experience of Wearable Fitness Technology through Online Product Reviews. Proc. Hum. Factors Ergon. Soc. Annu. Meet. 2016, 60, 1073–1077. [Google Scholar] [CrossRef]
  21. Wan, S.; Qi, L.; Xu, X.; Tong, C.; Gu, Z. Deep Learning Models for Real-time Human Activity Recognition with Smartphones. Mob. Netw. Appl. 2020, 25, 743–755. [Google Scholar] [CrossRef]
  22. Zhou, X.; Liang, W.; Wang, K.I.K.; Wang, H.; Yang, L.T.; Jin, Q. Deep-Learning-Enhanced Human Activity Recognition for Internet of Healthcare Things. IEEE Internet Things J. 2020, 7, 6429–6438. [Google Scholar] [CrossRef]
  23. Chen, Z.; Zhang, L.; Jiang, C.; Cao, Z.; Cui, W. WiFi CSI Based Passive Human Activity Recognition Using Attention Based BLSTM. IEEE Trans. Mob. Comput. 2019, 18, 2714–2724. [Google Scholar] [CrossRef]
  24. Zhu, Q.; Chen, Z.; Soh, Y.C. A Novel Semisupervised Deep Learning Method for Human Activity Recognition. IEEE Trans. Ind. Inform. 2019, 15, 3821–3830. [Google Scholar] [CrossRef]
  25. Xu, C.; Chai, D.; He, J.; Zhang, X.; Duan, S. InnoHAR: A Deep Neural Network for Complex Human Activity Recognition. IEEE Access 2019, 7, 9893–9902. [Google Scholar] [CrossRef]
  26. Lara, O.D.; Labrador, M.A. A Survey on Human Activity Recognition using Wearable Sensors. IEEE Commun. Surv. Tutor. 2013, 15, 1192–1209. [Google Scholar] [CrossRef]
  27. Moufawad el Achkar, C.; Lenbole-Hoskovec, C.; Paraschiv-Ionescu, A.; Major, K.; Büla, C.; Aminian, K. Classification and characterization of postural transitions using instrumented shoes. Med. Biol. Eng. Comput. 2018, 56, 1403–1412. [Google Scholar] [CrossRef] [PubMed]
  28. Acampora, G.; Minopoli, G.; Musella, F.; Staffa, M. Classification of Transition Human Activities in IoT Environments via Memory-Based Neural Networks. Electronics 2020, 9, 409. [Google Scholar] [CrossRef] [Green Version]
  29. Uddin, M.T.; Billah, M.M.; Hossain, M.F. Random forests based recognition of human activities and postural transitions on smartphone. In Proceedings of the 2016 5th International Conference on Informatics, Electronics and Vision (ICIEV), Dhaka, Bangladesh, 13–14 May 2016; pp. 250–255. [Google Scholar] [CrossRef]
  30. Noor, M.H.M.; Salcic, Z.; Wang, K.I.K. Adaptive sliding window segmentation for physical activity recognition using a single tri-axial accelerometer. Pervasive Mob. Comput. 2017, 38, 41–59. [Google Scholar] [CrossRef]
  31. Reyes-Ortiz, J.L.; Oneto, L.; Samà, A.; Parra, X.; Anguita, D. Transition-Aware Human Activity Recognition Using Smartphones. Neurocomputing 2016, 171, 754–767. [Google Scholar] [CrossRef] [Green Version]
  32. Kozina, S.; Gjoreski, H.; Gams, M.; Lustrek, M. Three-layer Activity Recognition Combining Domain Knowledge and Meta- classification Author list. J. Med. Biol. Eng. 2013, 33, 406–414. [Google Scholar] [CrossRef]
  33. Gupta, P.; Dallas, T. Feature Selection and Activity Recognition System Using a Single Triaxial Accelerometer. IEEE Trans. Biomed. Eng. 2014, 61, 1780–1786. [Google Scholar] [CrossRef]
  34. Liu, K.C.; Hsieh, C.Y.; Chan, C.T. Transition-Aware Housekeeping Task Monitoring Using Single Wrist-Worn Sensor. IEEE Sens. J. 2018, 18, 8950–8962. [Google Scholar] [CrossRef]
  35. Hassan, M.M.; Uddin, M.Z.; Mohamed, A.; Almogren, A. A robust human activity recognition system using smartphone sensors and deep learning. Future Gener. Comput. Syst. 2018, 81, 307–313. [Google Scholar] [CrossRef]
  36. Gusain, K.; Gupta, A.; Popli, B. Transition-aware human activity recognition using eXtreme gradient boosted decision trees. In Advanced Computing and Communication Technologies; Springer: Singapore, 2018; pp. 41–49. [Google Scholar] [CrossRef]
  37. Ahmed, N.; Rafiq, J.I.; Islam, M.R. Enhanced Human Activity Recognition Based on Smartphone Sensor Data Using Hybrid Feature Selection Model. Sensors 2020, 20, 317. [Google Scholar] [CrossRef] [Green Version]
  38. Shi, J.; Zuo, D.; Zhang, Z. Transition Activity Recognition System Based on Standard Deviation Trend Analysis. Sensors 2020, 20, 3117. [Google Scholar] [CrossRef] [PubMed]
  39. Setterquist, D. Using a Smartphone to Detect the Standing-to-Kneeling and Kneeling-to-Standing Postural Transitions. Master’s Thesis, School of Electrical Engineering and Computer Science (EECS), KTH Royal Institute of Technology, Stockholm, Sweden, 2018. [Google Scholar]
  40. Hoai Thu, N.T.; Han, D.S. HiHAR: A Hierarchical Hybrid Deep Learning Architecture for Wearable Sensor-Based Human Activity Recognition. IEEE Access 2021, 9, 145271–145281. [Google Scholar] [CrossRef]
  41. Wang, H.; Zhao, J.; Li, J.; Tian, L.; Tu, P.; Cao, T.; An, Y.; Wang, K.; Li, S. Wearable sensor-based human activity recognition using hybrid deep learning techniques. Secur. Commun. Netw. 2020, 2020, 2132138. [Google Scholar] [CrossRef]
  42. Irfan, S.; Anjum, N.; Masood, N.; Khattak, A.S.; Ramzan, N. A Novel Hybrid Deep Learning Model for Human Activity Recognition Based on Transitional Activities. Sensors 2021, 21, 8227. [Google Scholar] [CrossRef]
  43. Chatzaki, C.; Pediaditis, M.; Vavoulas, G.; Tsiknakis, M. Human daily activity and fall recognition using a smartphone’s acceleration sensor. In Proceedings of the Information and Communication Technologies for Ageing Well and e-Health; Porto, Portugal, 28–29 April 2017, Röcker, C., O’Donoghue, J., Ziefle, M., Helfert, M., Molloy, W., Eds.; Springer International Publishing: Cham, Switzerland, 2017; pp. 100–118. [Google Scholar]
  44. Hassan, M.M.; Gumaei, A.; Aloi, G.; Fortino, G.; Zhou, M. A Smartphone-Enabled Fall Detection Framework for Elderly People in Connected Home Healthcare. IEEE Netw. 2019, 33, 58–63. [Google Scholar] [CrossRef]
  45. Anguita, D.; Ghio, A.; Oneto, L.; Parra, X.; Reyes-Ortiz, J.L. A Public Domain Dataset for Human Activity Recognition using Smartphones. In Proceedings of the International Conference on European Symposium on Artificial Neural Networks, Computational Intelligence and Machine Learning (ESANN), Bruges, Belgium, 24–26 April 2013. [Google Scholar]
  46. Rong, L.; Jianzhong, Z.; Ming, L.; Xiangfeng, H. A Wearable Acceleration Sensor System for Gait Recognition. In Proceedings of the 2007 2nd IEEE Conference on Industrial Electronics and Applications, Harbin, China, 23–25 May 2007; pp. 2654–2659. [Google Scholar] [CrossRef]
  47. Banos, O.; Galvez, J.M.; Damas, M.; Pomares, H.; Rojas, I. Window Size Impact in Human Activity Recognition. Sensors 2014, 14, 6474–6499. [Google Scholar] [CrossRef] [Green Version]
  48. Chung, J.; Gulcehre, C.; Cho, K.; Bengio, Y. Empirical evaluation of gated recurrent neural networks on sequence modeling. In Proceedings of the NIPS 2014 Workshop on Deep Learning, Montreal, QC, Canada, 8–13 December 2014. [Google Scholar]
  49. Schuster, M.; Paliwal, K. Bidirectional recurrent neural networks. IEEE Trans. Signal Process. 1997, 45, 2673–2681. [Google Scholar] [CrossRef] [Green Version]
  50. Muqeet, A.; Iqbal, M.T.B.; Bae, S.H. HRAN: Hybrid Residual Attention Network for Single Image Super-Resolution. IEEE Access 2019, 7, 137020–137029. [Google Scholar] [CrossRef]
  51. Lin, M.; Chen, Q.; Yan, S. Network in Network. arXiv 2014, arXiv:1312.4400. [Google Scholar]
  52. Rundo, L.; Han, C.; Nagano, Y.; Zhang, J.; Hataya, R.; Militello, C.; Tangherloni, A.; Nobile, M.S.; Ferretti, C.; Besozzi, D.; et al. USE-Net: Incorporating Squeeze-and-Excitation blocks into U-Net for prostate zonal segmentation of multi-institutional MRI datasets. Neurocomputing 2019, 365, 31–43. [Google Scholar] [CrossRef] [Green Version]
  53. Kingma, D.; Ba, J. Adam: A method for stochastic optimization. In Proceedings of the International Conference on Learning Representations, Banff, AB, Canada, 14–16 April 2014. [Google Scholar]
  54. Janocha, K.; Czarnecki, W. On Loss Functions for Deep Neural Networks in Classification. arXiv 2017, arXiv:1702.05659. [Google Scholar] [CrossRef]
  55. Xie, S.; Girshick, R.; Dollár, P.; Tu, Z.; He, K. Aggregated Residual Transformations for Deep Neural Networks. In Proceedings of the 2017 IEEE Conference on Computer Vision and Pattern Recognition (CVPR), Honolulu, HI, USA, 21–26 July 2017; pp. 5987–5995. [Google Scholar] [CrossRef] [Green Version]
  56. Xia, K.; Huang, J.; Wang, H. LSTM-CNN Architecture for Human Activity Recognition. IEEE Access 2020, 8, 56855–56866. [Google Scholar] [CrossRef]
Publisher’s Note: MDPI stays neutral with regard to jurisdictional claims in published maps and institutional affiliations.

Article Metrics

Citations

Article Access Statistics

Multiple requests from the same IP address are counted as one view.