Article

Investigation on Characterization of Typical Characteristic in Compressor Based on Flat Plate Model

1
Liaoning Province Key Laboratory of Advanced Measurement and Test Technology of Aviation Propulsion Systems, Shenyang Aerospace University, Shenyang 110136, China
2
AECC Shenyang Engine Research Institute, Shenyang 110015, China
3
AECC Harbin Dong’an Engine Co., Ltd., Harbin 150066, China
*
Author to whom correspondence should be addressed.
Appl. Sci. 2022, 12(10), 4956; https://doi.org/10.3390/app12104956
Submission received: 9 April 2022 / Revised: 6 May 2022 / Accepted: 7 May 2022 / Published: 13 May 2022
(This article belongs to the Special Issue Aircrafts Reliability and Health Management)

Abstract

:
The acoustic resonance of aero-engine compressors is very harmful, which can lead to the failure of components such as blades. The mechanism of acoustic resonance is very complicated. To solve this problem, characteristics of the noise signal under the abnormal vibration state of the rotor blade are analyzed through the noise measurement in the compressor in the paper. The frequency spectrum characteristics, sound pressure level, and phase relationship of the noise signal corresponding to the abnormal vibration of the rotor blade are captured, and the feature of “frequency locked” which is consistent with the acoustic resonance in the compressor is obtained. Numerical simulation is a better way to study the mechanism of acoustic resonance. Therefore, based on the Parker model, a research method of acoustic resonance characteristics and mechanism based on acoustic analogy is proposed from the solution of the sound-induced in the pipe cavity. The vortex system and sound field characteristics when the acoustic resonance occurs are calculated. The results show that the distribution characteristics of the shedding vortex can be recognized, which are consistent with the experimental results of Welsh when the acoustic resonance occurs. The error of the acoustic resonance frequency from numerical simulation results to experimental is 3.6%. The characteristic of “frequency locked” and Parker β mode of the acoustic resonance is captured. The acoustic analogy method is suitable for the characterization of the acoustic resonance performance and mechanism in the pipeline and in the aeroengine compressor.

1. Introduction

Since the 1950s, research institutions represented by the National Aeronautics and Space Administration (NASA) in the United States, Deutsches Zentrum für Luft-und Raumfahrt (DLR) in Germany, have encountered many cases of vibration damage to the engine casing, rotor blades, and other structures caused by acoustic resonance during the development and use of aeroengines [1,2]. At the same time, the “Engine Structural Integrity Plan” proposed that numerous acoustic modes presented in a closed cavity simultaneously weaken the energy of a single mode and reduce the interaction with surrounding structures [3], which causes difficulties in verifying the strength of acoustic resonance on aeroengines. The phenomenon of acoustic resonance that occurs in the compressor has been presented in many studies. Although it has similar characteristics, there are differences in the explanations of its mechanism. Parker presented the first report on acoustic resonance in a low-speed single-stage compressor in 1968 [4]. The problem of compressor blade breakage caused by acoustic resonance was captured in a multi-stage high-speed axial compressor, which was not publicly reported due to technical confidentiality. The problem of acoustic resonance has been investigated by Legerton with the full-scale compressor developed by Rolls Royce, and proposed that the problem of acoustic resonance may widely exist in other types of aeroengines [5]. The annular cascade experiment conducted by Weidenfeller indicated that, when the Ma of flow is 0.482, the acoustic mode with a helical structure occurs in the annular cascade flow channel and the blade vibration frequency corresponding to the acoustic mode frequency, which is related to the excitation sources of the high amplitude of blade vibration is obtained [6]. Stator blade damage had appeared in the rear stage of the Alstom gas turbine compressor, Cyrus measured the pressure pulsation in the compressor flow channel with a pneumatic pressure probe and found that asynchronous pressure pulsation occurred in the rear stage of this compressor. The frequency of the asynchronous pressure pulsation is basically consistent with the natural frequency of vibration of the damaged blade, and it is believed that acoustic resonance plays a role in it [7]. The experimental research conducted by Camp on the C106 low-speed and high-pressure axial flow compressor at the University of Cambridge presented a helical acoustic mode very similar to the acoustic resonance. So, Camp concluded there must be three frequencies closed when the acoustic resonance occurs, i.e., the frequency of the shedding vortex, the acoustic modal frequency of the cavity (including the blade row), and the natural frequency of the blade vibration are very close, thus the blade vibrates with a high amplitude [8]. Hellmich discovered the phenomenon of acoustic resonance at a four-stage compressor running near the off-design conditions and summarized the typical characteristics of the acoustic resonance of an axial-flow compressor, i.e., the frequency of the helical acoustic mode in the pipeline is consistent with the frequency of the blade vortex shedding, the vortex shedding frequency and the acoustic mode frequency present the phenomenon of “frequency locked”, and the characteristic frequency of the noise signal has a change sharp [1]. Most of the above research studies the characteristics of acoustic resonance by experiment because there are too many influencing factors in the compressor, including the non-uniform swirl, the changing pipe geometry, the reflection and transmission of acoustic waves between multi-stage blade rows, and high-intensity aerodynamic loads, which lead to significant difficulty in constructing theoretical models to predict the occurrence of acoustic resonances. Combing with the unacceptable computational cost, it is very difficult to simulate the whole process of pressure disturbance in unsteady methods, and the directly coupling calculation between the three-dimensional flow field, sound field, and structure are merely impossible to achieve. Therefore, it is very necessary to establish a reasonably simplified physical model in the study of the acoustic resonance of the multistage compressor [9].
Parker successfully constructed the first acoustic resonance model based on the flat blade cascade, confirmed the occurrence conditions of the resonant acoustic wave and its interfering effect on the shedding vortex in the flow field by experiments, and described the typical phenomenon of “frequency locked” [10]. The proposal of the Parker mode makes a further step to clarify that the internal relationship between the acoustic mode in the pipeline and the vibration mode of the plate structure directly determines the vibration of the plate [11,12,13]. Clements built a two-dimensional rectangular plate wake model based on the plate cascade model, achieved the numerical calculation for the shear layer of the flow field, and described the physical process of the generation and development of the plate wake vortex in detail [14]. Yokoyama [15] obtained that the shedding vortex under parallel multi-plates exhibits an anti-phase mode by experiment. Research on the mechanism of acoustic resonance induced by plate wake flow in a hard-walled pipeline is conducted by Welsh and derived the key factors affecting the acoustic resonance, including the thickness of the plate, the chord length, the shape of the trailing edge of the plate, and the internal geometric dimensions of the pipeline [16]. Reyes indicated that the function of acoustic waves imposed on the flow field is mainly to affect the shedding of the wake vortices [17]. Taking the Parker β mode as a reference and ignoring the influence of airflow velocity, Thompson achieved the prediction of vortex shedding in the wake of the flat plate in the pipeline, derived the rhythm of the influence of acoustic waves on vortex shedding, and captured the characteristic phenomenon of the coupling between the acoustic wave frequency and the vortex frequency [18,19]. Katasonov discovered that the trailing edge shedding vortex is the main sound source through research with acoustic resonance [20]. Hellmich completed the calculation of the acoustic wave transmission coefficient and reflection coefficient between the compressor blades with the definition of the internal flow field vortex of a four-stage compressor as a rigid body and thus established a simplified physical model [1]. At the same time, Courtiade took this model to reveal the causes of acoustic resonance when discrete pure-tone components with a high amplitude appeared during the experiment [21]. An exciter disk model which can predict the acoustic resonance of aeroengines was established by Cooper based on the global stability theory and pointed out that the acoustic resonance phenomenon only occurs at special combined conditions of the rotor speed, the eddy current Mach number, the mass flow and other parameters [22]. The investigation of the failure of the blade in the aeroengine is conducted in detail [23,24]. Parker’s resonance mechanism established the physical model foundation for the study of structural destructive problems caused by acoustics and indicated the importance of the interaction between the sound waves and the wake vortex of the plate in acoustic resonance research.
Considering the influence of the solid wall boundary on the acoustic propagation, Curle established the Curle acoustic analogy equation by further improving the Lighthill equation. The wake of the turbulent fluid in the flow channel develops along the direction of the incoming flow and spreads around, at the same time, the interaction of the force generated by the solid wall with it jointly affects the flow form of the entire flow field. Curle indicated that the force generated by the action of the solid boundary on the flow field exists in the form of a dipole force source term, which makes the main contribution to the sound field in the flow channel, i.e., the so-called dipole sound source [25]. After proposing Curle’s acoustic analogy equation, researchers try to solve the flow field where the structure is located and use the acoustic analogy equation to equivalent the aerodynamic force generated by the solid surface as the sound source term, so achieving the solution of the flow-induced sound source. This solution method has been successfully applied in the flow-induced sound generation of structures such as plates, cylinders, and airfoils with good calculation results [26,27]. A dipole force source will be generated by the function of counterforce in the flow field under the action of the solid wall, and this force will also exist in the flow field information. Therefore, the accurate description of the aerodynamic force caused by the solid wall is the key point to solving the problem of the sound generated in the wake of the structure. The relationship between the aerodynamic force on the surface of the structure and the flow vortex in the flow field can be explained by the Blasius theory. So, there is no need to solve the surface force of the structure. Howe did a more authoritative verification in this regard [28]. Escobar first used the large eddy simulation method to complete the calculation of the flow field information around the structure and obtained the Lighthill stress information on the flow field calculation grid. Then, by interpolating the flow field information into the sound field calculation grid, the solution of the sound field information was achieved [29]. Under the current situation of the rapid development of computer technology, especially the realization of large-scale and ultra-fast parallel computing, the direct numerical calculation method used to directly calculate the sound field information can be achieved to a certain extent [30]. However, the solution of the directly coupled solution method and the sound field with the flow field requires a lot of computing resources, and it is difficult to widely apply it in practical engineering applications. Therefore, it is technically feasible and practical to develop a reliable and effective solution method for flow-induced sound generation. In the paper, the combination of large eddy simulation and acoustic analogy method, which is used to solve the problem of sound generated with shedding vortex from the trailing edge of a flat plate locked in a rectangular pipe, will be a good solution to the problem of turbulent sound.
The noise experiment between compressor stages is conducted in present research. The frequency spectrum characteristics, sound pressure level, and phase relationship of the noise signal corresponding to the abnormal vibration of the rotor blade are captured, and the feature of “frequency locked”, which is consistent with the acoustic resonance in the compressor is obtained. Based on the Parker model, an acoustic analogy research method used to study the characteristics and mechanism of the acoustic resonance of the sound induced in the pipe cavity is proposed. Taking this method to analyze the acoustic mode distribution characteristics and “frequency locked” characteristics of the pipe cavity, and reveal the mechanism of the acoustic resonance induced by the shedding vortex. The method proposed in the paper is suitable for solving the acoustic problem of the pipeline cavity under the flow conditions of low Mach number and high Reynolds number, which can provide guidance for the investigation of the acoustic resonance mechanism in an aeroengine compressor.

2. Flow-Induced Noise Theory

Simulation of the flow state is conducted in the present investigation. Initially, the steady flow field calculation is carried out to achieve the initialization of the flow state and then is used as the input condition for the transient flow field calculation. Renormalization-group (RNG) k ε model is taken for the steady-state calculation, the small scale motion in the flow is no longer calculated separately but is represented in the large scale motion and viscous motion. Therefore, the governing equations are not considered with the small scale motion. k equation and ε equation can be expressed as
{ ( ρ k ) t + ( ρ k u i ) x i = x j [ α k μ e f f k x j ] + G k + ρ ε ( ρ ε ) t + ( ρ ε u i ) x i = x j [ α ε μ e f f ε x j ] + C 1 ε * ε G k k C 2 ε ρ ε 2 k
where ρ is the flow density, u i and u j are the flow velocity. G k is the turbulent kinetic energy generated by the laminar velocity gradient.
For the transient state calculation, the large eddy simulation (LES) turbulence model is selected in the paper [31,32]. After processing through the mathematical filter function, the governing equation LES is described by
{ t ( ρ u i ¯ ) + x j ( ρ u i u j ¯ ) = p x i + x j ( μ u i ¯ x j ) τ i j x j ρ t + u x i ( ρ u i ¯ ) = 0
where the parament with the overbar ‘—’ is the field variable after filtering.
τ i j = ρ u i u j ¯ ρ u i u j ¯
The above formula is the subgrid-scale stress (SGS), which is associated with the small scale motion in the motion equation. The variable value is the instantaneous value after filtering, which is different from the time-averaged value of Reynolds-averaged Navier–Stokes (RANS). The stress term in SGS is unknown which needs to be derived from other physical quantities. The basic model of SGS is proposed by Smagorinsdky [33]:
τ ij 1 3 τ k k δ i j = 2 μ t S i j ¯
where μ t is the turbulent viscosity of the sublattice scale model, μ t = ( C s Δ ) 2 | S ¯ | .
{ S i j ¯ = 1 2 ( u i x + u j x i ) | S ¯ | = 2 S i j S i j Δ = ( Δ x Δ y Δ z ) 1 / 3 C s = 1 π ( 2 3 C κ ) 3 / 4
where C κ is the Smagorinsdky constant.
The flow characteristics of the vortex group in the cavity of the structure are captured by computational fluid dynamics (CFD) which is based on the above equations. In the paper, the sound source information is extracted from the flow field information by the Lighthill acoustic analogy method. The mass conservation equation and the momentum conservation equation can be expressed as:
{ ρ t + ρ v i x i = 0 ρ v i t + ρ v i v j x j = p i j x i
Additionally,
p i j = p δ i j τ i j
ρ , p , and v are the density, pressure, and velocity, respectively, of the flow in the presence of acoustic disturbance. δ i j is the Kronecker symbol ( δ i j = 1 , i = j ; δ i j = 0 , i j ).
Taking the first formula of Equation (6) for partial derivatives with respect to time and the second formula with respect to space, and subtracting the results:
2 ρ t 2 = x i ( ρ v i v j x j + δ i j p x i + τ i j x j )
Subtracting c 0 2 2 ρ x i 2 from both sides of Equation (8):
2 ρ t 2 c 0 2 2 ρ x i 2 = 2 T i j x i x j
The relationship of the parameters in Equation (9) gives:
{ T i j = ρ v i v j ( p c 0 ρ ) δ i j + τ i j p = p 0 + p a ρ = ρ 0 + ρ a
p 0 and ρ 0 are the pressure and density of the flow without acoustic disturbance. p a and ρ a are the pressure and density variation caused by the sound pressure pulsation. c 0 is the sound velocity outside the sound source and the mean flow region, and T i j is the Lighthill stress tensor.
Combining 2 ρ 0 t 2 c 0 2 2 ρ 0 x i x i = 0 gives:
2 ρ a t 2 c 0 2 2 ρ a x i x i = 2 T i j x i x j
For the flow in the low Mach number, on the premise of the small amplitude and ignoring high-order terms above the second order:
ρ v i v j = ( ρ 0 + ρ a ) v i v j ρ 0 v i v j
Without considering the entropy source term and the viscous stress:
T i j = ρ 0 v i v j
Finally, the Lighthill acoustic analogy equation can be presented as:
{ 2 ρ a t 2 c 0 2 2 ρ a x i x i = 2 T i j x i x j 2 p x i x i = 1 c 0 2 2 p t 2
The acoustic analogy equation is consistent with the continuity equation and the momentum conservation equation. T i j is an unknown quantity that can be derived from the complete N-S equation solved with the flow field calculation. The Lighthill acoustic analogy separates the flow field and the sound field artificially. The right side term of the first equation above can be regarded as the source term, which can be obtained from the flow field calculation, and the left side is the typical sound wave equation. The sound source information can be derived from the flow field calculation result by the analogy between the two equations above.

3. Noise Experiments and Results

The experimental test of the noise between the stages of the compressor is carried out to capture the noise characteristics when the rotor blades vibrate abnormally, as well as the characteristics of sound propagation in the flow channel. The phenomenon of “frequency-locked” is obtained at the same time.

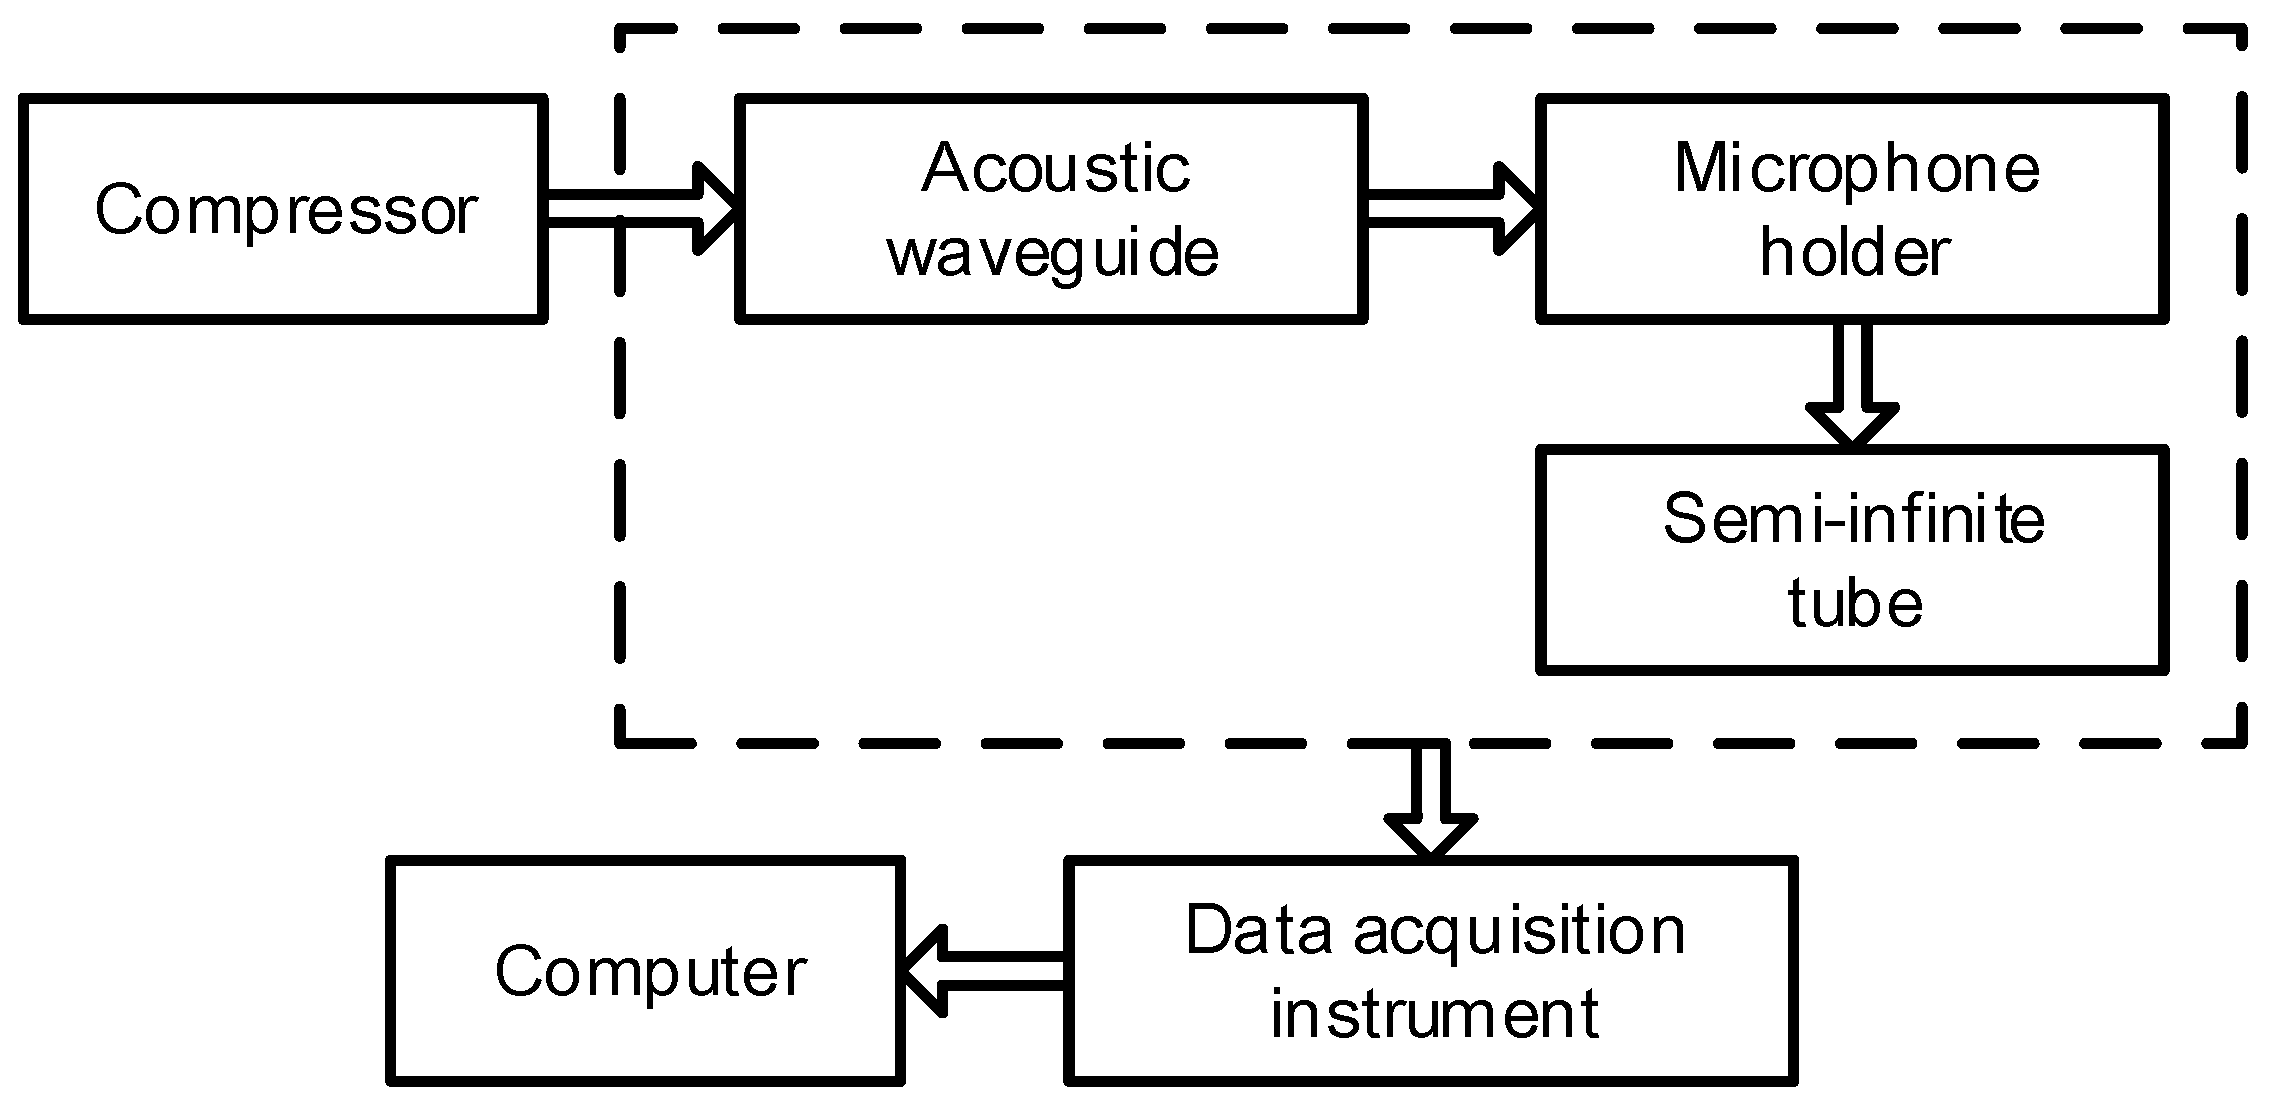
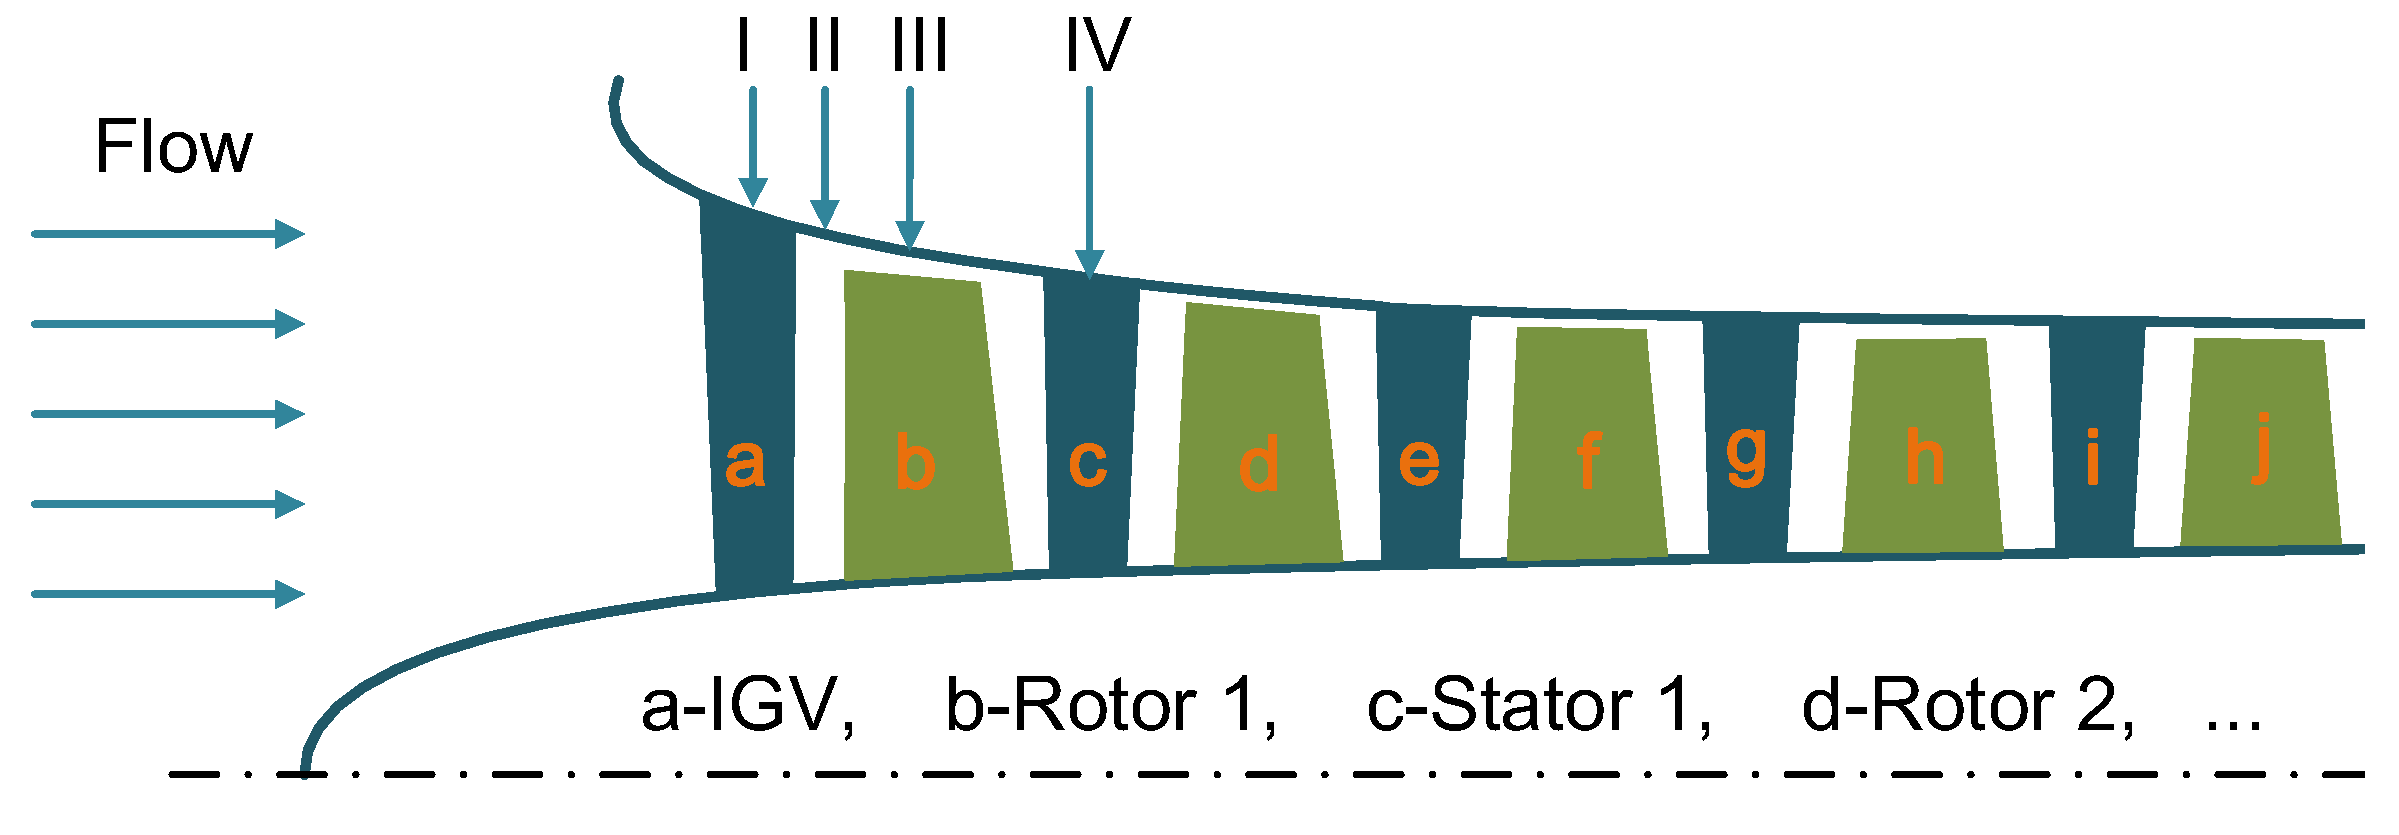
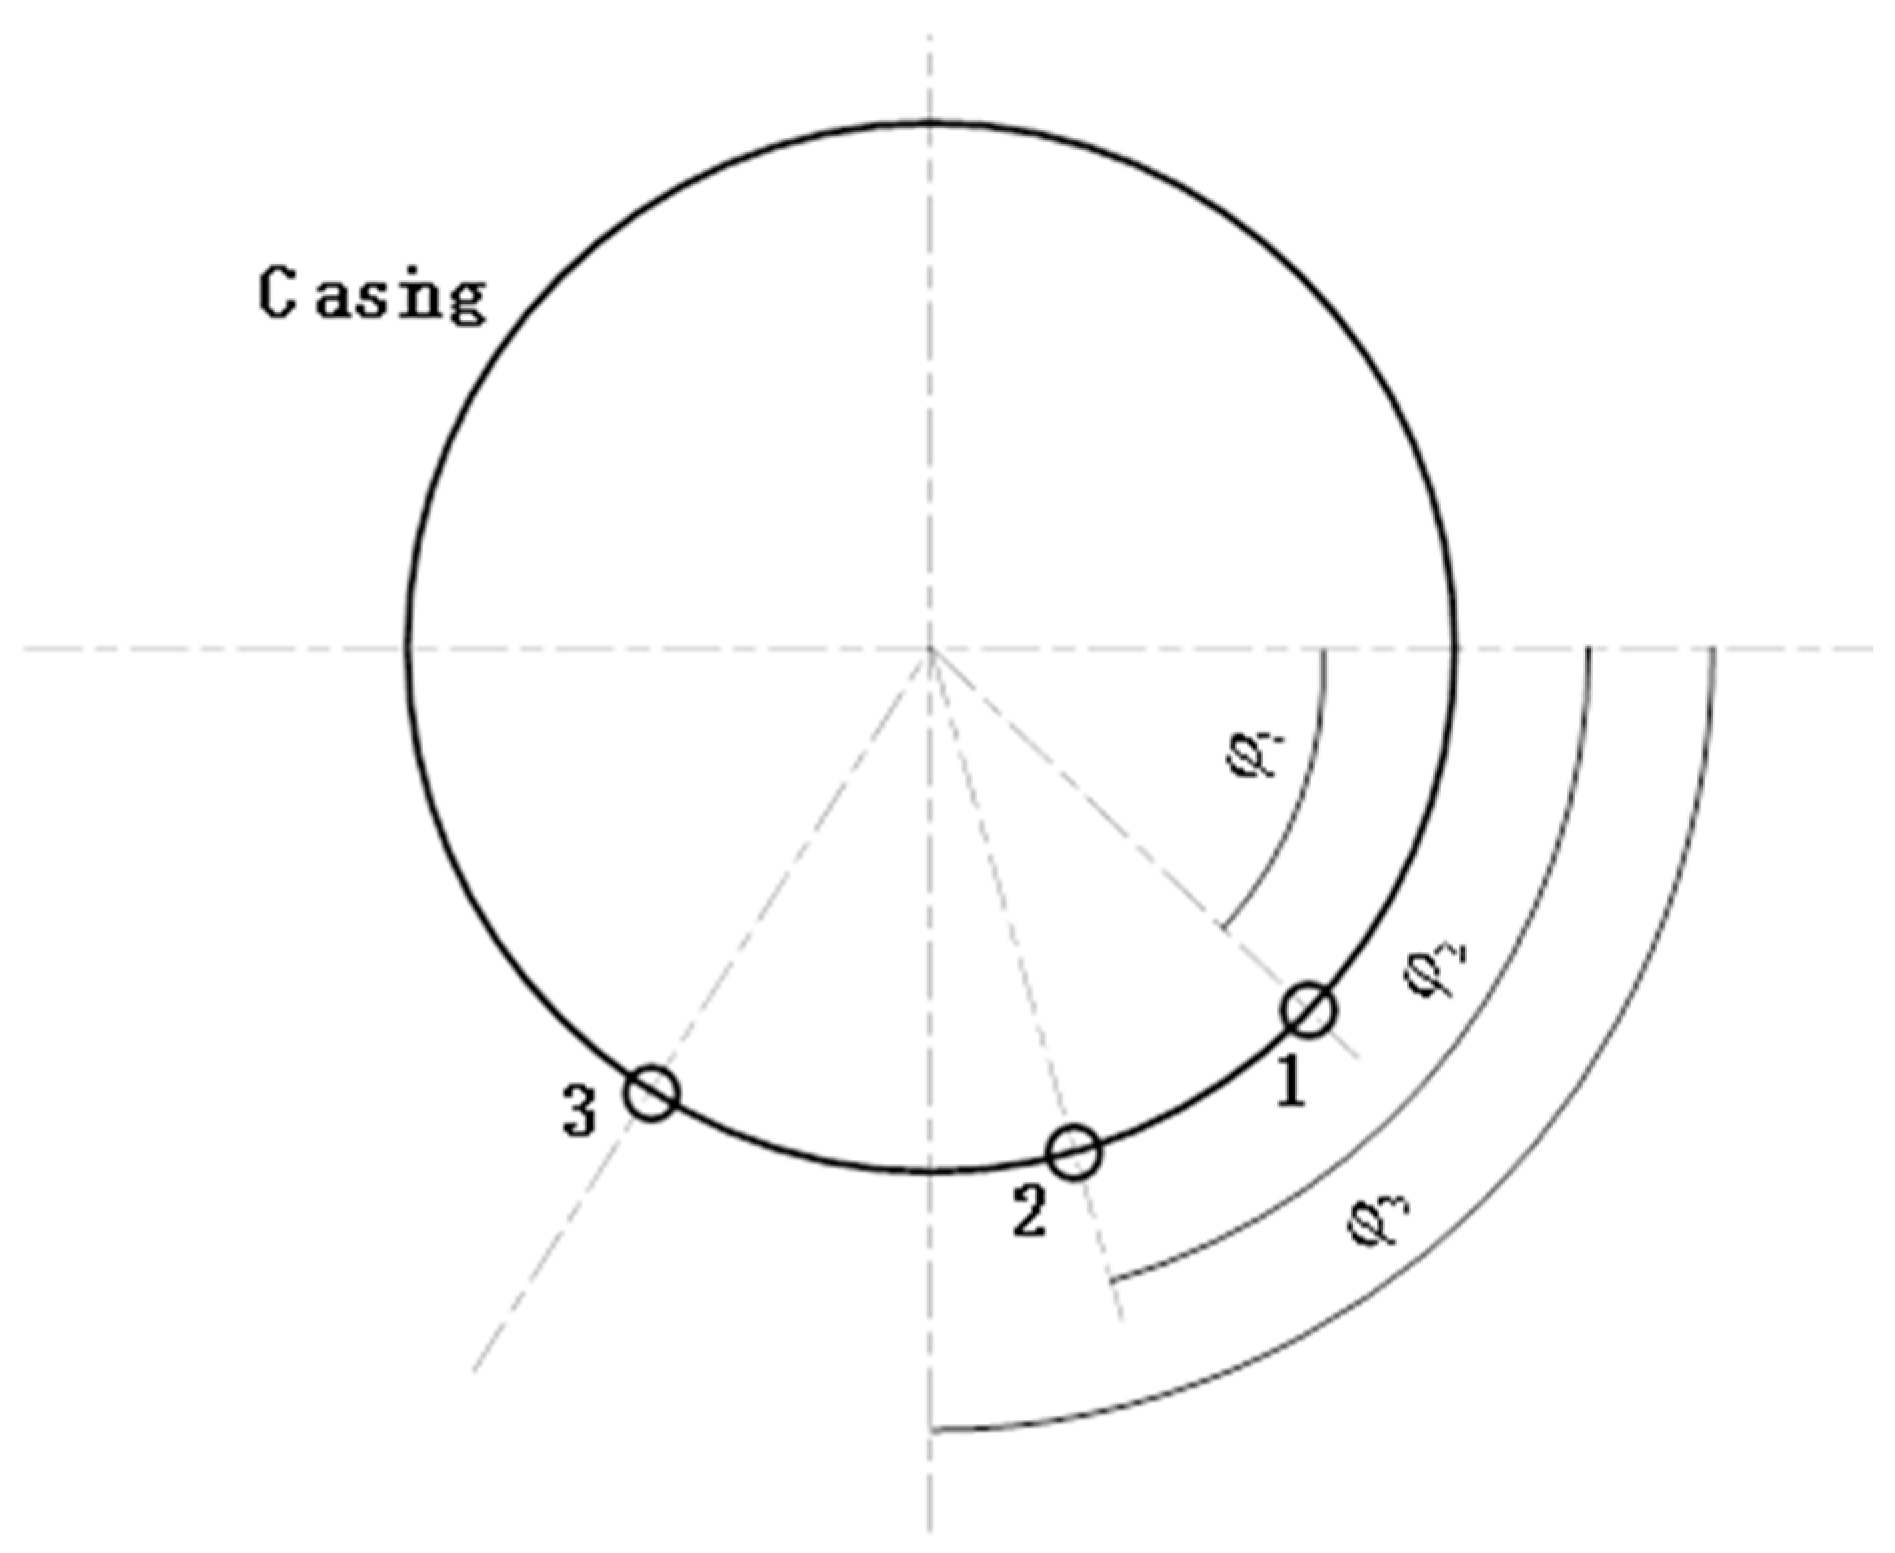
3.1. Measurement System

The high-pressure compressor of the aeroengine always works in a complex environment with a pressure and temperature which are as high as 3 MPa and 150 °C, respectively, and with the high-intensity noise (the sound pressure level of it reaches 170 dB or more and the frequency range covers 50 Hz–12 kHz). It is very difficult to meet the test requirements with conventional acoustic microphones in such an ambient environment. Therefore, a derived noise measurement method that is based on rigid-wall acoustic waveguide technology was adopted in the paper [34]. The features of this measurement system based on the principle of pipe sound transmission are that the sensing part of the microphone does not directly contact with the high-temperature environment, but leads the sound wave with a specially designed sound waveguide tube. Based on the derived noise measurement method of rigid-wall acoustic waveguide technology, a measurement system used to monitor the compressor internal noise is established, which consists of the acoustic waveguide, the microphone holder, the semi-infinite attenuator tube, the data acquisition, and analysis instrument. The connection diagram of the measurement system is shown in Figure 1. The sound wave guide is connected to the engine compressor casing, the end of which is installed flush with the inner surface of the compressor casing, so the sound waves inside the compressor flow channel can be led out through the sound wave guide. A quarter-inch condenser microphone is installed in the microphone holder. One end of the microphone holder is connected to the acoustic waveguide and the other end is connected to the semi-infinite attenuator tube, which is applied to avoid the reflection in the integral pipe.
The experimental test of the noise between the stages of the high-pressure compressor of the turbofan engine is implemented with this measurement system. In addition, the non-contact blade vibration test system is taken to monitor the vibration of the first-stage rotor blades of the high-pressure compressor. In order to obtain axial sound pressure distribution of the high-pressure compressor of the engine, during the experiment, a total of four testing points are arranged along the axial direction of the engine to measure the sound pressure of the inner wall of the compressor casing. The positions of four measuring points from one to four are the inlet guide vane (IGV), the clearance between the IGV and the first stage of the rotor blade (Rotor1), and the directly above Rotor1 and the clearance of the first stage of stators (Sator1), respectively. The schematic diagram of the positions of noise measurement points during the experiment is shown in Figure 2. Additionally, a total of three points used to monitor the rotor blade vibration are arranged at different circumferential positions along the high-pressure first-stage rotor blade, which is present in Figure 3. The fiber optic sensor probe is mounted at the designed position of the casing, and the positioning reference sensor is installed on the surface of the rotor blade. The time interval between the blade tip amplitude pulse and the rotational speed pulse is obtained through measurement and calculation. The blade tip deviates along the direction of rotation in the process of blade vibration, then the time to reach the sensor changes. Thereby, the vibration parameter information such as blade amplitude, phase, and frequency are obtained.

3.2. Analysis of Noise Characteristics under Abnormal Vibration of Rotor Blades

The compressor with the deflection angle of IGV of it works at a specific speed (about 9960 r/min) for a period of time, the abnormal vibration with a relatively large amplitude is observed at the first stage of the rotor blade of the high-pressure compressor. Figure 4 shows the variation rhythm of the noise signal before and after the abnormal vibration of Rotor1 occurs with a relatively large amplitude at discrete rotor speed ranges, respectively. The red data in the figure indicates the operational condition when the rotor blade occurs a relatively large amplitude vibration.
It can be seen from Figure 4 that the internal noise spectrum of the compressor presents typical broadband noise characteristics, and there are several characteristic frequencies with discrete pure sound components. It is obvious that the pure sound component appears at 1402 Hz when the abnormal vibration of high-amplitude value occurs in the first stage of the rotor blade of the high-pressure compressor. In order to reveal the horizontal distribution of noise sound pressure level along the axial direction of the compressor before and after Rotor1 of the high-pressure compressor vibrates with a relatively large amplitude, the sound pressure level distributions of the noise signals at four different measuring points in the compressor flow channel are analyzed. The sound pressure level distributions of the noise signal at 1402 Hz measured at different measuring points are present in Table 1 and Figure 5.
Through the above analysis, it is found that the sound pressure levels of the noise signals were measured at four different measuring points along the axial direction of the compressor at the characteristic frequency of 1402 Hz, before and after the abnormal vibration of the first stage of the rotor blade of the high-pressure of the compressor occurs, are all the maximum value at the position directly above the measuring point. When the vibration amplitude of the rotor blade sustains a relatively large value, the sound pressure level of the noise signal measured at all measuring points also reaches the maximum at this characteristic frequency. In addition, the sound pressure level directly above the rotor blade is the highest, which is up to 154 dB.
Through the analysis in Figure 4, it is found that, when the high-pressure first-stage rotor blades vibrate with a large amplitude, the characteristic frequency structure and a high-amplitude discrete pure tone component of 1402 Hz appear in the noise spectrum of the compressor internal flow channel. According to the evolution rhythm of the noise spectrum inside the compressor operated over each typical speed condition of the engine in Figure 4, the corresponding relationship between the characteristic frequency in the noise spectrum and the engine speed is analyzed and plotted in Figure 6.
It is clear that the characteristic frequency near 1402 Hz of the noise spectrum changes as the rotational speed increases. At the same time, the characteristic frequency of 1402 Hz remains constant over a specific speed range which presents no variation with the rotating speed, i.e., the phenomenon of “frequency-locked”. This is consistent with the “frequency locking and phase locking” characteristics of the noise signal when the acoustic resonance phenomenon occurs inside the compressor [1].
In order to obtain the sound propagation characteristics of the characteristic frequency noise source in the compressor flow channel of the turbofan engine, the correlation analysis of the noise signal is carried out. When the high-amplitude vibration of Rotor1 of the high-pressure compressor of the engine occurs, the noise signal measured at different measuring points in the compressor flow channel at the characteristic frequency of 1402 Hz is subjected to cross-spectral analysis. The results of the cross-spectrum analysis are shown in Figure 7, the phase relationships of noise signals of characteristic frequency at different axial positions of the compressor are obtained. Thereby, the propagation rhythm of sound signals at a characteristic frequency in the compressor flow channel is investigated. The phase difference of the characteristic frequency of the noise signal at different measurement positions is shown in Table 2.
As shown above, the “115° phase difference between IGV and IGV/Rotor1” indicates the phase of the characteristic frequency 1402 Hz at IGV is ahead of the phase at IGV/Rotor1 about 115°, i.e., the noise signal propagates from IGV/Rotor1 to IGV, and similar to others. The phase relationship of the noise signal of the characteristic frequency 1402 Hz at different measurement points is expounded as follows: (I-II) + (II-III) = (I-III), (II-III) + (III-IV) = (II-IV), and (I-II) + (II-III) + (III-IV) = (I-IV). The phase relation above is expressed as follows: characteristic frequency sound signal, which corresponds to the moment of Rotor1 of the high-pressure compressor vibrates with a high amplitude value, is the same sound wave at the different axial positions of the compressor. The phase relationship of the characteristic frequency noise signal which is transmitted from IGV through the first-stage rotor blade, and then to Sator1 is sequentially lagging. Therefore, the characteristic frequency noise signal origins after the cross-section of Stator1 of the high-pressure compressor, including the section itself. Combined with the circumferential rotational motion of the characteristic frequency noise source rotating around the rotor blade in the compressor flow channel [9], the propagation state of the characteristic frequency noise source in the compressor flow channel is a helix structure. This is consistent with the “helix acoustic mode” of the noise signal when the acoustic resonance occurs in the compressor [1].

4. Acoustic Resonance in Pipe Cavity

A built-in plate pipeline model based on the park model is established to investigate the characteristics and mechanism of acoustic resonance with the method based on acoustic analogy. The special characteristic “frequency-locked” is captured and analyzed in the mechanism of the onset of it.

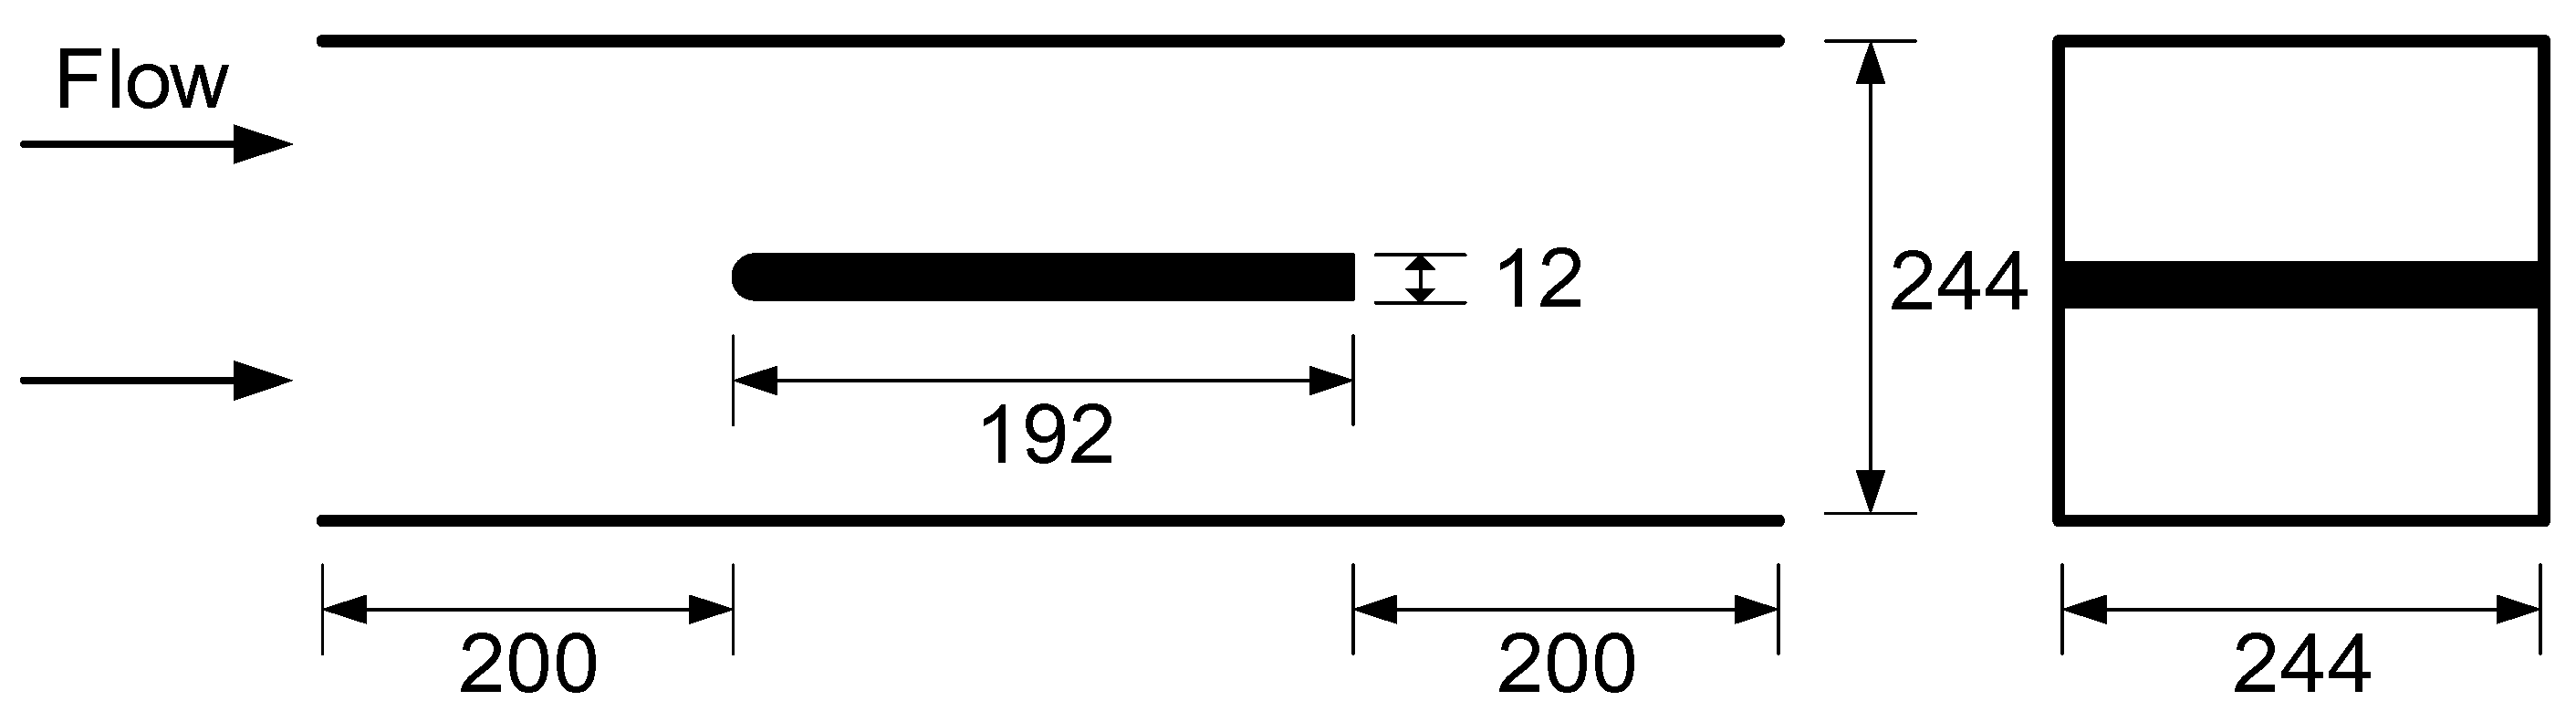
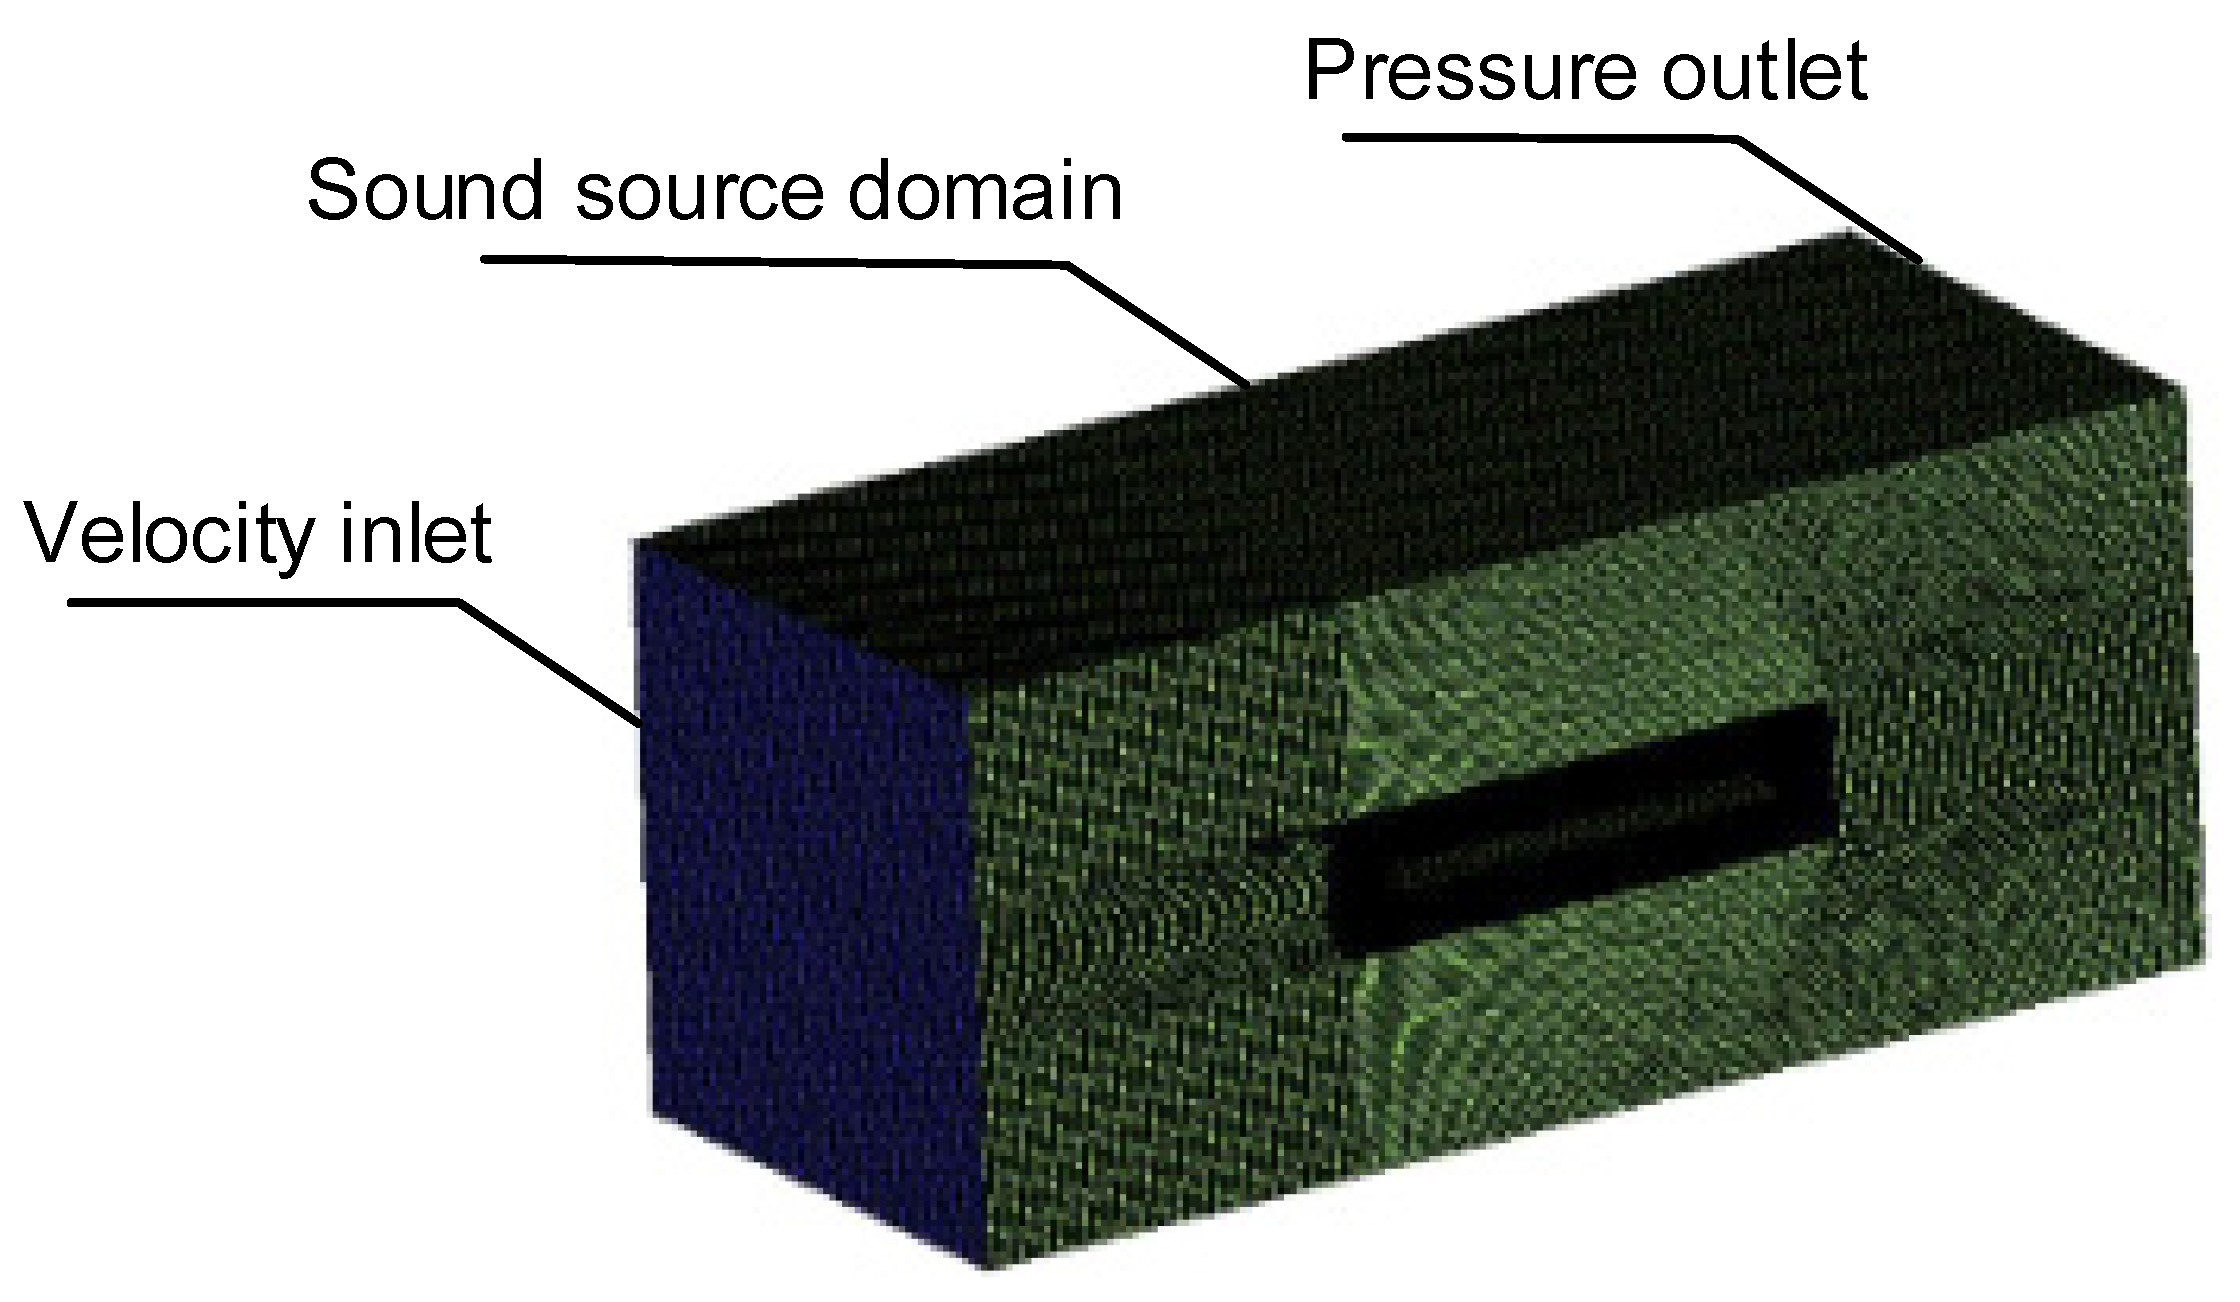
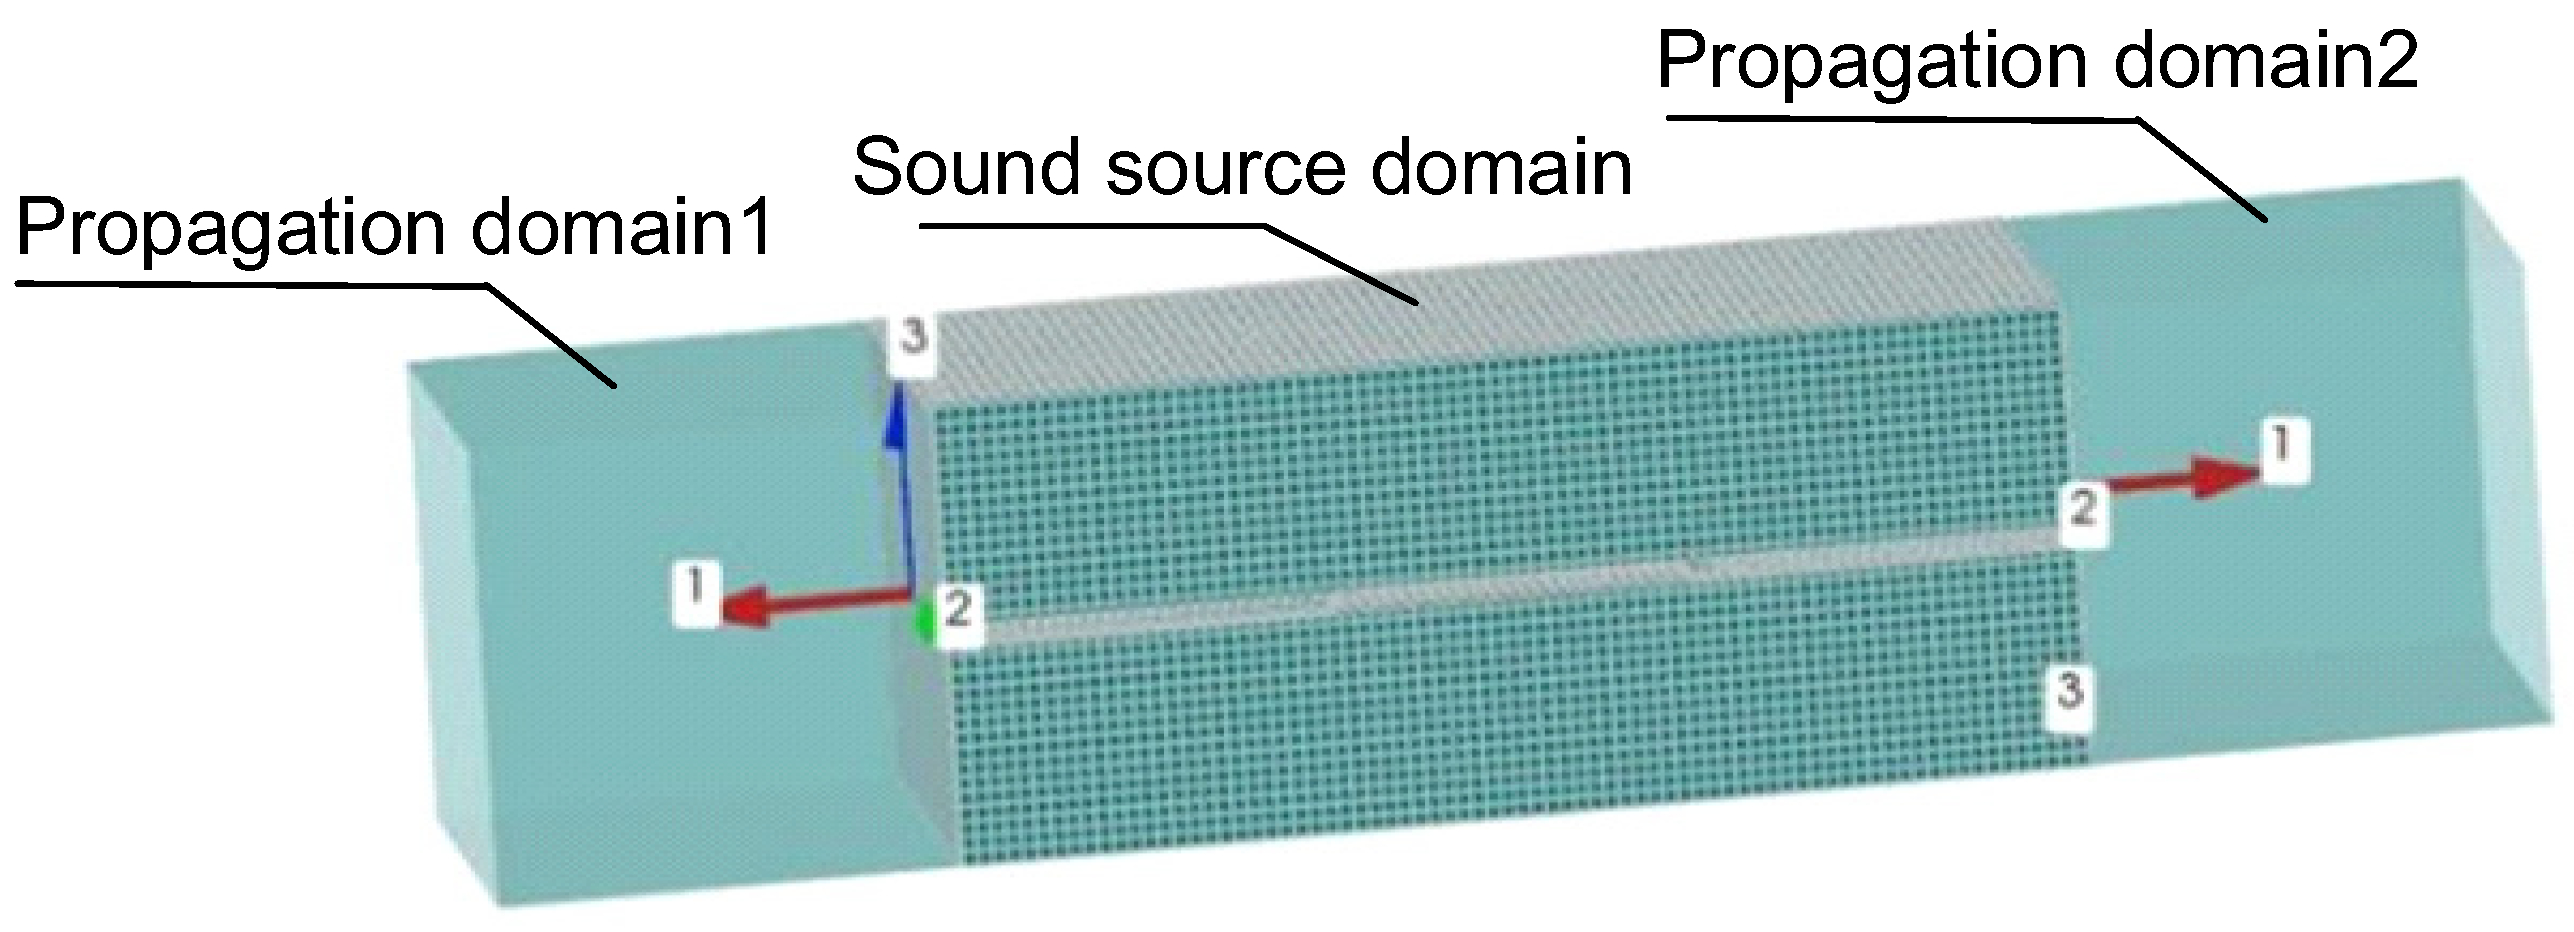
4.1. Computational Model and Parameter

In the region of research on the mechanism of acoustic resonance, the Parker resonance introduced in the introduction is the research basis and focus of the majority of scholars. The model therefore established to study the acoustic resonance of rectangular ducts which are excited by the trailing wake of flat plates by Welsh is referenced, taking this to explore the characteristics law of acoustic resonance excited by shedding vortices from the trailing edge of the flat plates. The acoustic resonance experiment of the trailing edge of the flat plates, in which the cross-sectional dimension of the wind tunnel was 244 mm × 244 mm, was completed in a low-speed wind tunnel by Welsh at a range of flow velocity from 0 to 40 m/s. In this rectangular plate with a semi-circular leading edge and a square trailing edge, the chord and thickness were 192 mm, 12 mm, and spanwise dimension was 244 mm, was locked in the center of the wind tunnel. In the processing of tests, the distribution characteristics and motion law of the region of wake vortex taking the flow display technology with discrete ranges of flow velocity were detected. A microphone above the flat plate near the tube wall was used to obtain the sound pressure spectrum, which indicated the correspondence between the frequency and amplitude of the sound pressure and the flow velocity, and captured the distribution characteristics of the sound pressure at the existence of acoustic resonance inside the tube. The sufficient and reliable experimental data above mean it is cited widely in the region of acoustic resonance, so the model mentioned above was taken to establish a computational model in the paper as shown in Figure 8.
The wall of the rectangular tube and the flat plate is set to a no-slip boundary, and the inlet and outlet of the computational model are taken from the velocity inlet and the pressure outlet, respectively. The domain extracting the sound source covers the computational model. Structured grids are selected to divide the region of flow calculation. Further processing, in which the minimum and maximum grid are 0.5 mm and 2 mm, respectively, and the growth ratio of the grid is set to 1.2, is taken in the region near the flat plate. On the other region of the computational model, the grid size is set to 3 mm. The total number of grids in the calculation model is about 3,000,000. The computational model of the flow field is shown in Figure 9. Unstructured grids are taken to divide the source region in which the maximum grid is set to 8 mm. Acoustic non-reflection regions, i.e., the domains were referred to as free propagation domain 1 and domain 2, were applied to the inlet and outlet of the computational model to achieve the free propagation of the sound waves. The other walls of the computational model are set to acoustic hard walls to simulate the total reflection of sound waves. The computational model of the source field is shown in Figure 10.
Initially, the flow field calculation under steady-state conditions is carried out with 100 iterations, and then the calculation results of this are used to initialize the transient flow field calculation. The calculation of the steady and transient flow field was applied with the RNG k ε turbulence model and LES turbulence model, respectively. The standard wall function is taken to address the flow of information near the wall of the model. The second-order implicit regime is adopted in the transient equation. In order to obtain the complete sound source information in the range of 0–2000 Hz in the transient calculation, the transient calculation time step is set to 0.00025. The resolution frequency of the sound source is 10 Hz, so the number of calculation time steps is 400 steps, and the iteration number of each time step is 20 steps.

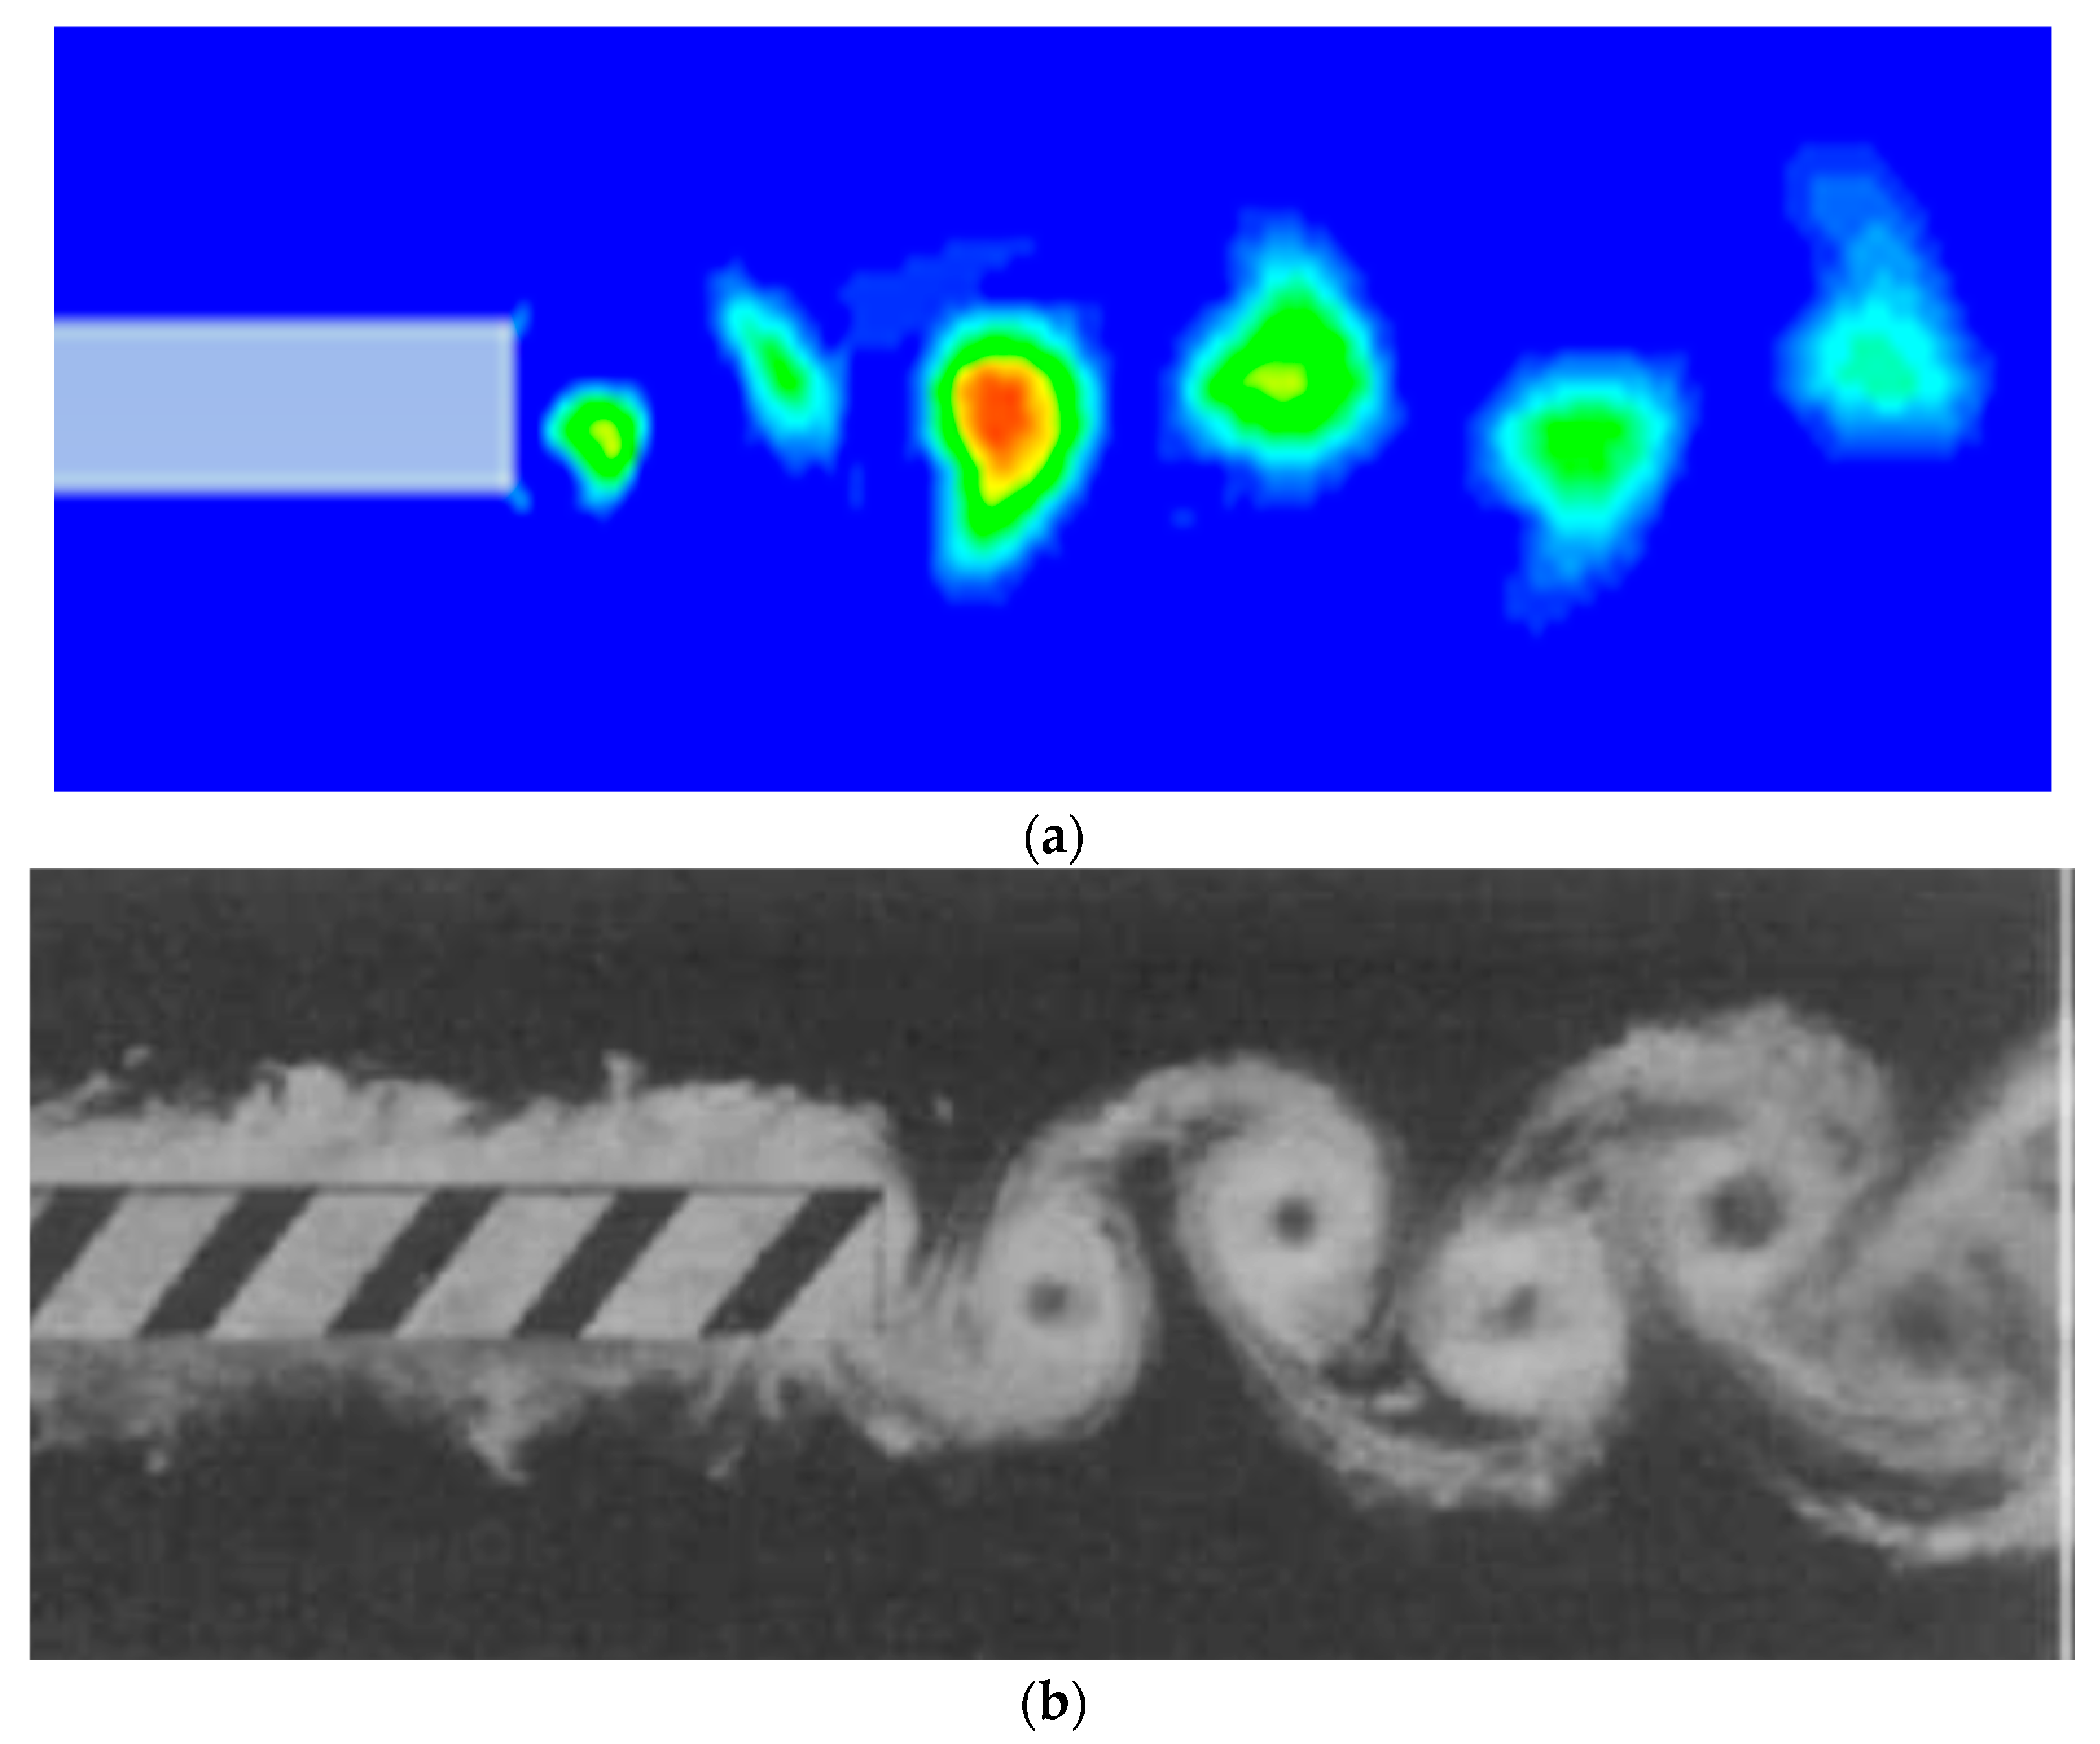
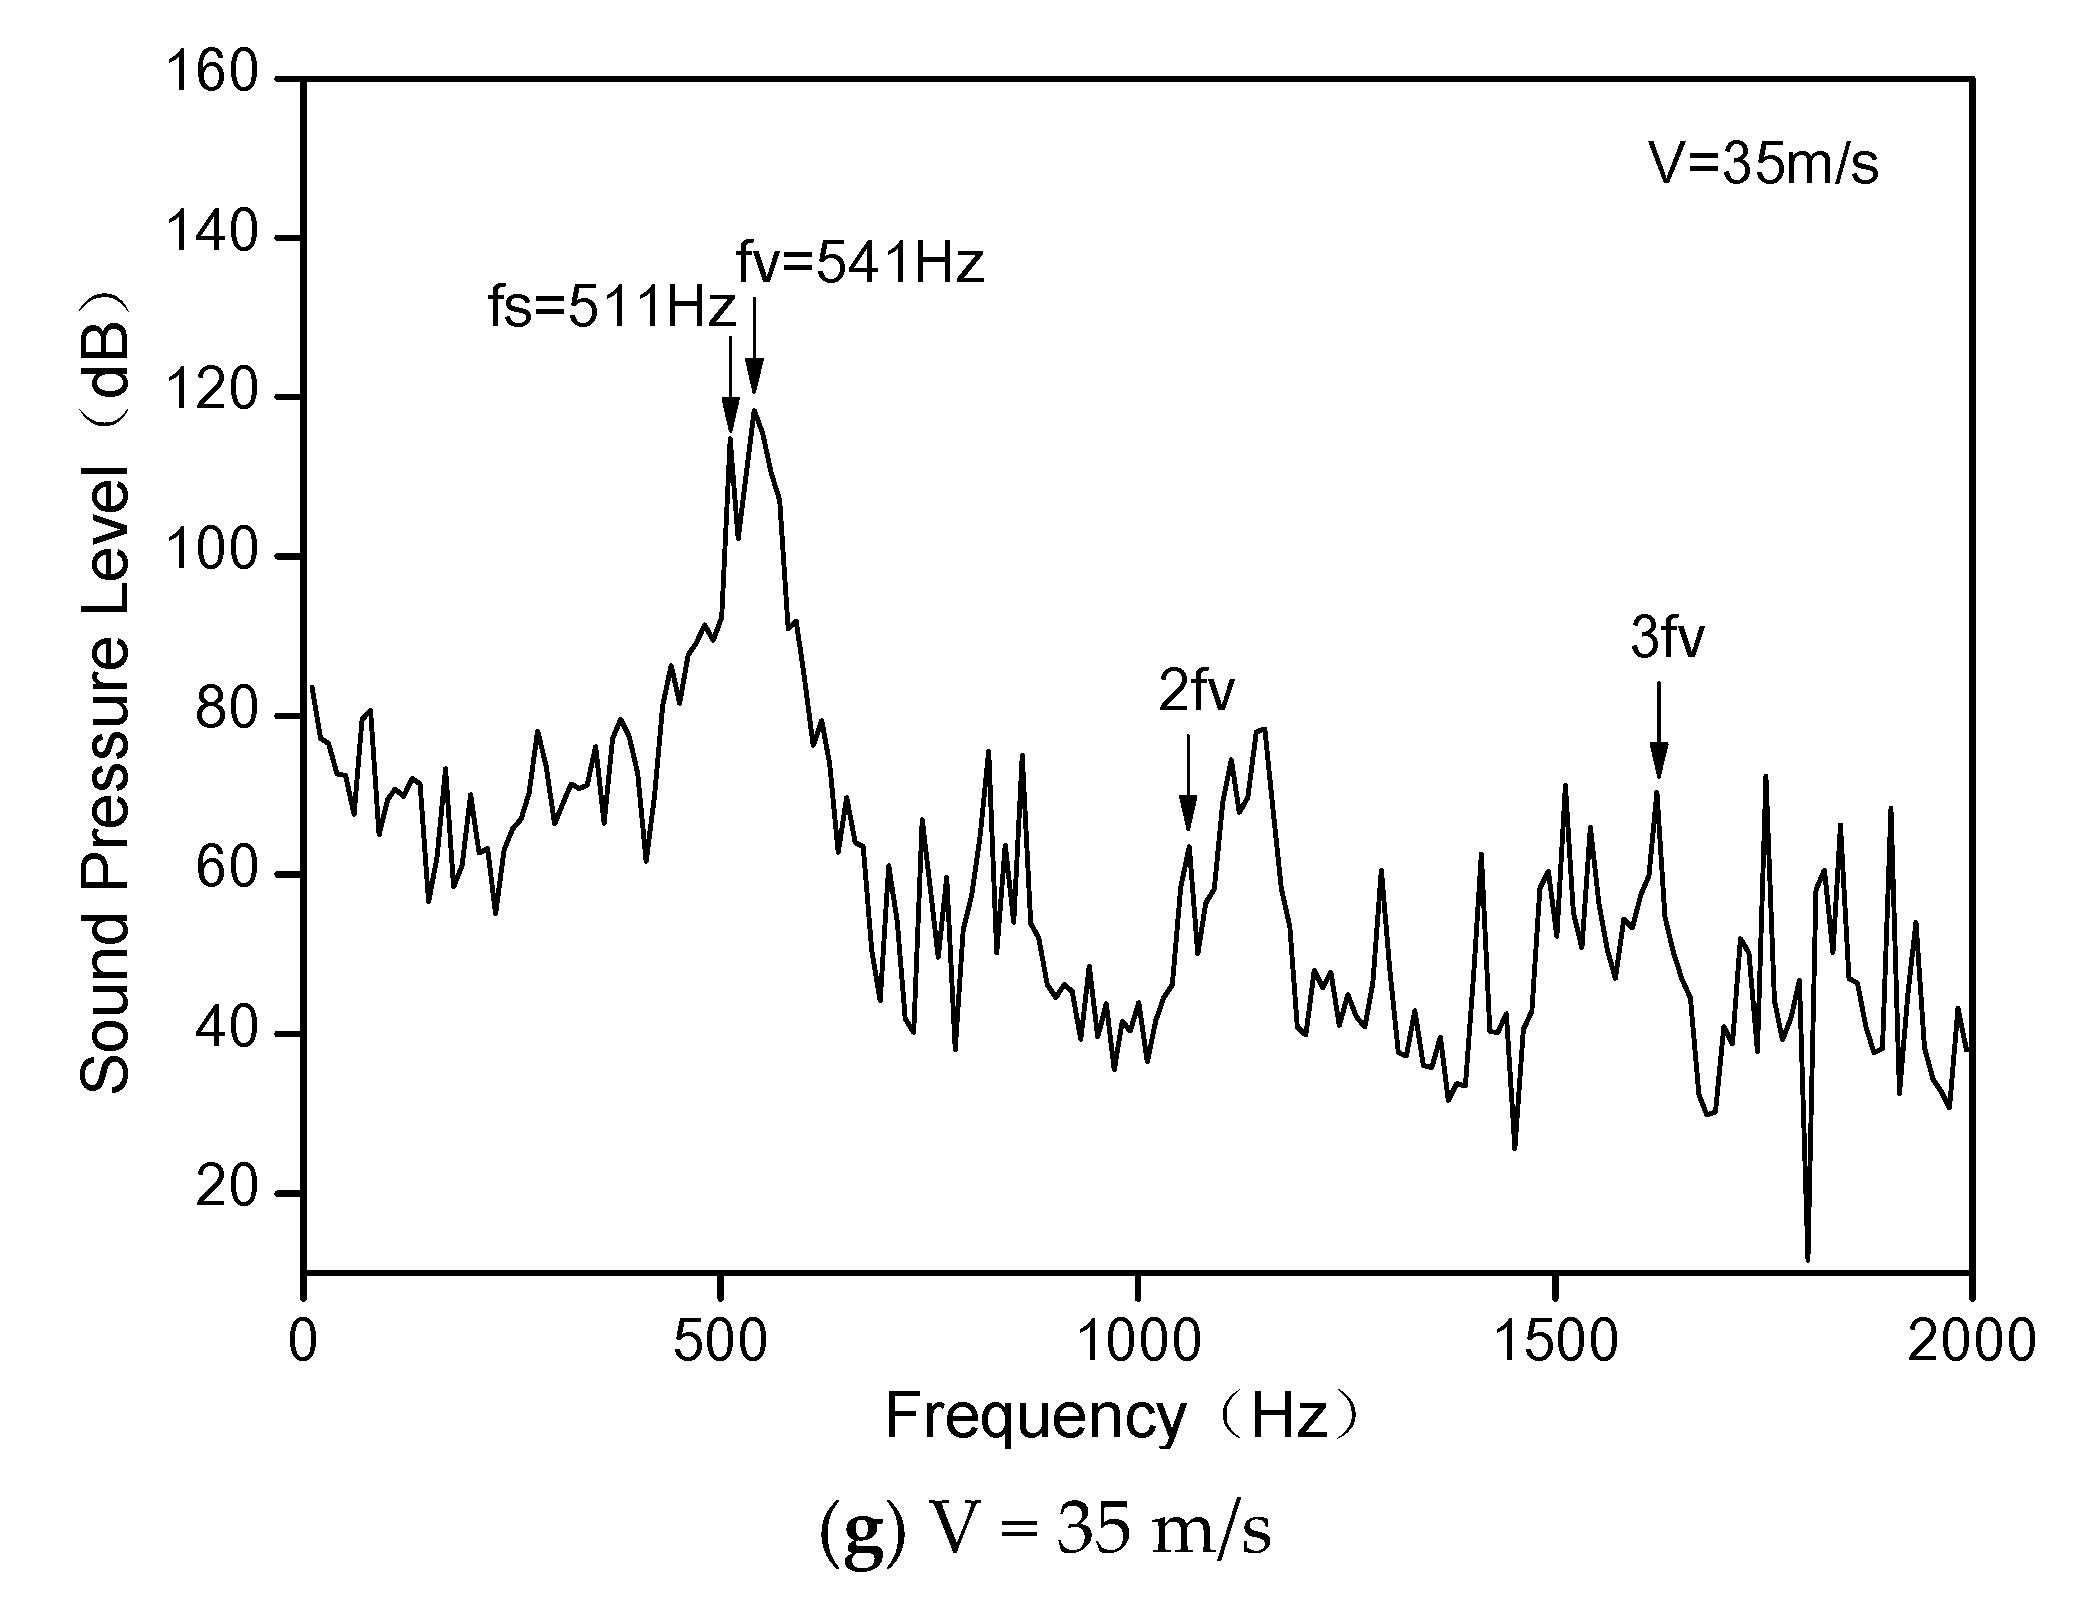
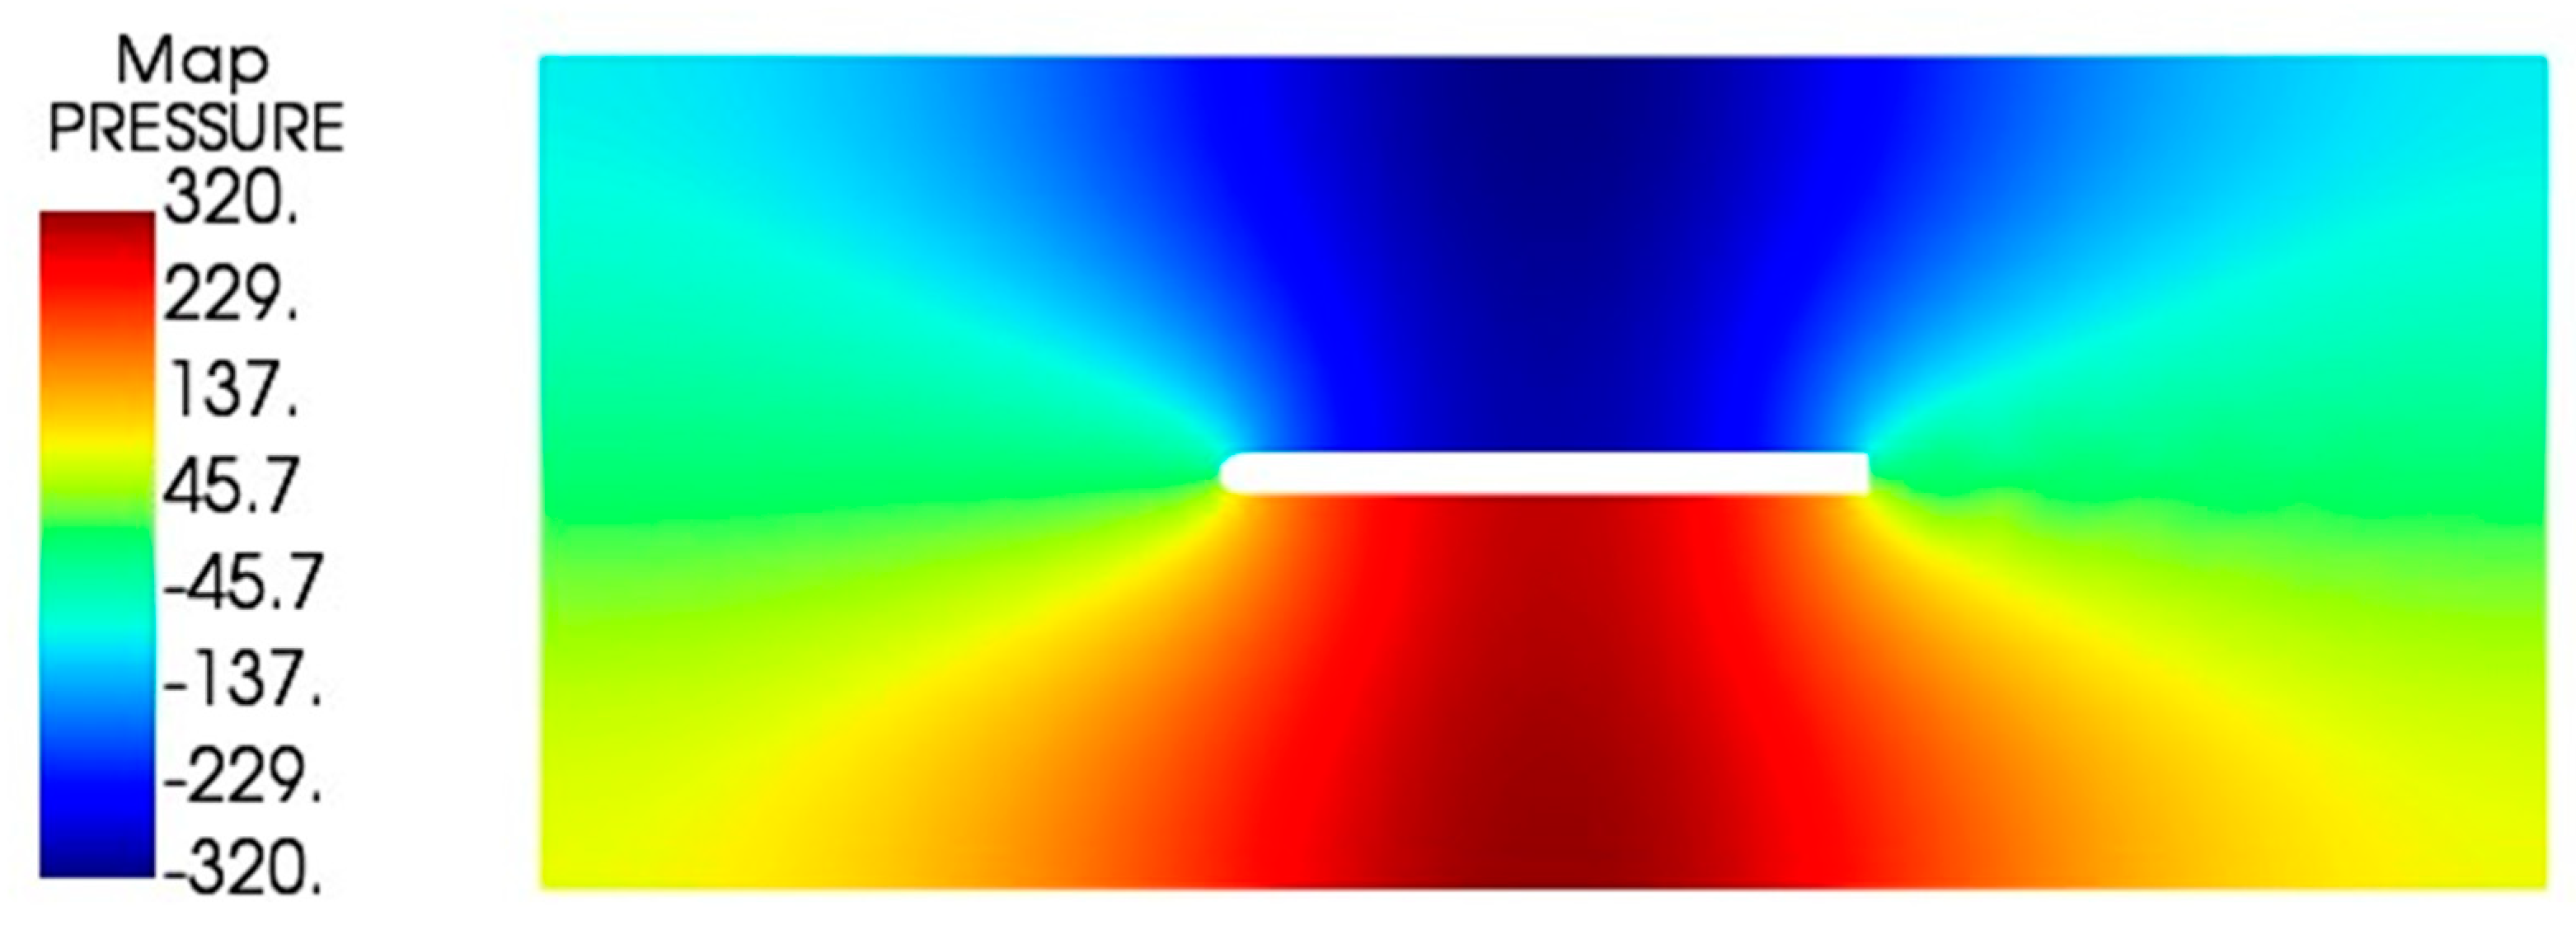
4.2. Characteristics of Shedding Vortex at the Wake of Plate

The flow characteristics of the trailing wake of the flat plate over discrete ranges of flow velocity are obtained by calculation in which the vortex motion law of this when the flow velocity is 29 m/s is shown in Figure 11. The experimental result in the reference [15] corresponding to the computational model above is shown in Figure 11b.
As shown in Figure 11a, the vortex generated over both sides of the flat plate began to grow as it moved along the main flow downstream. The vortices shedding from the trailing edge of the flat plate are present as an asymmetric regime and a typical Karman vortex street regime. The good correlation between the vortices distribution of the experimental results and the motion characteristic results of the wake vortex of the plate which is captured in the present calculation method is clear.

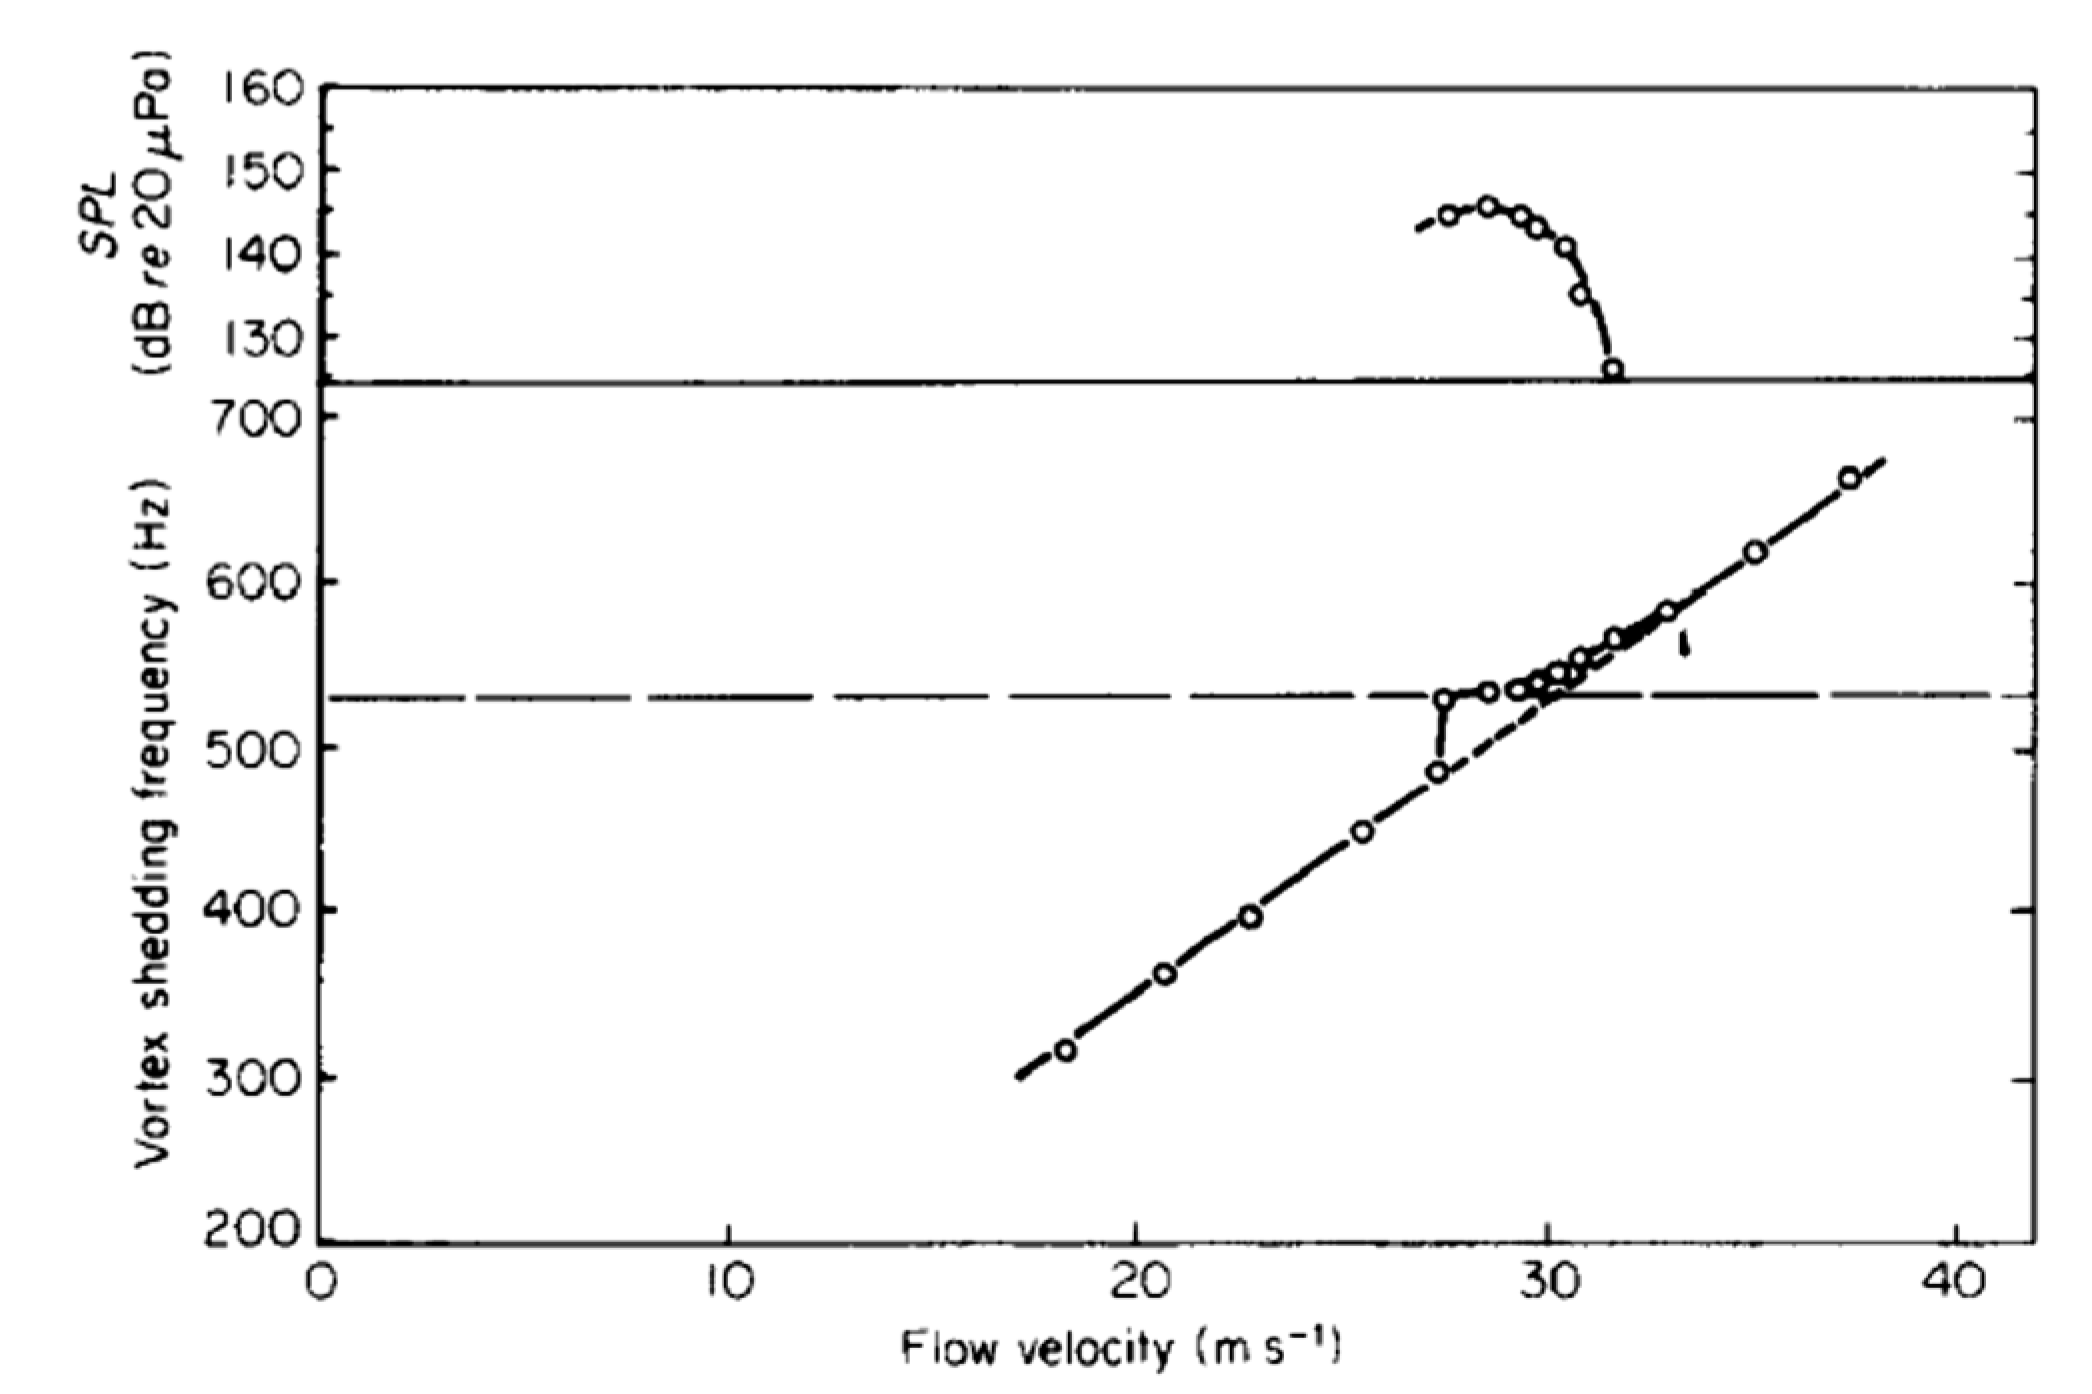
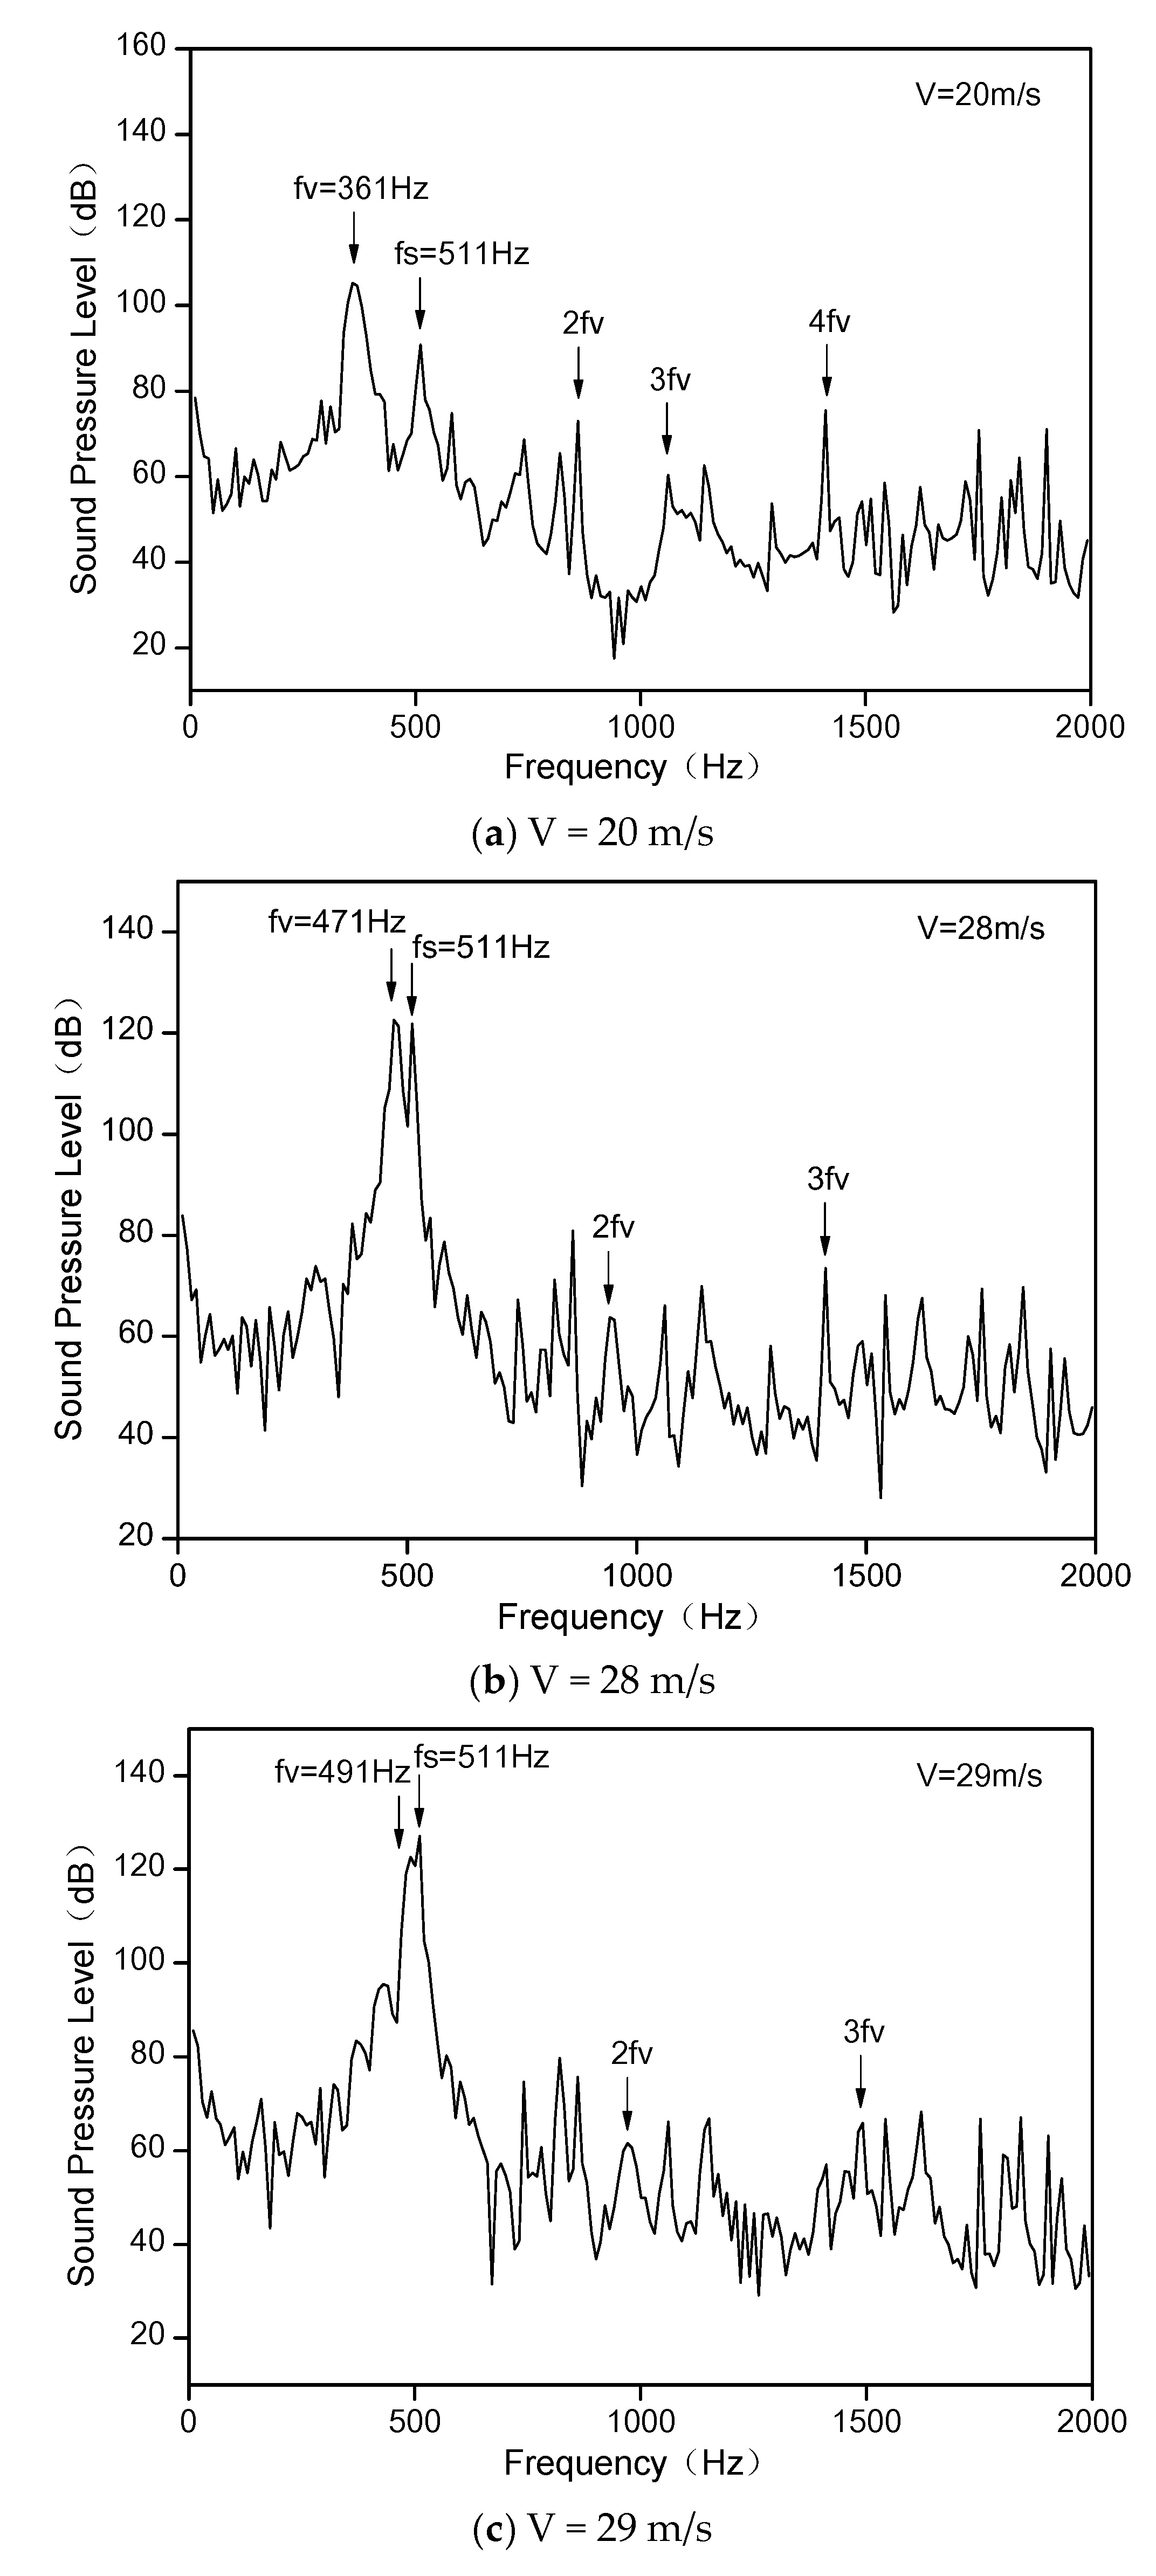
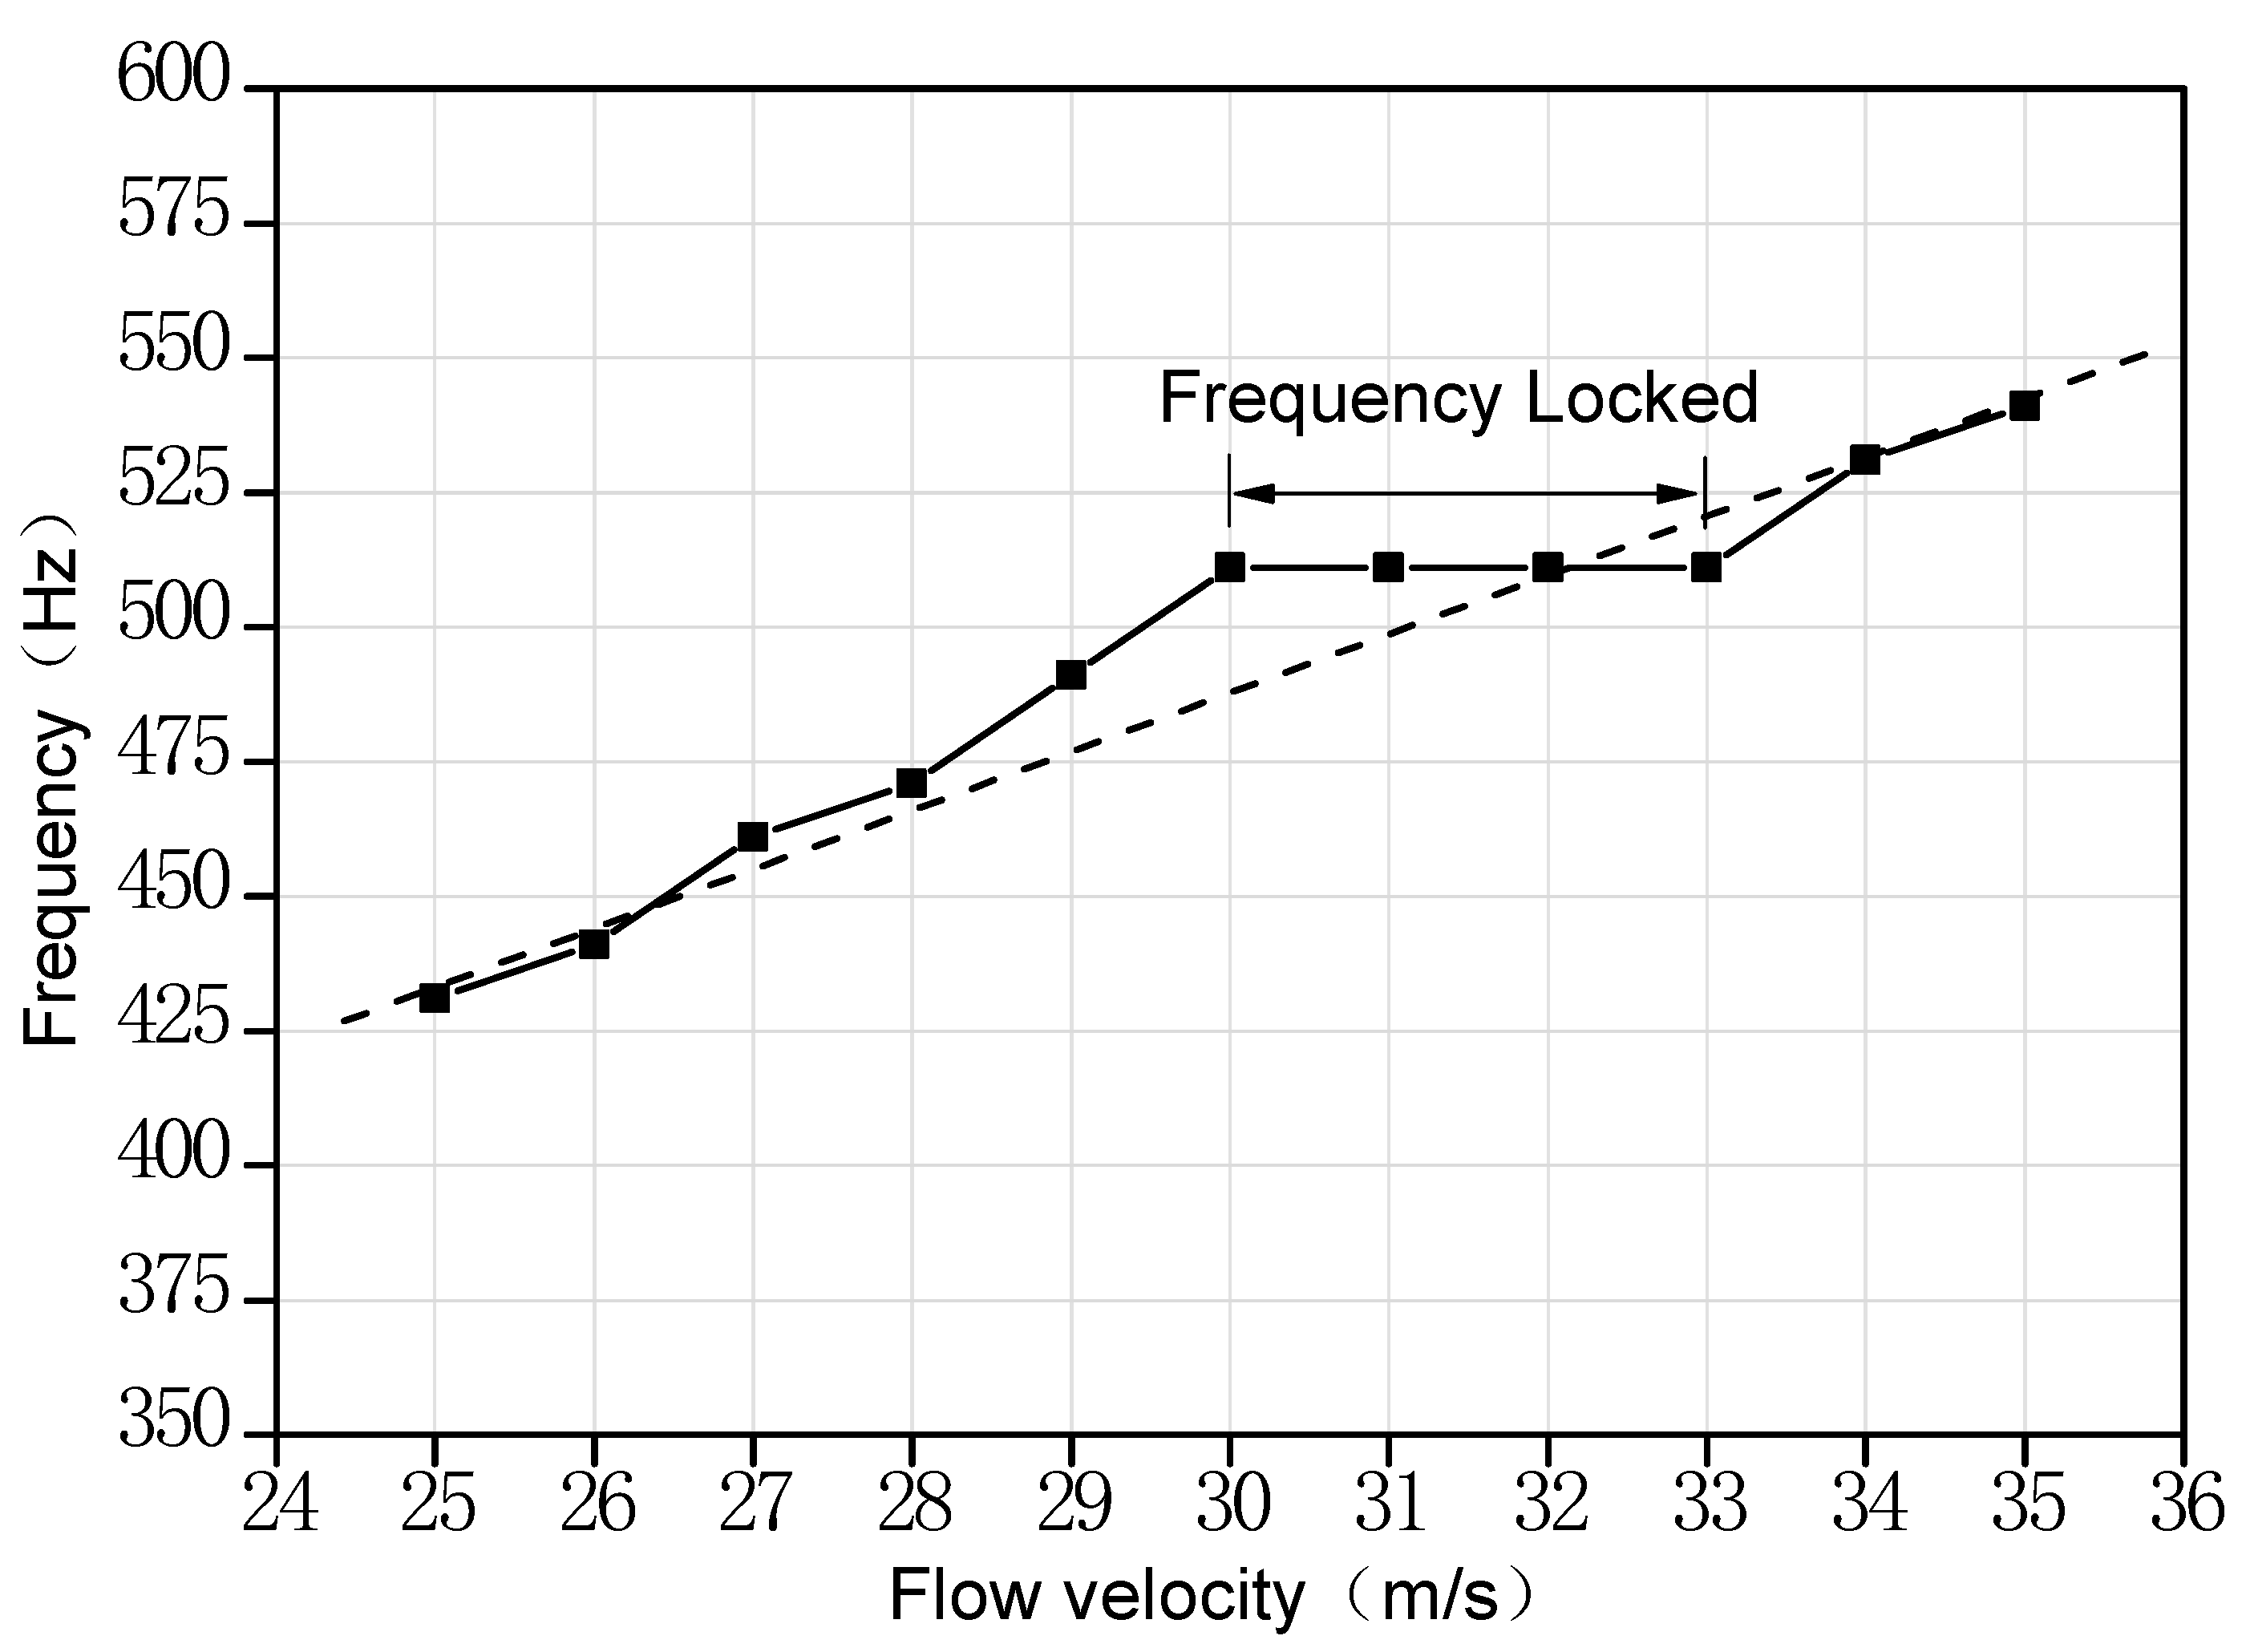
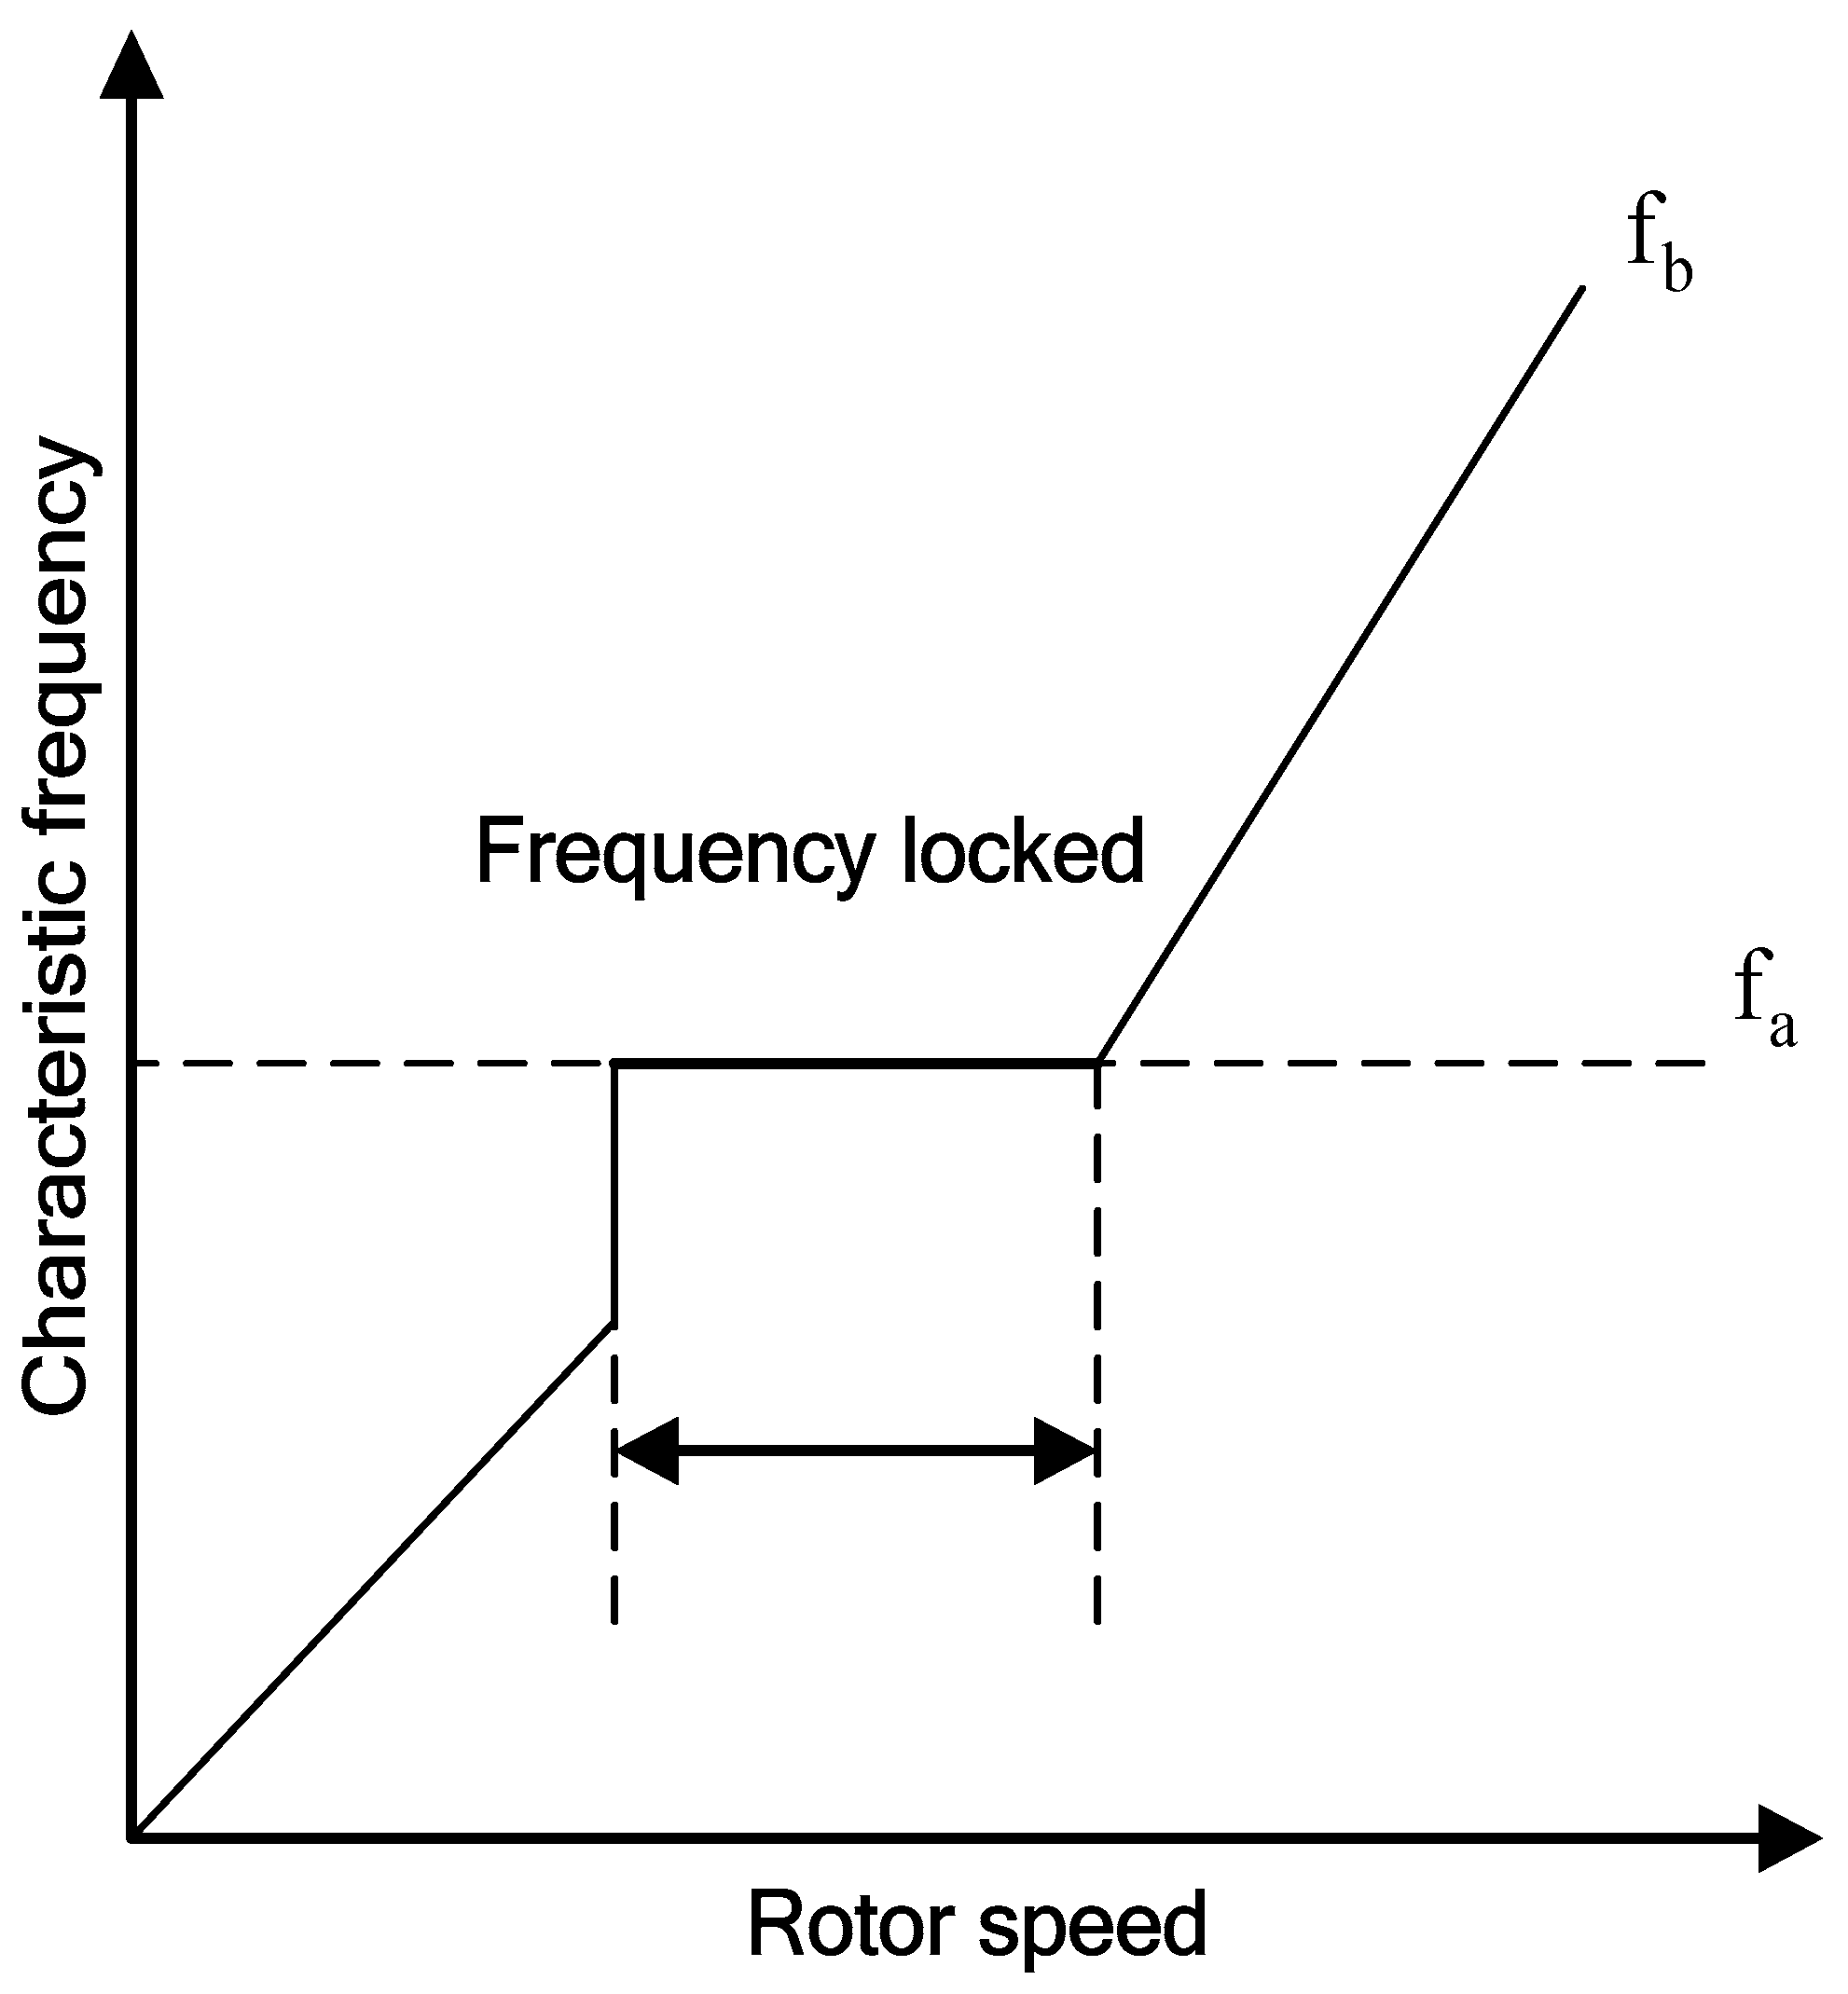
4.3. Characteristics and Mechanism Analysis of Frequency Locked in Acoustic Resonance State

The procession and the characteristic of the acoustic resonances are discussed as follows according to the experimental results from Welsh. The shedding vortex frequency of the trailing edge of the plate grows linearly with the increasing flow velocity. The sound pressure amplitude inside the tube grows abruptly at the flow velocities ranging from 28 m/s to 30 m/s, and in these instants, acoustic resonance occurs in the tube. When the acoustic resonance of the rectangular ducts is excited, the resonance frequency is 530 Hz and the sound pressure level reached a maximum of 145 dB. A particular phenomenon, in which the resonance frequency keeps constant at the flow velocity range of the acoustic resonance, occurs, i.e., the phenomenon of the frequency locked. The variation law of sound pressure frequency and sound pressure level with flow velocity in the literature is shown in Figure 12 [15]. The sound pressure spectrums in the tube are obtained with the flow velocity range from 20 m/s to 35 m/s by calculation, the typical results of these are shown in Figure 13. The variation law of sound pressure frequency and sound pressure level with the intake flow velocity are shown in Figure 14 and Figure 15.
It is obvious that there are high amplitude pure sound components fv and fs in the sound pressure spectrum inside the tube in Figure 14. The high amplitude pure sound component fv is the dominant component of the increasing flow velocity in the sound pressure spectrums, which are also harmonic components. The pure sound component fv grows linearly as the flow velocity increases, which is consistent with the variation of the shedding vortex frequency of the Karman vortex street. Consequently, the source of the pure sound component is the vortex shedding from the flat plate trailing edge. This indicates that the Strouhal number of the shedding vortex is almost constant in this instant, i.e., St = fvd/V = 0.212, which is approximately equal to the calculation results described in the literature [14]. The acoustic modal frequency of the rectangular tube model, i.e., the pure sound component fs = 511 Hz, can be excited at discrete ranges of flow velocity. There is an error of 3.6% between the calculated results and the tube acoustic modal frequency of 530 Hz measured by Welsh. The shedding vortex frequency grows closer to the acoustic modal frequency of the tube with the increasing flow velocity. The dominant component of the sound pressure spectrum is the acoustic modal frequency in the tube substituting the shedding vortex frequency. The amplitude of the sound pressure level grows significantly to a maximum of 145 dB at the flow velocity of 32 m/s. Then, acoustic resonance occurs in the tube. The velocity range where acoustic resonance occurs is 30 m/s–33 m/s, i.e., a frequency locked region with a resonance frequency of 511 Hz. As the flow velocity continues to increase, the separation of the shedding vortex frequency and the acoustic mode frequency occurs, and the amplitude of the sound pressure level decrease significantly, the state of acoustic resonance can not be sustained and then exit. Figure 16 indicates the sound pressure distribution at the resonance frequency of 511 Hz when the onset of acoustic resonance excited in the rectangular tube, the corresponding result in the literature is shown in Figure 17.
The dark blue and dark red regions in Figure 16 and Figure 17 both are high sound pressure areas. The positive and negative sound pressure indicates the relative phase. The sound pressure amplitude above and below the plate is equivalent, and the phase difference is exact 180 degrees. When the onset of acoustic resonance is excited in the rectangular pipe model, the sound pressure distribution is presented in a way of the β mode in Parker resonance. The typical Parker resonance occurrence process is described well by the calculation method in this paper.

5. Conclusions

(1)
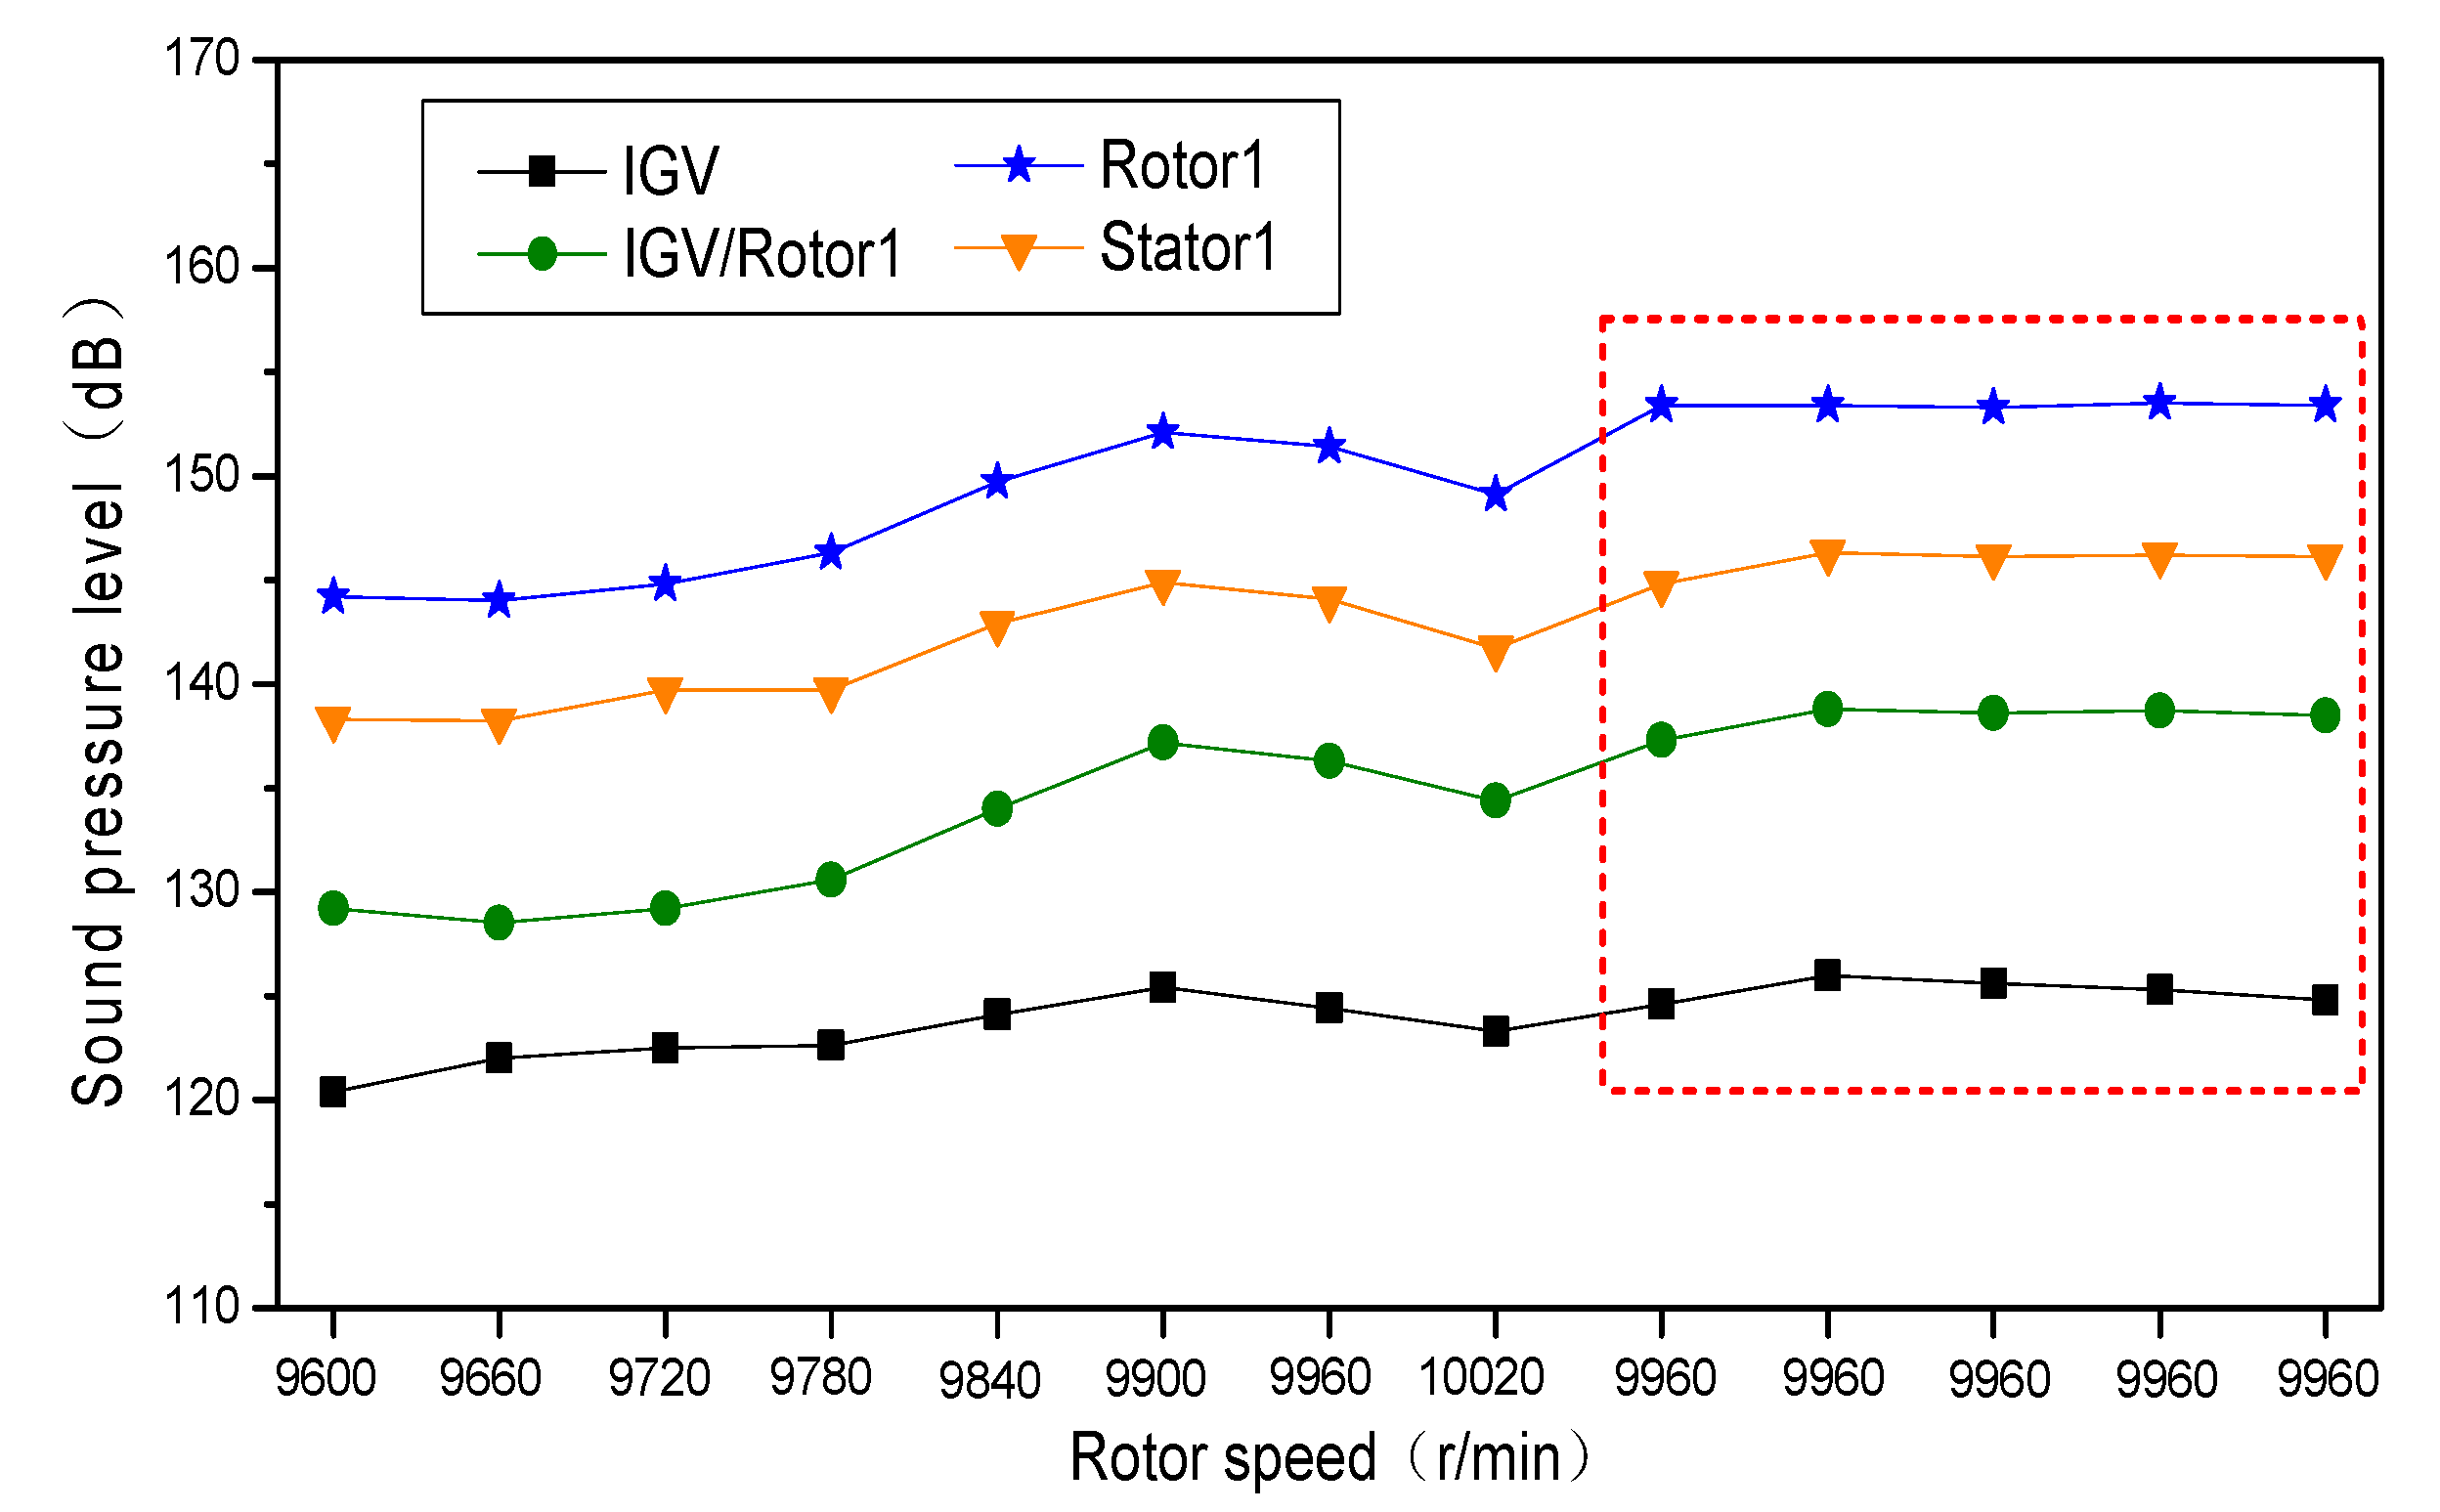
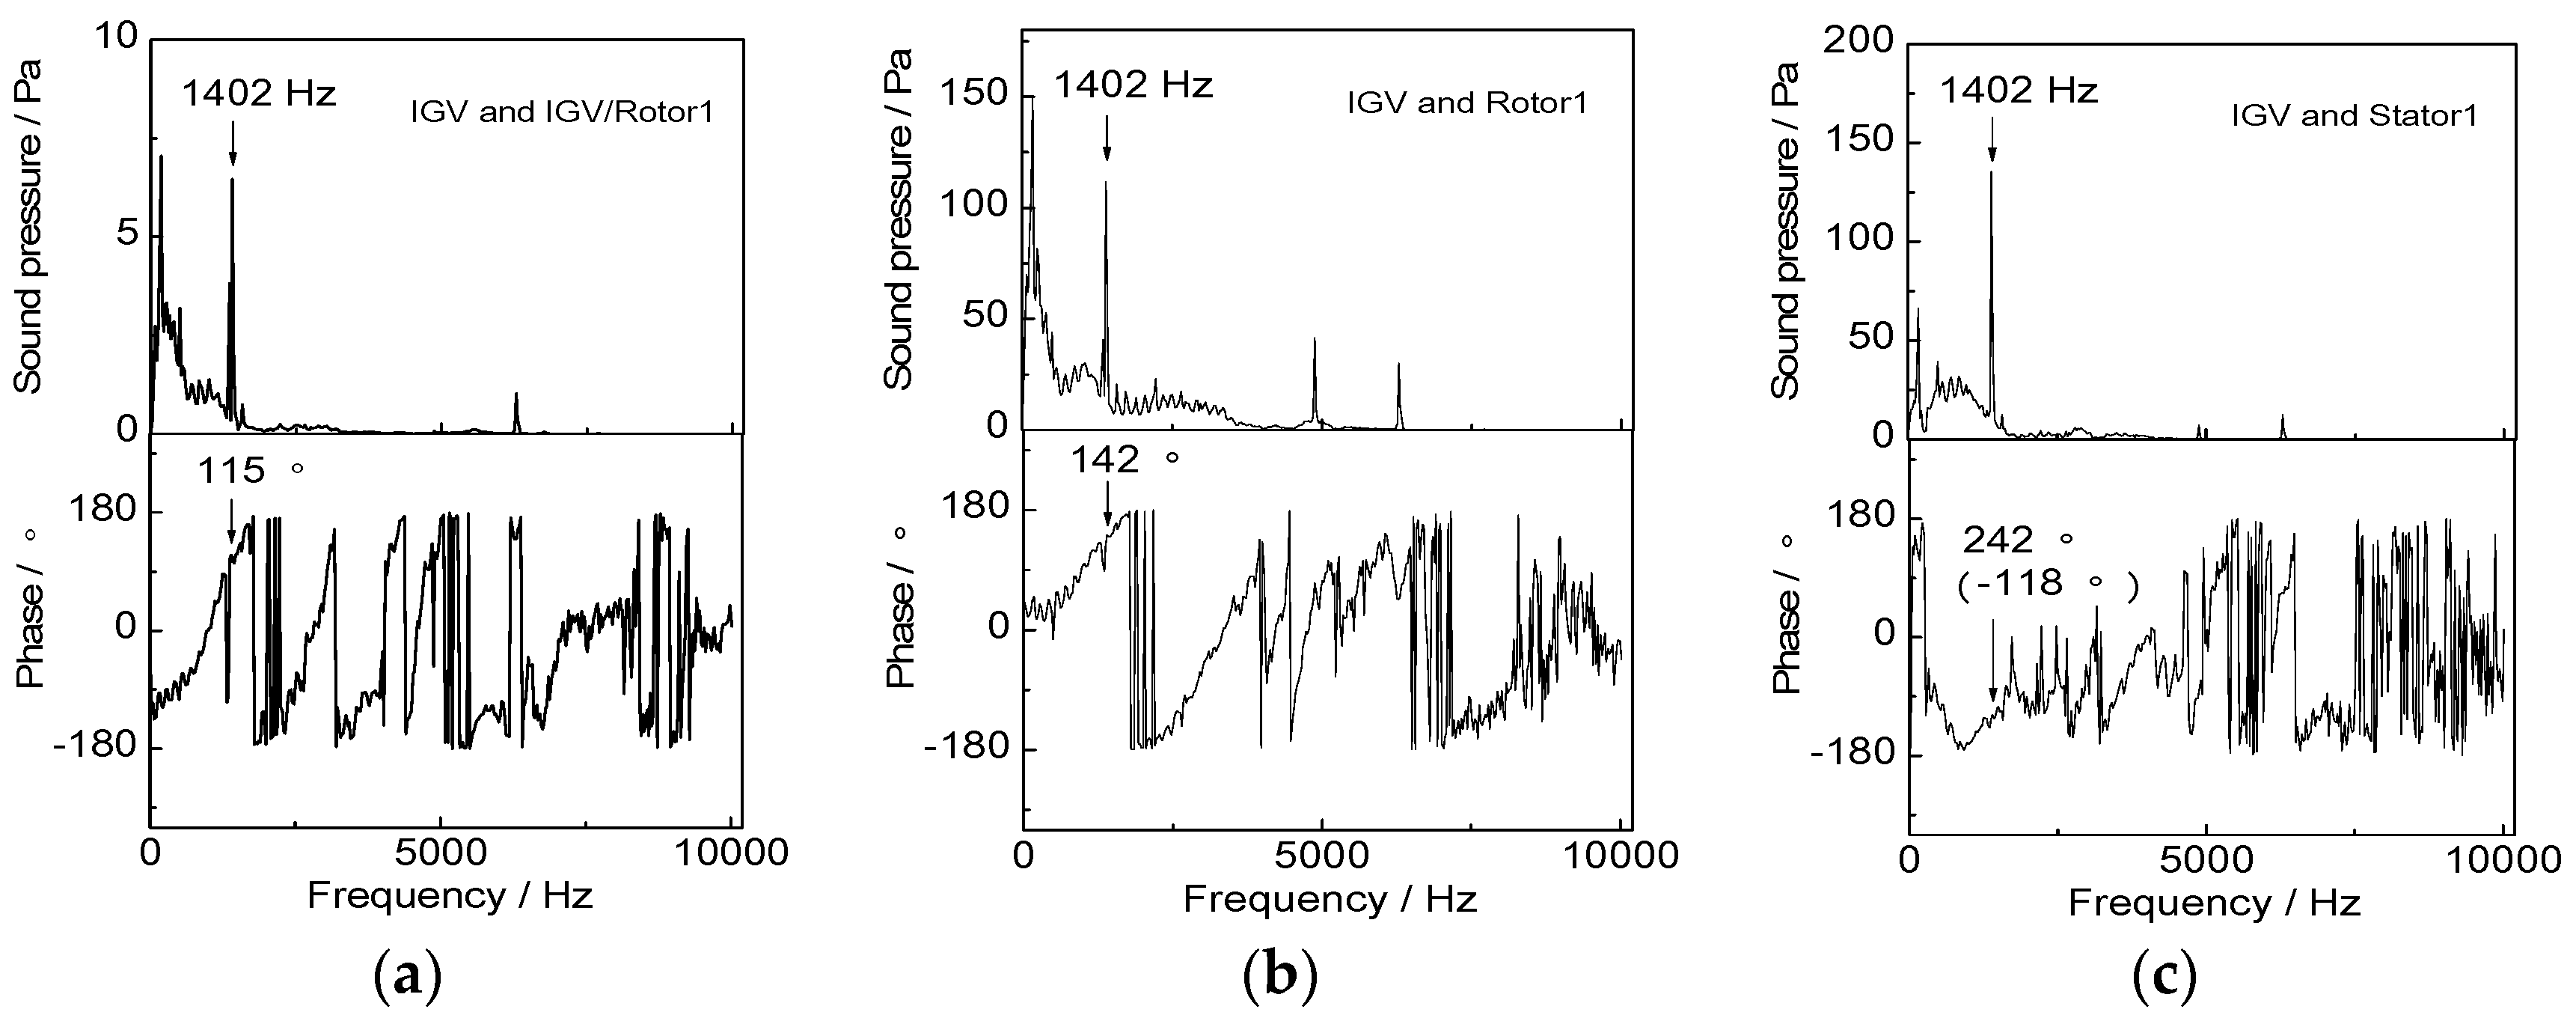
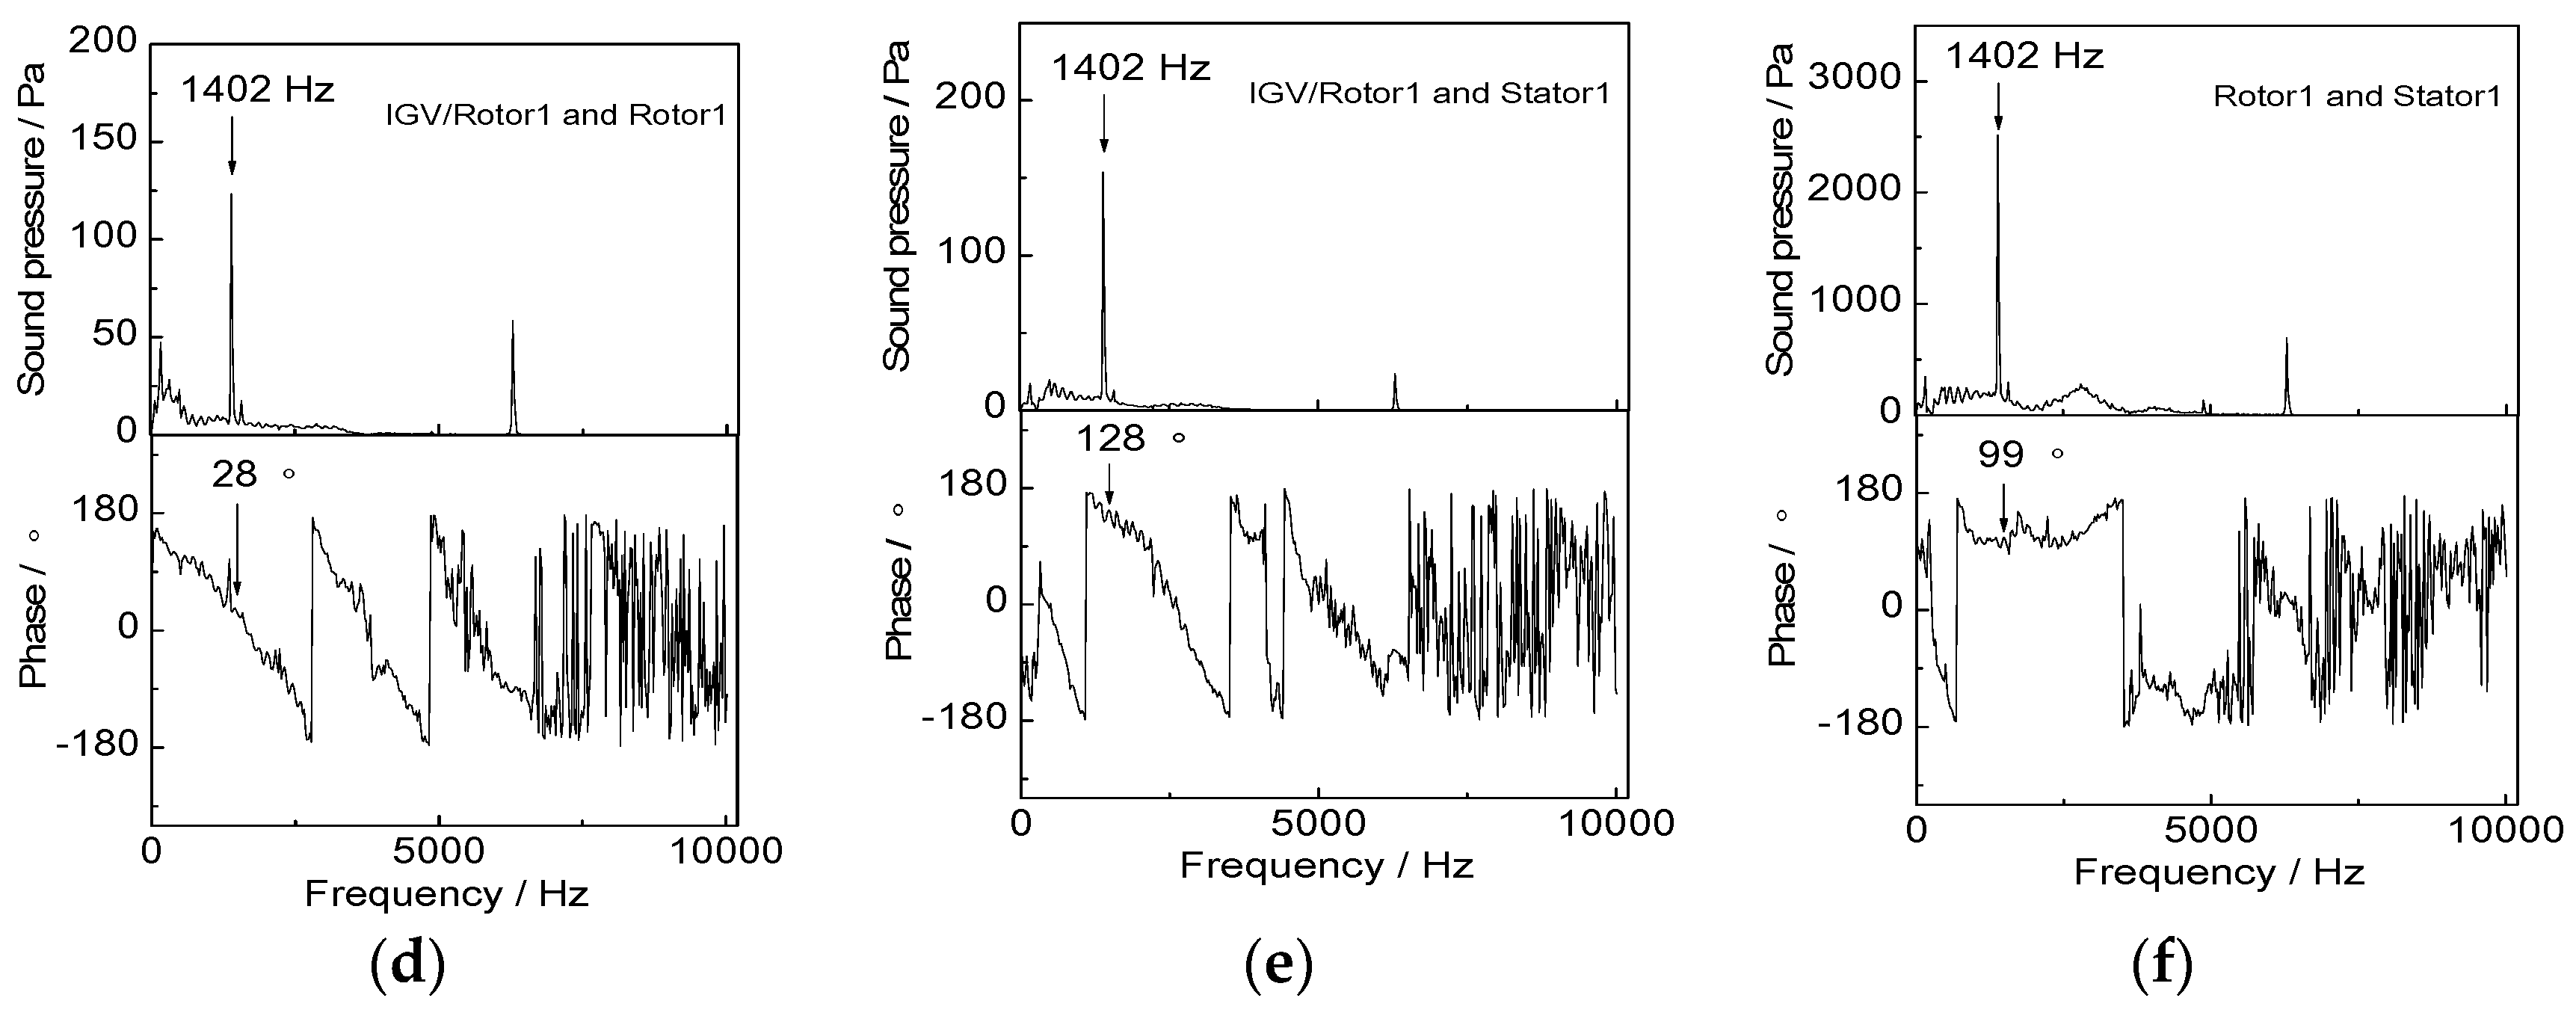
The experimental test of the noise between the stages of the compressor is implemented in this investigation. The internal noise spectrum of the compressor presents typical broadband noise characteristics, and there are several characteristic frequencies with discrete pure sound components. The pure sound component appears at 1402 Hz, when the abnormal vibration of high-amplitude value occurs in Rotor1 of the high-pressure compressor. The sound pressure levels of the noise signals measured at four different measuring points along the axial direction of the compressor at the characteristic frequency of 1402 Hz, before and after the abnormal vibration of Rotor1 of the high-pressure of the compressor occurs, are all the maximum value at the position directly above the measuring point over all rotational speed conditions. When the vibration amplitude of the rotor blade sustains a relatively large value, the sound pressure level of the noise signal measured at all measuring points also reaches the maximum at this characteristic frequency. In addition, the sound pressure level directly above the rotor blade is the highest, which is up to 154 dB.
(2)
The characteristic frequency of 1402 Hz remains constant over a specific speed range, when the high-amplitude vibration of Rotor1 of the high-pressure compressor of the engine occurs, i.e., the phenomenon of “frequency-locked”. The characteristic frequency sound signal is the same sound wave at the different axial positions of the compressor, and its propagation state in the compressor flow channel is a helix structure. The characteristic above is consistent with the features when the onset of acoustic resonance is excited in the compressor. The work presented in this research can provide data basis for the analysis of the vibration mechanism of the compressor rotor blades, and provide the guidance for the application of acoustic methods in the engineering field for the condition monitoring and structural troubleshooting of a compressor.
(3)
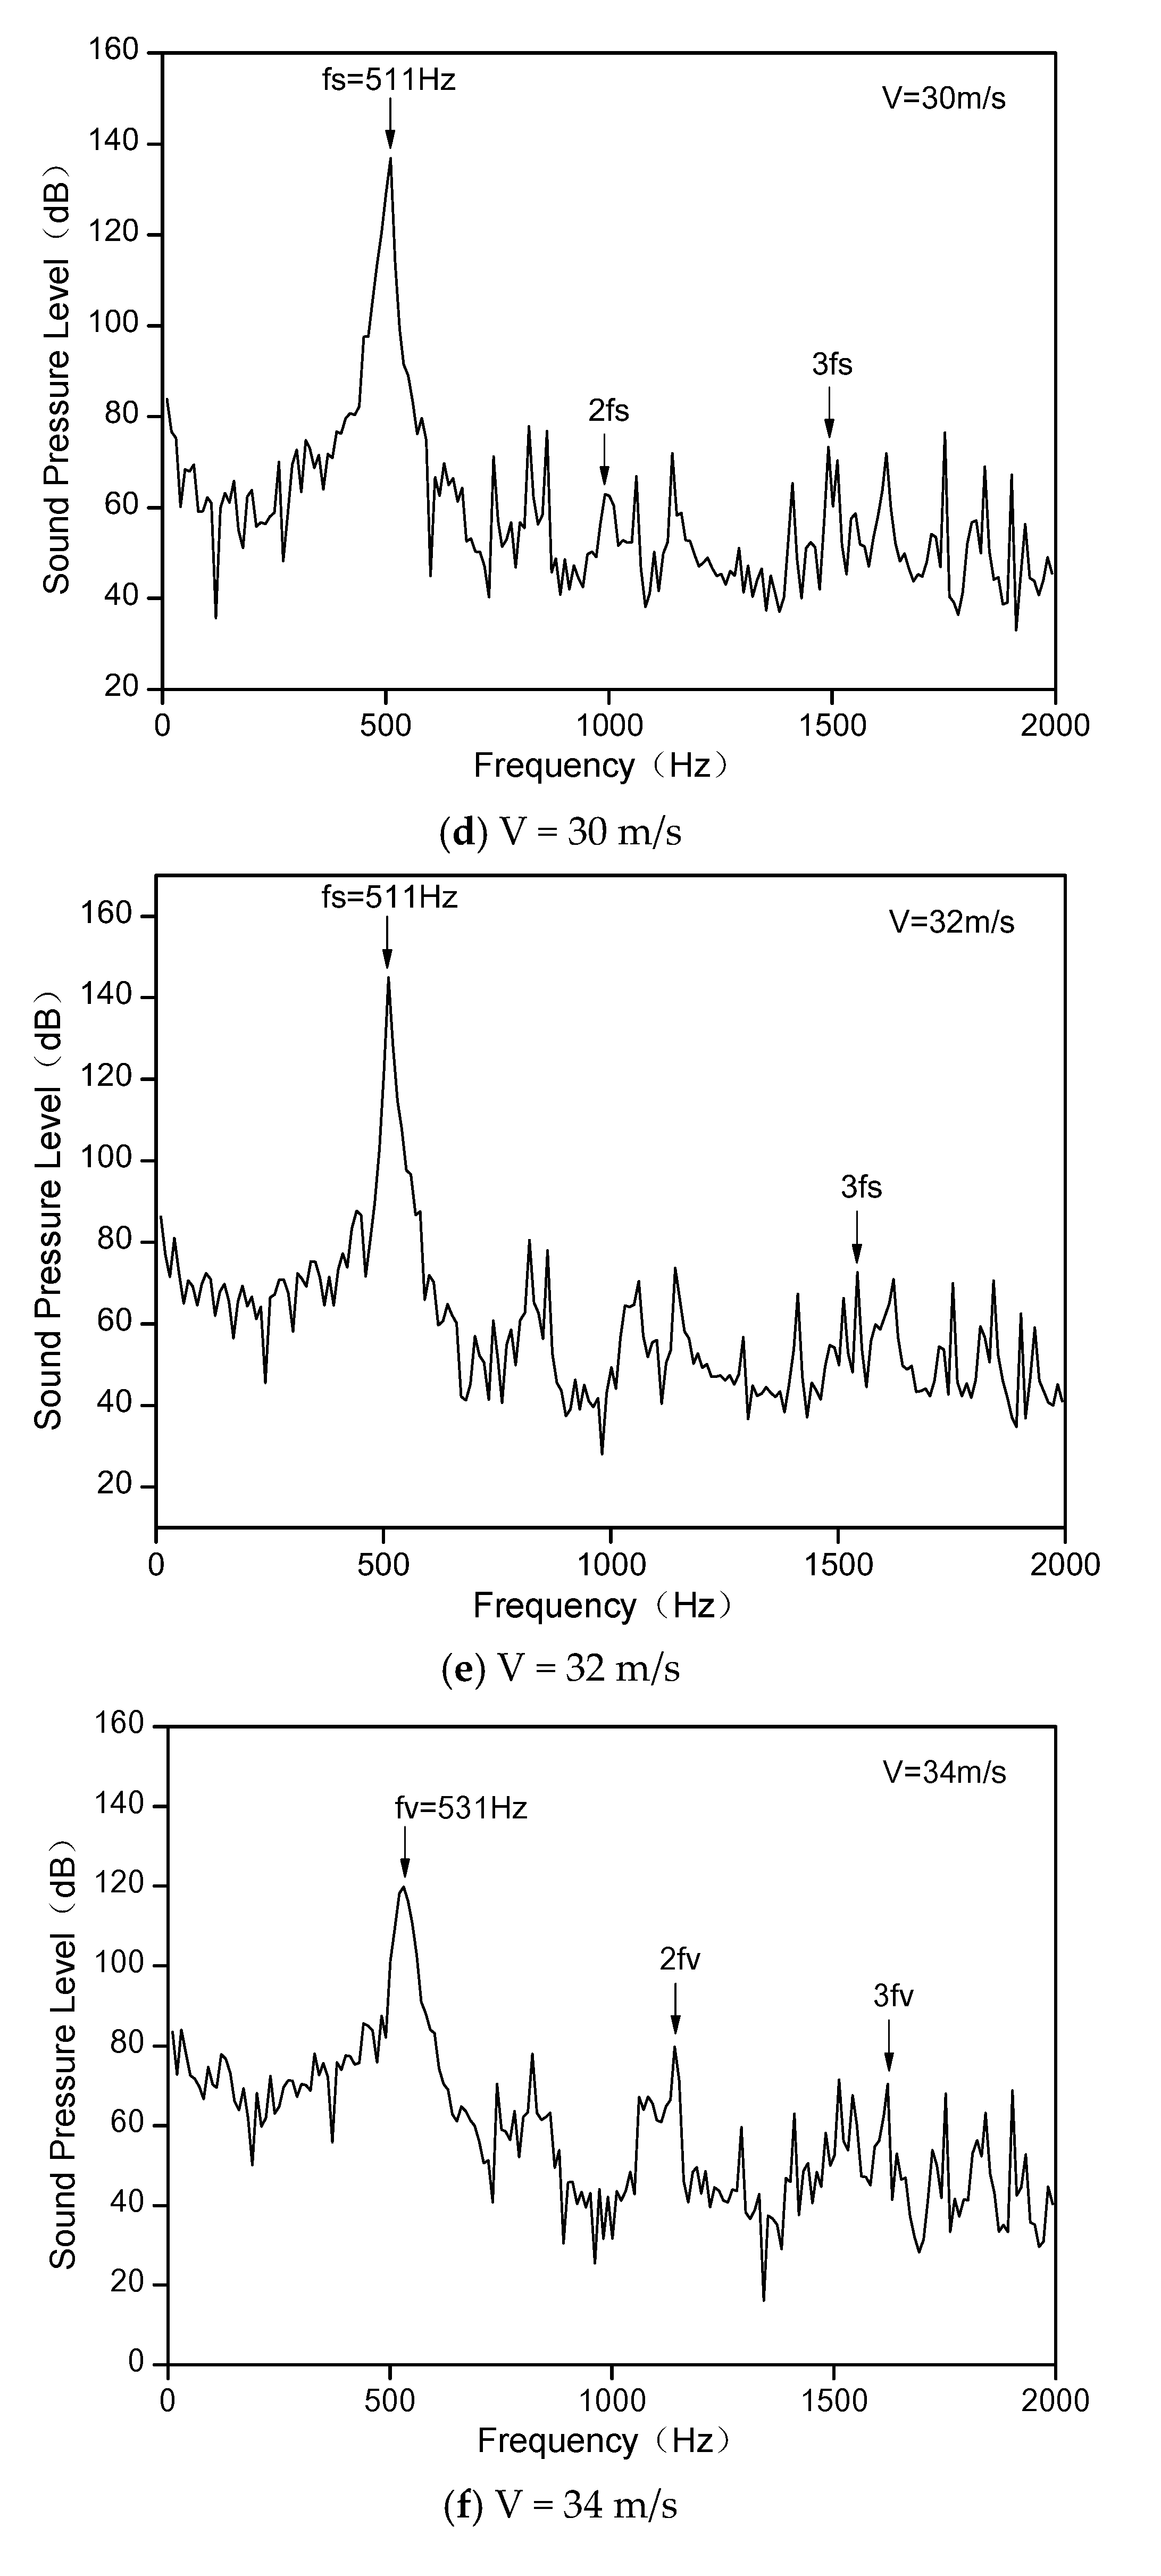
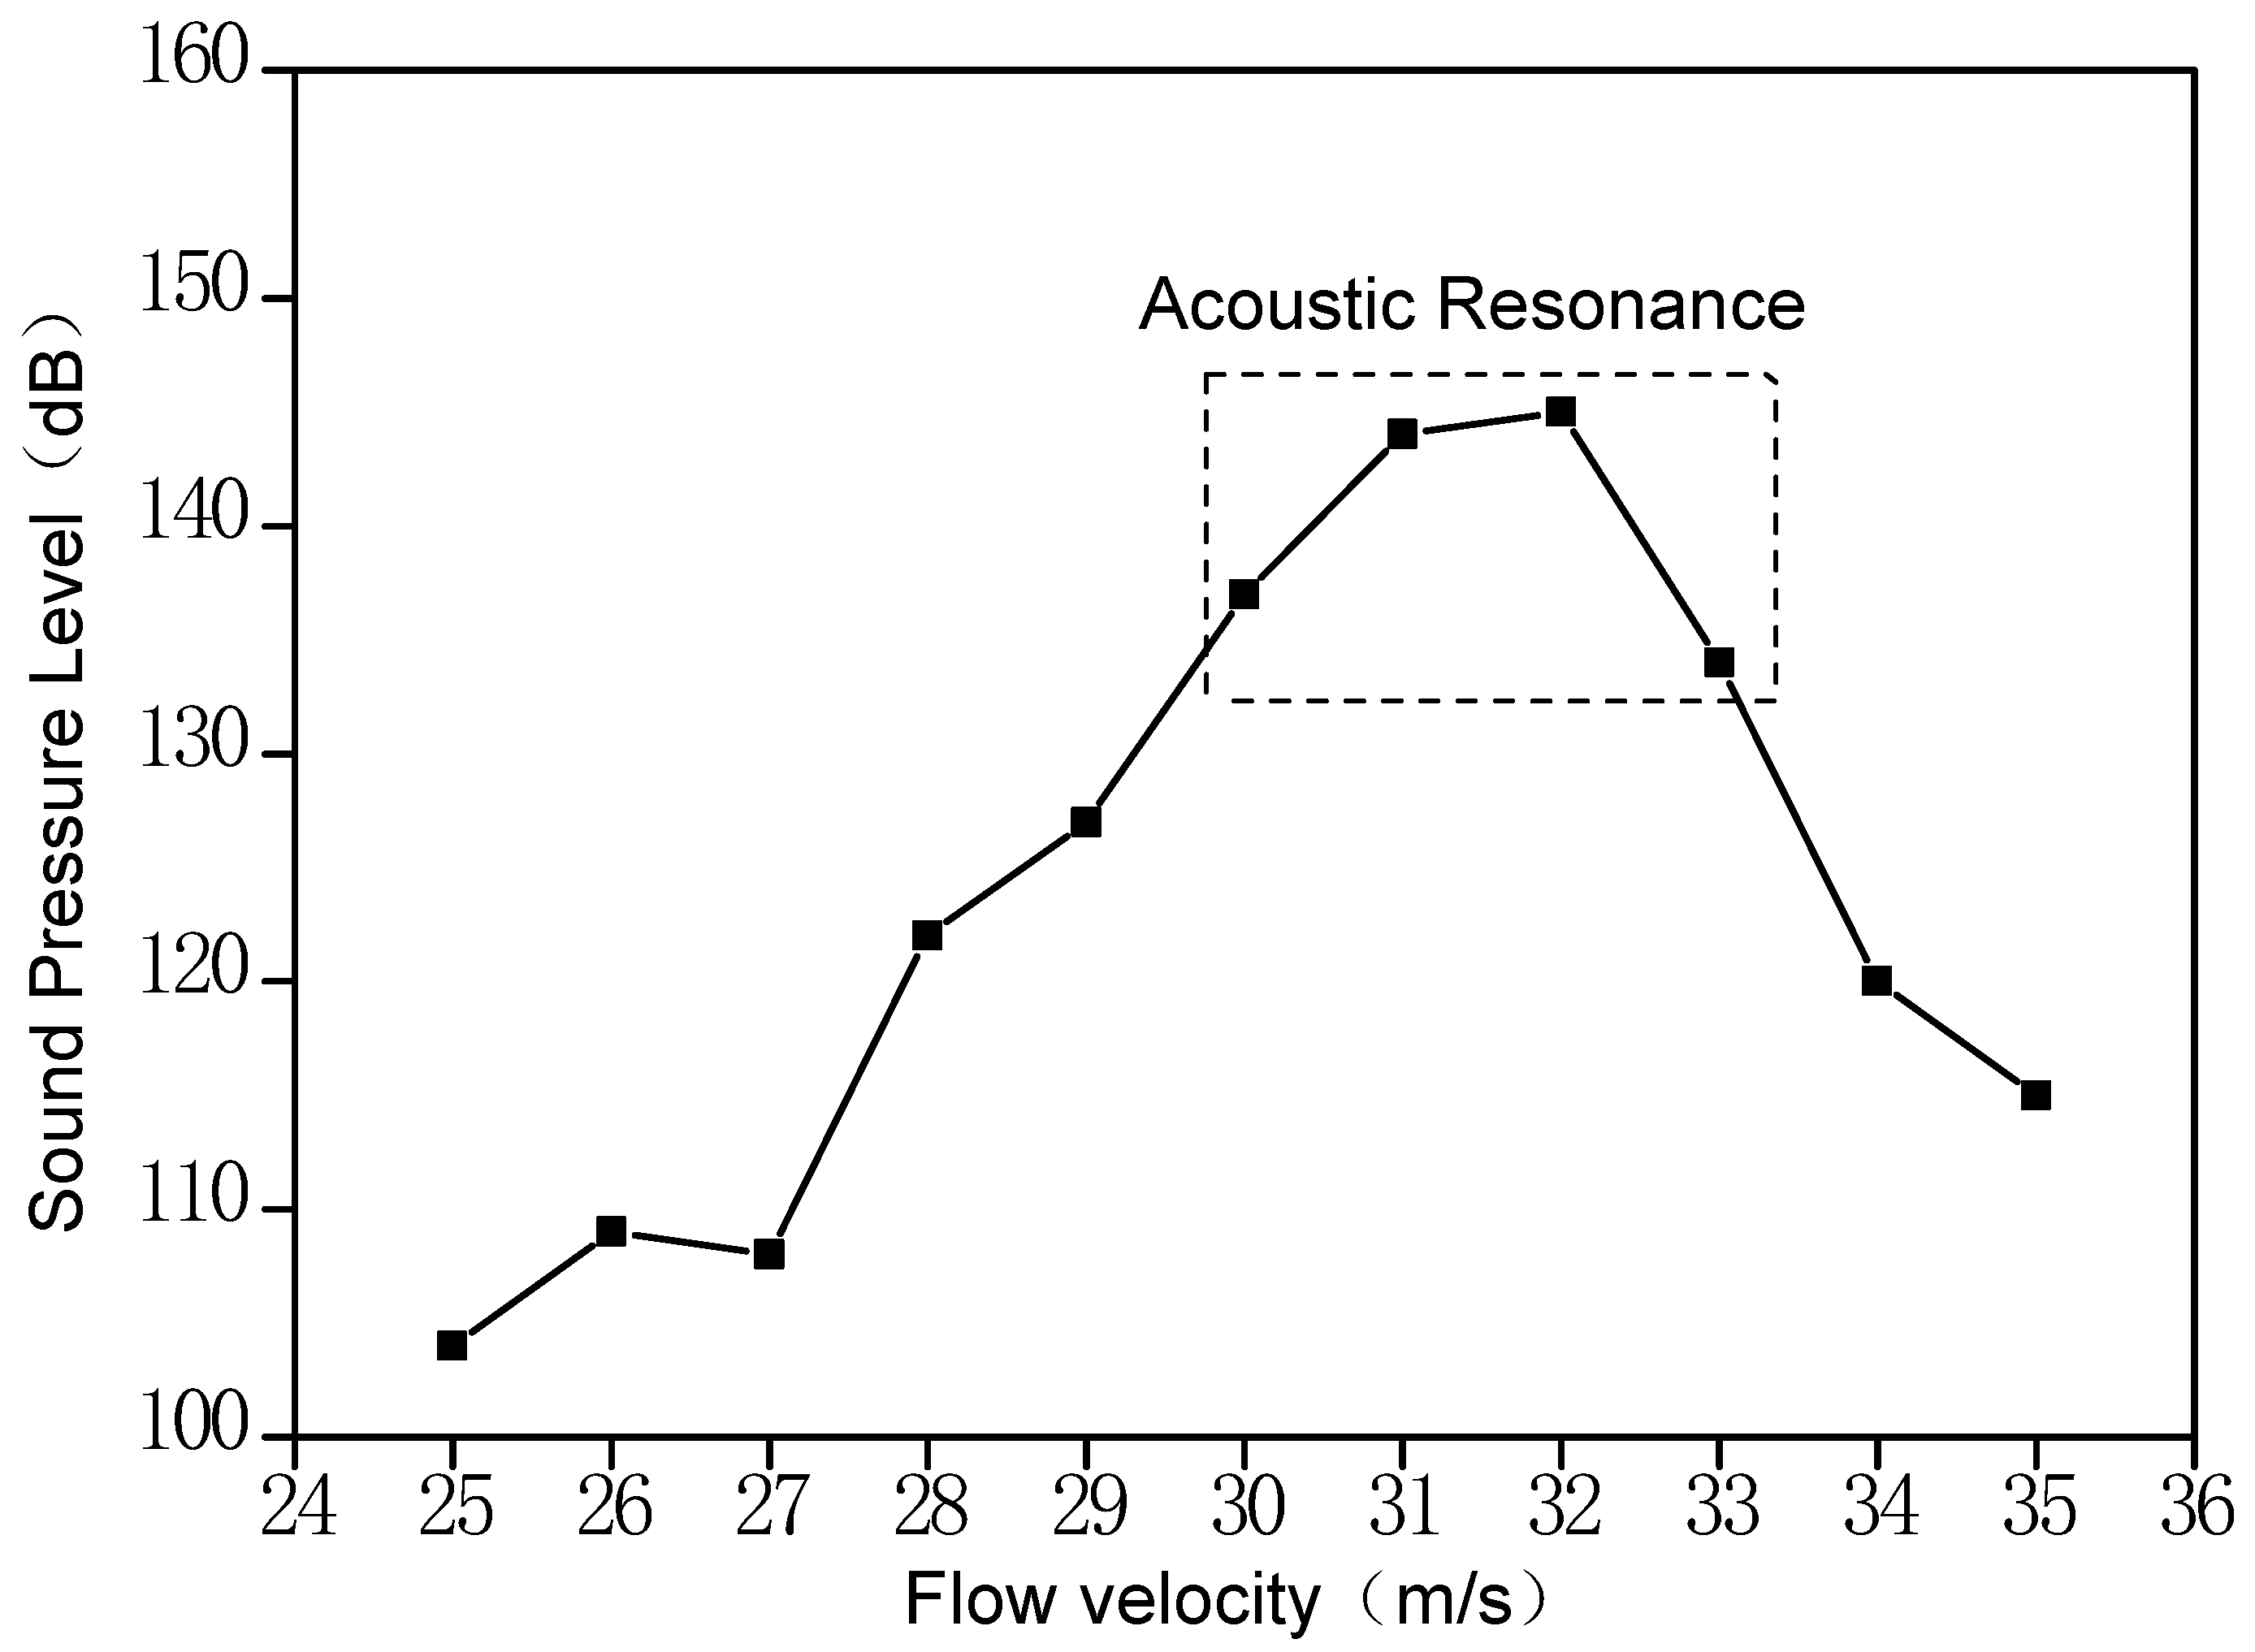
The typical Parker resonance regime occurs in the rectangular tube model by the calculation method proposed in the paper, which characterizes the distribution characteristics of the shedding vortices at the acoustic resonance condition in detail. The acoustic resonance frequency of the tube coincided with the corresponding result in the literature. The resonance frequency error between the calculation result and the result in reference is 3.6%. Additionally, the “frequency locking” feature and β mode of acoustic resonance are captured. The acoustic analogy method is suitable for the characterization of the mechanism of pipeline acoustic resonance over the flow conditions of low Mach number and high Reynolds number. In addition, the typical characteristics of a compressor can be captured effectively at the onset of acoustic resonance. The research method can provide certain method guidance for the research on the mechanism of acoustic resonance of aeroengine compressors.

Author Contributions

Conceptualization, F.Z. and B.C.; methodology, F.Z.; software, B.C., F.W. and M.Y.; validation, F.Z. and S.J.; formal analysis, F.W. and M.Y.; investigation, S.J. and Y.C.; resources, F.W., S.J. and M.Y.; data curation, F.Z.; writing—original draft preparation, F.Z. and B.C.; writing—review and editing, F.Z. and B.C. All authors have read and agreed to the published version of the manuscript.

Funding

This research was supported by the China Aviation Development Shenyang Engine Research Institute for the experimental test of compressor noise. And it was supported by Basic Research Project of the Science and Technology Department of Liaoning Province (No. JYT2020009), Scientific Research Foundation for Introduced Scholars of Shenyang Aerospace University (No. 21YB01), Liaoning Natural Science Foundation Guiding Plan of China (No. 2019-ZD-0237).

Institutional Review Board Statement

Not applicable.

Informed Consent Statement

Not applicable.

Data Availability Statement

Not applicable.

Acknowledgments

This research was supported by China Aviation Development Shenyang Engine Research Institute for the experimental test of compressor noise. And it was supported by Basic Research Project of the Science and Technology Department of Liaoning Province (No. JYT2020009), Scientific Research Foundation for Introduced Scholars of Shenyang Aerospace University (No. 21YB01), Liaoning Natural Science Foundation Guiding Plan of China (No. 2019-ZD-0237).

Conflicts of Interest

The authors declare no conflict of interest.

References

  1. Hellmich, B.; Seume, J.R. Causes of acoustic resonance in a high-speed axial compressor. J. Turbomach. 2008, 130, 031003–031011. [Google Scholar] [CrossRef]
  2. Ziada, S.; Oengoren, A.; Vogel, A. Acoustic resonance in the inlet scroll of a turbo-compressor. J. Fluids Struct. 2002, 16, 361–373. [Google Scholar] [CrossRef]
  3. Department of Defense Handbook. In Engine Structural Integrity Program (ENSIP); MIL-HDBK-1783B; Department of Defense: Washington, DC, USA, 2004.
  4. Parker, R. An investigation of acoustic resonance effects in an axial flow compressor stage. J. Sound Vib. 1968, 8, 281–297. [Google Scholar] [CrossRef]
  5. Legerton, M.L.; Stoneman, S.A.; Parker, R. An experimental investigation into flow induced acoustic resonances in an annular cascade. In Proceedings of the 5th International Conference on Flow induced Vibrations, Brighton, UK, 20–22 May 1991. [Google Scholar]
  6. Weidenfeller, J.; Lawerenz, M. Time resolved measurements in an annular compressor cascade with high aerodynamic loading. In Proceedings of the ASME Turbo Expo 2002: Power for Land, Sea, and Air, Amsterdam, The Netherlands, 3–6 June 2002; pp. 751–758. [Google Scholar]
  7. Cyrus, V.; Rehak, K.; Polansky, J. Aerodynamic causes of stator vanes damage of the Alstom as turbine compressor in the gasification combined cycle using brown coal. In Proceedings of the 6th conference on Turbomachinery: Fluid Dynamics and Thermodynamics, Lille, France, 7–11 May 2005. [Google Scholar]
  8. Camp, T.R. A study of acoustic resonance in a low-speed multistage compressor. J. Turbomach. 1999, 121, 36–43. [Google Scholar] [CrossRef]
  9. Zhao, F.; Yan, M.; Jing, X.; Wang, D.; Sha, Y.; Liu, Y. Physical Model for Acoustic Resonance in the Annular Cavity Structure. Chin. J. Aeronaut. 2020, 33, 3228–3237. [Google Scholar] [CrossRef]
  10. Parker, R. Resonance effects in wake shedding from parallel plates: Some experimental observations. J. Sound Vib. 1966, 4, 62–72. [Google Scholar] [CrossRef]
  11. Parker, R. Resonance effects in wake shedding from parallel plates: Calculation of resonant frequencies. J. Sound Vib. 1967, 5, 330–343. [Google Scholar] [CrossRef]
  12. Parker, R. Resonance effects in wake shedding from compressor blade. J. Sound Vib. 1967, 6, 302–309. [Google Scholar] [CrossRef]
  13. Parker, R.; Griffiths, W. Low frequency resonance effect in wake shedding from parallel plates. J. Sound Vib. 1968, 7, 371–379. [Google Scholar] [CrossRef]
  14. Clements, R. An inviscid model of two-dimensional vortex shedding. J. Fluid Mech. 1973, 57, 321–336. [Google Scholar] [CrossRef]
  15. Yokoyama, H.; Kitamiya, K.; Iida, A. Flows around a cascade of flat plates with acoustic resonance. Phy. Fluids 2013, 25, 106104. [Google Scholar] [CrossRef] [Green Version]
  16. Welsh, M.; Stokes, A.; Parker, R. Flow-resonant sound interaction in a duct containing a plate, part 1: Semi-circular leading egde. J. Sound Vib. 1984, 95, 305–323. [Google Scholar] [CrossRef]
  17. Reyes, E.; Finnegan, S.; Meskell, C. Simulation of flow-induced acoustic resonance of bluff bodies in duct. In Proceedings of the ASME 2010 3rd Joint US-European Fluids Engineering Summer Meeting collocated with 8th International Conference on Nanochannels, Microchannels, and Minichannels, Montreal, QC, Canada, 1–5 August 2010; pp. 805–813. [Google Scholar]
  18. Thompson, M.; Hourigan, K.; Welsh, M. Prediction of vortex shedding from bluff bodies in the presence of a sound field. Fluid Dyn. Res. 1988, 3, 349–352. [Google Scholar] [CrossRef]
  19. Tan, B.; Thompson, M.; Hourigan, K. Sources of acoustic resonance generated by flow around a long rectangular plate in a duct. J. Fluid Struct. 2003, 18, 729–740. [Google Scholar] [CrossRef]
  20. Katasonov, M.M.; Sung, H.J.; Bardakhanov, S.P. Wake flow-induced acoustic resonance around a long flat plate in a duct. J. Eng. Thermophys. 2015, 24, 36–56. [Google Scholar] [CrossRef]
  21. Courtiade, N.; Ottavy, X. Experimental study of surge precursors in a high-speed multistage compressor. J. Turbomach. 2013, 135, 061018. [Google Scholar] [CrossRef] [Green Version]
  22. Cooper, A.J.; Peake, N. Trapped acoustic modes in aeroengine intakes with swirling flow. J. Fluid Mech. 2000, 419, 151–175. [Google Scholar] [CrossRef]
  23. Han, L.; Li, P.Y.; Yu, S.J.; Chen, C.; Fei, C.W.; Lu, C. Creep/fatigue accelerated failure of Ni-based superalloy turbine blade: Microscopic characteristics and void migration mechanism. Inter. J. Fatigue 2022, 154, 106558. [Google Scholar] [CrossRef]
  24. Han, L.; Wang, Y.B.; Zhang, Y.; Lu, C.; Fei, C.W.; Zhao, Y.J. Competitive cracking behavior and microscopic mechanism of Ni-based superalloy blade respecting accelerated CCF failure. Inter. J. Fatigue 2021, 150, 106306. [Google Scholar] [CrossRef]
  25. Curle, N. The influence of solid boundaries upon aerodynamic sound. Proc. R. Soc. London. Ser. A Math. Phys. Sci. 1955, 231, 505–514. [Google Scholar]
  26. Moin, P.; Mahesh, K. Direct numerical simulation: A tool in turbulence research. Ann. Rev. Fluid Mech. 1998, 30, 539–578. [Google Scholar] [CrossRef] [Green Version]
  27. Fei, C.W.; Liu, H.T.; Patricia Liem, R.; Choy, Y.; Han, L. Hierarchical model updating strategy of complex assembled structures with uncorrelated dynamic modes. Chin. J. Aeronaut. 2022, 135, 281–296. [Google Scholar] [CrossRef]
  28. Howe, M.S. Theory of Vortex Sound; Cambridge University Press: Cambridge, UK, 2003. [Google Scholar]
  29. Escobar, M. Finite Element Simulation of Flow-Induced Noise Using Lighthill’s Acoustic Analogy; Erlangen Nurnberg University: Erlangen, Germany, 2007. [Google Scholar]
  30. Inoue, O.; Hatakeyama, N. Sound generation by a two-dimensional circular cylinder in a uniform flow. J. Fluid Mech. 2002, 471, 285–314. [Google Scholar] [CrossRef]
  31. Cianferra, M.; Ianniello, S.; Armenio, V. Assessment of methodologies for the solution of the Ffowcs Williams and Hawkings equation using LES of incompressible single-phase flow around a finite-size square cylinder. J. Sound Vib. 2019, 453, 1–24. [Google Scholar] [CrossRef]
  32. Georgiadis, N.J. Large-eddy simulation: Current capabilities, recommended practices, and future research. AIAA J. 2010, 48, 1772–1784. [Google Scholar] [CrossRef]
  33. Smagorinsy, J. General circulation experiments with the primitive equations. Mon. Weather Rev. 1963, 91, 99–164. [Google Scholar] [CrossRef]
  34. Wegner, M.A.; Nance, D.; Ahuja, K. Characterization of short and infinite-line pressure probes for in-duct acoustic measurements under hostile environment. In Proceedings of the 28th AIAA Aeroacoustics Conference, Rome, Italy, 21–23 May 2007. [Google Scholar]
Figure 1. Schematic diagram of measurement system.
Applsci 12 04956 g001
Figure 2. Diagram of noise measurement positions.
Applsci 12 04956 g002
Figure 3. Diagram of rotor blade vibration measurement positions.
Applsci 12 04956 g003
Figure 4. The change of noise signal spectrum before and after rotor blade abnormal vibration.
Applsci 12 04956 g004
Figure 5. Distribution of sound pressure level at 1402 Hz of noise signals at different measurement positions.
Applsci 12 04956 g005
Figure 6. Correspondence between characteristic frequency of noise spectrum and rotor speed.
Applsci 12 04956 g006
Figure 7. Cross-spectrum analysis about characteristic frequency noise. (a) The position of IGV and IGV/Rotor1. (b) The position of IGV and Rotor1. (c) The position of IGV and stator1. (d) The position of IGV/Rotor1 and Rotor1. (e) The position of IGV and Stator1. (f) The position of Rotor1 and Stator1.
Applsci 12 04956 g007aApplsci 12 04956 g007b
Figure 8. Diagram of calculation model.
Applsci 12 04956 g008
Figure 9. Flow field calculation model of plate wake.
Applsci 12 04956 g009
Figure 10. Sound field calculation model of plate wake.
Applsci 12 04956 g010
Figure 11. Motion law of plate wake vortex. (a) Present result. (b) Reference result [16].
Applsci 12 04956 g011
Figure 12. Variation laws of sound pressure frequency and sound pressure level with inlet flow velocity in the literature [16].
Applsci 12 04956 g012
Figure 13. Sound pressure spectrum in the pip under different flow velocities.
Applsci 12 04956 g013aApplsci 12 04956 g013bApplsci 12 04956 g013c
Figure 14. Variation law of sound pressure frequency under different flow velocities.
Applsci 12 04956 g014
Figure 15. Variation law of sound pressure level under different flow velocities.
Applsci 12 04956 g015
Figure 16. The sound pressure distribution of the acoustic resonance frequency at 511 Hz in present result.
Applsci 12 04956 g016
Figure 17. The sound pressure distribution when acoustic resonance occurs in reference result [16].
Applsci 12 04956 g017
Table 1. Distribution of sound pressure level at 1402 Hz of noise signals at different measurement positions.
Rotor Speed
(r/min)
IGV
(dB)
IGV/Rotor1
(dB)
Rotor
(dB)
Stator1
(dB)
9600120.4129.2144.2138.3
9660122.0128.5144.0138.2
9720122.5129.2144.8139.7
9780122.6130.6146.3139.7
9840124.1134.0149.7142.9
9900125.4137.2152.1144.9
9960124.4136.3151.4144.1
10,020123.3134.4149.1141.7
9960124.6137.3153.4144.8
9960126.0138.8153.4146.3
9960125.6138.6153.3146.1
9960125.3138.7153.5146.2
9960124.8138.5153.4146.1
Table 2. Phase difference of characteristic frequency of noise signal at different measurement positions.
Phase/°IGVIGV/Rotor1Rotor1Stator1
IGV-115142242
IGV/Rotor1–115-28128
Rotor1–142–28-99
Stator1–242–128–99-
Publisher’s Note: MDPI stays neutral with regard to jurisdictional claims in published maps and institutional affiliations.

