1. Introduction
1.1. Research Background
As a kind of multipurpose composite material, concrete is widely used because of its easy access, low price, and advantages of good mechanical strength and high plasticity in structure and engineering [
1,
2,
3]. However, due to the main bonding effect of cement hydration products, its inherent weakness is that the whole is nearly brittle and easy to crack [
4,
5]. In order to solve this problem, to improve the crack prone defects of concrete, researchers add fibers into the concrete matrix to improve the performance of each phase of concrete [
6,
7]. At present, the research on the incorporation of fibers into concrete has been quite mature. The more commonly used fibers include steel fiber [
8,
9], carbon fiber [
10,
11], basalt fiber [
12,
13], and organic fiber [
14,
15]; these fibers have greatly improved the performance of concrete.
Shi [
16] studied the cracking problem of hybrid fiber concrete with basalt fiber and organic fiber in terms of compressive strength. Pourbaba [
17] and others compared the compressive performance of concrete with the age of concrete as the main starting point. Orouji and Bakar [
18,
19,
20] and others conducted an in-depth analysis and exploration of various indexes of glass fiber-reinforced concrete and carbon fiber-reinforced concrete from many aspects of flexural strength.
As a new material, aluminum oxide fiber is mainly used to increase the high temperature resistance and wear resistance of ceramic matrixes and metal matrixes, while there is little research on its application in concrete matrixes. Krishnaveni et al. [
21,
22] selected the nano material, alumina, that is the most added to concrete, and explored the problem of filling cracks in concrete with alumina on a nano scale. Xiong et al. [
23] used nano alumina as the modified material of foaming agent to explore the mechanical strength and durability of concrete under different foaming agents. Shokravi et al. [
24] took alumina additive as the main variable in a concrete test to study the mechanical properties of concrete and related properties of the concrete mixing process to a certain extent. It was found that nano alumina and alumina powder are the main forms of alumina-type materials to improve the performance of concrete, and there are few studies on the modification of aluminum oxide fiber to the concrete matrix.
The constitutive relation is an expression of the properties of concrete. The properties of concrete under different modification conditions, different service environments, different load types, and duration will change under the action of individual or coupling. Liao et al. [
25] established the relationship of ion diffusion in concrete with sulfate erosion as the main environmental variable. Zhao, Z. and other researchers [
26,
27] constructed the constitutive relationship of modified concrete under two stress states of compression and tension, took the crack and stress of fiber-reinforced concrete as the main component object, and established a relevant model according to elastic theory. Gao, F. et al. [
28] established relevant models for the anti-penetration effect of modified concrete. The model was built with state formulas and concrete, nonlinear criterion, and verified the penetration theoretical model with a variety of parameters.
1.2. Research Significance
In the field of fiber-modified concrete, at present, a large number of studies mainly focus on quasi-static tests at a low strain rate, while there are relatively few tests at a high strain rate. Taking a concrete building structure as an example, during its service period, static load is the main load type of concrete, but in order to ensure the normal use of concrete structures, a variety of sudden factors need to be taken into account. War and natural disaster factors will produce dynamic loads on concrete structures. It is necessary to improve the damage resistance of concrete under dynamic loads, protect personnel safety, and prevent property losses. Exploring the action law of alumina fiber under dynamic load in concrete matrixes, carrying out corresponding tests, and constructing an impact compression constitutive model of alumina fiber concrete can enrich the theoretical research basis of modified concrete and provide more materials for building structures in the process of resisting impact load. By observing the impact resistance of alumina fiber to concrete structures, optimizing and improving the original basic model, and establishing an impact compression constitutive model of alumina fiber concrete, we hope to contribute significantly to research in this field.
1.3. Research Program
The research plan adopted in this paper is to take 8 mm as the basic length of aluminum oxide fiber added into concrete, and select different fiber contents (0.1, 0.2%, 0.3%, 0.4% and 0.5%) as the independent variables of this test. Six test groups were set up: plain concrete specimen PCCY test group (without fiber mixed), 1ACCY (fiber volume content is 0.1%), 2ACCY (fiber volume content is 0.2%), 3ACCY (fiber volume content is 0.3%), 4ACCY (fiber volume content is 0.4%), and 5ACCY (fiber volume content is 0.5%), respectively. A low strain rate quasi-static test and a high strain rate impact compression test were carried out for these six test groups. The test results and the shape of the specimen after crushing are discussed and analyzed, and a dynamic constitutive model of residual stress based on damage is established to verify and supplement the test results.
2. Materials and Methods
2.1. Raw Materials
In this test, the material used to prepare concrete specimens is 42.5R P·O Portland cement, manufactured by Henan Kehui cement group, with specific surface area of 358 m
2/kg, a density of 3.14 g/cm
3, and a fineness of: (80 μm sieve residue) 4.3%. River sand produced by Chongqing Yuhong building materials is selected, with fineness modulus of 2.60, apparent density of 2640 kg/m
3, bulk density of 1430 kg/m
3, and mud content of 0.9%. The gravel used shall be configured according to the proportion of large gravel accounting for 70% and small gravel accounting for 30%. The correlation between the two kinds of gravel can be seen in
Table 1.
Conventional aluminum oxide fibers are mostly in the form of soft cotton wadding. The length of fibers is variable, and they are gathered into clusters. When they are mixed into concrete, the concrete will be weakened, because the fibers cannot be dispersed. Therefore, the aluminum oxide fiber in this paper is 312,900 d Nextel aluminum oxide fiber produced by 3 M company in the United States. The alumina content of the fiber is 75%, the silica content is 25%, and the monofilament diameter is 5.26 μm. The elongation at break of monofilament is 5.75%, and the density is 3.21/cm
3. After preparation, the specimen was 100 mm in diameter and 50 mm in height (as shown in
Figure 1). In order to eliminate the influence of the uneven surface of the specimen, the surface of the specimen was polished.
2.2. Test Equipment and Method
The split Hopkinson pressure bar (SHPB) experimental system (as shown in
Figure 2) is composed of main rod equipment, kinetic energy supply equipment A, system control equipment B, and data acquisition equipment C. The relationship between each piece of equipment is shown in
Figure 3. Structure 1 is a rod base structure used to fix the whole rod, acting as the “foundation” of the whole test system. Structure 2 is the launcher used to power the bullet. Structure 3 is the firing barrel, which is used to give the bullet a certain sliding distance and control the firing speed. Structure 4 is the pressure relief port, which releases the pressure of the bullet at the end of the barrel. Structure 5 is the bullet speed tester, which is used to record the bullet speed. Structures 6, 7, and 8 are bullet, incident bar, and strain gauge and shaping equipment, respectively. Structure 9 is a protective box, used to protect the safety of testing personnel and instruments in the specimen impact process, and to collect the projected debris. Structures 10, 11, 12, and 13 are test specimens, transmission rod, movable support, and absorption rod, respectively. Structure 14 is an energy dissipation structure, which is used to unload the kinetic energy generated by the absorption rod.
The specific operation steps of impact compression test are shown in
Figure 4.
Substitute the strain collected during the test into Formula (1)
The meaning of each item in Formula (1) is: the data collected through this test are εI(t), εR(t), εT (T), which is the strain collected by the incident rod, reflection rod, and transmission rod, respectively. E, A, As, and Ls are the fixed values measured before the test, which are the Young’s modulus of the member, the cross-sectional area of the member, the area of the concrete impacted surface, and the thickness of the concrete test. C is the propagation velocity of stress wave in the rod.
3. Results
The crushing morphology of each specimen after impact compression is shown in
Figure 5. The impact failure mode of the specimen has a strong relationship with the strain rate and impact speed. In order to facilitate the classification of the crushing mode of the specimen after the impact compression test, with reference to the actual crushing situation, the following four situations are given to summarize the crushing mode of the specimen, and the simplified results are sorted into the table. The simplified results are specifically expressed as follows:
After the specimen is impacted and compressed, the inner core can be found out obviously, and the contact surface between the inner core and the incident projection rod remains flat, which basically retains the morphological characteristics of the central part of the specimen, and the volume is the largest in the broken block.
The crushed block of the specimen after impact compression test is large, there are many connections between the original aggregate and the cement stone, and the volume after crushing is larger than that of the original coarse aggregate.
After the impact compression test, the broken block of the specimen is small, there is little connection between aggregate and cement stone or some fragments are not connected, and they are completely separated from the cement stone.
After being impacted and compressed, the specimen has more powdery materials, and the excessive impact speed leads to the crushing of cement stone and some aggregates with low strength.
The difference between the four cases is mainly affected by two factors: one is the velocity of the bullet in the process of impact compression, which is a reflection of the energy transmitted to the specimen in the process of impact. The second is the performance of the specimen itself. As a multiphase composite material, the performance of concrete in the test is closely related to many units of the concrete matrix itself. Each unit in the concrete used in this paper will have a certain degree of test deviation due to the influence of material differences and uncertainty in the process of manufacturing and curing, but the overall trend remains stable. Therefore, under the condition that impact velocity and strain rate are similar, the main reason for the difference in concrete impact compression failure mode is that different contents of aluminum oxide fiber has an influence on the concrete matrix failure mode.
The crushing grades of each specimen after impact are shown in
Table 2. Taking strain rate and impact velocity as the main research objective, the following conclusions can be drawn from the transverse comparison of the crushing conditions of the specimens in each test group: the morphologies of the ACCY specimen group mixed with aluminum oxide fiber and the PCCY specimen group without fiber after crushing are significantly affected by strain rate and impact velocity, which can be analyzed from the four cases of specimen crushing. This view is confirmed by the large difference in crushing morphology under the condition of the same test group and a small difference in crushing morphology under the condition of similar strain rate and similar impact speed.
Taking the content of aluminum oxide fiber as the main research objective, the crushing conditions of the specimens in each test group are compared longitudinally. The crushing morphology of the specimens can be changed to a certain extent after adding aluminum oxide fiber. The specific characteristics are as follows: in the PCCY specimen group without fiber, when the strain rate is 97.6 s−1 and the impact speed is 9.07 m/s, the specimens change from a larger crushing volume to smaller crushing block volume. By increasing the amount of fiber, 1ACCY was similar to PCCY at similar strain rate and impact speed, but there was no obvious difference. The 2ACCY test group had a smaller fragment volume when the strain rate was 113.97 s−1 and the impact speed was 10.05 m/s, which was better than the PCCY test group at a higher strain rate and impact speed. When the content of aluminum oxide fiber continues to increase, the crushing shape of the 3ACCY test group is the most similar to that of the PCCY test group. During the impact compression test, the basic shape and volume of the inner core of the specimen under a low strain rate and impact speed are basically consistent with the size of the broken pieces of the specimen under a high strain rate and impact speed. There are some differences between the 4ACCY and 5ACCY test groups and the other test groups. During impact compression, the inner core of the two groups of specimens is not complete under a low strain rate and impact speed, and the crushing condition is obviously more serious compared with the PCCY test group under a different strain rate and impact speed.
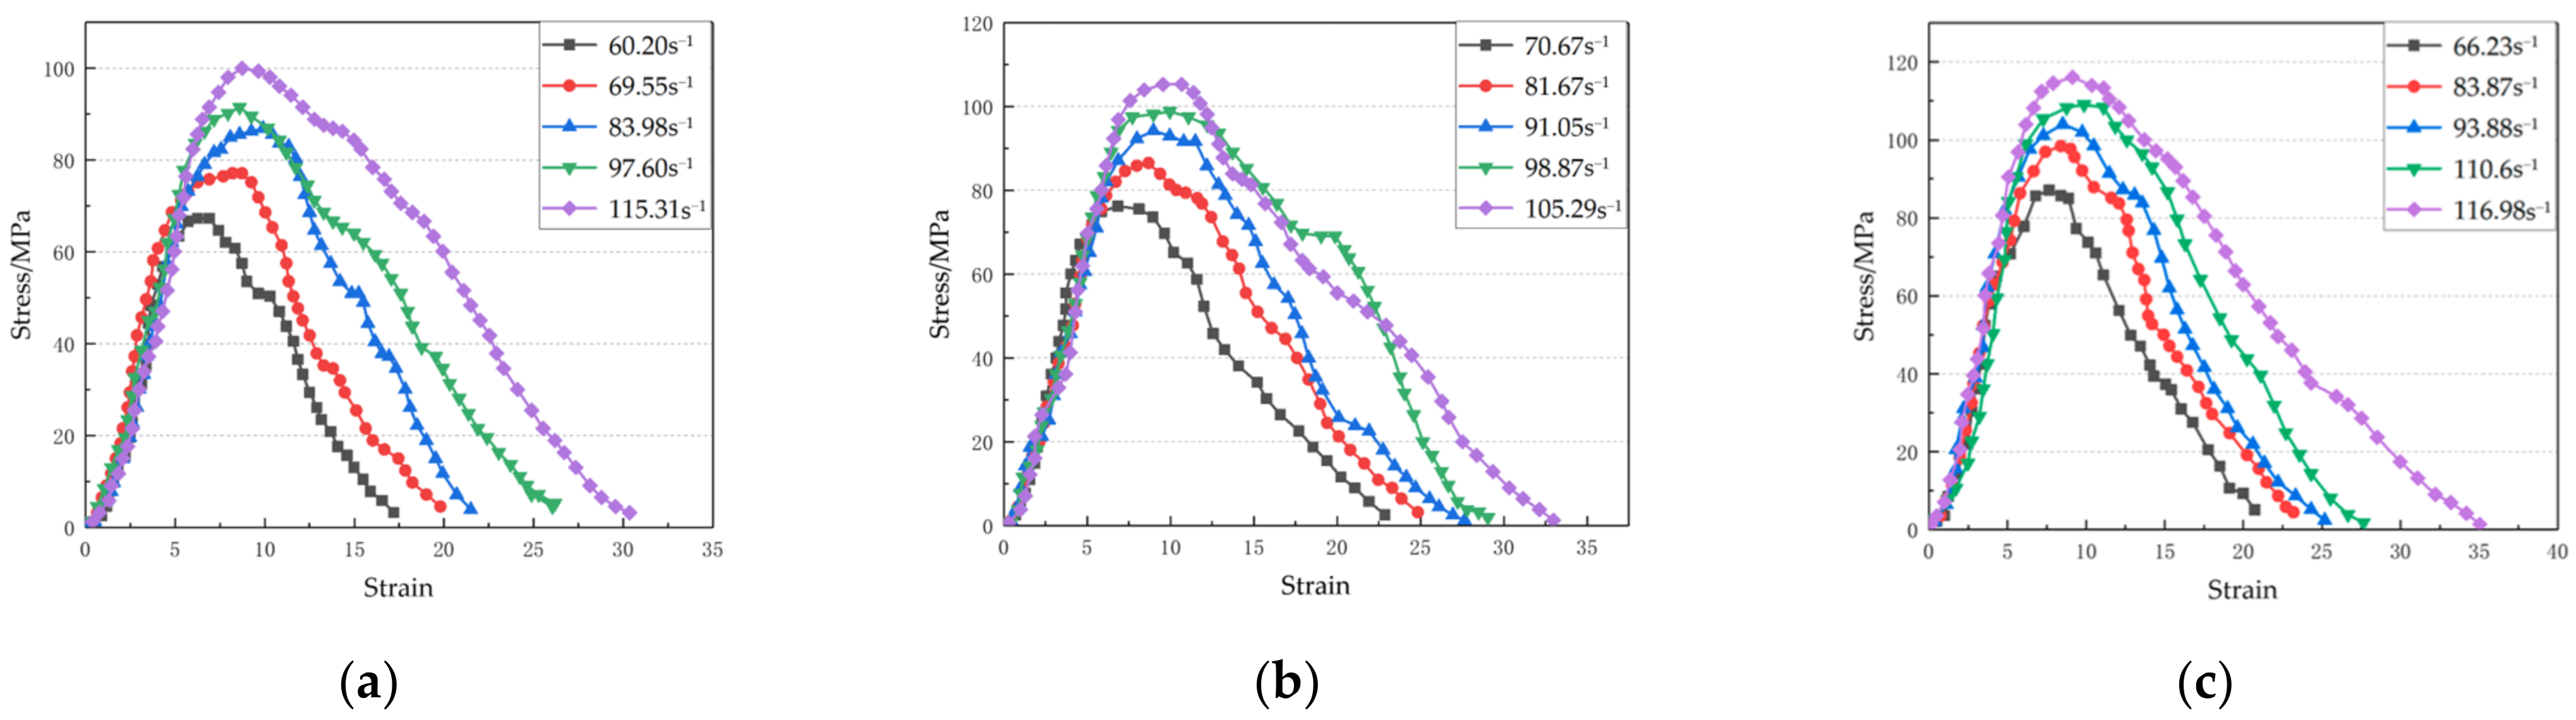
3.1. Dynamic Stress-Strain Curve
The stress-strain curves of aluminum oxide fiber concrete with different fiber contents and different impact compression speeds can be obtained by putting the data collected in the process of impact compression into Formula (1). The stress-strain curve is the representation data of the impact compression test and the full angle embodiment of the impact compression capacity of aluminum oxide fiber concrete under different dependent variable conditions. The stress-strain curves of each test group are shown in
Figure 6.
According to the stress-strain curves of each group of specimens, the stress-strain curves of the PCCY and ACCY test groups are compared horizontally, and the basic shape is indented “sawtooth”. The stress-strain curve of a single specimen and the horizontal axis of the coordinate form a quasi triangle with a rounded top angle.
Under impact compression load, the stress-strain curve of each group of specimens can be divided into enhanced compaction stage, stable elastic stage, critical plastic stage, and failure fragmentation stage. The analyses of each stage are as follows:
- (1)
When the specimen is in the enhanced compaction stage, the compression degree of the incident bar to the specimen is small. Due to the original pores and cracks caused by the manufacturing process and its own hydration, the compressed volume of the incident bar becomes smaller, and the concrete around the pores continues to replace its original space. In the stress-strain curve, the stress increases slowly and the slope of the curve increases continuously in the initial compaction stage, when the void space inside the specimen is completely occupied by concrete, the slope of the curve reaches the extreme value.
- (2)
When the specimen is in the stable elastic stage, the compression degree of the incident rod to the specimen continues to improve. At this time, due to the reduction in pores, the composite multiphase specimen establishes a stable structure among aggregate, cement-based, and fiber in the one-dimensional stress process to jointly bear the load. At this time, the stress continues to increase, and the slope of the curve maintains a certain degree of dynamic stability, basically following Hooke’s law.
- (3)
When the specimen is in the critical plastic stage, the incident rod transfers most of the energy to the specimen. At this time, the bonding of all materials in the specimen reaches the limit, and the internal structure slides greatly, the aluminum oxide fiber in the concrete and the concrete matrix plays the role of crack resistance. At this time, the stress growth gradually slows down and approaches the maximum value. The strain curve shows an obvious yield platform and has a certain moderation.
- (4)
When the specimen is in the stage of destruction and fragmentation, the incident rod transmits all the energy to the specimen. At this time, the components in the composite multiphase specimen have been separated, and the original fibers closely bonded to the concrete matrix begin to pull out and break. In the stress-strain curve, the stress decreases sharply. At this time, the strain reaches the maximum and the specimen is damaged by impact compression.
The impact compression test results of each group of specimens after treatment are shown in
Table 3.
The meanings of parameters in
Figure 7 and
Table 3 are as follows:
is strain rate,
is dynamic compressive strength,
is peak strain,
is ultimate strain,
is dynamic strength growth factor, and
is impact toughness.
3.2. Strength Characteristic Analysis
The PCCY test group and ACCY test group are compared with each other. Under the condition of similar impact speeds and approximate strain rates, the addition of aluminum oxide fiber will have an impact on the dynamic compressive strength of the specimen. Based on the PCCY test group, the increase or decrease in the dynamic compressive strength of the specimen mainly depends on the amount of fiber. The results of linear fitting between dynamic compressive strength and strain rate are shown in Formula (2), which can be obtained from
Figure 2. In Formula (2), there is a quadratic function relationship between the fiber content and the dynamic compressive strength of the specimen. The peak point appears in the 2ACCY test group with the fiber content of 0.2%. When the strain rate is 65 ± 5 s
−1, the strength increases by 29.31%. When aluminum oxide fiber is added in excess, the fiber content is negatively correlated with the overall compressive strength. Compared with the PCCY test group under the condition of similar impact speeds and approximate strain rates, the dynamic compressive strength of the 4ACCY test group and the 5ACCY test group is lower than that of the PCCY test group. For example, when the strain rate is 110 ± 5 s
−1, the dynamic compressive strength is weakened by 7.82% and 9.56%, respectively. Compared with the best static compressive strength test group, the effect of fiber on the improvement of dynamic compressive strength is more significant. The appropriate amount of fiber will increase the value of strength growth factor. This kind of situation is mainly due to the difference in the strengthening effects of fiber on concrete matrix materials under different load types. Under the influence of fiber, the growth rate of static compressive strength is slower than that of dynamic compressive strength. The difference between the two is another expression of strength growth factor. However, there is no significant correlation between the increasing rate of strength growth factor of each group of specimens, that is, the slope of the fitting curve in Formula (3), and the fiber content.
3.3. Energy Characteristic Analysis
The relationship between impact toughness and strain rate of PCCY and ACCY test pieces is shown in the
Figure 7. The following conclusions can be drawn: the impact toughness of the PCCY test piece group and the ACCY test piece group is closely related to strain rate and impact velocity, and the addition of aluminum oxide fiber also changes the impact toughness of the test piece. An exception to this is that the impact toughness of the 1ACCY test piece decreases slightly under a high strain rate and impact velocity; for example, at 98.87 s
−1 and 8.99 m/s, it decreased from 1784.7 kJ/m
3 to 1711.2 kJ/m
3 at 114.79 s
−1 and 10.09 m/s, respectively. Other test groups showed that the strain rate level changed from low to high, and the impact toughness was significantly improved.
In order to better understand the relationship between dynamic elastic modulus and strain rate, the relationship between strain rate and dynamic elastic modulus of specimens in the PCCY and ACCY test groups is linearly fitted. See Formula (3) for specific treatment results.
Under a similar strain rate and impact velocity, an appropriate amount of aluminum oxide fiber gives the concrete matrix additional impact toughness. The overall impact toughness is composed of two parts: the toughness provided by aluminum oxide fiber and the toughness provided by the concrete matrix. Aluminum oxide fiber is used to replace the concrete matrix in an appropriate amount, so that the fiber is pulled from the concrete matrix by external force during the impact process, and part of the toughness provided by the concrete matrix is replaced in this process. For example, the impact toughness of the 2ACCY test group is better than that of the PCCY test group. From the fitting data, it can be found that adding an appropriate amount of aluminum oxide fiber improves the growth rate of impact toughness. In Formula (3), the slope of 2PCCY is higher than that of other test groups. The impact of aluminum oxide fiber with higher content on impact toughness is basically consistent with the situation of high content in the strength characteristics section of this paper.
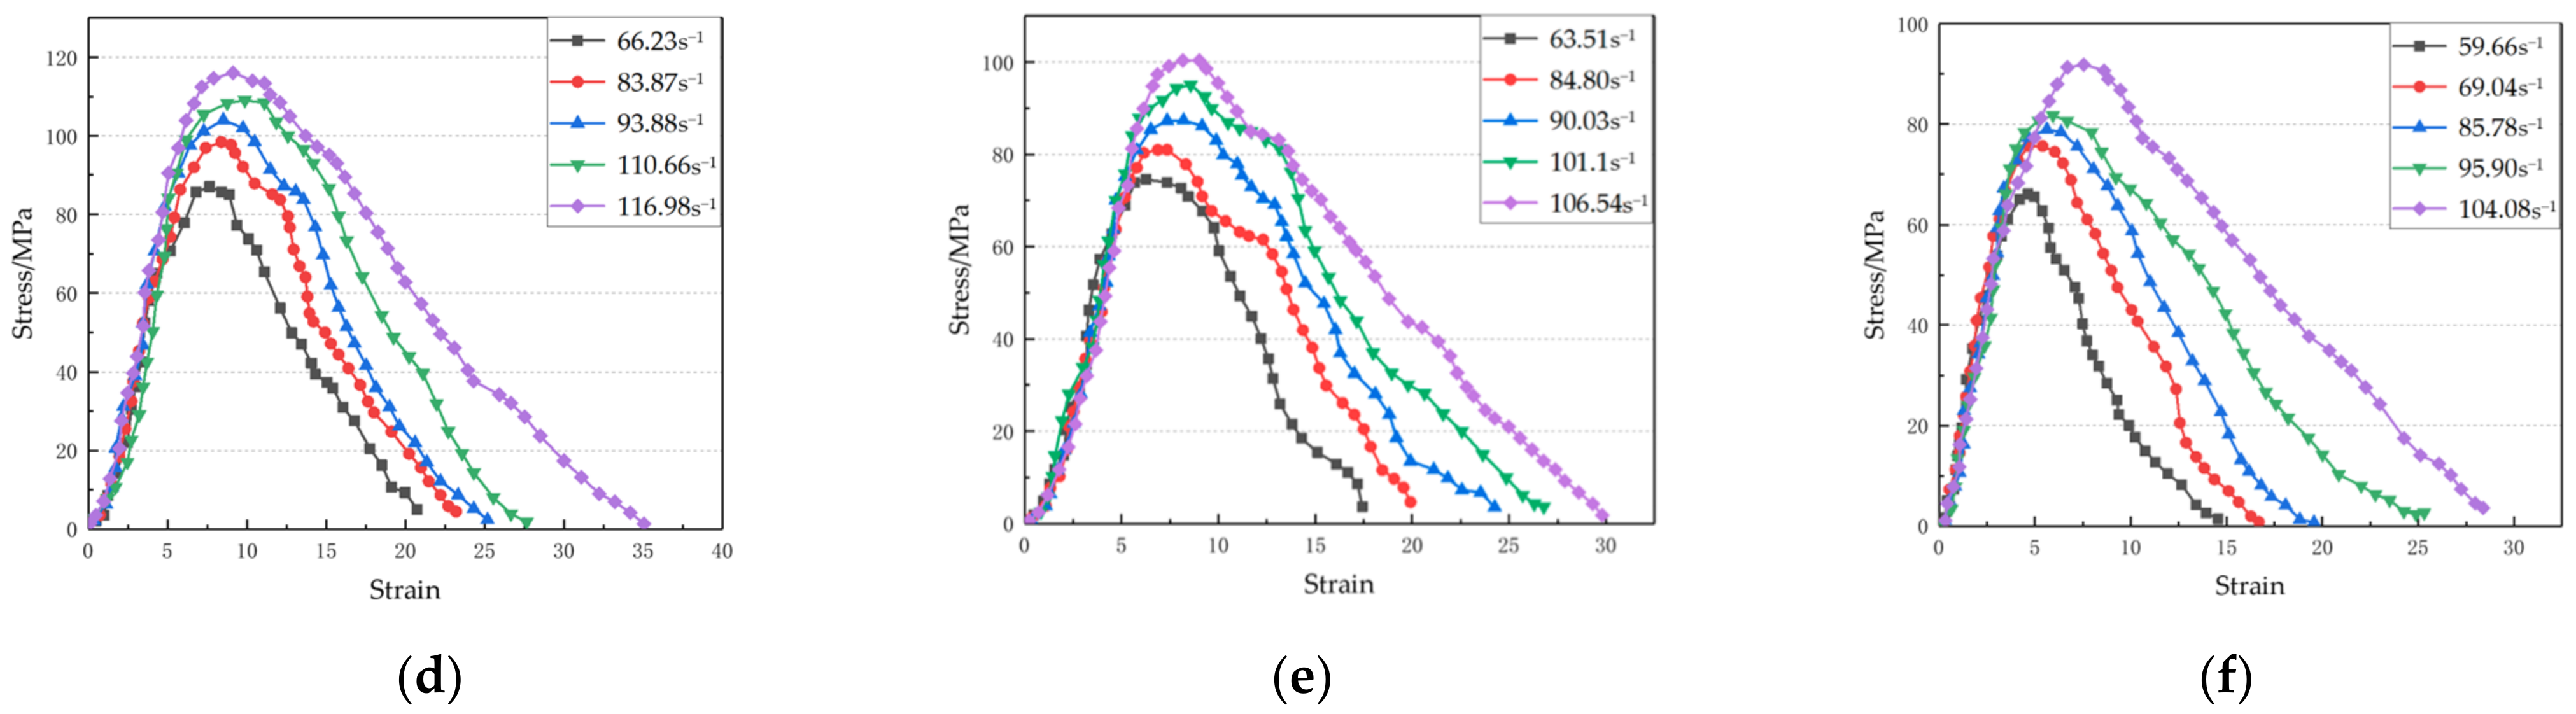
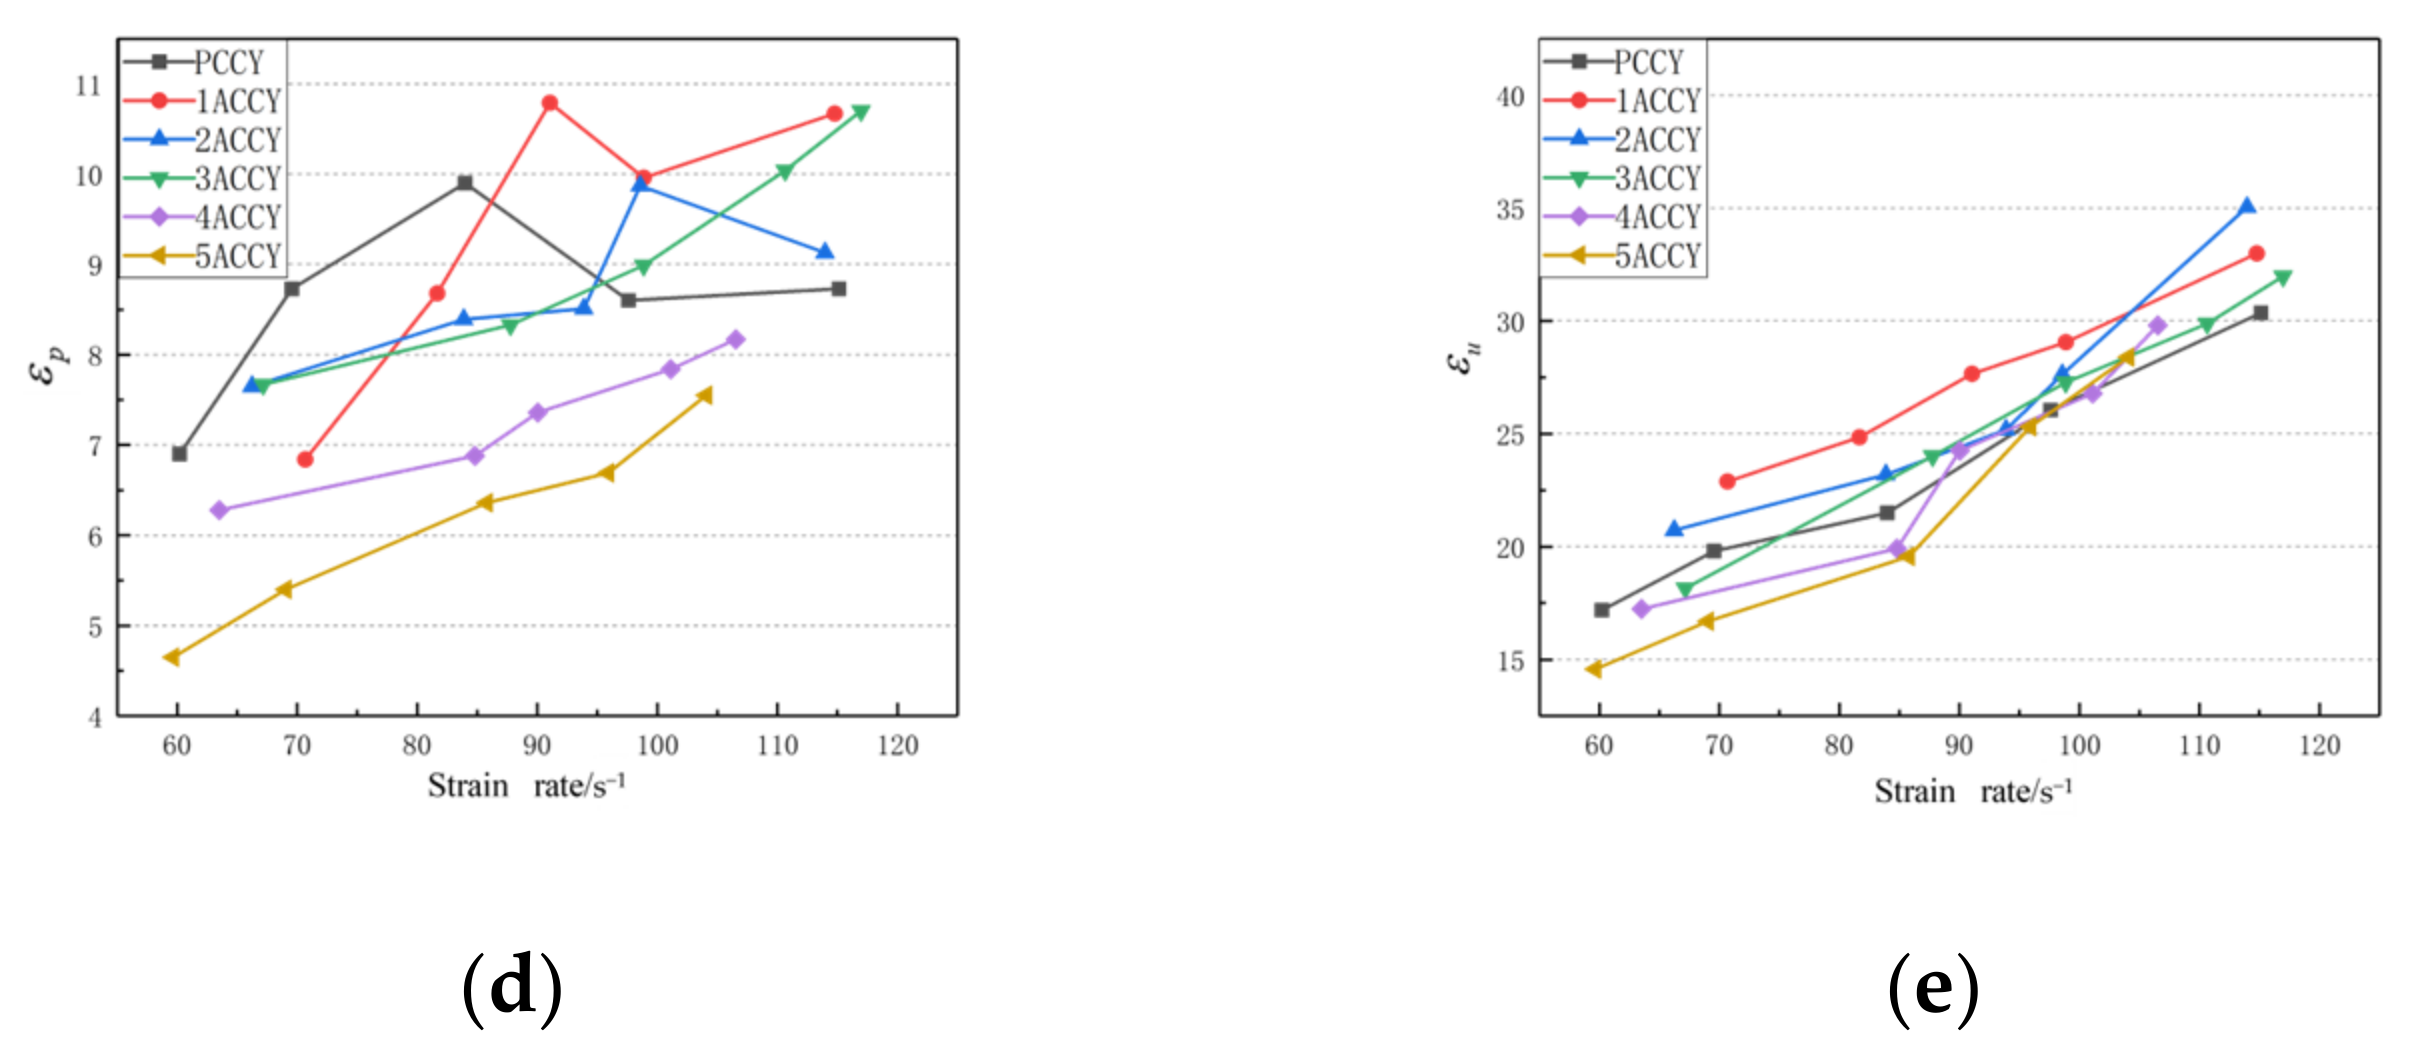
3.4. Energy Characteristic Analysis
The peak strain of each group of specimens is the abscissa value, corresponding to the highest point in the stress-strain curve. It is the strain at the beginning of failure after the specimen exceeds the critical value of the linear stage in the process of impact compression. If the applied impact compression load is suddenly unloaded at this time, the specimen cannot return to the original linear change shape, and the maximum compressive effect is expressed to the outside world. It can be seen from the figure that when the strain rate of each component group is lower than 95 s−1 and the impact speed is less than 9 m/s, the peak strain increases with the increase in strain rate and impact speed. When the strain rate is higher than 95 s−1 and the impact speed is greater than 9 m/s, the group of 3ACCY, 4ACCY, and 5ACCY still follows the above increasing law. The peak strain of the PCCY, 1ACCY, and 2ACCY specimen groups shows test values different from the above law. Although the overall trend is increasing, the peak strain in individual test groups shows variation. In order to analyze the relationship between peak strain and strain rate, they are linearly fitted, and the fitting condition is poor, R2 values are lower than 0.5, and the solid is omitted.
The ultimate strain of the specimen is another denaturation feature of the impact compression process. The regularity of the ultimate strain is more obvious than that of the peak strain, and is strongly affected by the strain rate and impact velocity. Taking the PCCY specimen group as an example, when its strain rate is 60.32 s−1, the ultimate strain is only 17.19 × 10⁻³. When the strain rate increases and the ultimate strain of the same test group increases by 76.56% to 30.35 × 10⁻³, it can be concluded that the ultimate strain is sensitive to the changes in impact velocity and strain rate.
The addition of aluminum oxide fiber will affect the ultimate strain of the specimen. When the strain rate is in the range of 60 s−1 to 100 s−1 and the impact velocity is in the range of 6 m/s to 9 m/s, the ultimate strain of 1ACCY specimen group is higher than that of other specimen groups. Compared with the PCCY test group, the ultimate strain increases by 33.10%, 25.45%, 28.66%, and 11.51%, respectively, in the four approximate sections of strain rate from 60 to 100; when the strain rate is 100 ± 5 s−1 and the impact velocity is approximately 10 ± 0.5 m/s, the ultimate strain of the 2ACCY test group is higher than that of other test groups.
4. Model Construction Based on Damage and Residual Stress
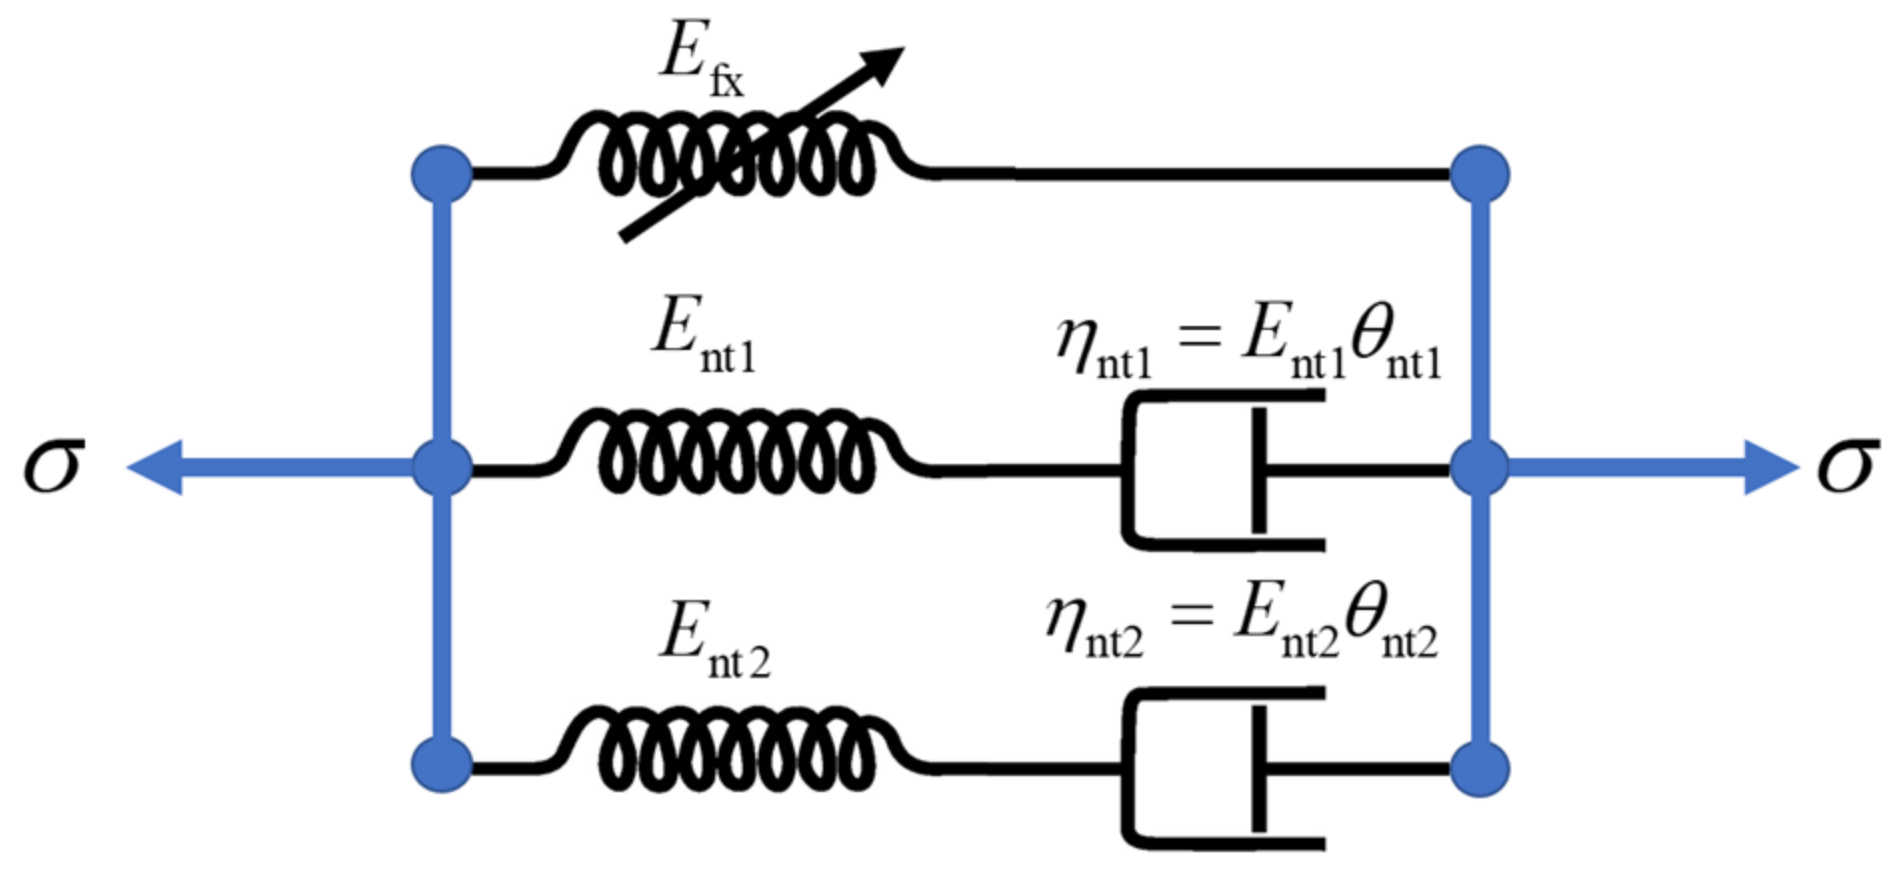
As a material formed by a combination of multiple materials, aluminum oxide fiber concrete is formed by a cement stone which is wrapped and united with other materials by the action of “glue”. Zhu-Wang-Tang non-linear viscoelastic model (ZWT model) [
29] is a constitutive model based on nonlinear theory with a wide application range of strain rate; as shown in
Figure 8, the model better describes the behavior of cement-based, rock, and other media in a certain range. The specific expression is as follows:
In the Formula (5): represents nonlinear elastomer, the first unit of the elastomer composition model; is a viscoelastic body, which is used to describe the behavior of low and high strain rates, respectively, and constitutes the second and third units of the model. is the elastic constant; and are linear elastic moduli; and are material parameters; and are the reaction characteristic time of the sticky pot in the viscoelastic body.
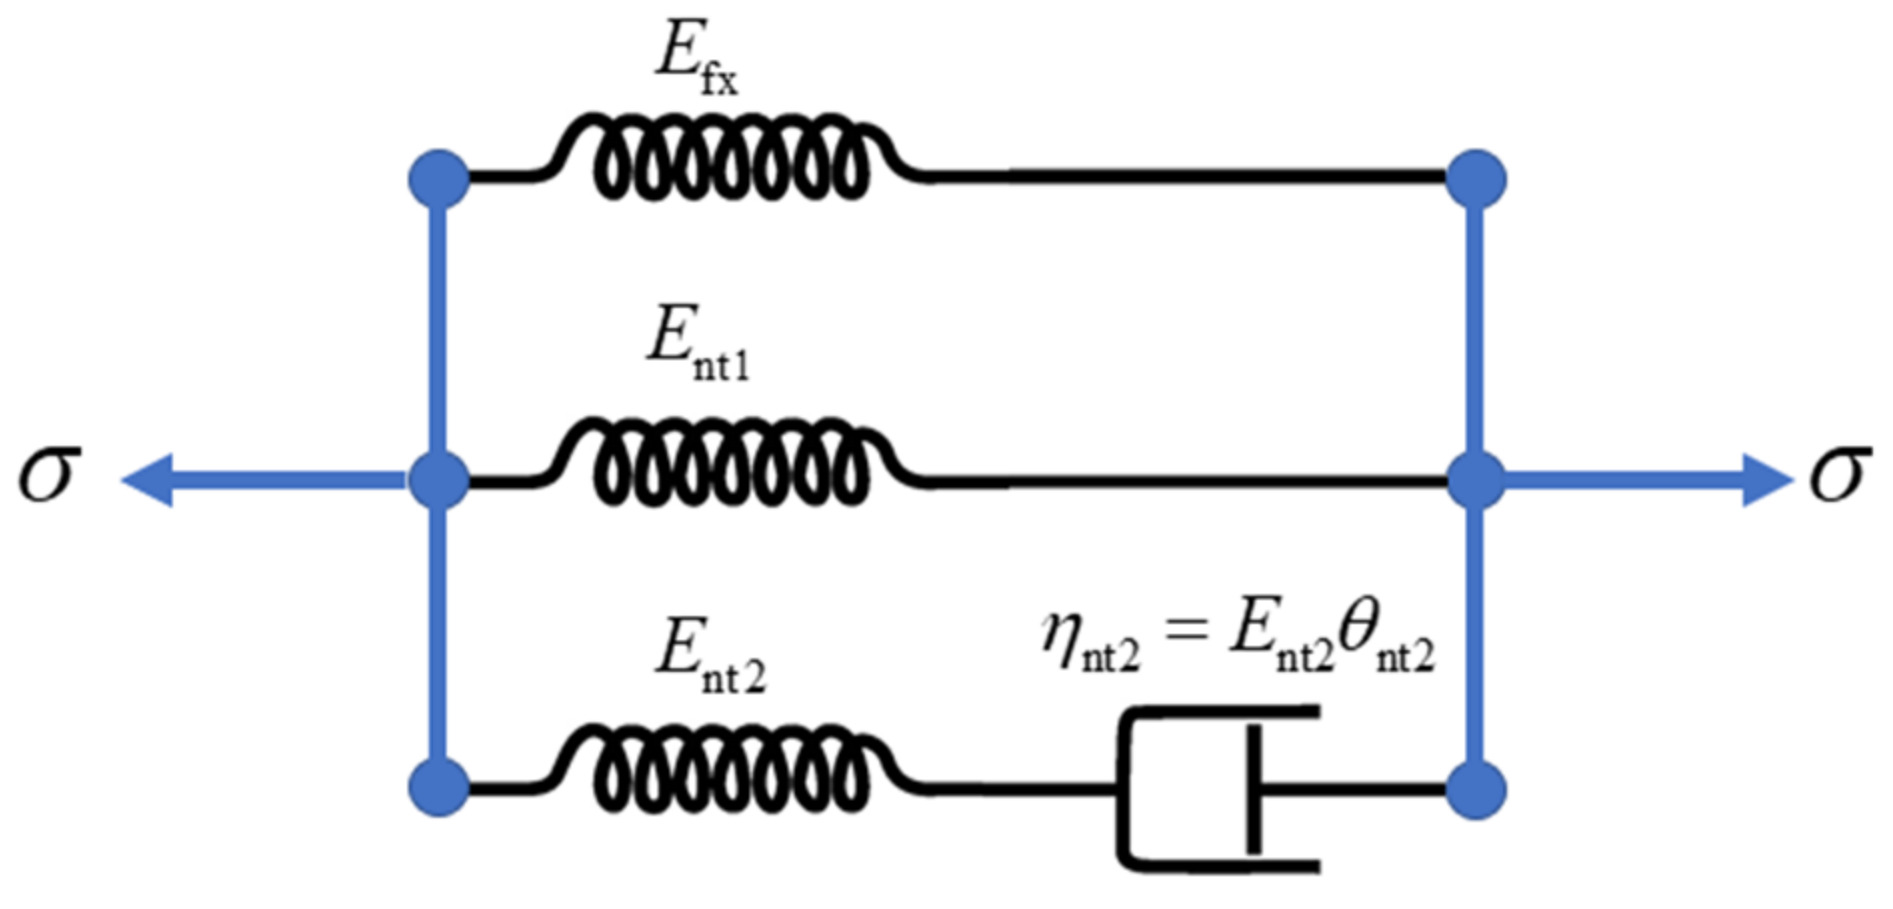
In this model,
and
in part
are constant values. In order to solve the problem that the nonlinear elastic part is difficult to calculate and to simplify the difficulty of calculation, the maintenance time of impact compression in this test is between 10
−6 s and 10
−5 s, and part
of non-linear elastomer that fails to react in time and the part under the low strain rate are ignored. The final optimized ZWT model is shown in the
Figure 9.
After simplifying and integrating the optimized Formula (5), it is sorted out as follows:
Based on the experimental analysis, the addition of alumina fiber has a significant strengthening effect on concrete, and its overall stress-strain curve has an obvious tendency of defect damage being suppressed. The defect damage coefficient is incorporated into the model, and the expression of the damage model is as follows:
In the Formula (7), and are the parameters to be solved, respectively; is the critical strain, when the strain exceeds this range, damage will occur; otherwise, it is assumed that its integrity is good; is the final value of the linear elastic stage; 0.8 is for easy calculation.
After adding the damage coefficient, the original formula becomes:
After impact compression, the stress-strain curve of the specimen at the end of the test does not directly contact with the coordinate axis, so it can be judged that there is still residual stress, so it is expressed as follows:
In Formula (9), is the part of stress borne by alumina fiber at the damaged site.
By combining the above types:
In Formula (10), the sum values of
and
are substituted into the overall calculation, and
is given to facilitate calculation. Therefore, this model needs to be fitted with a total of 6 unknowns, which are
,
,
,
,
,
, respectively. The statistical analysis of optimization model parameters under different strain rates and alumina fiber contents is shown in
Table 4.
So far, the prediction model of aluminum oxide fiber-reinforced concrete under different strain rates has been constructed. The compressive strength obtained by the prediction model is compared with the actual measured compressive strength (as shown in
Figure 10). About 80% of the prediction results in the prediction model in this paper have a small deviation from the actual curve, which is basically close to the actual curve. The overall fitting effect is good, and the overall curve shape basically conforms to the shape of the stress-strain curve measured in this test. Generally speaking, it better reflects the change trend of stress-strain curve of the reinforced compaction stage, the stable elastic stage, the critical plastic stage and the failure fragmentation stage under the initial pore compression of concrete specimens under the condition of a high strain rate. In this model, the residual stress term is introduced to optimize the model, which better fits the scenario in which there is still a small amount of stress after impact compression crushing in the test. However, some simulation results still have a certain deviation from the actual measurement results. The subsequent model optimization of residual stress after impact compression still needs to be further improved to make the constitutive model more consistent with the actual situation.
5. Discussion
The addition of aluminum oxide fiber can change the properties of concrete specimens. The crushing shape after impact compression is similar to that of the impact compression test and the static compression test. Under the appropriate content (the content of aluminum oxide fiber is 0.02%), the effect of light crushing shape can be achieved. Under the same conditions, the original crushing shape of concrete is nearly brittle, with small blocks. After being strengthened by the performance of aluminum oxide fiber on the matrix, the crushing shape changes to approach plastic adhesive large block failure. Compared with other admixtures and plain concrete, the static compressive strength and impact compressive strength of aluminum oxide fiber-reinforced concrete have great advantages, namely, that the energy absorption capacity and ultimate deformation capacity increase significantly. The excessive addition of fiber will aggravate the crushing of the concrete specimen itself (the content of aluminum oxide fiber is more than 0.04%), the powdery material gradually increases, the separation of specimen fragments is more serious, the original nearly brittle broken block becomes easier to crush, and the powdery material with a smaller particle size appears. At the same time, the complete inner core of the specimen still breaks even under low strain rate and low impact speed. At this dosage, the performance of the specimen is even lower than that of plain concrete. The reason is due to the defects caused by the agglomeration formed by the incomplete dispersion of fibers in the concrete matrix. Aluminum oxide fiber-reinforced concrete is greatly affected by strain rate and impact velocity. The stress-strain curves of the PCCY and ACCY test groups are affected by the strain rate. Under the condition of strain rate, the peak value of the stress-strain curve moves a large distance upward and a short distance to the right; the end point of the stress-strain curve moves a large distance to the right, but there is no obvious change in high and low degrees.
The strength characteristics, ultimate deformation characteristics, energy absorption characteristics, and the changing law of macro crushing morphology generally conform to the premise that the higher the strain rate, the greater the impact speed, the better the performance of the specimens, the more intense the crushing state of the specimens, and the better the general conformity to the impact inertia constraint.
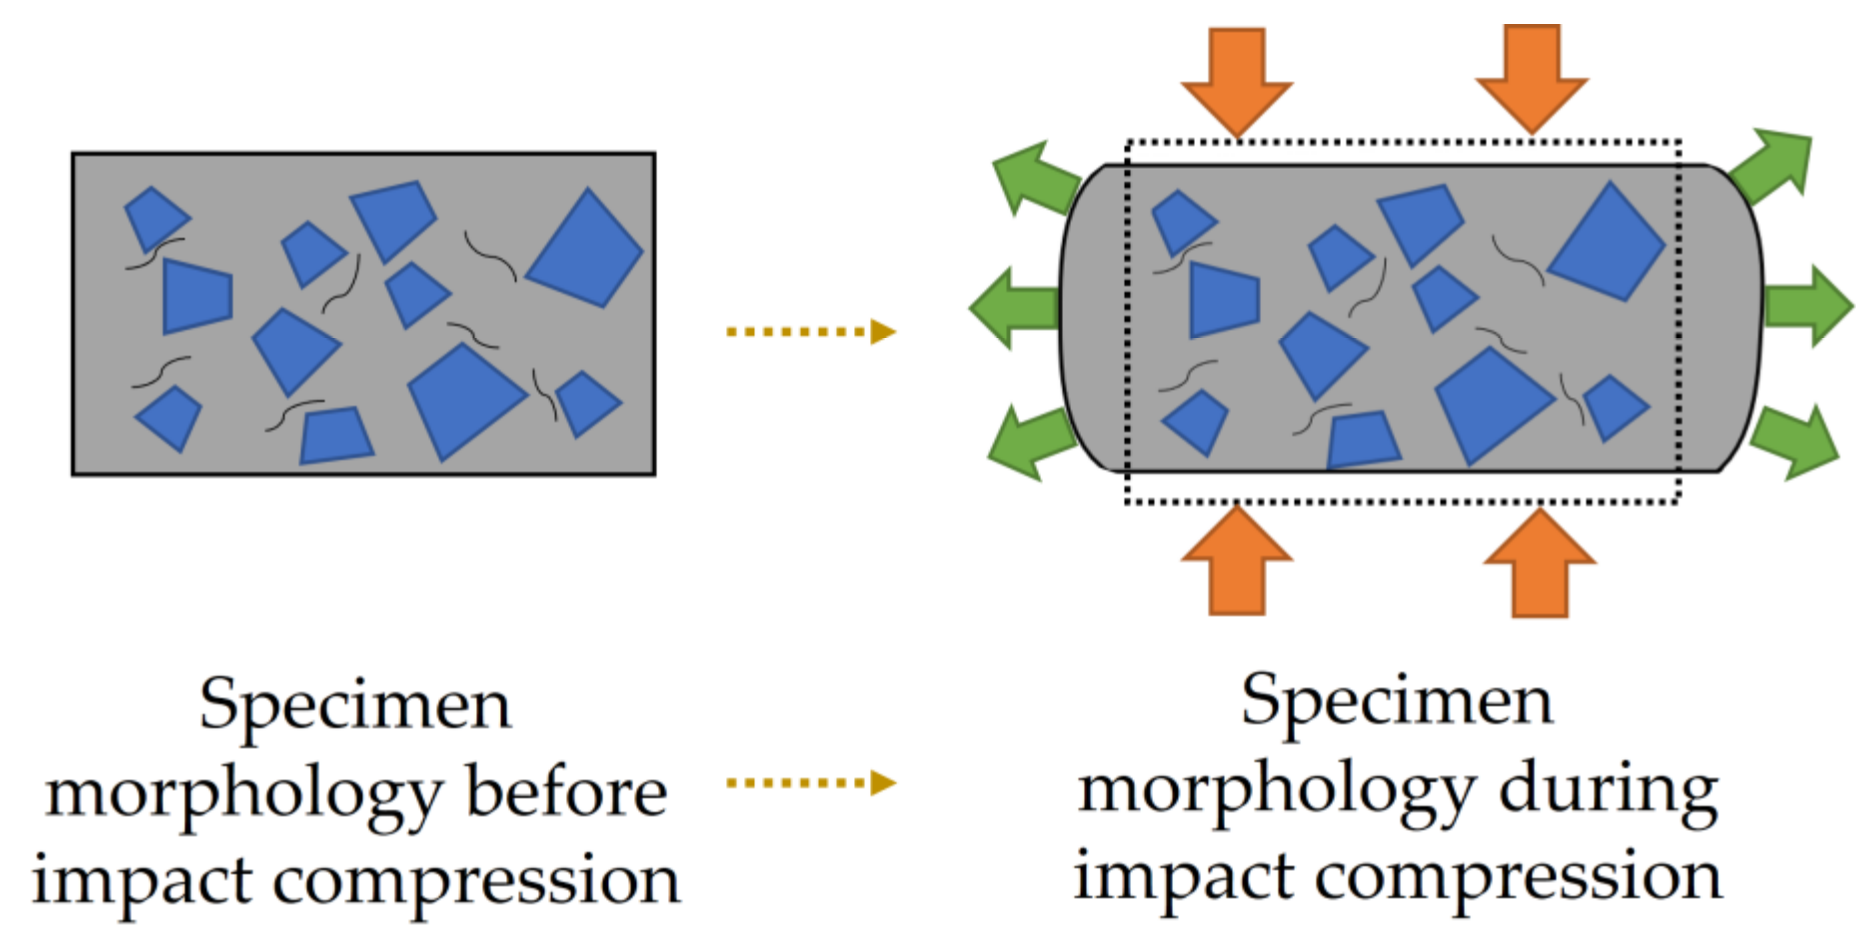
The tests carried out in this paper are a quasi-static test under a low strain rate and a dynamic test under a high strain rate. Both bear the load in a single direction. Under the quasi-static state, the strain rate is 10
−5 s
−1, the load is applied slowly, the specimen has enough time to deform and transfer energy, and there is no lag in this process; in the impact compression test, the strain rate can reach 100 s
−1, and the deformation time of the specimen lags behind the impact time. In this case, as shown in the
Figure 11, the dotted line in the impact compression outlines the shape of the original specimen, which begins to deform after impact, and the outside of the fiber concrete block at the edge of the specimen is not constrained. Therefore, the volume change is less obstructed when deformation occurs, and the concrete in the central block of the specimen is compressed inward in the impact direction. When expanding in the direction perpendicular to the impact, it is blocked by other concrete blocks, so the effects of strain rate and impact velocity are significant.
6. Conclusions
In this paper, aluminum oxide fiber-reinforced concrete with different contents is prepared, and the static compression test and impact compression test are carried out. Based on the damage and residual stress modification, the impact compression constitutive model of aluminum oxide fiber-reinforced concrete is established. The main conclusions are:
The addition of aluminum oxide fiber will have an impact on the impact compression performance and static compression performance of the concrete matrix. In order to determine the fiber length, finding the appropriate amount of aluminum oxide fiber will improve performance. In this paper, the best amount of aluminum oxide fiber is 0.2%, and excessive addition of fiber will reduce the performance of concrete.
The strength, deformation, and energy characteristics of aluminum oxide fiber concrete show significant strain rate and impact velocity effects, and the influence of strain rate and impact velocity on concrete is stronger than that of fiber on concrete.
The strength characteristics, ultimate deformation characteristics, and energy characteristics of aluminum oxide fiber have a significant rate effect, and the relationship between them is positive; the integrity of the specimen after crushing is negatively correlated with the strain rate and impact velocity.
The optimized ZWT model based on damage and stress residue can better describe the stress-strain curve of aluminum oxide fiber-reinforced concrete under different strain rates, so as to realize the functional prediction. However, this type of material is only analyzed from the perspective of uniaxial impact compression. Therefore, it is necessary to further explore impact compression performance under complex biaxial and triaxial conditions and optimize the constitutive theoretical model.
Author Contributions
Conceptualization, A.Y. and J.X.; methodology, A.Y.; software, A.Y.; validation, A.Y.; formal analysis, A.Y.; investigation, J.X.; resources, A.Y. and J.X.; data curation, A.Y.; writing—original draft preparation, A.Y.; writing—review and editing, W.X.; visualization, J.X. and W.X.; project administration, J.X., H.H. and Y.N. All authors have read and agreed to the published version of the manuscript.
Funding
This research was funded by the National Natural Science Foundation of China, grant number 51908548. National Civil Air Defense Office Project of China, grant number. Rf20SC01J-S0.
Institutional Review Board Statement
Not applicable.
Informed Consent Statement
Not applicable.
Data Availability Statement
The data used to support the findings of this study are available from the corresponding author upon reasonable request.
Acknowledgments
The authors express their thanks to all members of the laboratory team for their help with the technical support.
Conflicts of Interest
The authors declare no conflict of interest.
References
- Malhotra, V. Introduction: Sustainable development and concrete technology. Concr. Int. 2002, 24, 22. [Google Scholar]
- Mindess, S.; Young, F.; Darwin, D. Concrete, 2nd ed.; Technical Documents; Prentice Hall, Pearson Education, Inc.: Upper Saddle River, NJ, USA, 2003; 644p. [Google Scholar]
- Li, J.; Wu, Z.; Shi, C.; Yuan, Q.; Zhang, Z. Durability of ultra-high performance concrete–A review. Constr. Build. Mater. 2020, 255, 119296. [Google Scholar] [CrossRef]
- Cui, H.; Lo, T.Y.; Memon, S.A.; Xu, W. Effect of lightweight aggregates on the mechanical properties and brittleness of lightweight aggregate concrete. Constr. Build. Mater. 2012, 35, 149–158. [Google Scholar] [CrossRef]
- Keru, W.; Jianhua, Z. The influence of the matrix-aggregate bond on the strength and brittleness of concrete. MRS Online Proc. Libr. (OPL) 1987, 114, 29. [Google Scholar] [CrossRef]
- Yoo, D.-Y.; Banthia, N. Impact resistance of fiber-reinforced concrete—A review. Cem. Concr. Compos. 2019, 104, 103389. [Google Scholar] [CrossRef]
- Yuan, Z.; Jia, Y. Mechanical properties and microstructure of glass fiber and polypropylene fiber reinforced concrete: An experimental study. Constr. Build. Mater. 2021, 266, 121048. [Google Scholar] [CrossRef]
- Thomas, J.; Ramaswamy, A. Mechanical properties of steel fiber-reinforced concrete. J. Mater. Civ. Eng. 2007, 19, 385–392. [Google Scholar] [CrossRef]
- Song, P.; Hwang, S. Mechanical properties of high-strength steel fiber-reinforced concrete. Constr. Build. Mater. 2004, 18, 669–673. [Google Scholar] [CrossRef]
- Brena, S.F.; Bramblett, R.M.; Wood, S.L.; Kreger, M.E. Increasing flexural capacity of reinforced concrete beams using carbon fiber-reinforced polymer composites. Struct. J. 2003, 100, 36–46. [Google Scholar]
- Yao, W.; Li, J.; Wu, K. Mechanical properties of hybrid fiber-reinforced concrete at low fiber volume fraction. Cem. Concr. Res. 2003, 33, 27–30. [Google Scholar] [CrossRef]
- Afroz, M.; Patnaikuni, I.; Venkatesan, S. Chemical durability and performance of modified basalt fiber in concrete medium. Constr. Build. Mater. 2017, 154, 191–203. [Google Scholar] [CrossRef]
- Li, W.; Xu, J. Mechanical properties of basalt fiber reinforced geopolymeric concrete under impact loading. Mater. Sci. Eng. A 2009, 505, 178–186. [Google Scholar] [CrossRef]
- Cui, Y.; Chen, Y.; Cen, G.; Peng, G. Comparative study on the effect of organic and inorganic fiber on the anti-wheel impact performance of airport pavement concrete under freeze-thaw environment. Constr. Build. Mater. 2019, 211, 284–297. [Google Scholar] [CrossRef]
- Zhu, H.-B.; Yan, M.-Z.; Wang, P.-M.; Li, C.; Cheng, Y.-J. Mechanical performance of concrete combined with a novel high strength organic fiber. Constr. Build. Mater. 2015, 78, 289–294. [Google Scholar] [CrossRef]
- Shi, F.; Pham, T.M.; Hao, H.; Hao, Y. Post-cracking behaviour of basalt and macro polypropylene hybrid fibre reinforced concrete with different compressive strengths. Constr. Build. Mater. 2020, 262, 120108. [Google Scholar] [CrossRef]
- Pourbaba, M.; Asefi, E.; Sadaghian, H.; Mirmiran, A. Effect of age on the compressive strength of ultra-high-performance fiber-reinforced concrete. Constr. Build. Mater. 2018, 175, 402–410. [Google Scholar] [CrossRef]
- Orouji, M.; Zahrai, S.M.; Najaf, E. Effect of Glass Powder & Polypropylene Fibers on Compressive and Flexural Strengths, Toughness and Ductility of Concrete: An Environmental Approach. In Structures; Elsevier: Amsterdam, The Netherlands, 2021; pp. 4616–4628. [Google Scholar]
- Bakar, M.B.C.; Muhammad Rashid, R.S.; Amran, M.; Saleh Jaafar, M.; Vatin, N.I.; Fediuk, R. Flexural strength of concrete beam reinforced with cfrp bars: A review. Materials 2022, 15, 1144. [Google Scholar] [CrossRef]
- Kang, M.-C.; Yoo, D.-Y.; Gupta, R. Machine learning-based prediction for compressive and flexural strengths of steel fiber-reinforced concrete. Constr. Build. Mater. 2021, 266, 121117. [Google Scholar] [CrossRef]
- Krishnaveni, C.; Selvan, S.S. Study on nano-alumina in concrete. Mater. Today Proc. 2021, 46, 3648–3652. [Google Scholar] [CrossRef]
- Jaishankar, P.; Karthikeyan, C. Characteristics of Cement Concrete with Nano Alumina Particles. In IOP Conference Series: Earth and Environmental Science; IOP Publishing: Bristol, UK, 2017; p. 012005. [Google Scholar]
- Xiong, Y.; Zhu, Y.; Chen, C.; Zhang, Y. Effect of nano-alumina modified foaming agents on properties of foamed concrete. Constr. Build. Mater. 2021, 267, 121045. [Google Scholar] [CrossRef]
- Shokravi, H.; Mohammadyan-Yasouj, S.E.; Koloor, S.S.R.; Petrů, M.; Heidarrezaei, M. Effect of alumina additives on mechanical and fresh properties of self-compacting concrete: A review. Processes 2021, 9, 554. [Google Scholar] [CrossRef]
- Liao, K.-X.; Zhang, Y.-P.; Zhang, W.-P.; Wang, Y.; Zhang, R.-L. Modeling constitutive relationship of sulfate-attacked concrete. Constr. Build. Mater. 2020, 260, 119902. [Google Scholar] [CrossRef]
- Zhao, Z. Dynamic properties test and constitutive relation study of lightweight aggregate concrete under uniaxial compression. Adv. Mater. Sci. Eng. 2021, 2021, 2678952. [Google Scholar] [CrossRef]
- Bhogone, M.V.; Subramaniam, K.V. Early-age tensile constitutive relationships for steel and polypropylene fiber reinforced concrete. Eng. Fract. Mech. 2021, 244, 107556. [Google Scholar] [CrossRef]
- Gao, F.; Wang, Z.; Wen, Z.; Ji, Y. A dynamic cavity expansion model for rigid projectile penetration into concrete considering the compressibility and nonlinear constitutive relations. Geofluids 2021, 2021, 6664882. [Google Scholar] [CrossRef]
- Zhu, Z.; Xu, D.; Wang, L. Thermoviscoelastic constitutive equation and time-temperature equivalence of epoxy resin at high strain rates. J. Ningbo Univ. 1988, 1, 58–68. [Google Scholar]
| Publisher’s Note: MDPI stays neutral with regard to jurisdictional claims in published maps and institutional affiliations. |
© 2022 by the authors. Licensee MDPI, Basel, Switzerland. This article is an open access article distributed under the terms and conditions of the Creative Commons Attribution (CC BY) license (https://creativecommons.org/licenses/by/4.0/).


