
Advanced ML-Based Ensemble and Deep Learning Models for Short-Term Load Forecasting: Comparative Analysis Using Feature Engineering


Abstract
:1. Introduction
1.1. Prior Works
1.2. Contribution
- Bagging ensemble consisting of LR and SVR is firstly proposed to improve the forecasting accuracy by converting ML models from weak learners to strong learners.
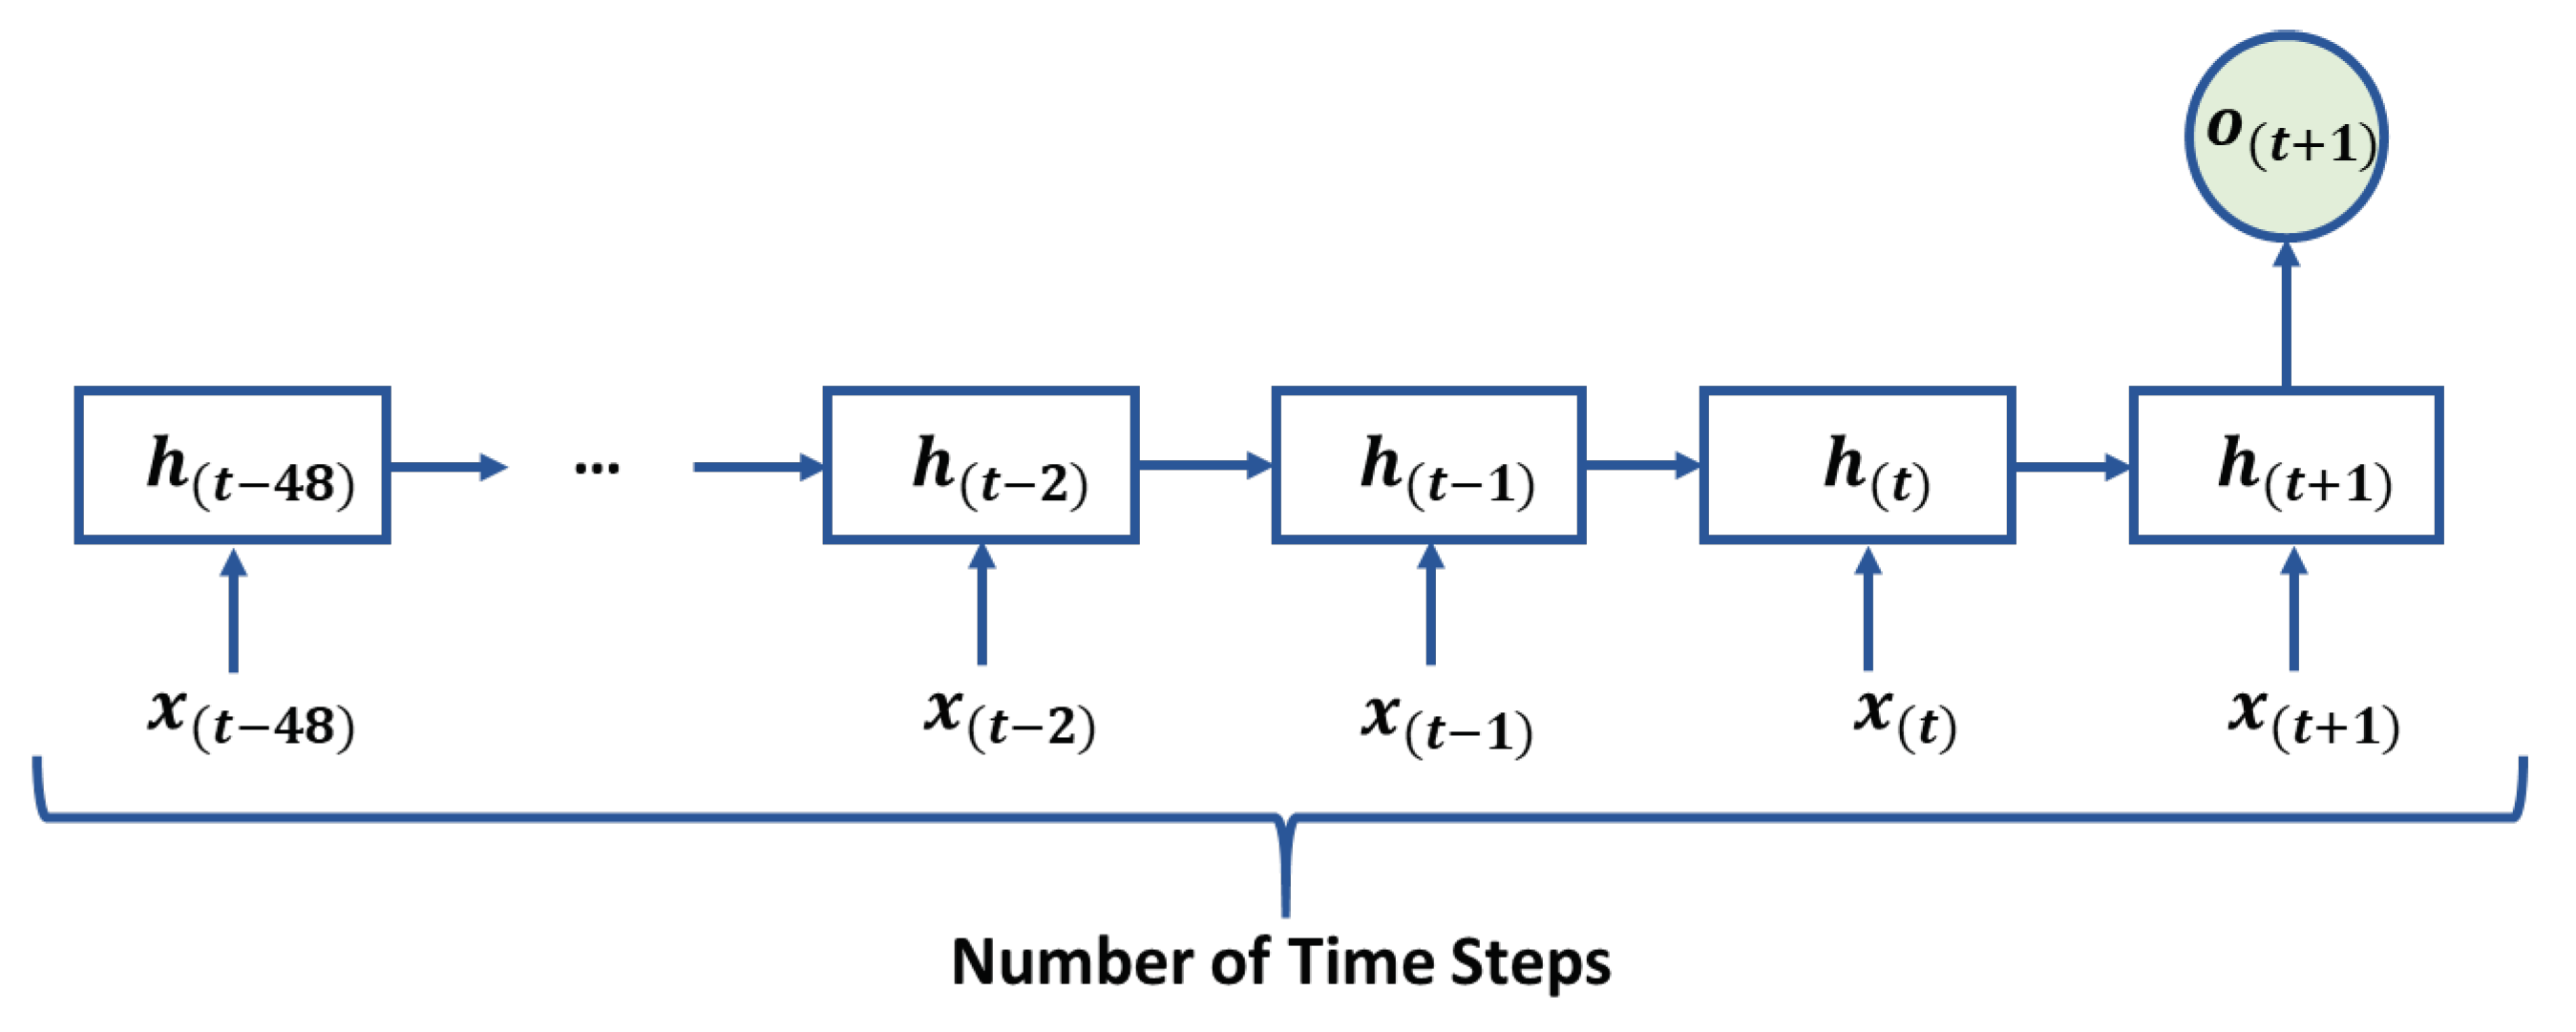
- Advanced DL models including DNN, LSTM, and CNN-LSTM are implemented along with tuning hyperparameters for STLF to handle back-propagation learning and time series problems.
- A detailed comparative analysis of the proposed model and other DL models is provided and compared each other. The comparison is done by considering the mean absolute percentage error (MAPE), the mean absolute error (MAE), and the mean squared error (MSE) as the main performance metrics. These performance metrics are computed for the provided dataset for every month.
- The used data in this work are obtained from EGAT and are first smoothed using the filtering technique. The filtering process is done to avoid missing values and outliers.
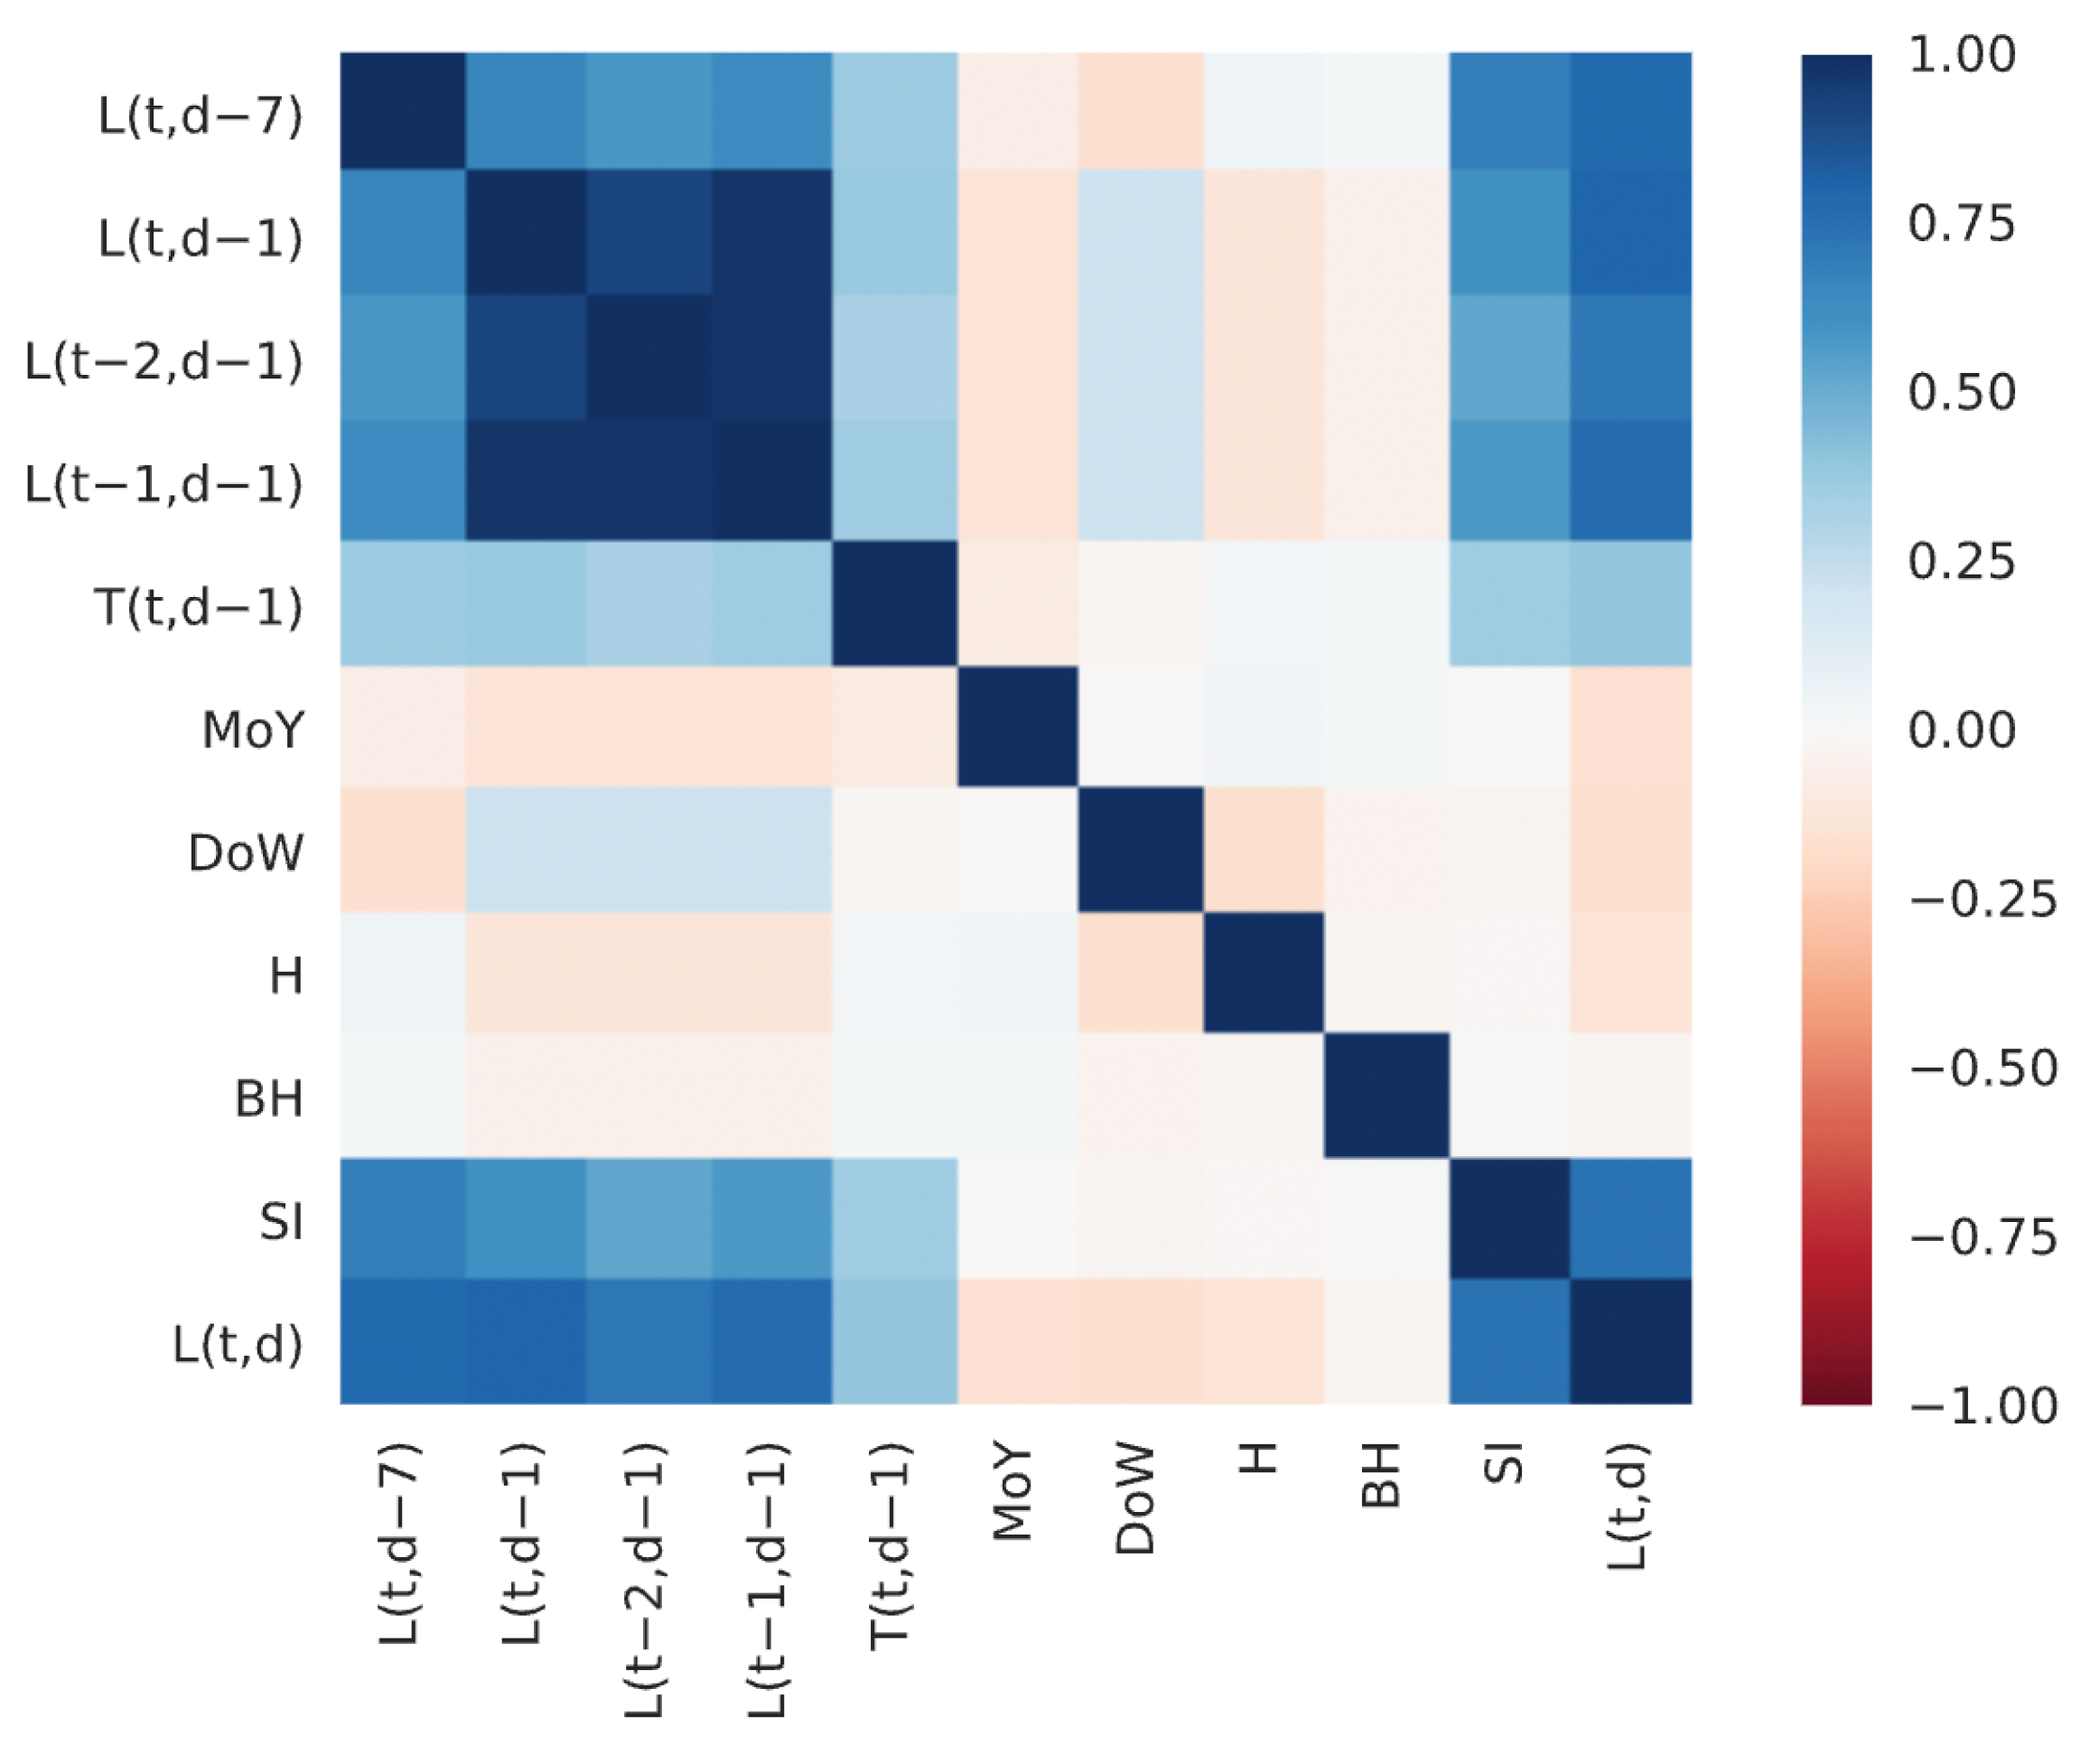
- Different input features are applied for all models and are compared to check the correlation between load and external influential factors, because external factors like temperature, holidays, and months of the year commonly affect load demand.
1.3. Paper Organization
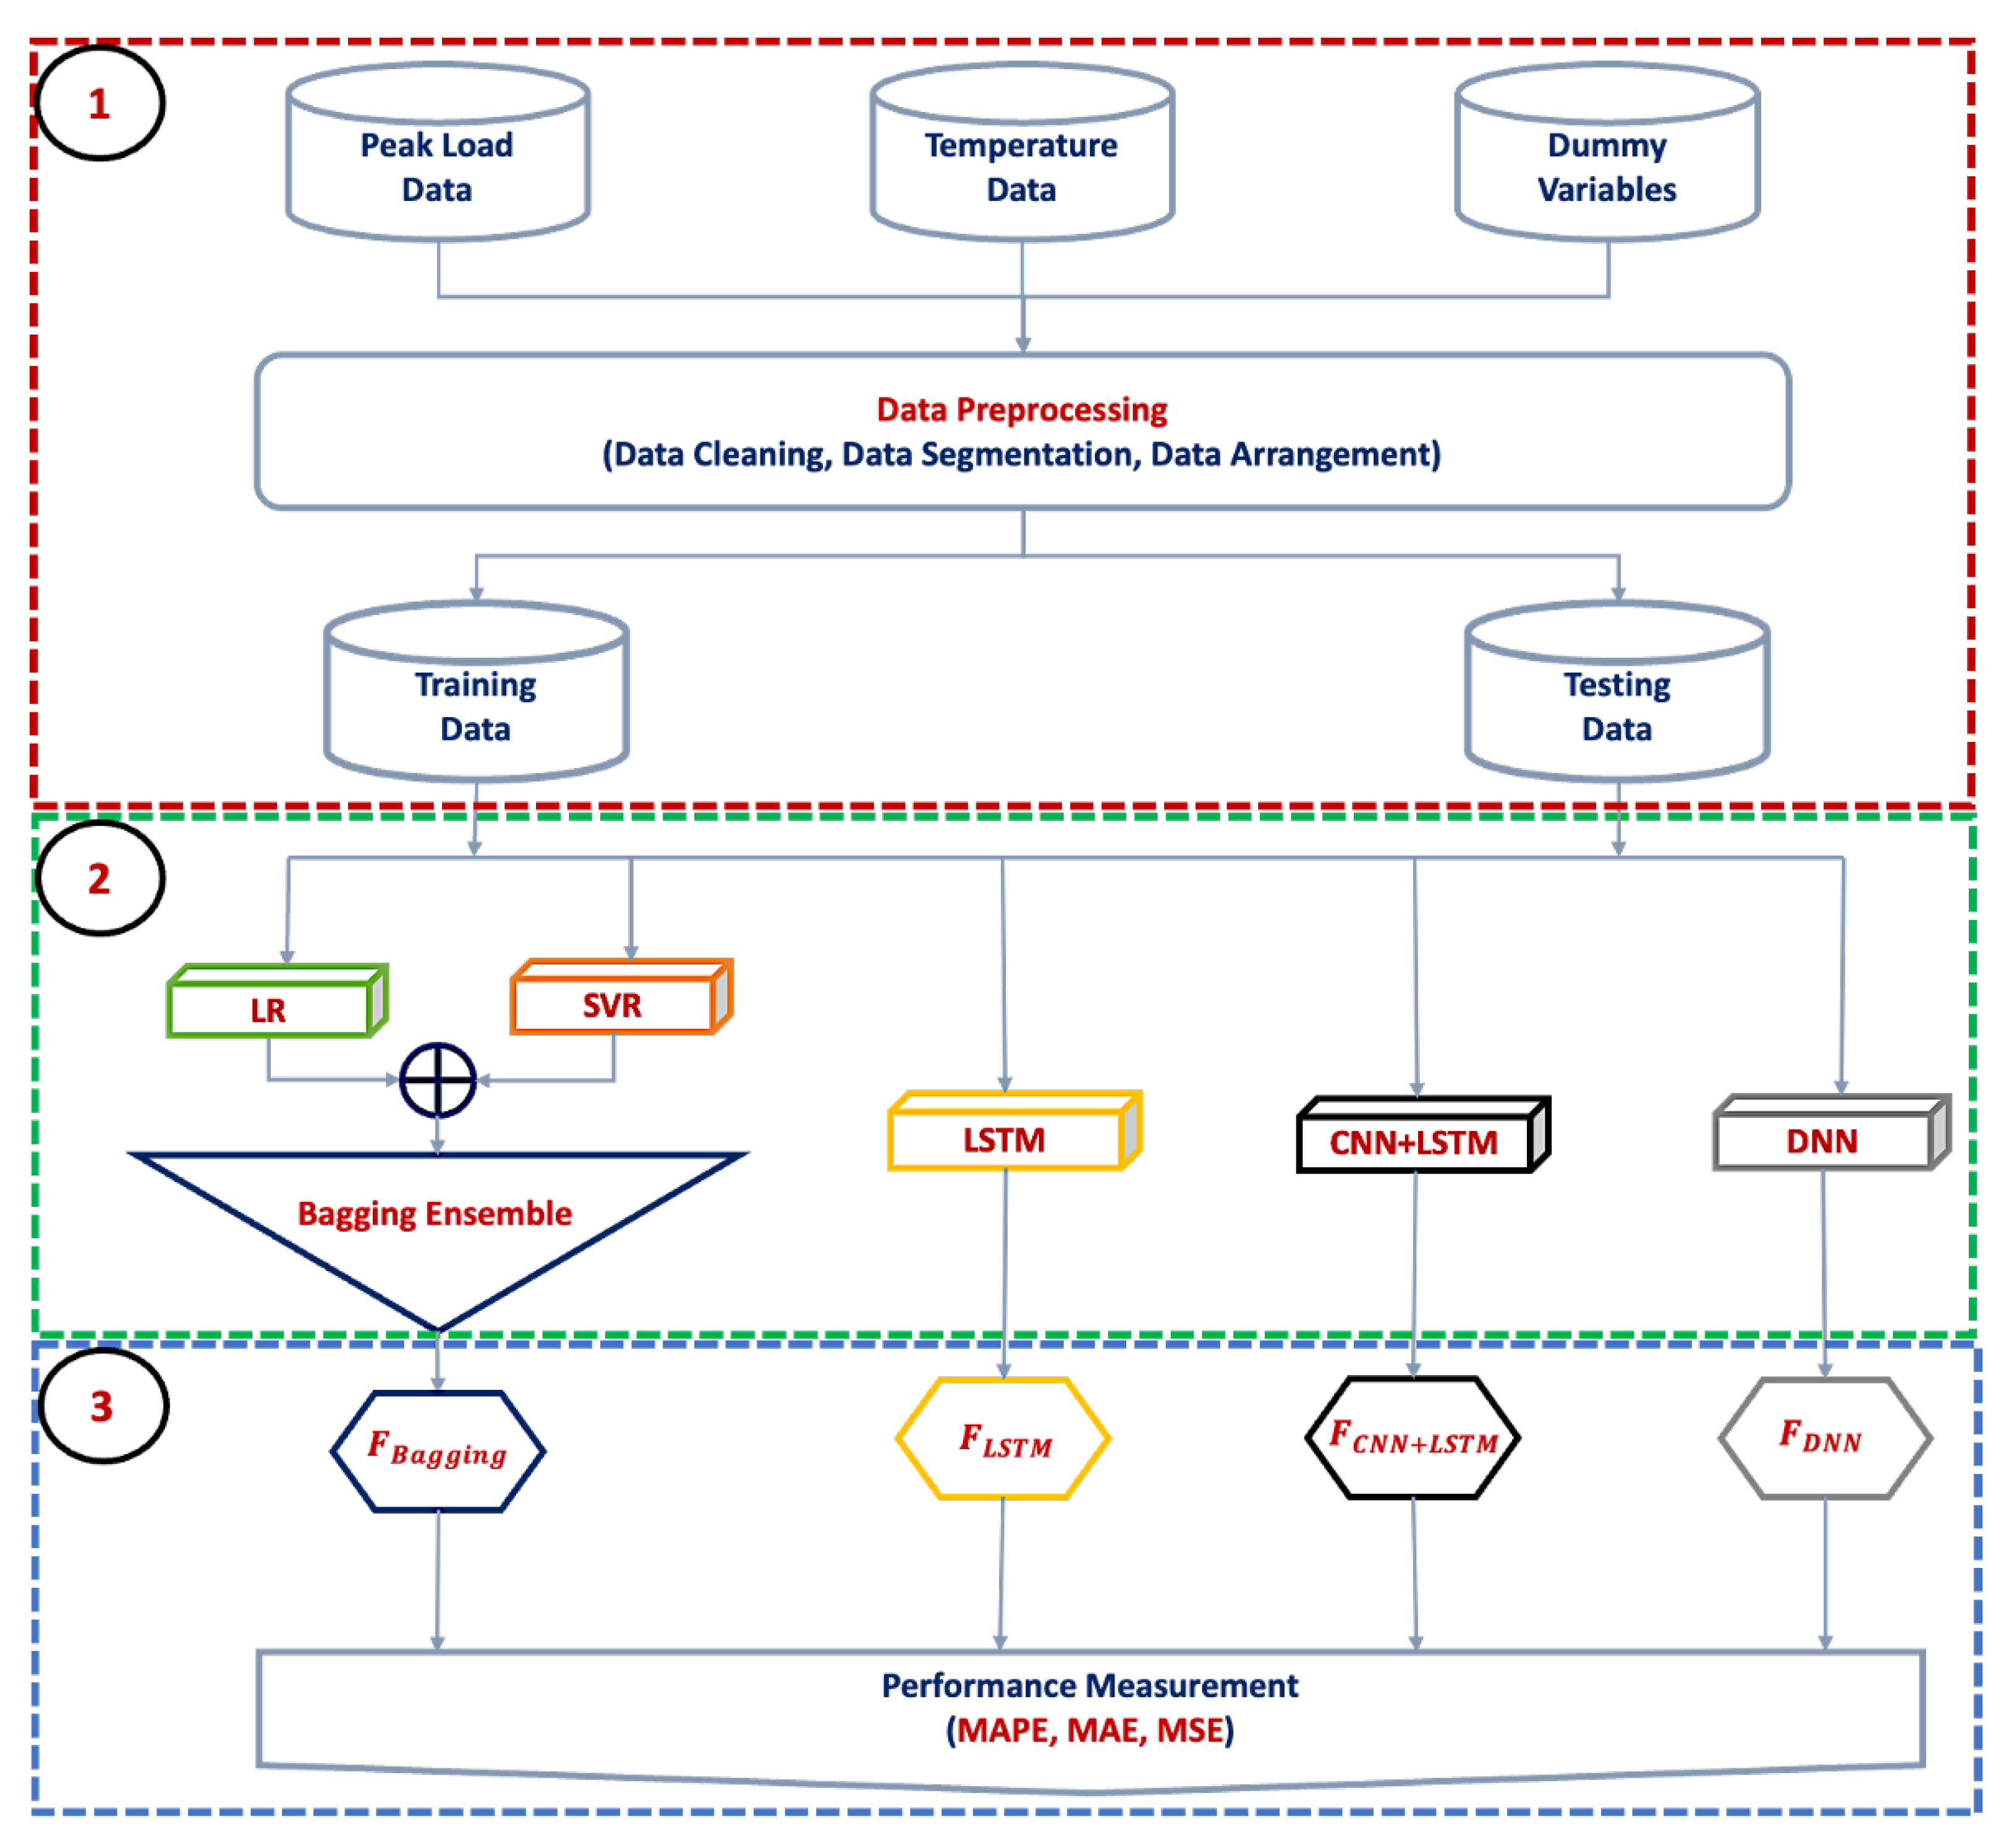
2. Methodology
2.1. Data Pre-Processing Module
2.1.1. Data Cleaning
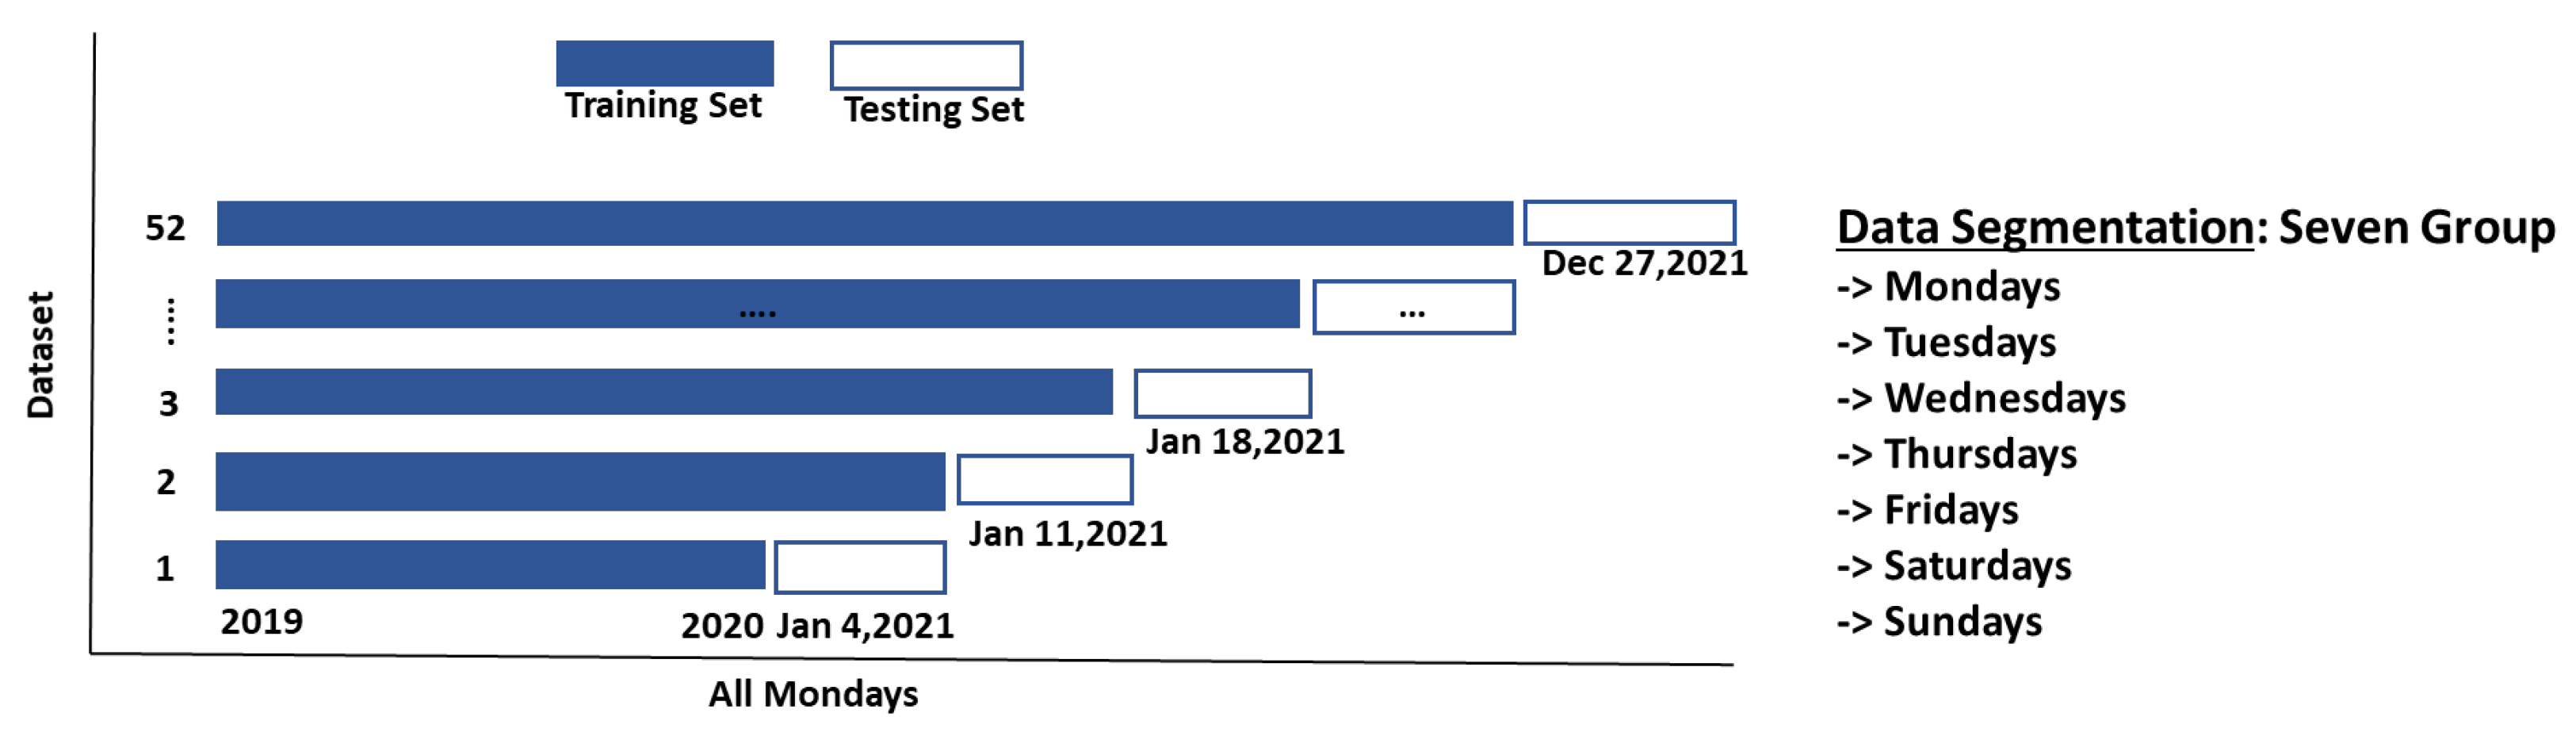
2.1.2. Data Segmentation
2.1.3. Selection of Input Features
2.2. Training Module
2.2.1. Bagging Ensemble Training Process
2.2.2. LSTM Training Process
2.2.3. CNN-LSTM Training Process
2.2.4. DNN Training Process
2.3. Forecasting Module
3. Results and Discussions
4. Conclusions
Author Contributions
Funding
Institutional Review Board Statement
Informed Consent Statement
Data Availability Statement
Acknowledgments
Conflicts of Interest
References
- Andriopoulos, N.; Magklaras, A.; Birbas, A.; Papalexopoulos, A.; Valouxis, C.; Daskalaki, S.; Birbas, M.; Housos, E.; Papaioannou, G.P. Short Term Electric Load Forecasting Based on Data Transformation and Statistical Machine Learning. Appl. Sci. 2021, 11, 158. [Google Scholar] [CrossRef]
- Papalexopoulos, A.D.; Hesterberg, T.C. A regression-based approach to short-term system load forecasting. IEEE Trans. Power Syst. 1990, 5, 1535–1547. [Google Scholar] [CrossRef]
- Henselmeyer, S.; Grzegorzek, M. Short-Term Load Forecasting Using an Attended Sequential Encoder-Stacked Decoder Model with Online Training. Appl. Sci. 2021, 11, 4927. [Google Scholar] [CrossRef]
- Christiaanse, W. Short-term load forecasting using general exponential smoothing. IEEE Trans. Power Appar. Syst. 1971, PAS-90, 900–911. [Google Scholar] [CrossRef]
- Liu, K.; Subbarayan, S.; Shoults, R.; Manry, M.; Kwan, C.; Lewis, F.; Naccarino, J. Comparison of very short-term load forecasting techniques. IEEE Trans. Power Syst. 1996, 11, 877–882. [Google Scholar] [CrossRef]
- Mohandes, M. Support vector machines for short-term electrical load forecasting. Int. J. Energy Res. 2002, 26, 335–345. [Google Scholar] [CrossRef]
- Hippert, H.S.; Pedreira, C.E.; Souza, R.C. Neural networks for short-term load forecasting: A review and evaluation. IEEE Trans. Power Syst. 2001, 16, 44–55. [Google Scholar] [CrossRef]
- Azadeh, A.; Saberi, M.; Gitiforouz, A. An integrated simulation-based fuzzy regression-time series algorithm for electricity consumption estimation with non-stationary data. J. Chin. Inst. Eng. 2011, 34, 1047–1066. [Google Scholar] [CrossRef]
- Sapankevych, N.I.; Sankar, R. Time series prediction using support vector machines: A survey. IEEE Comput. Intell. Mag. 2009, 4, 24–38. [Google Scholar] [CrossRef]
- Bottou, L. Large-scale machine learning with stochastic gradient descent. In Proceedings of the COMPSTAT’2010, Paris, France, 22–27 August 2010; pp. 177–186. [Google Scholar]
- Saber, A.Y.; Alam, A.R. Short term load forecasting using multiple linear regression for big data. In Proceedings of the 2017 IEEE Symposium Series on Computational Intelligence (SSCI), Honolulu, HI, USA, 27 November–1 December 2017; pp. 1–6. [Google Scholar]
- Phyo, P.P.; Jeenanunta, C.; Hashimoto, K. Electricity load forecasting in Thailand using deep learning models. Int. J. Electr. Electron. Eng. Telecommun. 2019, 8, 221–225. [Google Scholar] [CrossRef]
- Hinton, G.E.; Osindero, S.; Teh, Y.W. A fast learning algorithm for deep belief nets. Neural Comput. 2006, 18, 1527–1554. [Google Scholar] [CrossRef] [PubMed]
- Li, H.; Deng, J.; Yuan, S.; Feng, P.; Arachchige, D.D. Monitoring and Identifying Wind Turbine Generator Bearing Faults Using Deep Belief Network and EWMA Control Charts. Front. Energy Res. 2021, 9, 799039. [Google Scholar] [CrossRef]
- Hochreiter, S.; Schmidhuber, J. Long short-term memory. Neural Comput. 1997, 9, 1735–1780. [Google Scholar] [CrossRef] [PubMed]
- Urban, G.; Geras, K.J.; Kahou, S.E.; Aslan, O.; Wang, S.; Caruana, R.; Mohamed, A.; Philipose, M.; Richardson, M. Do deep convolutional nets really need to be deep and convolutional? arXiv 2016, arXiv:1603.05691. [Google Scholar]
- Phyo, P.P.; Byun, Y.C.; Park, N. Short-Term Energy Forecasting Using Machine-Learning-Based Ensemble Voting Regression. Symmetry 2022, 14, 160. [Google Scholar] [CrossRef]
- Liu, W.; Wang, Z.; Liu, X.; Zeng, N.; Liu, Y.; Alsaadi, F.E. A survey of deep neural network architectures and their applications. Neurocomputing 2017, 234, 11–26. [Google Scholar] [CrossRef]
- Dedinec, A.; Filiposka, S.; Dedinec, A.; Kocarev, L. Deep belief network based electricity load forecasting: An analysis of Macedonian case. Energy 2016, 115, 1688–1700. [Google Scholar] [CrossRef]
- Phyo, P.P.; Jeenanunta, C. Daily Load Forecasting Based on a Combination of Classification and Regression Tree and Deep Belief Network. IEEE Access 2021, 9, 152226–152242. [Google Scholar] [CrossRef]
- Qiu, X.; Zhang, L.; Ren, Y.; Suganthan, P.N.; Amaratunga, G. Ensemble deep learning for regression and time series forecasting. In Proceedings of the 2014 IEEE Symposium on Computational Intelligence in Ensemble Learning (CIEL), Orlando, FL, USA, 9–12 December 2014; pp. 1–6. [Google Scholar]
- El-Sharkh, M.Y.; Rahman, M.A. Forecasting electricity demand using dynamic artificial neural network model. In Proceedings of the 2012 International Conference on Industrial Engineering and Operations Management, Istanbul, Turkey, 3–6 July 2012; pp. 3–6. [Google Scholar]
- Rashid, T.; Huang, B.; Kechadi, M.; Gleeson, B. Auto-regressive recurrent neural network approach for electricity load forecasting. Int. J. Comput. Intell. 2006, 3, 1–9. [Google Scholar]
- Hatalis, K.; Pradhan, P.; Kishore, S.; Blum, R.S.; Lamadrid, A.J. Multi-step forecasting of wave power using a nonlinear recurrent neural network. In Proceedings of the 2014 IEEE PES General Meeting|Conference & Exposition, National Harbor, MD, USA, 27–31 July 2014; pp. 1–5. [Google Scholar]
- Kelo, S.; Dudul, S. A wavelet Elman neural network for short-term electrical load prediction under the influence of temperature. Int. J. Electr. Power Energy Syst. 2012, 43, 1063–1071. [Google Scholar] [CrossRef]
- Cheng, Y.; Xu, C.; Mashima, D.; Thing, V.L.; Wu, Y. PowerLSTM: Power demand forecasting using long short-term memory neural network. In Proceedings of the International Conference on Advanced Data Mining and Applications, Singapore, 5–6 November 2017; pp. 727–740. [Google Scholar]
- Bouktif, S.; Fiaz, A.; Ouni, A.; Serhani, M.A. Optimal deep learning lstm model for electric load forecasting using feature selection and genetic algorithm: Comparison with machine learning approaches. Energies 2018, 11, 1636. [Google Scholar] [CrossRef] [Green Version]
- Syed, D.; Abu-Rub, H.; Ghrayeb, A.; Refaat, S.S. Household-level energy forecasting in smart buildings using a novel hybrid deep learning model. IEEE Access 2021, 9, 33498–33511. [Google Scholar] [CrossRef]
- Ullah, I.; Liu, K.; Yamamoto, T.; Zahid, M.; Jamal, A. Electric vehicle energy consumption prediction using stacked generalization: An ensemble learning approach. Int. J. Green Energy 2021, 18, 896–909. [Google Scholar] [CrossRef]
- Khan, A.N.; Iqbal, N.; Ahmad, R.; Kim, D.H. Ensemble prediction approach based on learning to statistical model for efficient building energy consumption management. Symmetry 2021, 13, 405. [Google Scholar] [CrossRef]
- Dong, Z.; Liu, J.; Liu, B.; Li, K.; Li, X. Hourly energy consumption prediction of an office building based on ensemble learning and energy consumption pattern classification. Energy Build. 2021, 241, 110929. [Google Scholar] [CrossRef]
- Ngo, N.T.; Pham, A.D.; Truong, T.T.H.; Truong, N.S.; Huynh, N.T.; Pham, T.M. An ensemble machine learning model for enhancing the prediction accuracy of energy consumption in buildings. Arab. J. Sci. Eng. 2022, 47, 4105–4117. [Google Scholar] [CrossRef]
- Wang, X.; Wang, S.; Zhao, Q.; Wang, S.; Fu, L. A multi-energy load prediction model based on deep multi-task learning and ensemble approach for regional integrated energy systems. Int. J. Electr. Power Energy Syst. 2021, 126, 106583. [Google Scholar]
- da Silva, R.G.; Ribeiro, M.H.D.M.; Moreno, S.R.; Mariani, V.C.; dos Santos Coelho, L. A novel decomposition-ensemble learning framework for multi-step ahead wind energy forecasting. Energy 2021, 216, 119174. [Google Scholar] [CrossRef]
- Li, H.; Deng, J.; Feng, P.; Pu, C.; Arachchige, D.D.; Cheng, Q. Short-Term Nacelle Orientation Forecasting Using Bilinear Transformation and ICEEMDAN Framework. Front. Energy Res. 2021, 9, 780928. [Google Scholar] [CrossRef]
- Phyo, P.P.; Byun, Y.C. Hybrid Ensemble Deep Learning-Based Approach for Time Series Energy Prediction. Symmetry 2021, 13, 1942. [Google Scholar] [CrossRef]
- Jeenanunta, C.; Abeyrathna, K.D.; Dilhani, M.S.; Hnin, S.W.; Phyo, P.P. Time series outlier detection for short-term electricity load demand forecasting. Int. Sci. J. Eng. Technol. (ISJET) 2018, 2, 37–50. [Google Scholar]
- Rashid, F.; Ahmad, R.; Talha, H.M.; Khalid, A. Dynamic Load Sharing at Domestic Level Using the Internet of Things. Int. J. Integr. Eng. 2020, 12, 57–65. [Google Scholar] [CrossRef]


| Inputs | Target | ||||||
| No. | |||||||
| Training Dataset | 1 | 04/01/19 (Fri) | 10/01/19 (Thur) | 10/01/19 (Thur) | 10/01/19 (Thur) | 0.98 | 11/01/19 (Fri) |
| . | . | . | . | . | . | . | |
| . | . | . | . | . | . | . | |
| . | . | . | . | . | . | . | |
| 104 | 11/12/20 (Fri) | 17/12/20 (Thur) | 17/12/20 (Thur) | 17/12/20 (Thur) | 0.99 | 18/12/20 (Fri) | |
| Inputs | Target | ||||||
| No. | |||||||
| Testing Dataset | 1 | 25/12/20 (Fri) | 31/12/20 (Thur) | 31/12/20 (Thur) | 31/12/20 (Thur) | 1.02 | 01/01/21 (Fri) |
| LSTM | CNN+LSTM | DNN | Bagging Ensemble Model | |||||||||
|---|---|---|---|---|---|---|---|---|---|---|---|---|
| MAPE (%) | MAE (MW) | MSE (GW) | MAPE (%) | MAE (MW) | MSE (GW) | MAPE (%) | MAE (MW) | MSE (GW) | MAPE (%) | MAE (MW) | MSE (GW) | |
| Jan | 13.08 | 2235.17 | 9070.42 | 12.88 | 2185.09 | 8397.09 | 13.72 | 2359.98 | 9774.87 | 12.98 | 2093.38 | 8930.46 |
| Feb | 4.84 | 1032.30 | 1496.87 | 4.73 | 1013.17 | 1579.03 | 4.76 | 1014.28 | 1456.72 | 3.29 | 680.38 | 813.99 |
| Mar | 5.97 | 1445.93 | 2734.75 | 6.58 | 1594.10 | 3330.44 | 6.09 | 1472.09 | 2827.14 | 6.48 | 1569.43 | 2960.72 |
| Apr | 12.68 | 2652.65 | 11,081.15 | 13.12 | 2746.25 | 11,586.12 | 12.71 | 2663.27 | 11,132.87 | 9.94 | 2130.98 | 7068.72 |
| May | 7.46 | 1747.65 | 4822.34 | 7.14 | 1664.28 | 4675.03 | 7.34 | 1728.00 | 4822.21 | 7.33 | 1756.00 | 4480.45 |
| Jun | 4.92 | 1174.47 | 2056.87 | 5.14 | 1227.47 | 2269.68 | 4.95 | 1181.06 | 2106.70 | 4.88 | 1180.28 | 1970.48 |
| Jul | 5.22 | 1128.93 | 2049.82 | 5.12 | 1111.66 | 1994.53 | 5.08 | 1099.24 | 1980.59 | 4.17 | 907.72 | 1406.96 |
| Aug | 5.35 | 1201.36 | 2214.92 | 5.25 | 1179.41 | 2120.09 | 5.34 | 1197.99 | 2212.39 | 4.17 | 928.65 | 1246.86 |
| Sep | 3.43 | 755.24 | 930.58 | 4.05 | 893.08 | 1239.53 | 3.40 | 748.40 | 905.92 | 2.36 | 512.57 | 421.70 |
| Oct | 4.47 | 977.75 | 1439.40 | 4.54 | 996.56 | 1455.05 | 4.59 | 1004.31 | 1503.78 | 3.16 | 681.71 | 754.51 |
| Nov | 4.74 | 1040.95 | 1422.87 | 4.92 | 1082.02 | 1569.09 | 4.85 | 1065.46 | 1478.61 | 3.88 | 844.52 | 928.57 |
| Dec | 8.49 | 1534.56 | 5032.24 | 8.51 | 1545.56 | 5016.54 | 8.39 | 1518.97 | 4857.91 | 9.62 | 1754.26 | 5920.08 |
| Average | 6.74 | 1413.74 | 3712.15 | 6.85 | 1439.48 | 3783.01 | 6.79 | 1424.50 | 3772.21 | 6.05 | 1258.98 | 3099.11 |
| LSTM | CNN+LSTM | DNN | Bagging Ensemble Model | |||||||||
|---|---|---|---|---|---|---|---|---|---|---|---|---|
| MAPE (%) | MAE (MW) | MSE (GW) | MAPE (%) | MAE (MW) | MSE (GW) | MAPE (%) | MAE (MW) | MSE (GW) | MAPE (%) | MAE (MW) | MSE (GW) | |
| Jan | 13.47 | 2302.89 | 9434.34 | 12.82 | 2169.25 | 8326.74 | 13.66 | 2346.44 | 9702.55 | 13.30 | 2156.66 | 9328.55 |
| Feb | 4.94 | 1052.54 | 1555.61 | 4.71 | 1008.24 | 1569.31 | 4.74 | 1010.59 | 1445.70 | 4.08 | 849.31 | 1041.12 |
| Mar | 5.64 | 1363.73 | 2474.69 | 6.57 | 1592.86 | 3317.03 | 6.05 | 1463.81 | 2793.74 | 6.17 | 1491.13 | 2771.64 |
| Apr | 12.85 | 2685.20 | 11,407.45 | 13.09 | 2737.26 | 11,567.10 | 12.68 | 2655.50 | 11,063.96 | 9.36 | 2017.90 | 6383.87 |
| May | 7.38 | 1730.76 | 4733.29 | 7.15 | 1666.79 | 4664.40 | 7.33 | 1725.31 | 4803.78 | 7.60 | 1818.32 | 4736.45 |
| Jun | 4.86 | 1156.05 | 2005.84 | 5.13 | 1225.57 | 2254.33 | 4.94 | 1180.03 | 2092.43 | 4.79 | 1155.41 | 1900.14 |
| Jul | 5.40 | 1165.50 | 2172.26 | 5.11 | 1108.74 | 1985.82 | 5.07 | 1097.75 | 1973.20 | 4.30 | 933.69 | 1472.71 |
| Aug | 5.22 | 1169.25 | 2168.62 | 5.23 | 1175.00 | 2109.25 | 5.33 | 1197.39 | 2206.47 | 4.09 | 911.47 | 1195.68 |
| Sep | 3.34 | 731.34 | 859.70 | 4.04 | 891.51 | 1233.88 | 3.38 | 744.35 | 898.31 | 2.44 | 529.81 | 462.55 |
| Oct | 4.40 | 958.21 | 1431.91 | 4.53 | 995.41 | 1452.99 | 4.57 | 1001.54 | 1500.10 | 3.28 | 711.41 | 794.38 |
| Nov | 4.64 | 1014.20 | 1358.34 | 4.92 | 1081.30 | 1565.14 | 4.85 | 1066.07 | 1476.86 | 3.91 | 855.13 | 903.18 |
| Dec | 8.68 | 1568.35 | 5228.79 | 8.50 | 1542.71 | 5014.64 | 8.36 | 1513.71 | 4840.41 | 9.33 | 1699.77 | 5656.51 |
| Average | 6.75 | 1411.22 | 3751.94 | 6.83 | 1435.82 | 3768.63 | 6.77 | 1420.27 | 3750.29 | 6.08 | 1265.55 | 3077.47 |
| LSTM | CNN+LSTM | DNN | Bagging Ensemble Model | |||||||||
|---|---|---|---|---|---|---|---|---|---|---|---|---|
| MAPE (%) | MAE (MW) | MSE (GW) | MAPE (%) | MAE (MW) | MSE (GW) | MAPE (%) | MAE (MW) | MSE (GW) | MAPE (%) | MAE (MW) | MSE (GW) | |
| Jan | 13.86 | 2365.26 | 10,111.87 | 13.29 | 2269.25 | 9485.31 | 13.65 | 2344.11 | 9724.30 | 15.34 | 2564.18 | 10,180.74 |
| Feb | 4.87 | 1034.95 | 1515.81 | 4.65 | 995.74 | 1534.25 | 4.71 | 1003.79 | 1427.19 | 5.88 | 1213.62 | 2052.17 |
| Mar | 5.43 | 1311.84 | 2321.53 | 6.49 | 1572.13 | 3250.22 | 5.98 | 1445.96 | 2745.80 | 4.01 | 982.23 | 1392.94 |
| Apr | 12.95 | 2698.69 | 11,588.90 | 13.15 | 2749.12 | 11,644.37 | 12.74 | 2667.98 | 11,151.51 | 7.93 | 1735.60 | 4007.19 |
| May | 7.42 | 1739.76 | 4787.04 | 7.18 | 1671.46 | 4699.33 | 7.33 | 1724.78 | 4804.21 | 7.00 | 1663.69 | 4013.99 |
| Jun | 4.87 | 1156.13 | 2067.77 | 5.14 | 1229.19 | 2272.48 | 4.94 | 1180.86 | 2102.16 | 4.72 | 1141.76 | 1934.57 |
| Jul | 5.63 | 1215.65 | 2372.88 | 5.13 | 1114.11 | 2005.08 | 5.09 | 1101.11 | 1989.94 | 3.68 | 812.37 | 1050.80 |
| Aug | 5.17 | 1155.53 | 2170.30 | 5.26 | 1182.95 | 2129.16 | 5.35 | 1201.38 | 2225.85 | 4.33 | 967.23 | 1347.89 |
| Sep | 3.35 | 733.56 | 878.89 | 4.09 | 903.07 | 1259.64 | 3.40 | 749.55 | 909.87 | 2.39 | 522.24 | 441.59 |
| Oct | 4.45 | 966.99 | 1479.57 | 4.57 | 1004.25 | 1472.86 | 4.61 | 1009.43 | 1514.38 | 4.13 | 907.69 | 1252.86 |
| Nov | 4.67 | 1021.29 | 1381.03 | 4.95 | 1088.48 | 1585.90 | 4.88 | 1073.17 | 1499.20 | 4.13 | 915.09 | 1122.71 |
| Dec | 8.86 | 1597.99 | 5527.36 | 8.50 | 1544.94 | 4965.67 | 8.36 | 1513.95 | 4818.58 | 7.22 | 1317.83 | 3443.50 |
| Average | 6.82 | 1419.76 | 3868.02 | 6.89 | 1446.87 | 3874.16 | 6.77 | 1421.41 | 3759.89 | 5.91 | 1230.39 | 2700.84 |
| LSTM | CNN+LSTM | DNN | Bagging Ensemble Model | |||||||||
|---|---|---|---|---|---|---|---|---|---|---|---|---|
| MAPE (%) | MAE (MW) | MSE (GW) | MAPE (%) | MAE (MW) | MSE (GW) | MAPE (%) | MAE (MW) | MSE (GW) | MAPE (%) | MAE (MW) | MSE (GW) | |
| Jan | 13.06 | 2222.83 | 9319.77 | 13.31 | 2278.28 | 9906.45 | 13.61 | 2336.18 | 9664.02 | 10.71 | 1771.09 | 5929.37 |
| Feb | 4.60 | 977.39 | 1362.42 | 4.73 | 1012.83 | 1575.91 | 4.70 | 1001.53 | 1421.40 | 4.39 | 905.93 | 1309.20 |
| Mar | 5.28 | 1276.51 | 2283.40 | 6.60 | 1600.12 | 3342.88 | 5.98 | 1445.98 | 2741.79 | 4.01 | 993.48 | 1511.03 |
| Apr | 13.49 | 2847.43 | 12,129.30 | 13.07 | 2733.13 | 11,532.10 | 12.70 | 2659.44 | 11,102.30 | 9.97 | 2142.93 | 6530.93 |
| May | 7.17 | 1677.72 | 4506.97 | 7.16 | 1669.31 | 4681.90 | 7.32 | 1723.51 | 4796.36 | 7.10 | 1677.81 | 4510.27 |
| Jun | 4.93 | 1170.28 | 2077.95 | 5.11 | 1222.13 | 2246.29 | 4.93 | 1177.09 | 2088.14 | 4.75 | 1138.79 | 2089.53 |
| Jul | 5.67 | 1222.75 | 2355.99 | 5.10 | 1107.68 | 1979.51 | 5.08 | 1100.32 | 1984.25 | 4.97 | 1073.62 | 1766.54 |
| Aug | 5.32 | 1190.37 | 2223.38 | 5.22 | 1173.59 | 2104.87 | 5.33 | 1196.94 | 2210.42 | 5.48 | 1232.26 | 2356.22 |
| Sep | 3.34 | 729.84 | 858.84 | 4.04 | 890.43 | 1232.04 | 3.39 | 747.37 | 904.26 | 3.33 | 731.15 | 882.58 |
| Oct | 4.42 | 959.36 | 1463.77 | 4.53 | 994.94 | 1451.84 | 4.60 | 1007.93 | 1511.07 | 4.85 | 1070.56 | 1878.72 |
| Nov | 4.70 | 1026.40 | 1402.03 | 4.90 | 1078.62 | 1559.26 | 4.87 | 1069.95 | 1490.00 | 4.40 | 973.18 | 1313.48 |
| Dec | 8.82 | 1590.31 | 5466.79 | 8.50 | 1542.88 | 5013.12 | 8.34 | 1511.40 | 4813.56 | 7.79 | 1423.98 | 3846.71 |
| Average | 6.75 | 1410.74 | 3803.87 | 6.87 | 1445.09 | 3901.68 | 6.76 | 1418.22 | 3744.40 | 6.00 | 1264.31 | 2840.87 |
| Five Inputs | Six Inputs | Nine Inputs | Ten Inputs | |||||||||||||
|---|---|---|---|---|---|---|---|---|---|---|---|---|---|---|---|---|
| LSTM | CNN+LSTM | DNN | Bagging Ensemble Model | LSTM | CNN+LSTM | DNN | Bagging Ensemble Model | LSTM | CNN+LSTM | DNN | Bagging Ensemble Model | LSTM | CNN+LSTM | DNN | Bagging Ensemble Model | |
| Holidays | 20.19 | 20.23 | 20.09 | 18.78 | 20.29 | 20.29 | 20.08 | 19.01 | 20.77 | 20.30 | 20.07 | 15.60 | 20.45 | 20.25 | 20.07 | 16.10 |
| Bridging Holidays | 9.5 | 10.16 | 9.26 | 7.76 | 10.07 | 10.28 | 9.25 | 8.16 | 10.49 | 10.22 | 9.26 | 6.56 | 10.07 | 10.20 | 9.25 | 8.41 |
| Mondays | 5.39 | 5.39 | 5.42 | 5.73 | 5.39 | 5.39 | 5.42 | 5.73 | 5.47 | 5.35 | 5.44 | 5.80 | 5.35 | 5.39 | 5.42 | 5.17 |
| Weekdays | 5.6 | 5.79 | 5.63 | 4.92 | 5.62 | 5.76 | 5.60 | 4.93 | 5.61 | 5.84 | 5.61 | 4.80 | 5.64 | 5.86 | 5.59 | 5.00 |
| Weekends | 6.64 | 6.67 | 6.78 | 5.66 | 6.62 | 6.64 | 6.76 | 5.68 | 6.71 | 6.70 | 6.77 | 6.02 | 6.56 | 6.61 | 6.75 | 6.10 |
Publisher’s Note: MDPI stays neutral with regard to jurisdictional claims in published maps and institutional affiliations. |
© 2022 by the authors. Licensee MDPI, Basel, Switzerland. This article is an open access article distributed under the terms and conditions of the Creative Commons Attribution (CC BY) license (https://creativecommons.org/licenses/by/4.0/).
Share and Cite
Phyo, P.-P.; Jeenanunta, C. Advanced ML-Based Ensemble and Deep Learning Models for Short-Term Load Forecasting: Comparative Analysis Using Feature Engineering. Appl. Sci. 2022, 12, 4882. https://doi.org/10.3390/app12104882
Phyo P-P, Jeenanunta C. Advanced ML-Based Ensemble and Deep Learning Models for Short-Term Load Forecasting: Comparative Analysis Using Feature Engineering. Applied Sciences. 2022; 12(10):4882. https://doi.org/10.3390/app12104882
Chicago/Turabian StylePhyo, Pyae-Pyae, and Chawalit Jeenanunta. 2022. "Advanced ML-Based Ensemble and Deep Learning Models for Short-Term Load Forecasting: Comparative Analysis Using Feature Engineering" Applied Sciences 12, no. 10: 4882. https://doi.org/10.3390/app12104882
APA StylePhyo, P.-P., & Jeenanunta, C. (2022). Advanced ML-Based Ensemble and Deep Learning Models for Short-Term Load Forecasting: Comparative Analysis Using Feature Engineering. Applied Sciences, 12(10), 4882. https://doi.org/10.3390/app12104882