
Design of Fairway Width Based on a Grounding and Collision Risk Model in the South Coast of Korean Waterways


Abstract
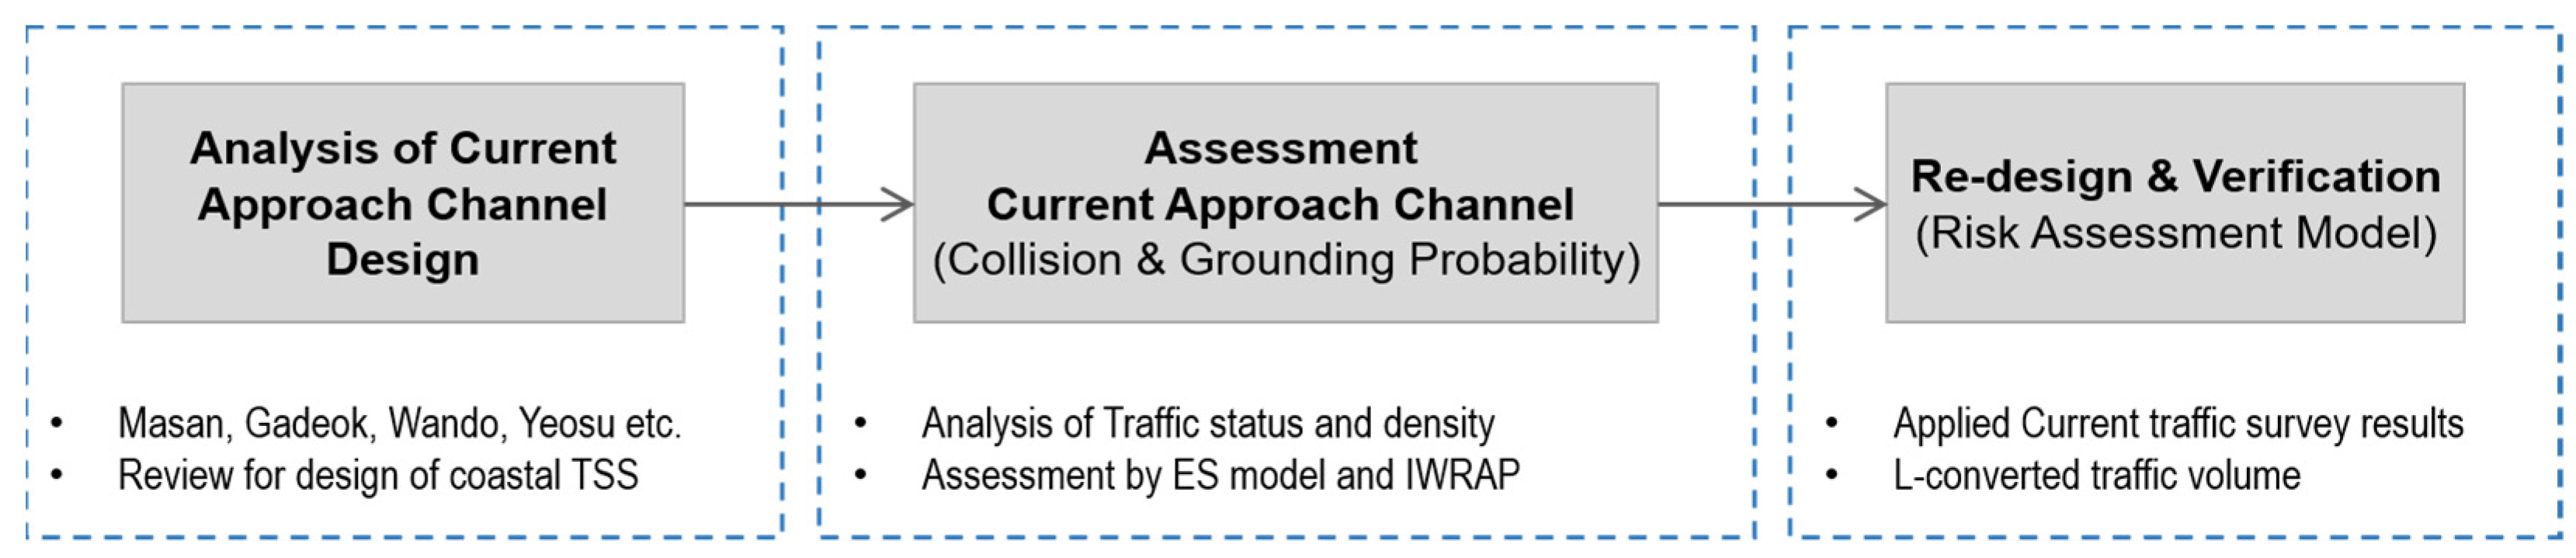
:1. Introduction
2. Status Analysis of the Fairway
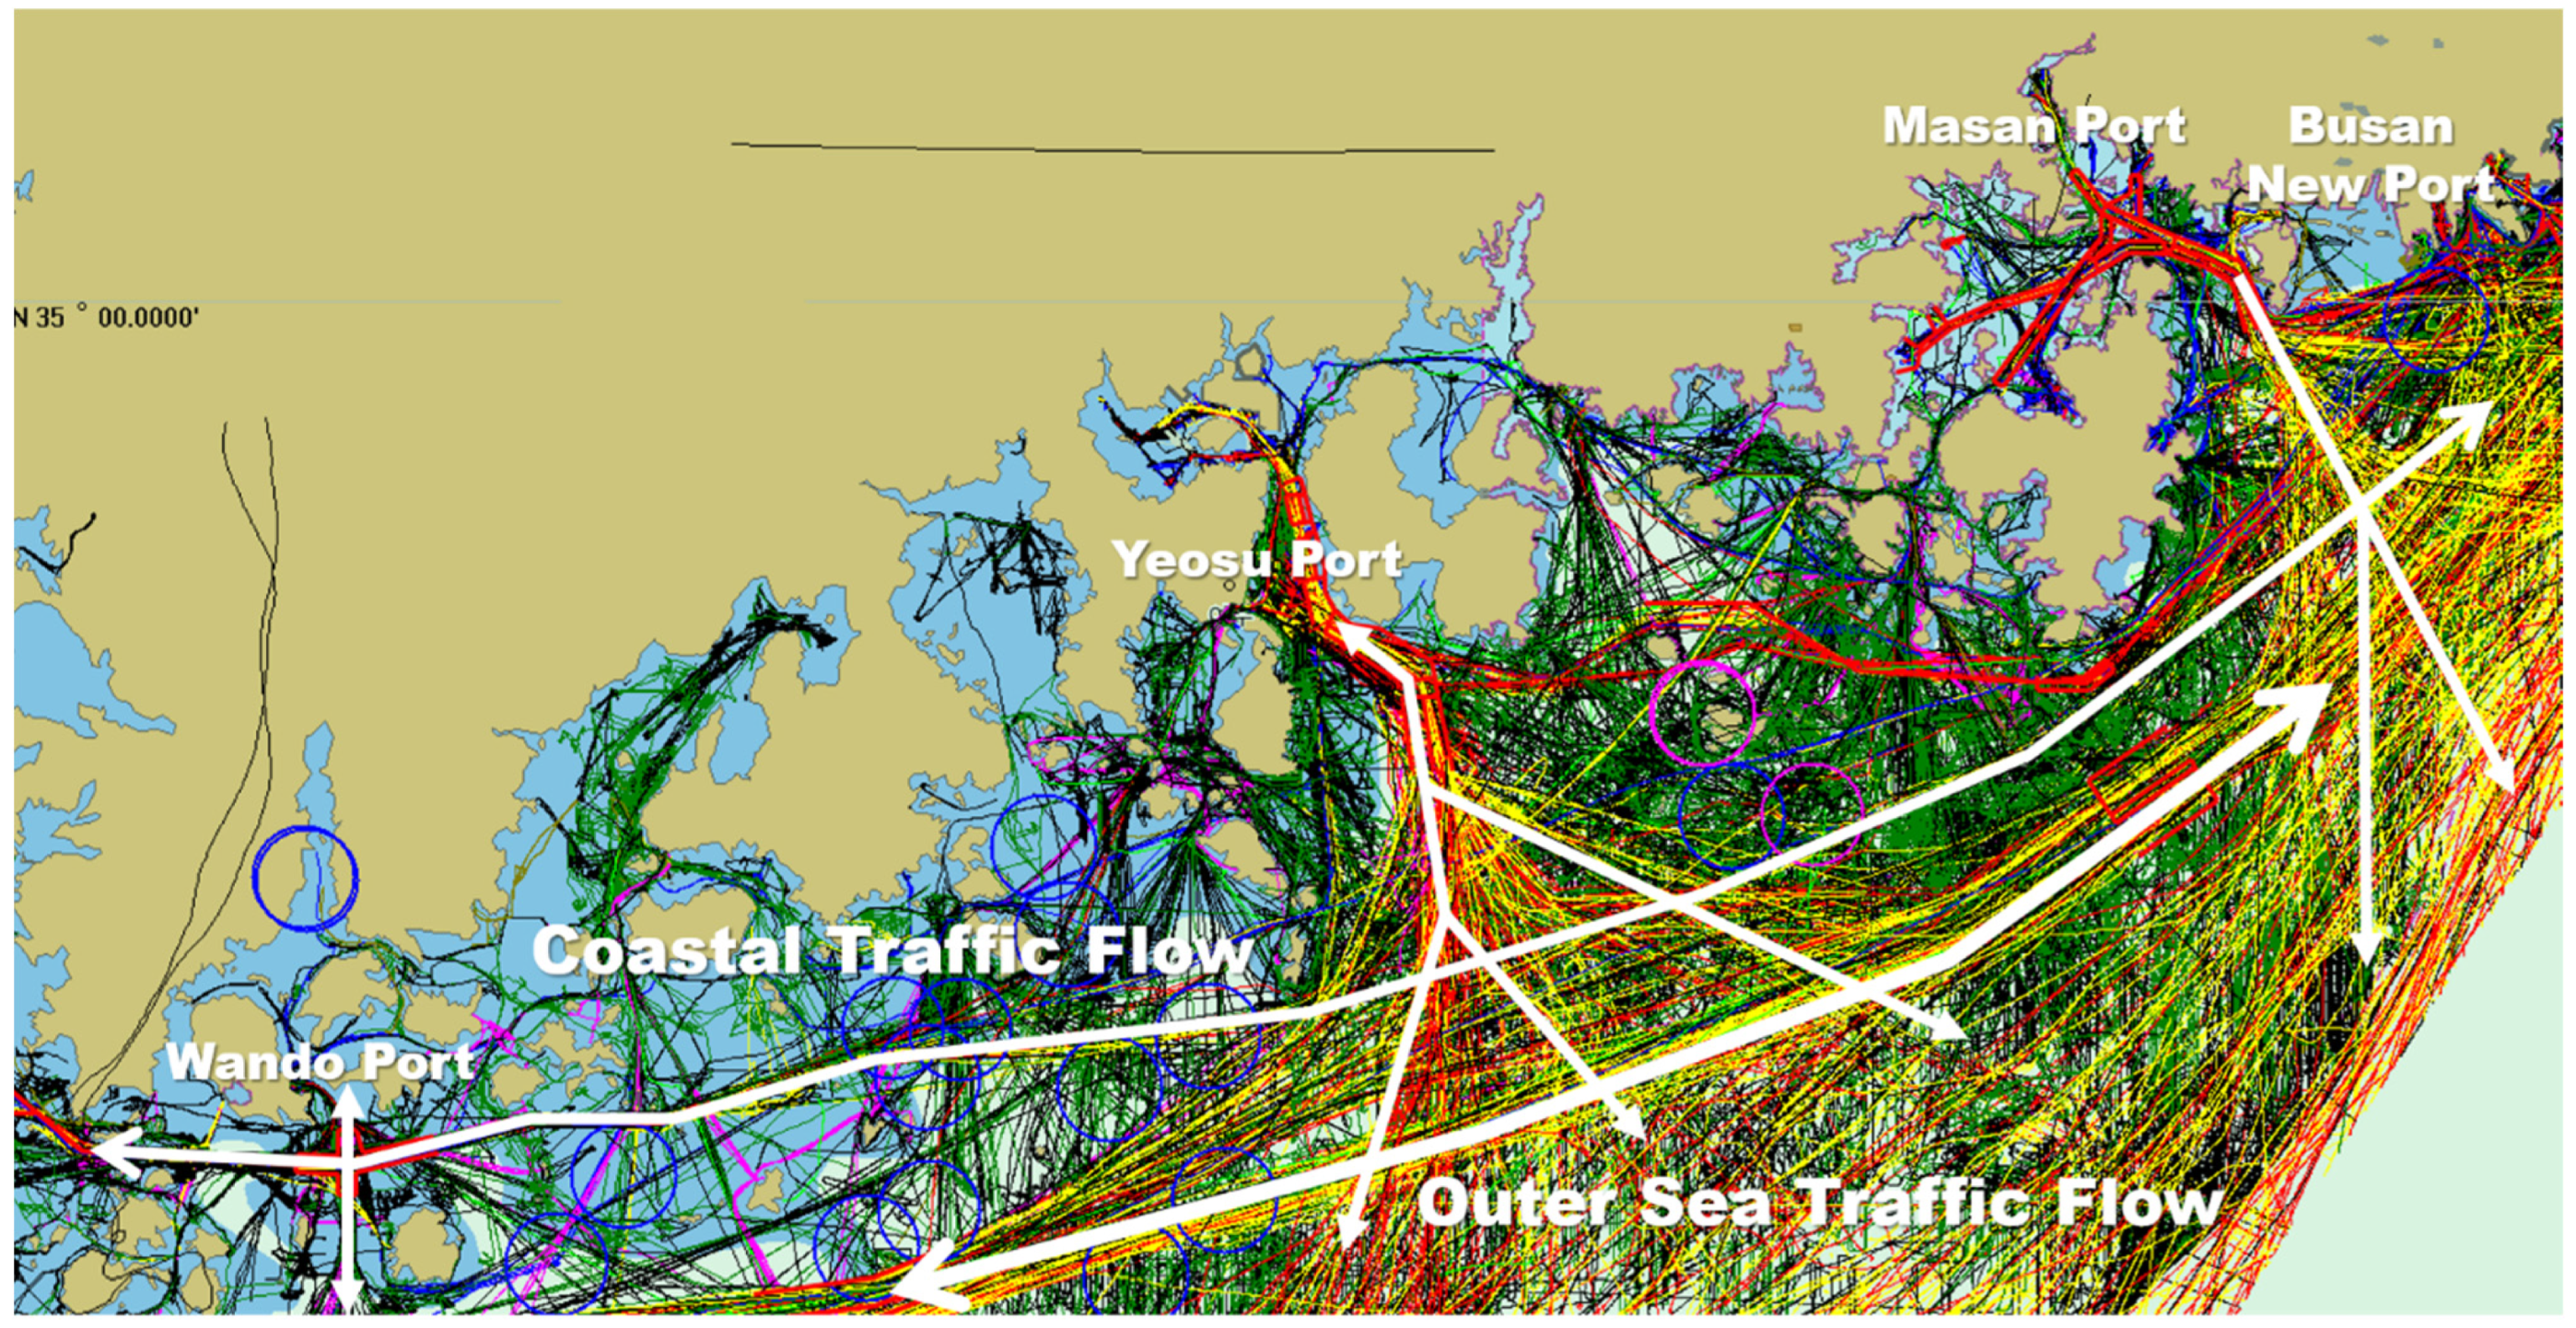
2.1. Selection of Fairways to Be Analyzed
2.2. General Status Analysis of Fairways
2.3. Analysis of Appropriate Fairway Width Based on Design Standards
| Basic maneuvering lane; | |
| Additional widths to allow for the effects of wind, etc.; | |
| Bank clearance; | |
| Passing distance between both maneuvering lanes |
3. Conformity Review According to Fairway Design Standard
3.1. Analysis of Vessel Traffic Status
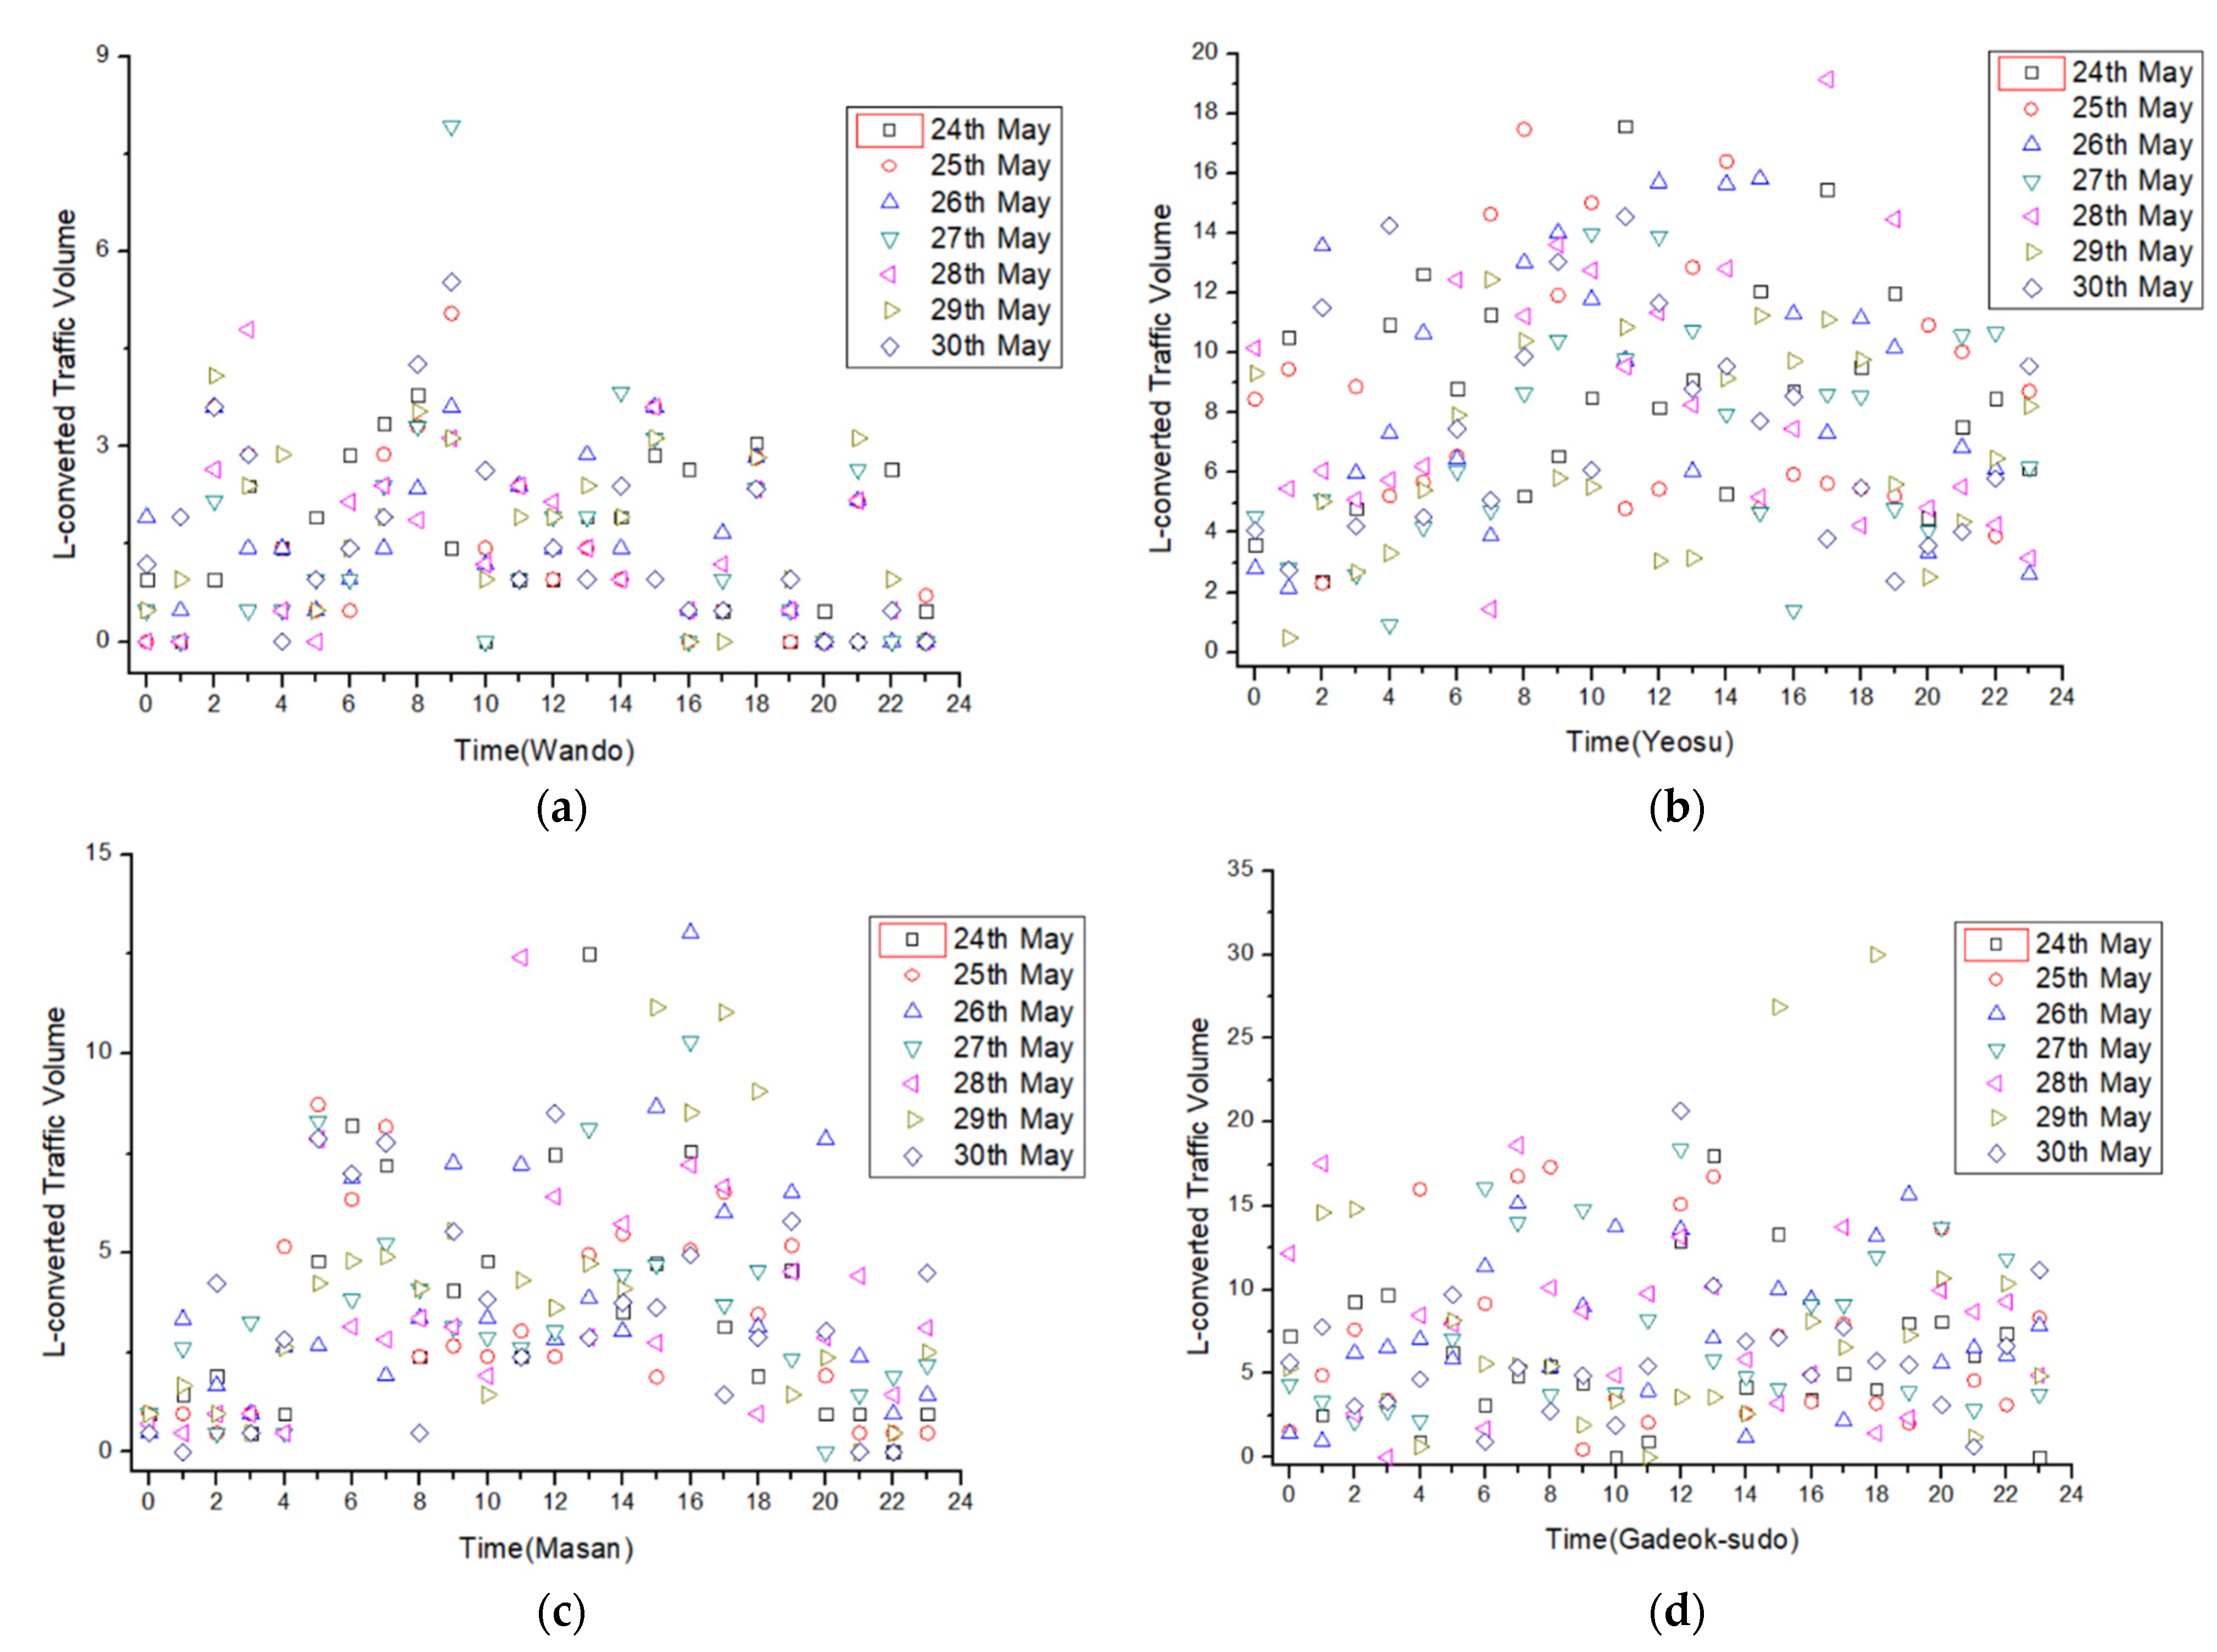
3.2. L-Converted Traffic Volume
3.3. Analysis of Marine Traffic Congestion for Fairways
| Traffic Congestion; | |
| Traffic Volume; | |
| Practical Traffic Volume; |
| Basic Traffic Volume; | |
| Long Diameter of occupied area of standard vessel (km); | |
| Short Diameter of occupied area of standard vessel (km); | |
| Fairway Width (km); | |
| Vessel Speed (km/h) |
3.4. Conformity Review
4. Re-Designing of the Appropriate Fairway Width
4.1. Assessment Overview
- ES Model
| Risk of obstacles; | |
| Distance to obstacles; | |
| Speed of the own ship; | |
| Coefficient determined by natural conditions; | |
. | |
| In case the condition of encounter with the target ship is: Crossing from starboard, . | |
| If crossed from portside, . | |
| If meeting from the bow, . | |
| If the ship is overpassed from the stern, . | |
| Risk concerning the target ship; | |
| Relative distance between own ship and target ships; | |
| Relative speed between own ship and target ships; | |
| Average length of the ship and target ships. | |
- 2.
- IWRAP Grounding Probability
| Average distance between position checks by the navigator; | |
| Distance from the obstacle to the bend in the navigation route varying with the lateral position, s, of the ship; | |
| Index for ship class, categorized after vessel type and dead weight or length; | |
| Probability density function for the ship traffic; | |
| Expected number of category I grounding events per year; | |
| Expected number of category II grounding events per year; | |
| Causation probability, i.e., ratio between ships grounding and ships on a grounding course; | |
| Number of ships in class i passing a cross section of the route per year; | |
| Coordinate in the direction perpendicular to the route; | |
| Transverse coordinates for an obstacle. |
- 3.
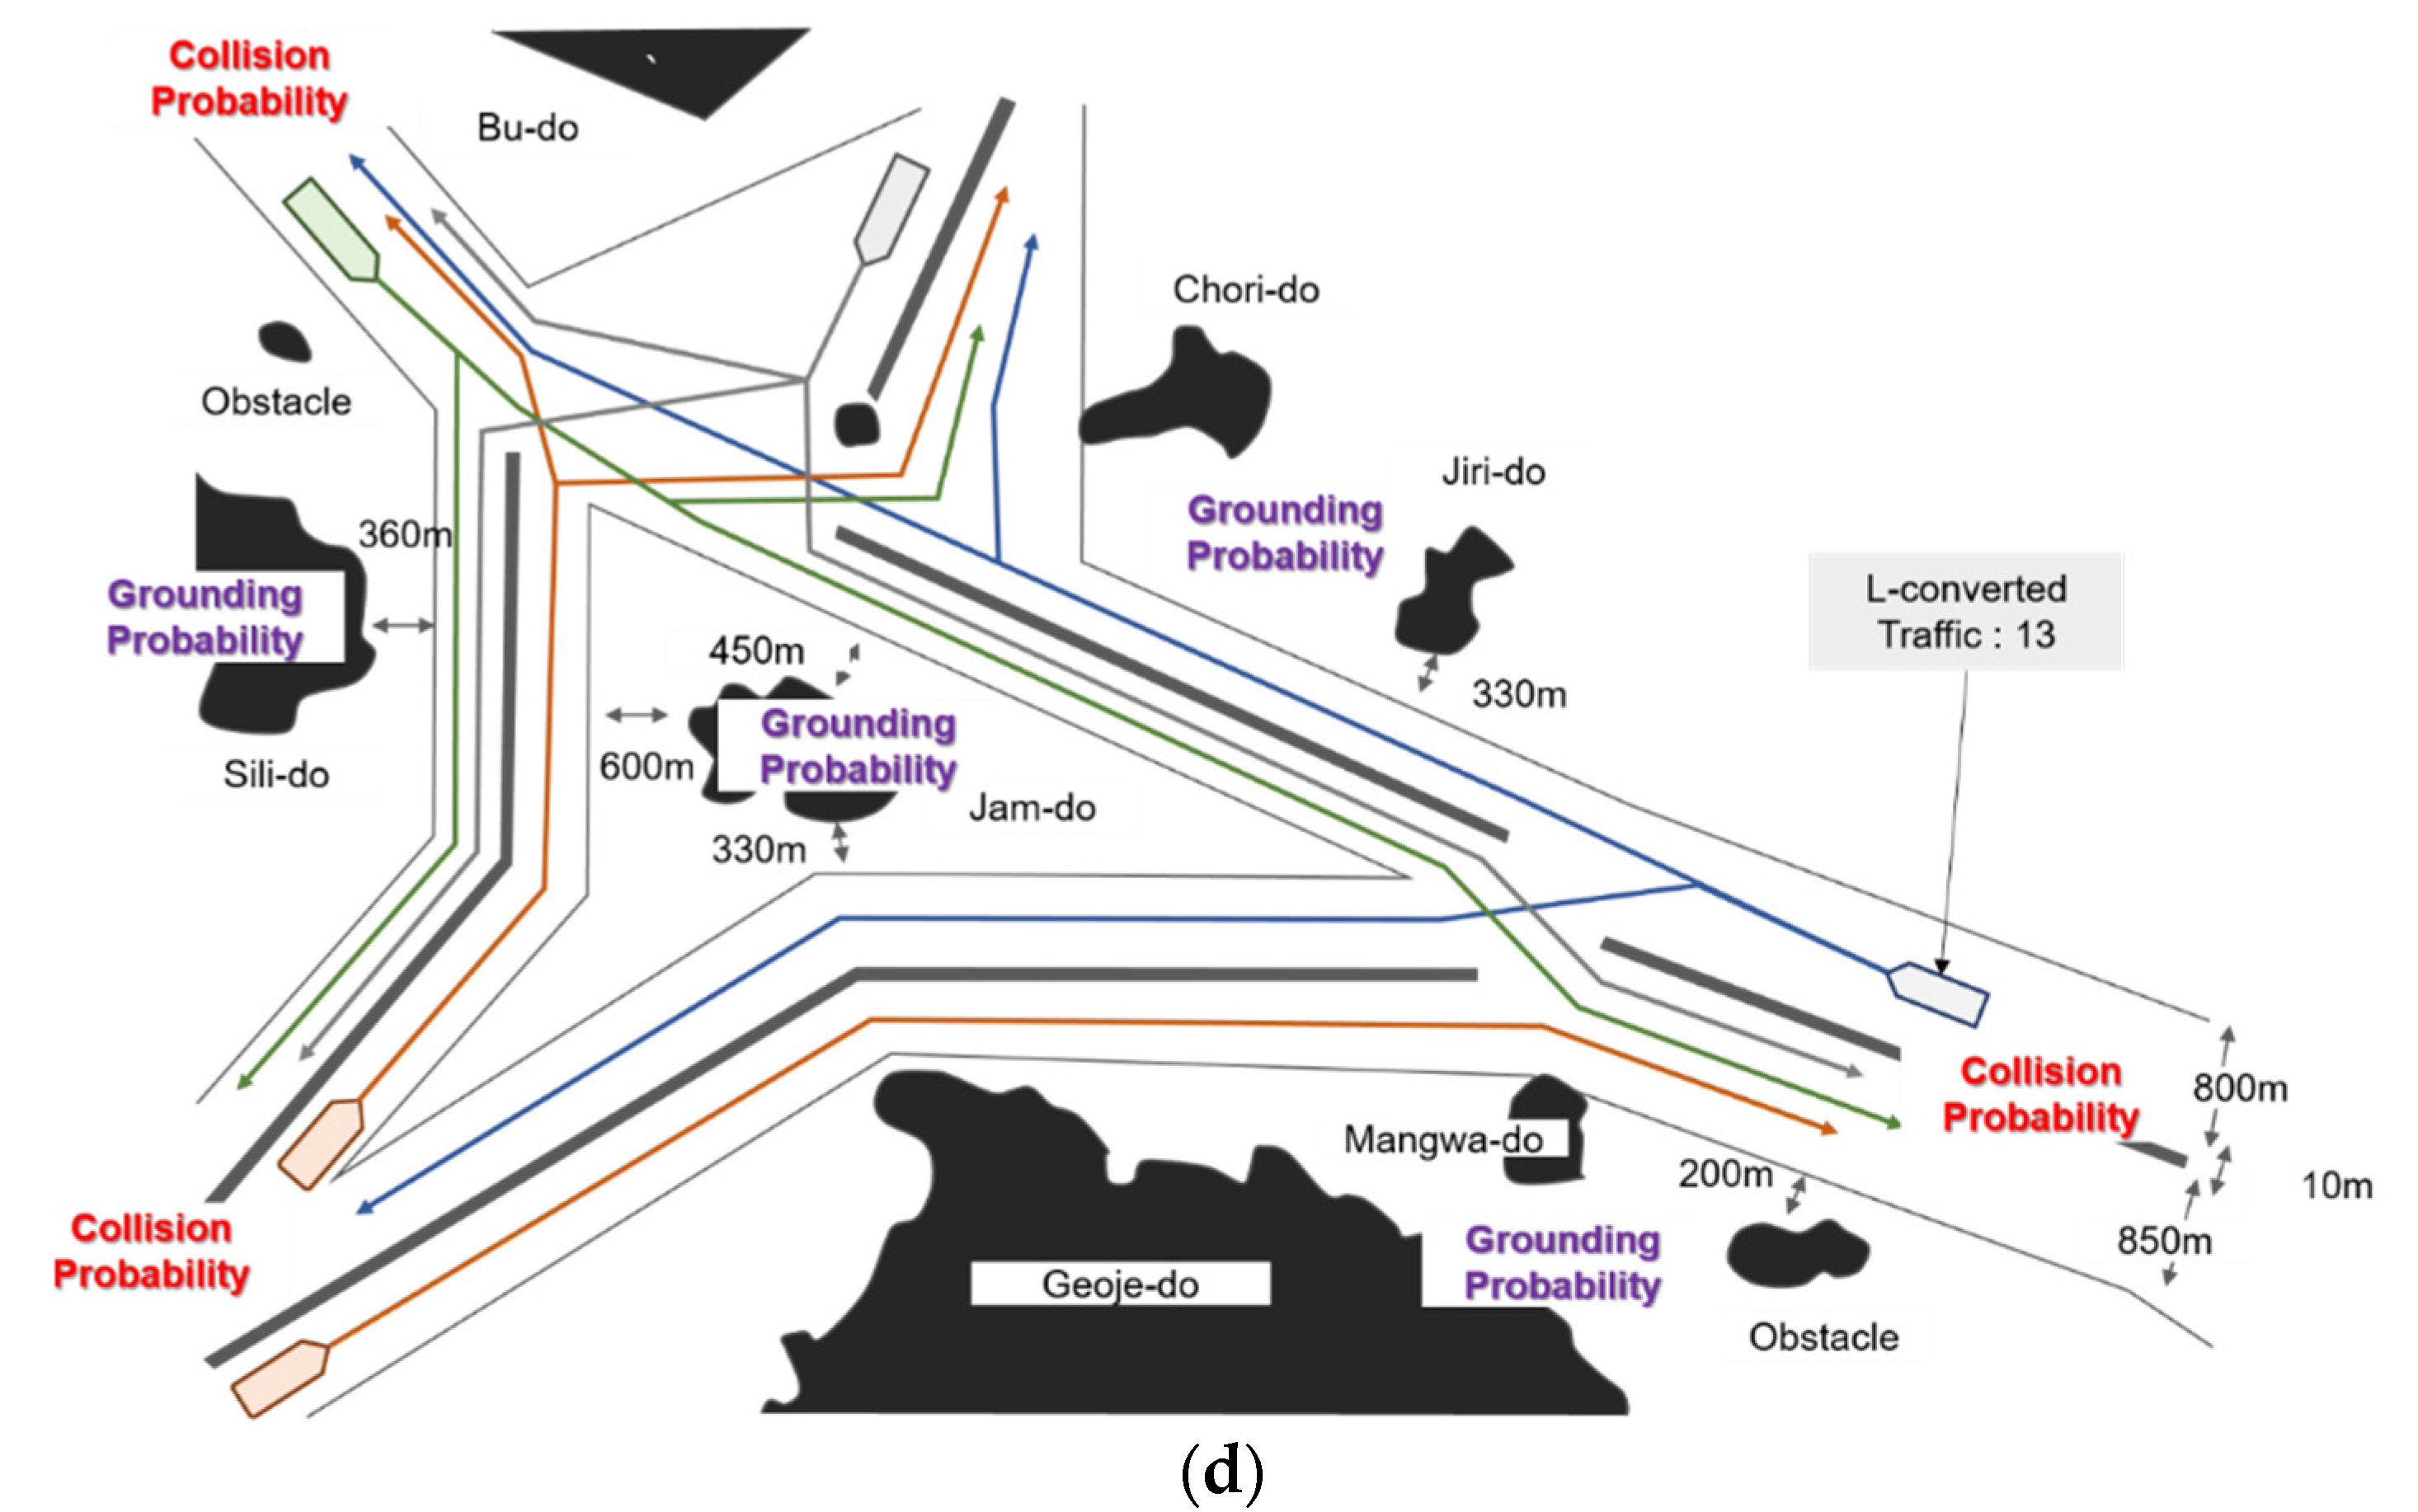
- Assessment Standard and Scenario
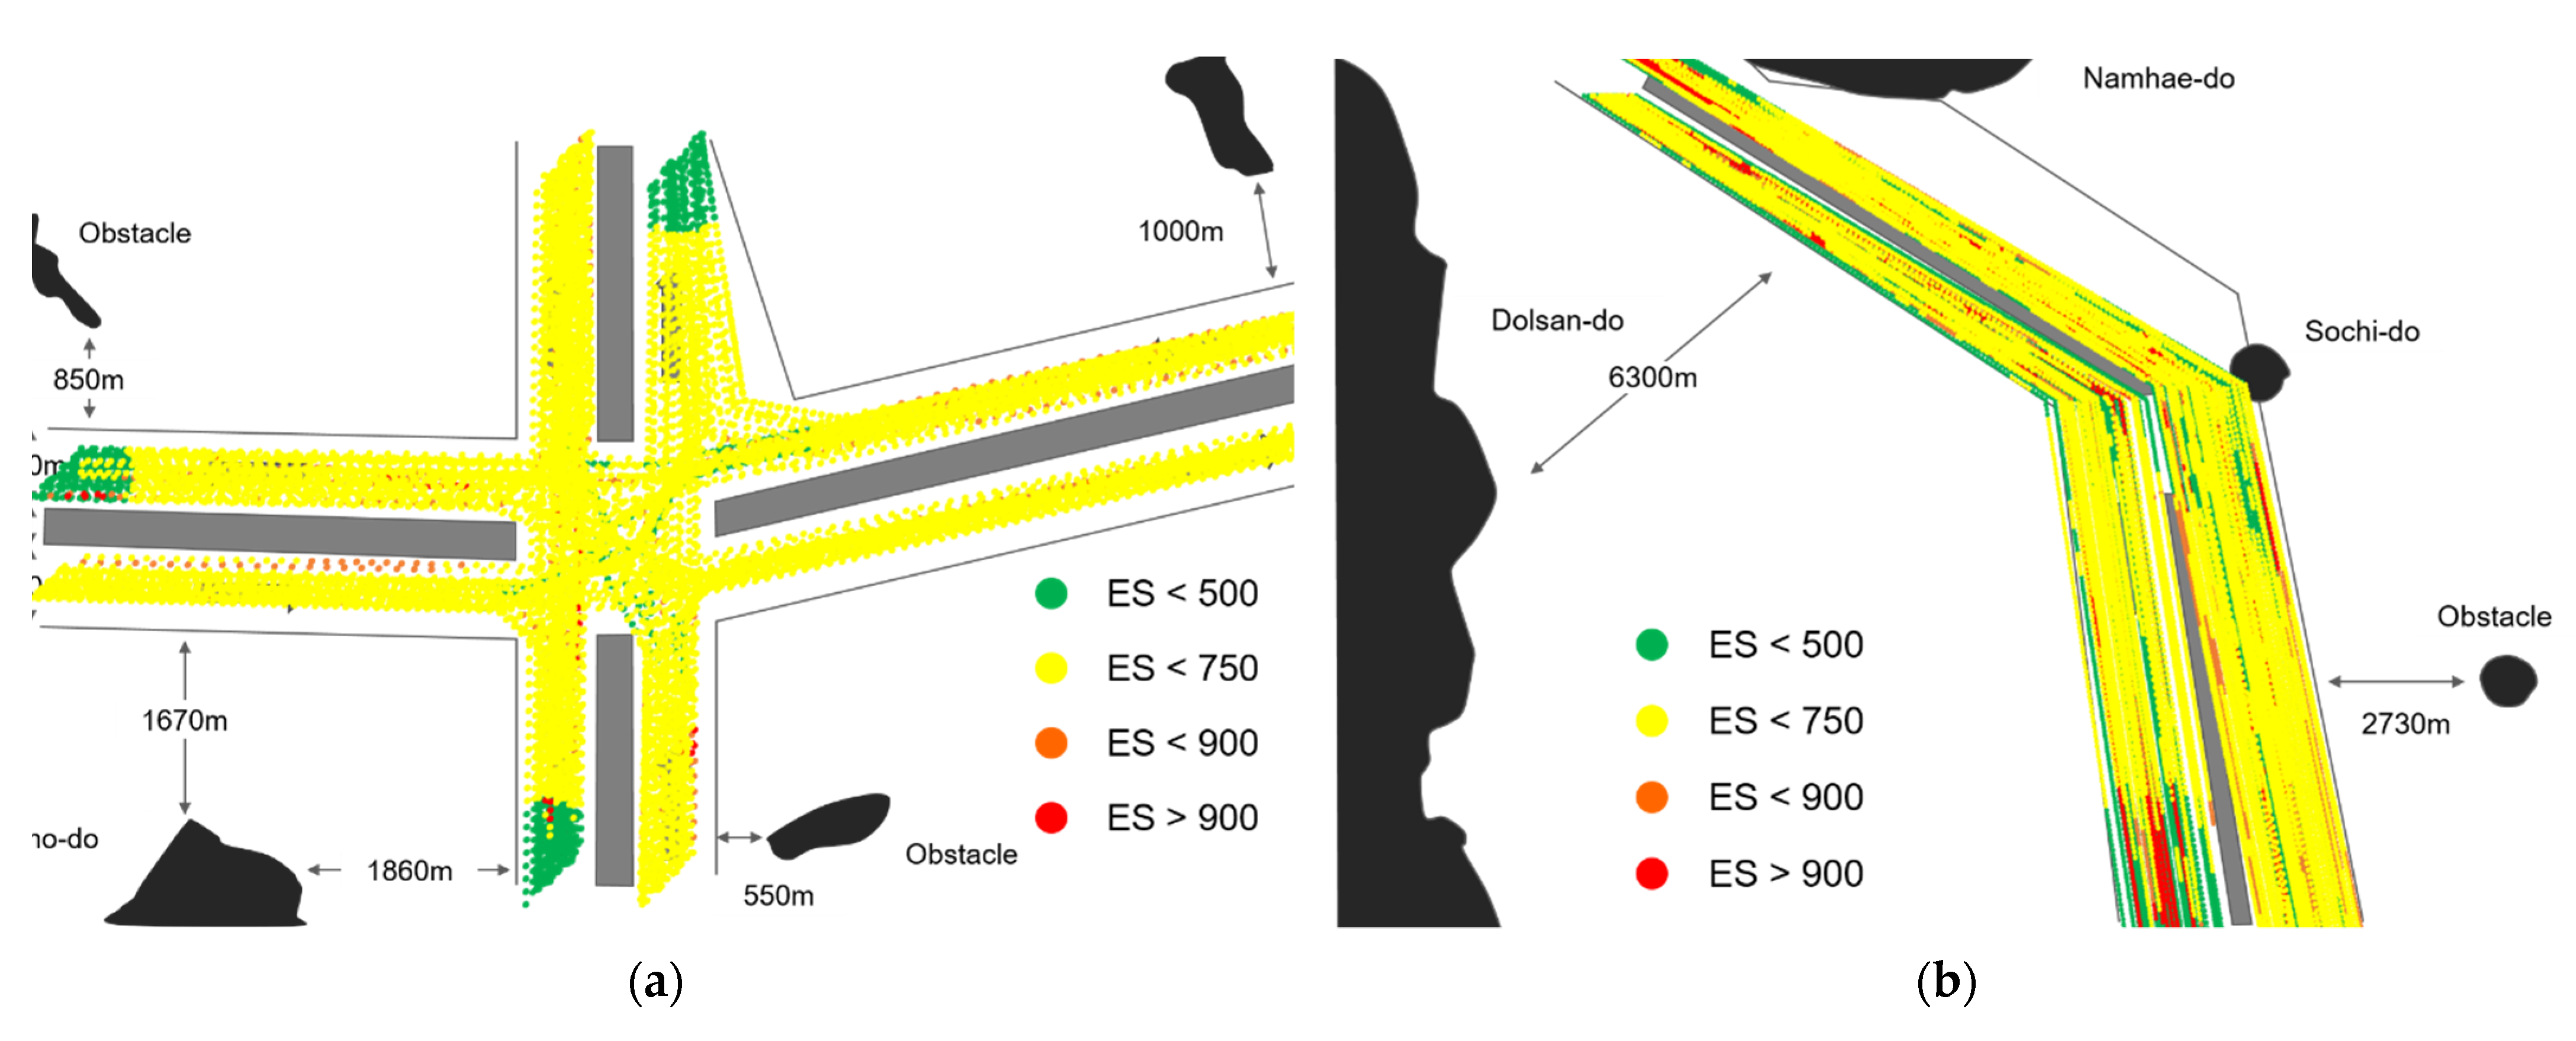
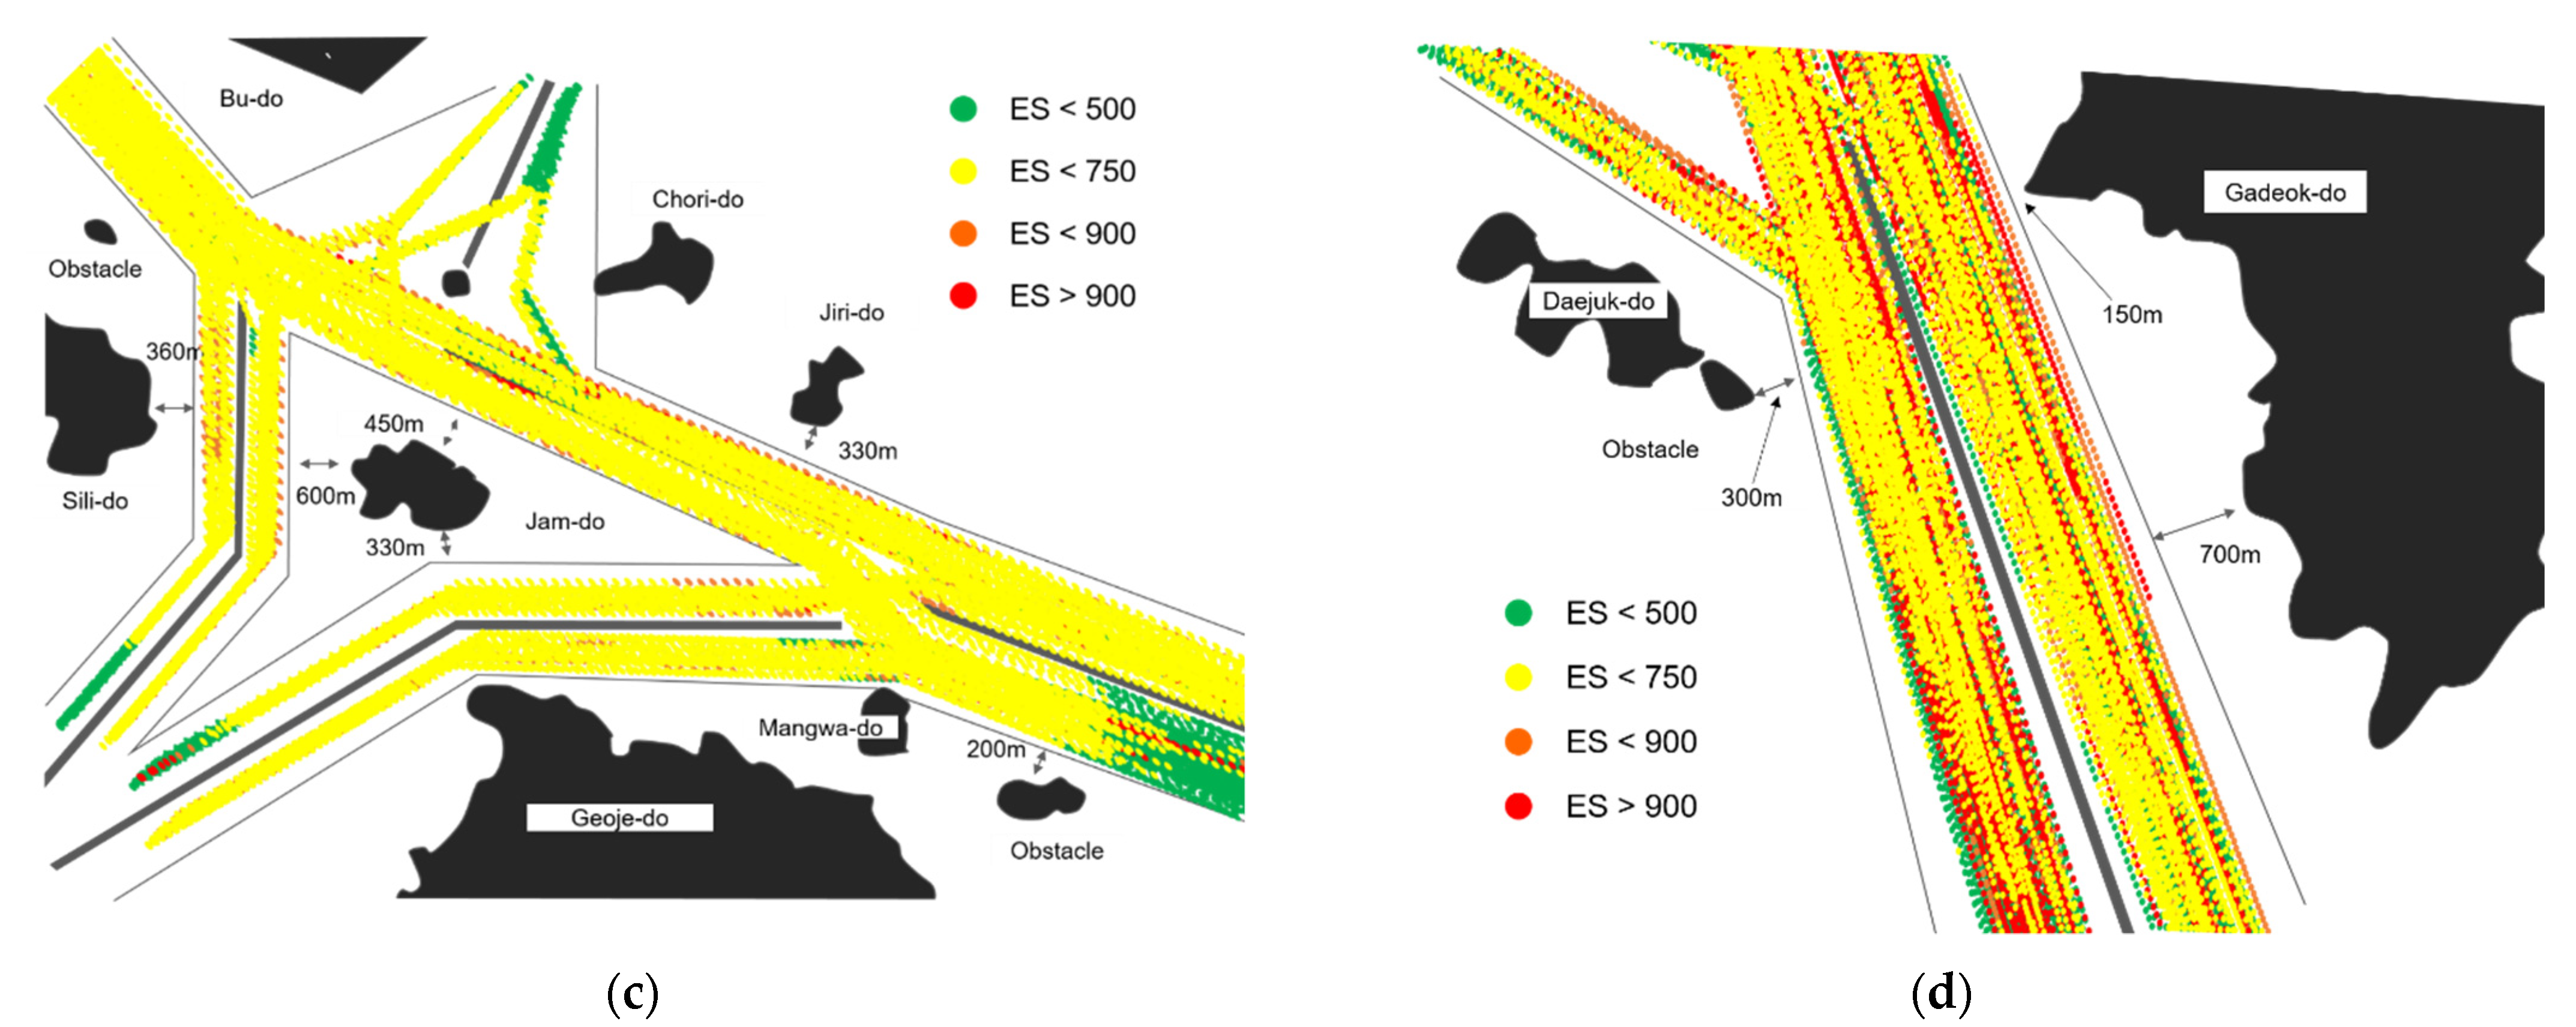
4.2. Results of ES Model Simulation
4.3. Results of Grounding Probabilities
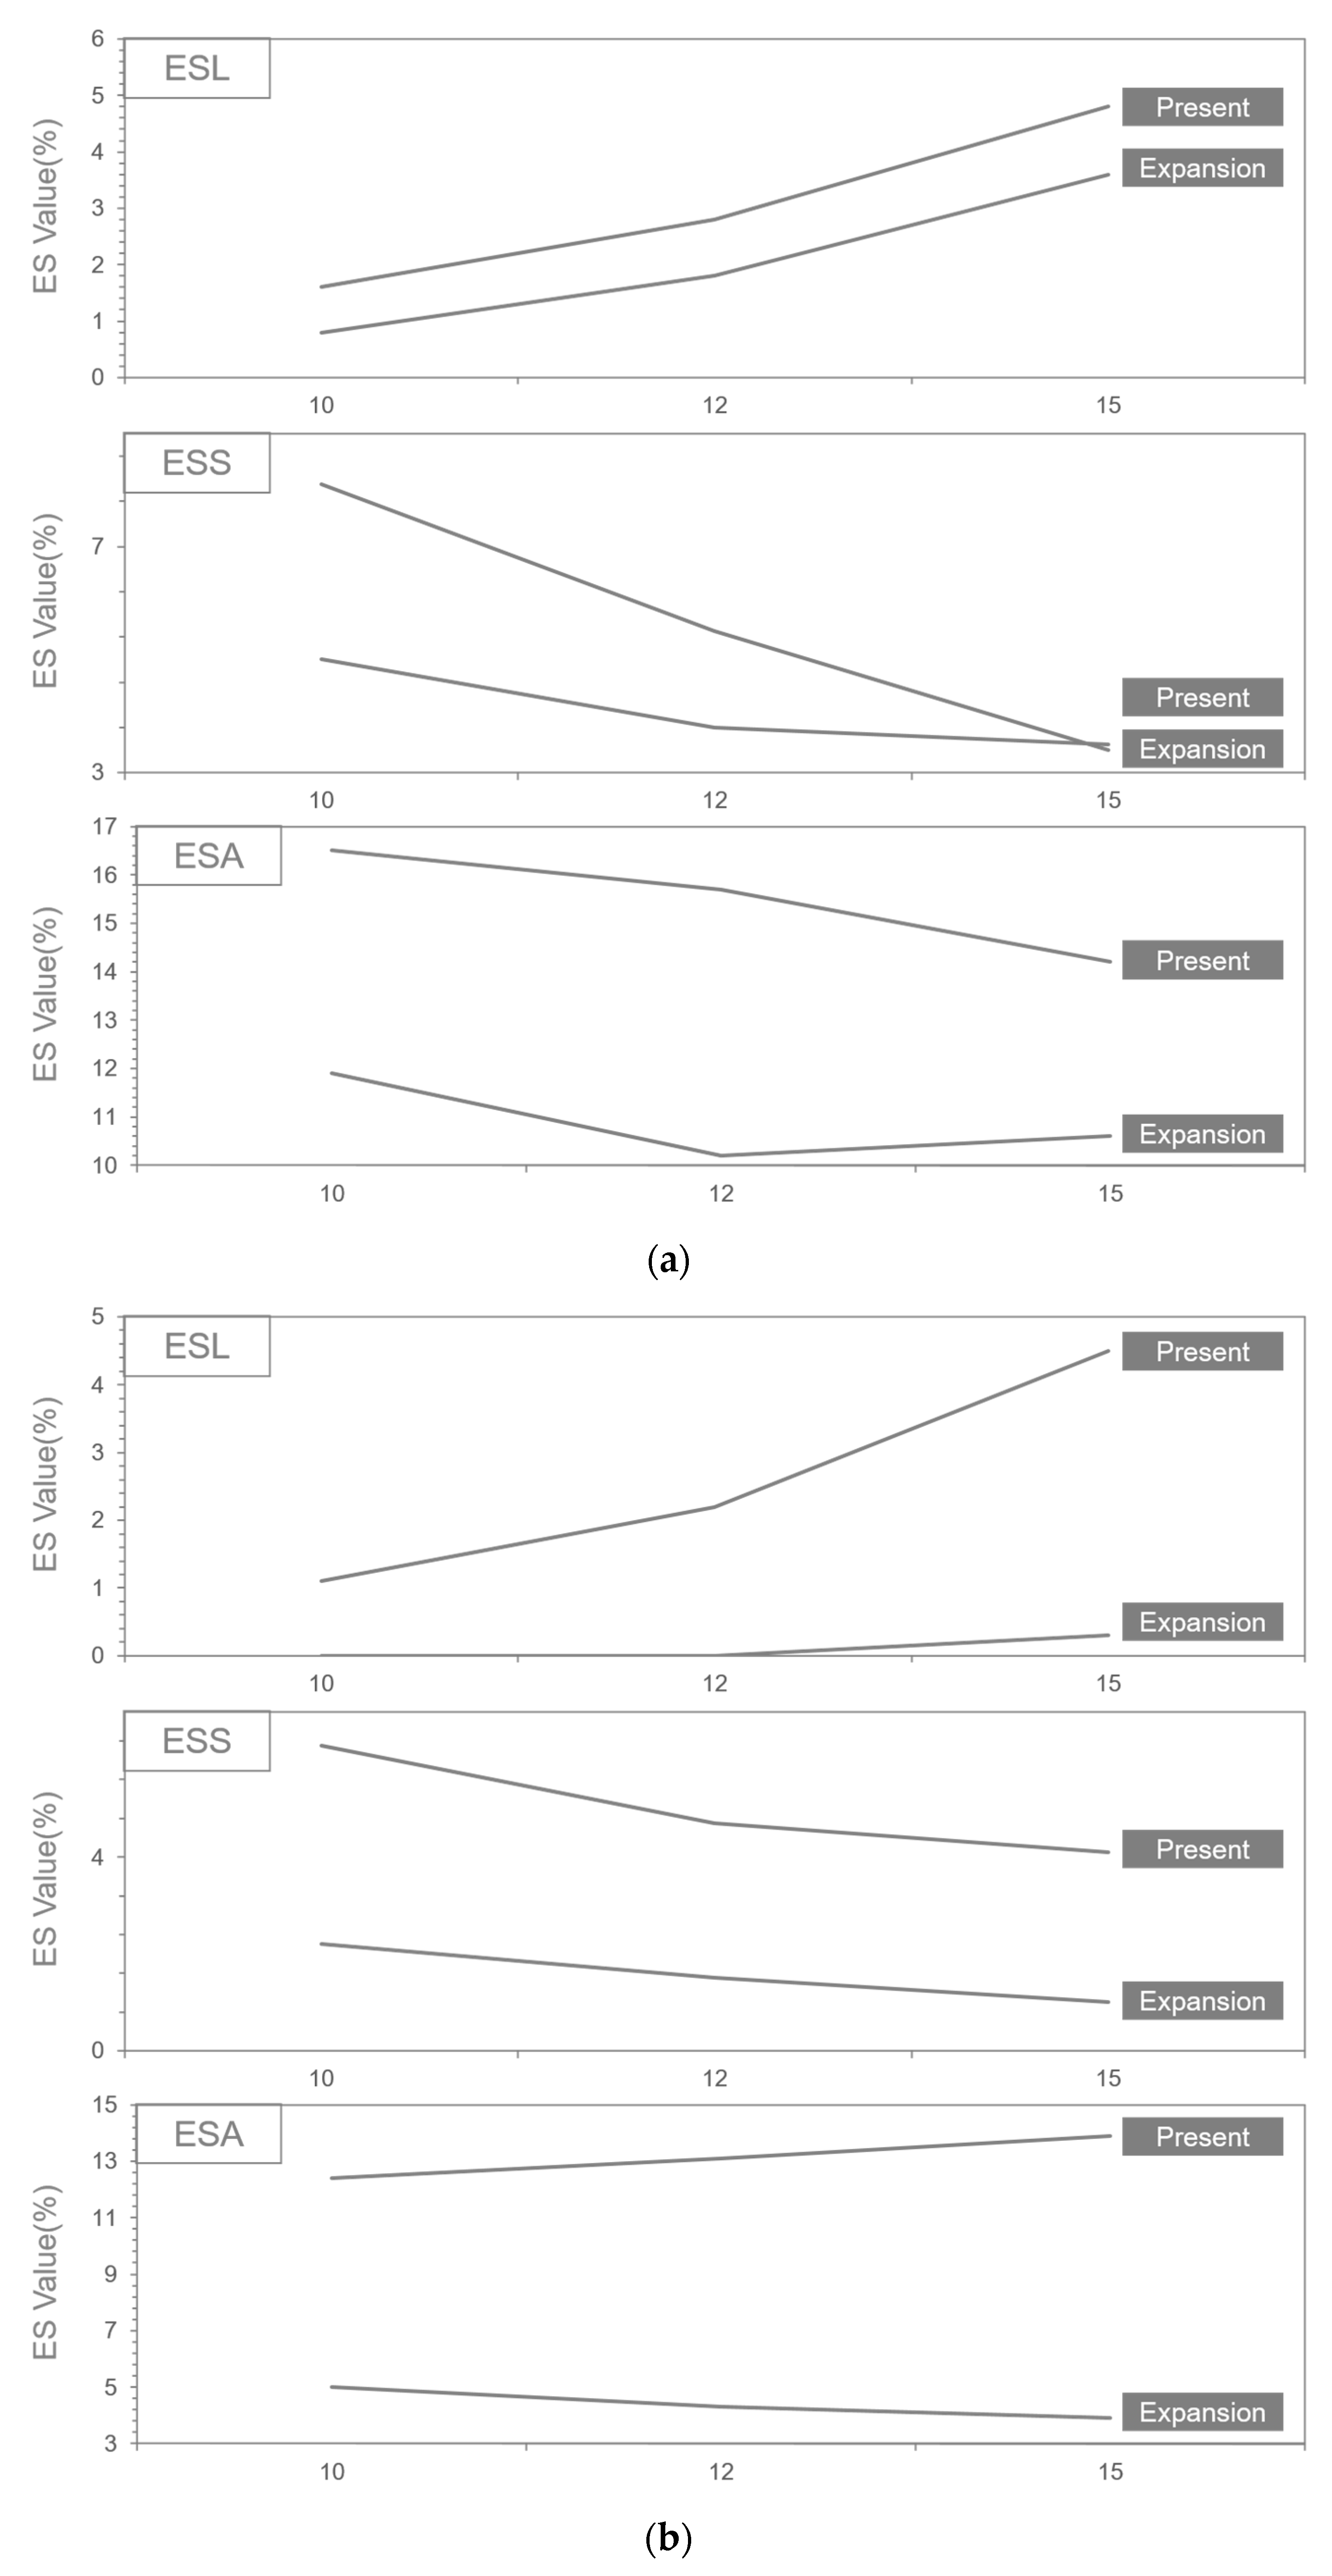
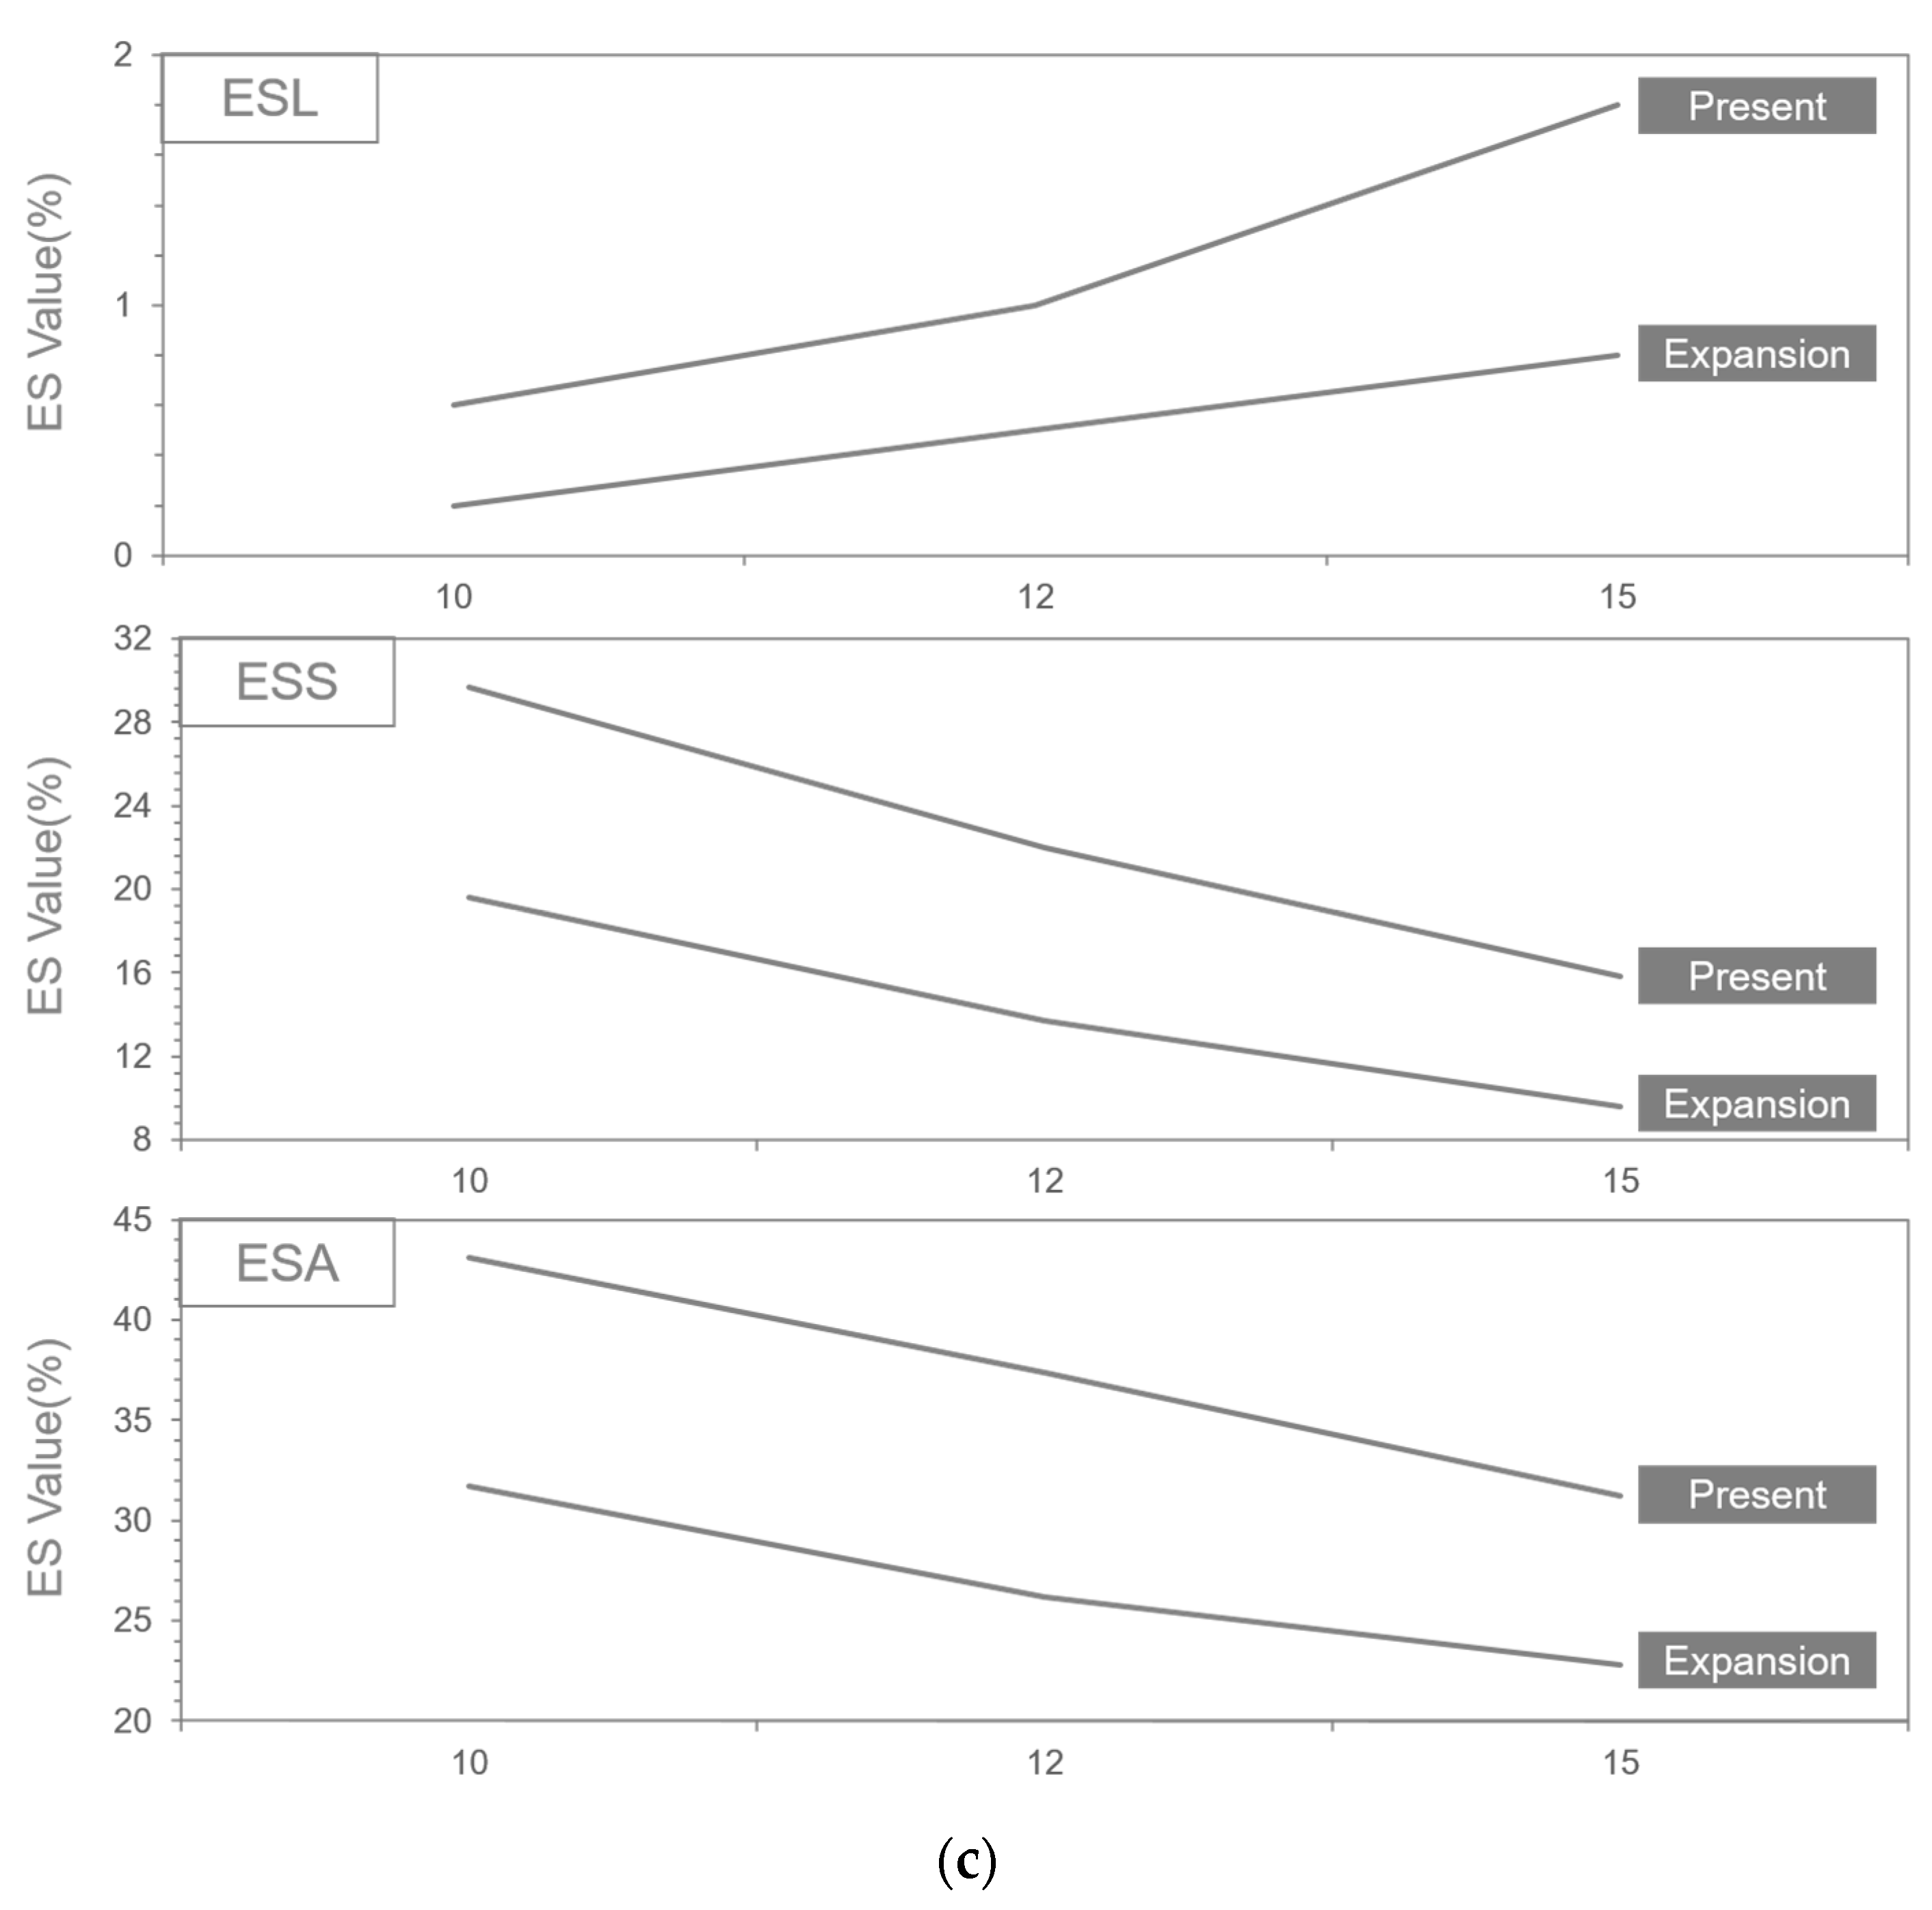
4.4. Results of ES Model Simulation for Fairway Expansion
5. Conclusions and Future Work
- Diversification of evaluation models. Among the various risk assessment models, the ES model and the IWRAP Mk II model were used. The ES model quantifies the psychological risk of the operator, and the IWRAP Mk II model is used in many areas. However, because results can be derived differently, depending on various theories and research methodologies, it is necessary to derive comprehensive results through a diversification of evaluation models.
- Ship control simulation. In the maritime traffic safety diagnosis, the fairway design and adequacy are primarily reviewed in accordance with the design standards and guidelines. In addition, ship control simulation is additionally conducted to review safety in an environment similar to the real one, as well as to examine the feasibility of restricting the fairway width according to the characteristics of the sea area. In a follow-up study, various research methods, such as ship steering simulation, will be used to improve the qualitative completeness of the research. The purpose will be to verify the safety according to the collision risk, grounding risk, and fairway width extension derived from this study, using a ship steering simulation evaluation for operators.
- The grounding probability was evaluated for the nearest island, obstacle, and low water area, without considering the fairway lines, it is not expected that there will be any serious change in the grounding probability even if the fairway is partially expanded. However, assuming that the ship’s trajectories when they navigate along the fairway follow a normal distribution, the grounding probability may increase depending on the deviation in traffic. This study evaluates the grounding probability based on actual data, it was considered too difficult to include the method of calculating the grounding probability by estimating the vessel’s track within the scope of the study. Therefore, we present these notes and comments as limitations of this study and suggest that follow-up studies deal with the estimated change in the grounding probability, due to fairway expansion, and perform verifications through actual measurements.
Author Contributions
Funding
Institutional Review Board Statement
Informed Consent Statement
Data Availability Statement
Conflicts of Interest
References
- Ministry of Trade, Industry and Energy. Implementation Plan for Renewable Energy 3020; Ministry of Trade, Industry and Energy: Sejong City, Korea, 2017.
- Serri, L.; Colle, L.; Witali, B.; Bonomi, T. Floating Offshore Wind Farms in Italy beyond 2030 and beyond 2060: Preliminary Results of a Techno-Economic Assessment. Appl. Sci. 2020, 10, 8899. [Google Scholar] [CrossRef]
- Ohn, S.W.; Lee, C.H.; Kim, C.S. A Study on the Establishment of Allowable Criteria for Sailing Ships at Offshore Wind Farms. J. Korean Soc. Mar. Environ. Saf. 2018, 24, 841–847. [Google Scholar] [CrossRef]
- Rawson, A.; Rogers, E. Assessing the Impacts to Vessel Traffic from Offshore Wind Farms in the Thames Estuary. Sci. J. Mar. Univ. Szczecin. 2015, 43, 99–107. [Google Scholar]
- Mehdi, R.A.; Schroder-Hinrichs, J.; Baldauf, M. A Tale of Two Industries: Seafarer Perceptions of Navigational Safety Risks near Offshore Wind Farms. MaRiSa Ocean Yearb. 2019, 33, 543–581. [Google Scholar] [CrossRef]
- Guo, Y.; Wang, J.; Peeta, S.; Anastasopoulos, P.C. Personal and Societal Impacts of Motorcycle ban Policy on Motorcyclists’ home-to-work Morning Commute in China. Travel Behav. Soc. 2020, 19, 137–150. [Google Scholar] [CrossRef]
- Tang, T.; Guo, Y.; Zhou, X.; Labi, S.; Zhu, S. Understanding Electric Bike Riders’ Intention to Violate Traffic Rules and Accident Proneness in China. Travel Behav. Soc. 2021, 23, 25–38. [Google Scholar] [CrossRef]
- Cicchino, J.B.; McCarthy, M.L.; Newgard, C.D.; Wall, S.P.; DiMaggio, C.J.; Kulie, P.E.; Arnold, B.N.; Zuby, D.S. Not all Protected Bike Lanes are the same: Infrastructure and Risk of Cyclist Collisions and Falls Leading to Emergency Department Visits in three U.S. Cities. Accid. Anal. Prev. 2020, 141, 105490. [Google Scholar] [CrossRef]
- Ministry of Oceans and Fisheries. Planning Research on the Establishment of a Systematic Maritime Transportation Network in Domestic Coastal Waters in Safety Assessment of Vessel Passageways in 2020; Ministry of Oceans and Fisheries: Sejong City, Korea, 2020; pp. 93–126.
- Yu, Q.; Liu, K.; Teixeira, A.P.; Soares, C.G. Assessment of the Influence of Offshore Wind Farms on Ship Traffic Flow Based on AIS Data. J. Navig. 2020, 73, 131–148. [Google Scholar] [CrossRef]
- Zhao, W.; Wang, Y.; Zhang, Z.; Wang, H. Multicriteria Ship Route Planning Method Based on Improved Particle Swarm Optimization-Genetic Algorithm. Appl. Sci. 2021, 9, 357. [Google Scholar] [CrossRef]
- Tullu, A.; Endale, B.; Wondosen, A.; Hwang, H.Y. Machine Learning Approach to Real-Time 3D Path Planning for Autonomous Navigation of Unmanned Aerial Vehicle. Appl. Sci. 2021, 11, 4706. [Google Scholar] [CrossRef]
- Paulauskas, V.; Paulauskas, D. Evaluating the Width of Navigational Channels. Transport 2013, 28, 166–174. [Google Scholar] [CrossRef]
- Gucma, S.; Dzwonkowski, J.; Przywarty, M. Kinematic Method of Determining Safe Fairway Bend Widths. Int. J. Mar. Nav. Saf. Sea Transp. 2020, 14, 435–441. [Google Scholar] [CrossRef]
- Kim, H.S.; Lee, Y.S. A Study on Decision of Minimum Required Channel Width Considering Ship Types by Fast Time Simulation. J. Korean Soc. Mar. Environ. Saf. 2020, 26, 309–316. [Google Scholar] [CrossRef]
- Korea Maritime Safety Tribunal. Statistics of Marine Accident. 2021. Available online: https://www.kmst.go.kr/eng/page.do?menuIdx=227 (accessed on 6 May 2022).
- Zou, Y.; Zhang, Y.; Ma, Z. Emergency Situation Safety Evaluation of Marine Ship Collision Accident Based on Extension Cloud Model. J. Mar. Sci. Eng. 2021, 9, 1370. [Google Scholar] [CrossRef]
- Yildiz, S.; Uğurlu, Ö.; Wang, J.; Loughney, S. Application of the HFACS-PV Approach for Identification of Human and Organizational Factors (HOFs) Influencing Marine Accidents. Reliab. Eng. Syst. Saf. 2021, 208, 107395. [Google Scholar] [CrossRef]
- Ministry of Land, Transport and Maritime Affairs. Research on Technical Standards for Maritime Traffic Safety Assessment; Ministry of Land, Transport and Maritime Affairs: Gwacheon City, Korea, 2009; Chapter 3; pp. 1–2.
- Ministry of Oceans and Fisheries. Vessel Fairway Safety Assessment Study—Coastal Fairway Safety Assessment in 2015; Ministry of Oceans and Fisheries: Sejong City, Korea, 2015; Chapter 3; pp. 142–267.
- Ministry of Oceans and Fisheries. Vessel Fairway Safety Assessment Study—A Study on Improvement Measures for Vessel Fairway Assessment in 2021; Ministry of Oceans and Fisheries: Sejong City, Korea, 2021; Chapter 3; pp. 102–160.
- Park, Y.S. Basic Study on Design Guideline of Traffic Separation Scheme. J. Korean Nav. Port Res. 2007, 31, 173–178. [Google Scholar]
- Johnson, D.R. Recent Trends in Navigation Safety in the Dover Strait. In Proceedings of the of 3rd International Symposium on Marine Traffic Service, Liverpool, UK, 3–6 April 1978. [Google Scholar]
- Kuroda, K.; Ekita, H. Safety Assessment of Waterway Network in Bay Area. In Proceedings of the 27th International Pianc Navigation Congress, Osaka, Japan, 19–26 May 1990. [Google Scholar]
- Park, Y.S.; Jeong, J.Y.; Park, J.S. An Assessment of the Quantitative Effect of TSS by Vessel Traffic Flow Simulation. J. Korean Soc. Transp. 2003, 21, 41–49. [Google Scholar]
- PIANC. Harbour Approach Channels Design Guidelines; PIANC Report N-121; Maritime Navigation Commission: Bruxelles, Begium, 2014. [Google Scholar]
- Gucma, S.; Zalewski, P. Optimization of fairway design parameters: Systematic approach to manoeuvering safety. Int. J. Naval Arch. Ocean Eng. 2020, 12, 129–145. [Google Scholar] [CrossRef]
- Bak, A.; Zalewski, P. Determination of the Waterway Parameters as a Component of Safety Management System. Appl. Sci. 2021, 11, 4456. [Google Scholar] [CrossRef]
- Kang, W.S.; Park, Y.S. A Study on the Design of Coastal Fairway Width Based on a Risk Assessment Model in Korean Waterways. Appl. Sci. 2022, 12, 1535. [Google Scholar] [CrossRef]
- Ministry of Oceans and Fisheries. Announcement of Revision of Port and Fishing Port Design Standards; Ministry of Oceans and Fisheries: Sejong City, Korea, 2020.
- Inoue, K. Detection Days and Level of Marine Traffic Volume. Jpn. Inst. Navig. 1973, 50, 1–8. [Google Scholar] [CrossRef]
- Park, J.S.; Park, Y.S.; Lee, K.H. Marine Traffic Engineering; Dasom Publisher: Busan, Korea, 2013; pp. 56–57, 141–145, 173–174. [Google Scholar]
- Kang, W.S.; Song, T.H.; Kim, Y.D.; Park, Y.S. A Study on Seasonal Variation in Marine Traffic Congestion on Major Port and Coastal Routes. J. Korean Soc. Mar. Environ. Saf. 2017, 23, 1–8. [Google Scholar] [CrossRef]
- Park, Y.S.; Jeong, J.Y. A Study on the Marine Traffic Congestion by Analysis of Ship’s Domain. J. Korean Soc. Mar. Environ. Saf. 2014, 20, 535–542. [Google Scholar] [CrossRef]
- Kwon, Y.M. Estimation of Marine Traffic Volume Considering Ship Speed. J. Korean Soc. Mar. Environ. Saf. 2018, 24, 381–388. [Google Scholar] [CrossRef]
- Gong, I.S.; Kim, Y.G. A Review on the Concept of Operating Rate of Fairway and Its Application. J. Ship Ocean Eng. 2005, 40, 173–178. [Google Scholar]
- Lee, H.K. Development of Marine Traffic Supporting System through ES Model for VTS. Ph.D. Thesis, Pukyong National University, Busan, Korea, 2011. [Google Scholar]
- Mazaheri, A.; Ylitalo, J. Comments on Geometrical Modeling of Ship Grounding. In Proceedings of the 5th International Conference on Collision and Grounding of Ships (ICCGS 2010), Espoo, Finland, 14–16 June 2010. [Google Scholar]
- Lee, M.K.; Park, Y.S.; Park, S.W.; Lee, E.K.; Park, M.J.; Kim, N.E. Application of Collision Warning Algorithm Alarm in Fishing Vessel’s Waterway. Appl. Sci. 2021, 11, 4479. [Google Scholar] [CrossRef]
- Inoue, K. On the Separation of Traffic at Straight Waterway by Distribution Model of Ship. Jpn. Inst. Nav. 1977, 56, 103–115. [Google Scholar] [CrossRef] [Green Version]
- IALA. Risk Management—Pawsa, Iwrap Mk2 & Simulation. 2010. Available online: https://www.iala-aism.org/product/risk-management-pawsa-iwrap-mk2-simulation/ (accessed on 2 April 2022).
- Coric, M.; Mandzuka, S.; Gudelj, A.; Lusic, Z. Quantitative Ship Collision Frequency Estimation Models: A review. J. Mar. Sci. Eng. 2021, 9, 533. [Google Scholar] [CrossRef]
- Nowy, A.; Lazuga, K.; Gucma, L.; Androjna, A.; Perkovic, M.; Srse, J. Modeling of Vessel Traffic Flow for Waterway Design-Port of Swinoujscie Case Study. Appl. Sci. 2021, 11, 8126. [Google Scholar] [CrossRef]
- Park, H.G.; Park, Y.S.; Kim, D.W. Correlation of Marine Exploration-Survey Vessel Operation Factors and Grid-Type Operation Method through ES Model Analysis. J. Korean Soc. Mar. Environ. Saf. 2020, 26, 634–643. [Google Scholar] [CrossRef]
- American Association of State Highway and Transportation Officials. ASHTO LRFD Bridge Design Specifications, 5th ed.; AASHTO: Washington, DC, USA, 2010. [Google Scholar]
- Elzinga, T.; Bogaerts, M.P. A Simulator Study for LNG Transport by Gas Carriers to Eemshaven, The Netherlands. MARSIM 1984, 84, 254. [Google Scholar]


| TSS Name | Width (m) | Width (m) by Bound | Depth (m) | |
|---|---|---|---|---|
| Wando Port Entry and Crossing | 1660 | West Bound | 680 | 12.6 |
| East Bound | 680 | |||
| Separation Zone | 300 | |||
| Traffic Safety Specific Water ‘Yeosu Area’ | 2000 | West Bound | 1120 | 20.2 |
| East Bound | 870 | |||
| Separation Zone | 10 | |||
| Masan | 1660 | West Bound | 800 | 21.0 |
| East Bound | 850 | |||
| Separation Zone | 10 | |||
| Gadeok-sudo | 1680 | North Bound | 900 | 20.3 |
| South Bound | 770 | |||
| Separation Zone | 10 | |||
| Width | Basic or Additional Width Range | |
|---|---|---|
| Basic Maneuvering Lane | 1.3~1.8 B * | |
| Additional Factor | Vessel Speed | 0~0.1 B |
| Wind | 0.1~1.1 B | |
| Current | 0~1.6 B | |
| Wave | 0~1.0 B | |
| Navigation Aids | 0~0.4 B | |
| Bottom surface | 0~0.2 B | |
| Depth | 0~0.4 B | |
| Two-Way Traffic | 1.0~2.0 B | |
| Bank Clearance | 0~1.3 B | |
| Type | Width Range |
|---|---|
| One-way | 0.5~1.0 L * |
| Two-way | 1.0~2.0 L |
| Category | Wando | Yeosu | Masan | Gadeok | |
|---|---|---|---|---|---|
| Total Number of Vessels | 779 | 1274 | 957 | 1002 | |
| Average Number of Vessels per day | 111.3 | 182.0 | 136.7 | 143.1 | |
| Average Number of Vessels per hour | 4.6 | 7.6 | 5.7 | 6.0 | |
| Max. Number of Vessels per hour | 17 | 20 | 15 | 18 | |
| Length of Largest Vessel (m) | 161 | 400 | 345 | 400 | |
| Number and Proportion by Vessel Type | Tanker | 27 (3.5%) | 447 (35.1%) | 96 (10.0%) | 193 (19.3%) |
| Cargo ship | 45 (5.8%) | 284 (22.3%) | 87 (9.1%) | 301 (30.0%) | |
| Passenger | 103 (13.2%) | 13 (1.0%) | - | - | |
| Towing Vessel | 67 (8.6%) | 32 (2.5%) | 275 (28.7%) | 80 (8.0%) | |
| Fishing Vessel | 108 (13.9%) | 35 (2.7%) | 119 (12.4%) | 14 (1.4%) | |
| ETC | 429 (55.0%) | 463 (36.4%) | 380 (39.8%) | 414 (41.3%) | |
| Number and Proportion by Vessel Length | ~50 m | 661 (84.9%) | 642 (50.4%) | 784 (81.9%) | 588 (58.7%) |
| 51~100 m | 62 (8.0%) | 273 (21.4%) | 103 (10.9%) | 125 (12.4%) | |
| 101~150 m | 30 (3.9%) | 152 (11.9%) | 32 (3.3%) | 83 (8.3%) | |
| 151~200 m | 26 (3.2%) | 124 (9.7%) | 28 (2.9%) | 50 (5.0%) | |
| 201~250 m | - | 27 (2.1%) | - | 5 (0.5%) | |
| 251~300 m | - | 24 (1.9%) | 7 (0.7%) | 59 (5.9%) | |
| 301~350 m | - | 26 (2.0%) | 3 (0.3%) | 58 (5.8%) | |
| 351 m~ | - | 6 (0.6%) | - | 34 (3.4%) | |
| Fairway | Speed (Knots) | Basic Traffic Volume (Number of Vessel/h) | Practical Traffic Volume (Number of Vessel/h) |
|---|---|---|---|
| Wando | 10 | 245.1 | 61.3 |
| 12 | 294.1 | 73.5 | |
| 15 | 367.6 | 91.9 | |
| Yeosu | 10 | 295.3 | 73.8 |
| 12 | 354.3 | 88.6 | |
| 15 | 442.9 | 110.7 | |
| Masan | 10 | 245.1 | 61.3 |
| 12 | 294.1 | 73.5 | |
| 15 | 367.6 | 91.9 | |
| Gadeok | 10 | 248.0 | 62.0 |
| 12 | 297.6 | 74.4 | |
| 15 | 372.1 | 93.0 |
| Fairway | L2-Converted Traffic Volume (Number of Vessel/h) | Speed (Knots) | Traffic Congestion (Average) | Traffic Congestion (Peak-Time) |
|---|---|---|---|---|
| Wando | 0.86 | 10 | 1.4% | 9.1% |
| 12 | 1.2% | 7.6% | ||
| 15 | 0.9% | 6.1% | ||
| Yeosu | 18.8 | 10 | 25.5% | 101.9% |
| 12 | 21.2% | 84.9% | ||
| 15 | 17.0% | 67.9% | ||
| Masan | 4.0 | 10 | 6.5% | 50.0% |
| 12 | 5.4% | 41.7% | ||
| 15 | 4.4% | 33.4% | ||
| Gadeok | 22.9 | 10 | 36.9% | 205.2% |
| 12 | 30.7% | 171.0% | ||
| 15 | 24.6% | 136.8% |
| Type | Wando | Yeosu | Masan | Gadeok |
|---|---|---|---|---|
| Traffic Volume | 8/h | 20/h | 13/h | 30/h |
| Ship’s Speed | 10 knots, 12 knots, 15 knots | |||
| Width of Fairway (minimum) | 680 m | 870 m | 800 m | 770 m |
| Distance from Obstacles (minimum) | 550 m | Adjacent to the fairway | 200 m | 150 m |
| ES Value | Wando | Yeosu | Masan | Gadeok | ||||||||
|---|---|---|---|---|---|---|---|---|---|---|---|---|
| 0~500 | 14.1 | 16.1 | 97.4 | 49.9 | 69.5 | 86.2 | 13.6 | 15.4 | 94.1 | 26.0 | 64.9 | 57.8 |
| 500~750 | 79.8 | 83.7 | 1.1 | 33.6 | 28.9 | 5.8 | 72.6 | 80.0 | 1.8 | 30.9 | 34.4 | 12.5 |
| 750~900 | 4.4 | 0.2 | 0.2 | 7.6 | 1.6 | 1.4 | 9.2 | 4.5 | 0.6 | 12.2 | 0.6 | 4.1 |
| 900~1000 | 1.7 | 0.0 | 1.3 | 8.9 | 0.0 | 6.6 | 4.7 | 0.0 | 3.5 | 30.9 | 0.0 | 25.6 |
| Name of Fairway | Traffic Volume (Actual/7 Days) | Traffic Volume (Estimated/Year) | Predicting Grounding Frequencies | Grounding Probability |
|---|---|---|---|---|
| Wando | 779 | 40,619 | 0.0294852 | |
| Yeosu | 1274 | 66,430 | 0.146378 | |
| Masan | 957 | 49,901 | 0.302582 | |
| Gadeok | 1002 | 52,247 | 0.107486 |
Publisher’s Note: MDPI stays neutral with regard to jurisdictional claims in published maps and institutional affiliations. |
© 2022 by the authors. Licensee MDPI, Basel, Switzerland. This article is an open access article distributed under the terms and conditions of the Creative Commons Attribution (CC BY) license (https://creativecommons.org/licenses/by/4.0/).
Share and Cite
Kang, W.-S.; Park, Y.-S.; Lee, M.-K.; Park, S. Design of Fairway Width Based on a Grounding and Collision Risk Model in the South Coast of Korean Waterways. Appl. Sci. 2022, 12, 4862. https://doi.org/10.3390/app12104862
Kang W-S, Park Y-S, Lee M-K, Park S. Design of Fairway Width Based on a Grounding and Collision Risk Model in the South Coast of Korean Waterways. Applied Sciences. 2022; 12(10):4862. https://doi.org/10.3390/app12104862
Chicago/Turabian StyleKang, Won-Sik, Young-Soo Park, Myoung-Ki Lee, and Sangwon Park. 2022. "Design of Fairway Width Based on a Grounding and Collision Risk Model in the South Coast of Korean Waterways" Applied Sciences 12, no. 10: 4862. https://doi.org/10.3390/app12104862
APA StyleKang, W.-S., Park, Y.-S., Lee, M.-K., & Park, S. (2022). Design of Fairway Width Based on a Grounding and Collision Risk Model in the South Coast of Korean Waterways. Applied Sciences, 12(10), 4862. https://doi.org/10.3390/app12104862