Article

Reservoir-Vascular Tubes Network for Self-Healing Concrete: Performance Analysis by Acoustic Emission, Digital Image Correlation and Ultrasound Velocity

1
Department Mechanics of Materials and Constructions (MeMC), Vrije Universiteit Brussel (VUB), Pleinlaan 2, 1050 Brussels, Belgium
2
Magnel-Vandepitte Laboratory, Department of Structural Engineering and Building Materials, Faculty of Engineering and Architecture, Ghent University, Technologiepark Zwijnaarde 60, 9052 Ghent, Belgium
*
Author to whom correspondence should be addressed.
Appl. Sci. 2022, 12(10), 4821; https://doi.org/10.3390/app12104821
Submission received: 5 April 2022 / Revised: 29 April 2022 / Accepted: 6 May 2022 / Published: 10 May 2022
(This article belongs to the Special Issue The State of the Art in Non-destructive Evaluation of Concrete)

Abstract

:
A novel linear reservoir-vascular tubes network is presented in this work and the design efficacy is explored by testing concrete beams loaded on bending and by assessing their damage healing and mechanical recovery. The healing system is composed of additively manufactured polymer components that appear equally effective compared to conventional ceramic tubes since the 3D printed polymer-tubes instantly break upon cracking. It is shown that bulk reservoirs embedded into concrete can deviate cracks and detrimentally affect the concrete’s resistance to failure. The crack formation and re-opening is monitored by acoustic emission (AE) and digital image correlation (DIC) concluding that initial brittle cracking is shifted after healing to a pseudo-ductile crack re-opening with extended post-softening. The sealed cracks show significant strength and toughness recovery (i.e., above 80% of the original value) escorted also by an ultrasound pulse velocity (UPV) increase (up to 126% relative to the damage state) after a healing intervention. The work critically reports on obstructions of the current design: (i) the network tubes are clogged although the agent was flushed out of the network after healing and as a result re-healing is unattainable; and (ii) vacuum spaces are formed during casting underneath the network tubes, due to limited vibration aiming on the tubes’ tightness, but also due to inefficient aggregates settlement, leading to a strength decrease. This work calls attention to the impact of vascular networks design and performance on a complex cracks network and fracture zone development.

1. Introduction

Two requirements of agent delivery arise for the optimal design of autonomously healed concrete based on a decade of research [1], namely, (1) the amount of healing agent should be sufficient to fill in and seal macro-cracks wider than 0.1 mm and up to 1 mm; and (2) healing function should be continuous and repeatably provide crack healing during the service life of the concrete. The concept of vascular healing networks attracts the interest of the research community today since their design can fulfil both of these essential requirements. As a result, the research is gradually shifting from encapsulation-based self-healing approaches towards vascular network conceptualization as the need for upscaling and commercialization is imperative. Recent studies demonstrate that encapsulation of the healing agent provides successive repair by reducing the capsules’ diameter to the material granulometry [2] and by casting them through materials compatible to concrete (i.e., [3]). The main difference to the vascular network is the latter’s ability to continuously supply an agent to different cracks and throughout the whole service life of the structure [4].
The early designs of hand-made ceramic [5], cement [6] and glass [7,8] tubes connected to an inlet–outlet supply system, to build a one-dimensional vascular network that proved its healing efficacy [9]. The breakthrough idea on healing conceptualization was the 3D printed fabrication of hollow tube networks and supply components [10]. Upon cracking, local stresses act on the tubes that eventually fracture at the crack plane. After fracture, the agent is manually poured into the system [5,11,12] or deployed from the embedded reservoir, and is then released through the tubes network, as capillary forces draw the agent into the open crack void [13]. The agent flow is occasionally promoted by pressurizing air throughout the network, an action that additionally facilitates the healing kinetics [13,14] and the cleansing of the tubes after the healing intervention [11].
Additive manufacturing is fast, reliable and provides the freedom for any geometry and shape of healing systems [4]. Recently, the research has focused on the fabrication of 2D and 3D vascular 3D printed polymer networks and significant advances are marked on modelling [15] and experimental works [16]. In addition, the biomimetic pattern design inspired by Murray’s law is now established to provide optimal agent distribution and flow [12].
The recent advances on the autonomous healing of concrete are summarized in [17,18], and this work aims to complementarily assess the limitations and obstacles that arise in practice on the design of vascular healing networks for concrete. Preliminary tests are performed on concrete beams with embedded hand-made and 3D printed vascular systems and their fracture and recovery are tracked by an integrated inspection methodology that provides insights into the damage–healing interaction. The phenomenon of network thrombosis will be discussed since the agent cleansing after the healing intervention appears the most critical design parameter for the durability of the network. The impact of supply components on the damage is exploited, and the compatibility of reservoir-network materials is critically assessed. Spotlight is set on the cracking zone, where the role of the micro-cracking at the fracture process zone surrounding the prominent crack on the re-opening of the crack after healing is investigated.
The online and post-testing monitoring of cracks provides, for the first time in the literature, a direct link of the crack size and morphology to the healing efficacy and mechanical properties restoration.

2. Research Significance

This work is a continuation of a decade of research on the design of autonomously healed concrete and complementarily contributes to the damage and healing assessment. For the first time, the focus is placed on the technical details regarding the inspection methodology that reveals the conditions under which cracks are repaired. An integrated monitoring methodology is adopted building on recent advances on monitoring systems that combine the acoustic emission (AE), ultrasound pulse velocity (UPV) and digital image correlation (DIC) techniques for an online, accurate and full-field tracking of damage and healing on small-scale concrete design prototypes [1,5].
By testing different healing configurations, the sensing technology is challenged to identify the damage onset and the crack kinetics. The data obtained are analyzed concerning the crack size and morphology and this has introduced a novel approach for an accurate healing evaluation. In the last section of this paper, a critical analysis based on post-testing visual inspection aims to shed light on the limitations of the current networks design. It is the authors’ belief that a new era of healing conceptualization arises with the contribution of additive manufacturing; therefore, future research should be dedicated to the optimal design of printed networks.

3. Materials and Methods
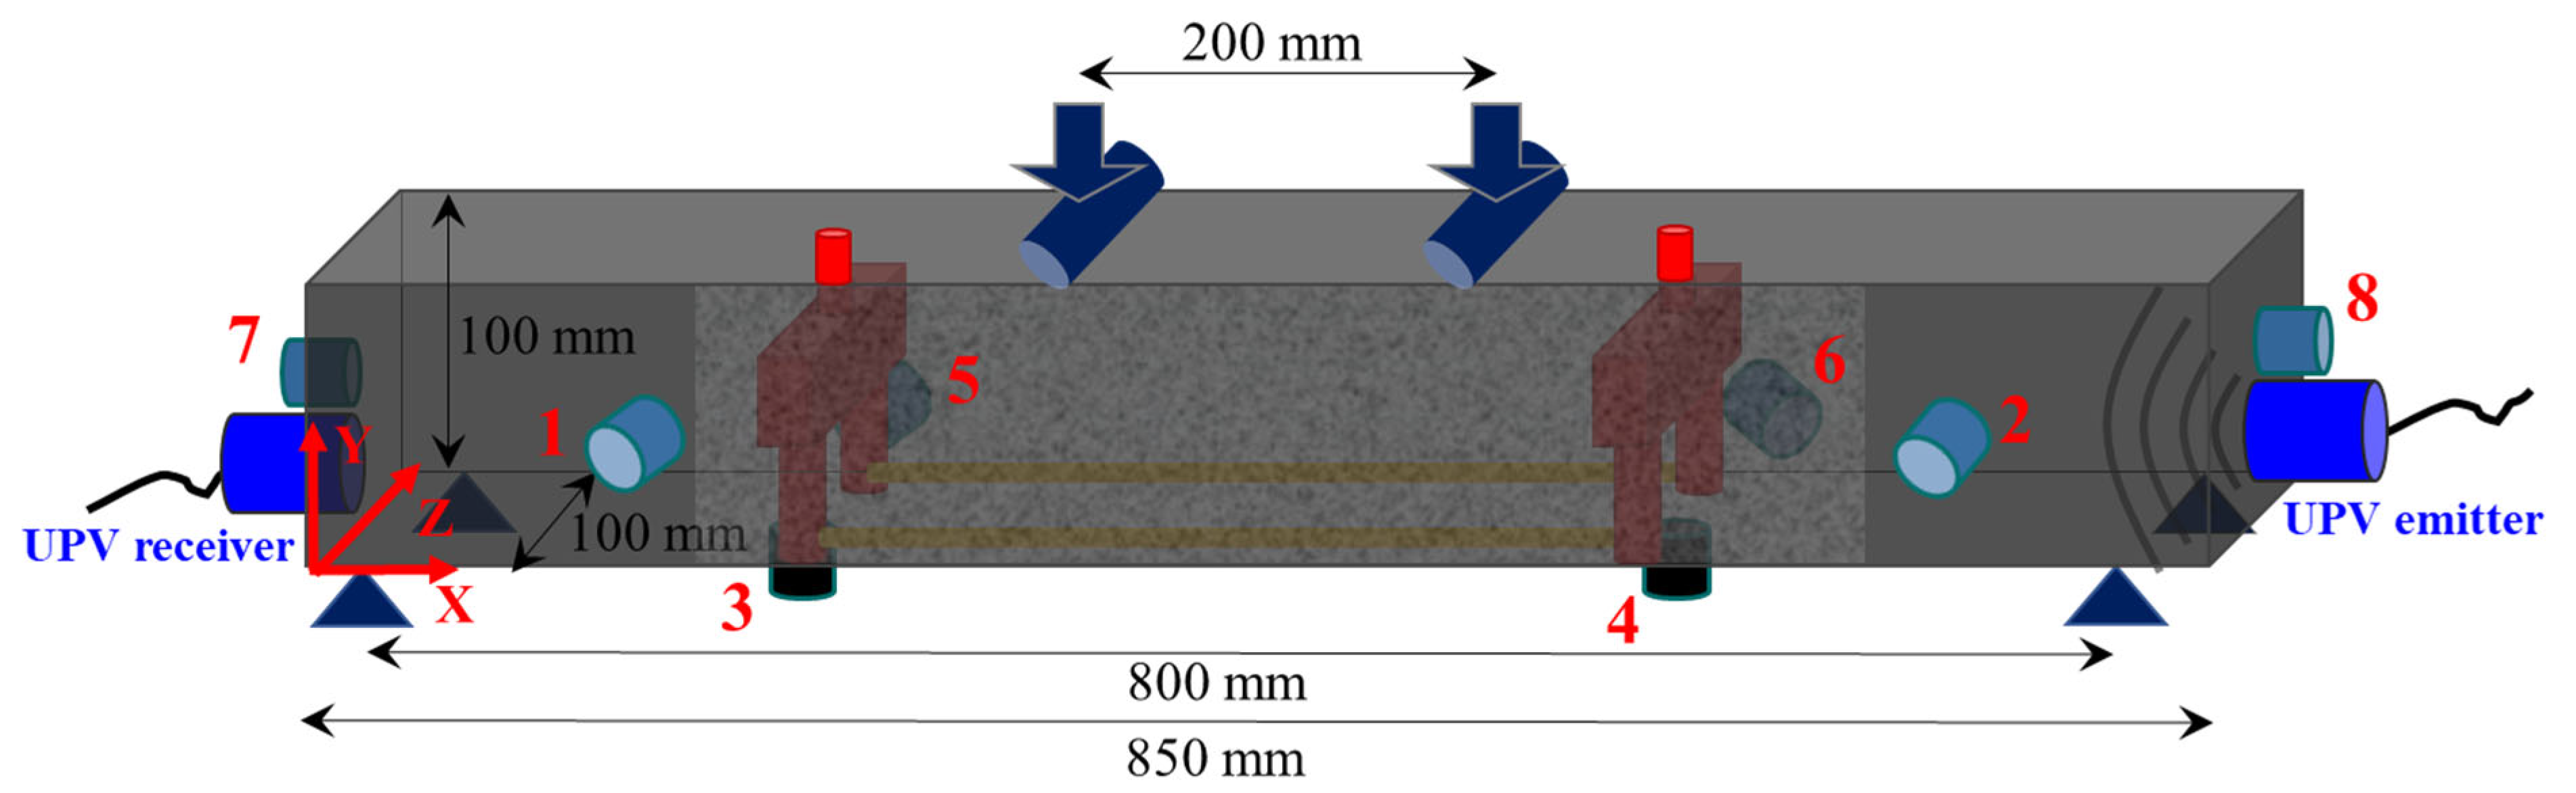
3.1. Concrete Beams

Normal strength concrete (with CEM I 52.5 N) was prepared and mixed with the material composition given in Table 1. River sand with a particles diameter up to 4 mm was selected, whereas large (8–16 mm) coarse and rounded smaller (2–8 mm) aggregates were utilized. First, the dry raw materials were mixed for 3 min, and mixing continued for 1 more minute when water was added. Next, the mixed material was cast in layers into a wooden mold placed on a vibration table. Constant vibration for 5 min ensured a good compaction of the concrete material. The wooden mold had dimensions of 850 × 100 × 100 mm3. The beam geometry was selected in order to compare the research outcome to previous test results [6,8,19] and since it ensured pure flexural cracks formation under four-point bending. After casting, the molds were covered by a plastic film to avoid excessive drying and stored in ambient conditions for 48 h. Then, the concrete was demolded and stored underwater at 20 °C until the age of 28 days.
The healing system was pre-positioned into the wooden mold and its position was adjusted during concrete pouring with a 10–12 mm concrete cover (Figure 1e). Attention was given to ensure the concrete flowed below the network, filling the air gaps that might have developed underneath the network. Low vibration enhanced the concrete flow and good adhesion with the network. All inlet/outlet connection tubes were covered by duct tape to avoid the concrete entering the healing network. After curing, the concrete was taken out of the water and air pressure applied to remove water entrapped in the healing networks.

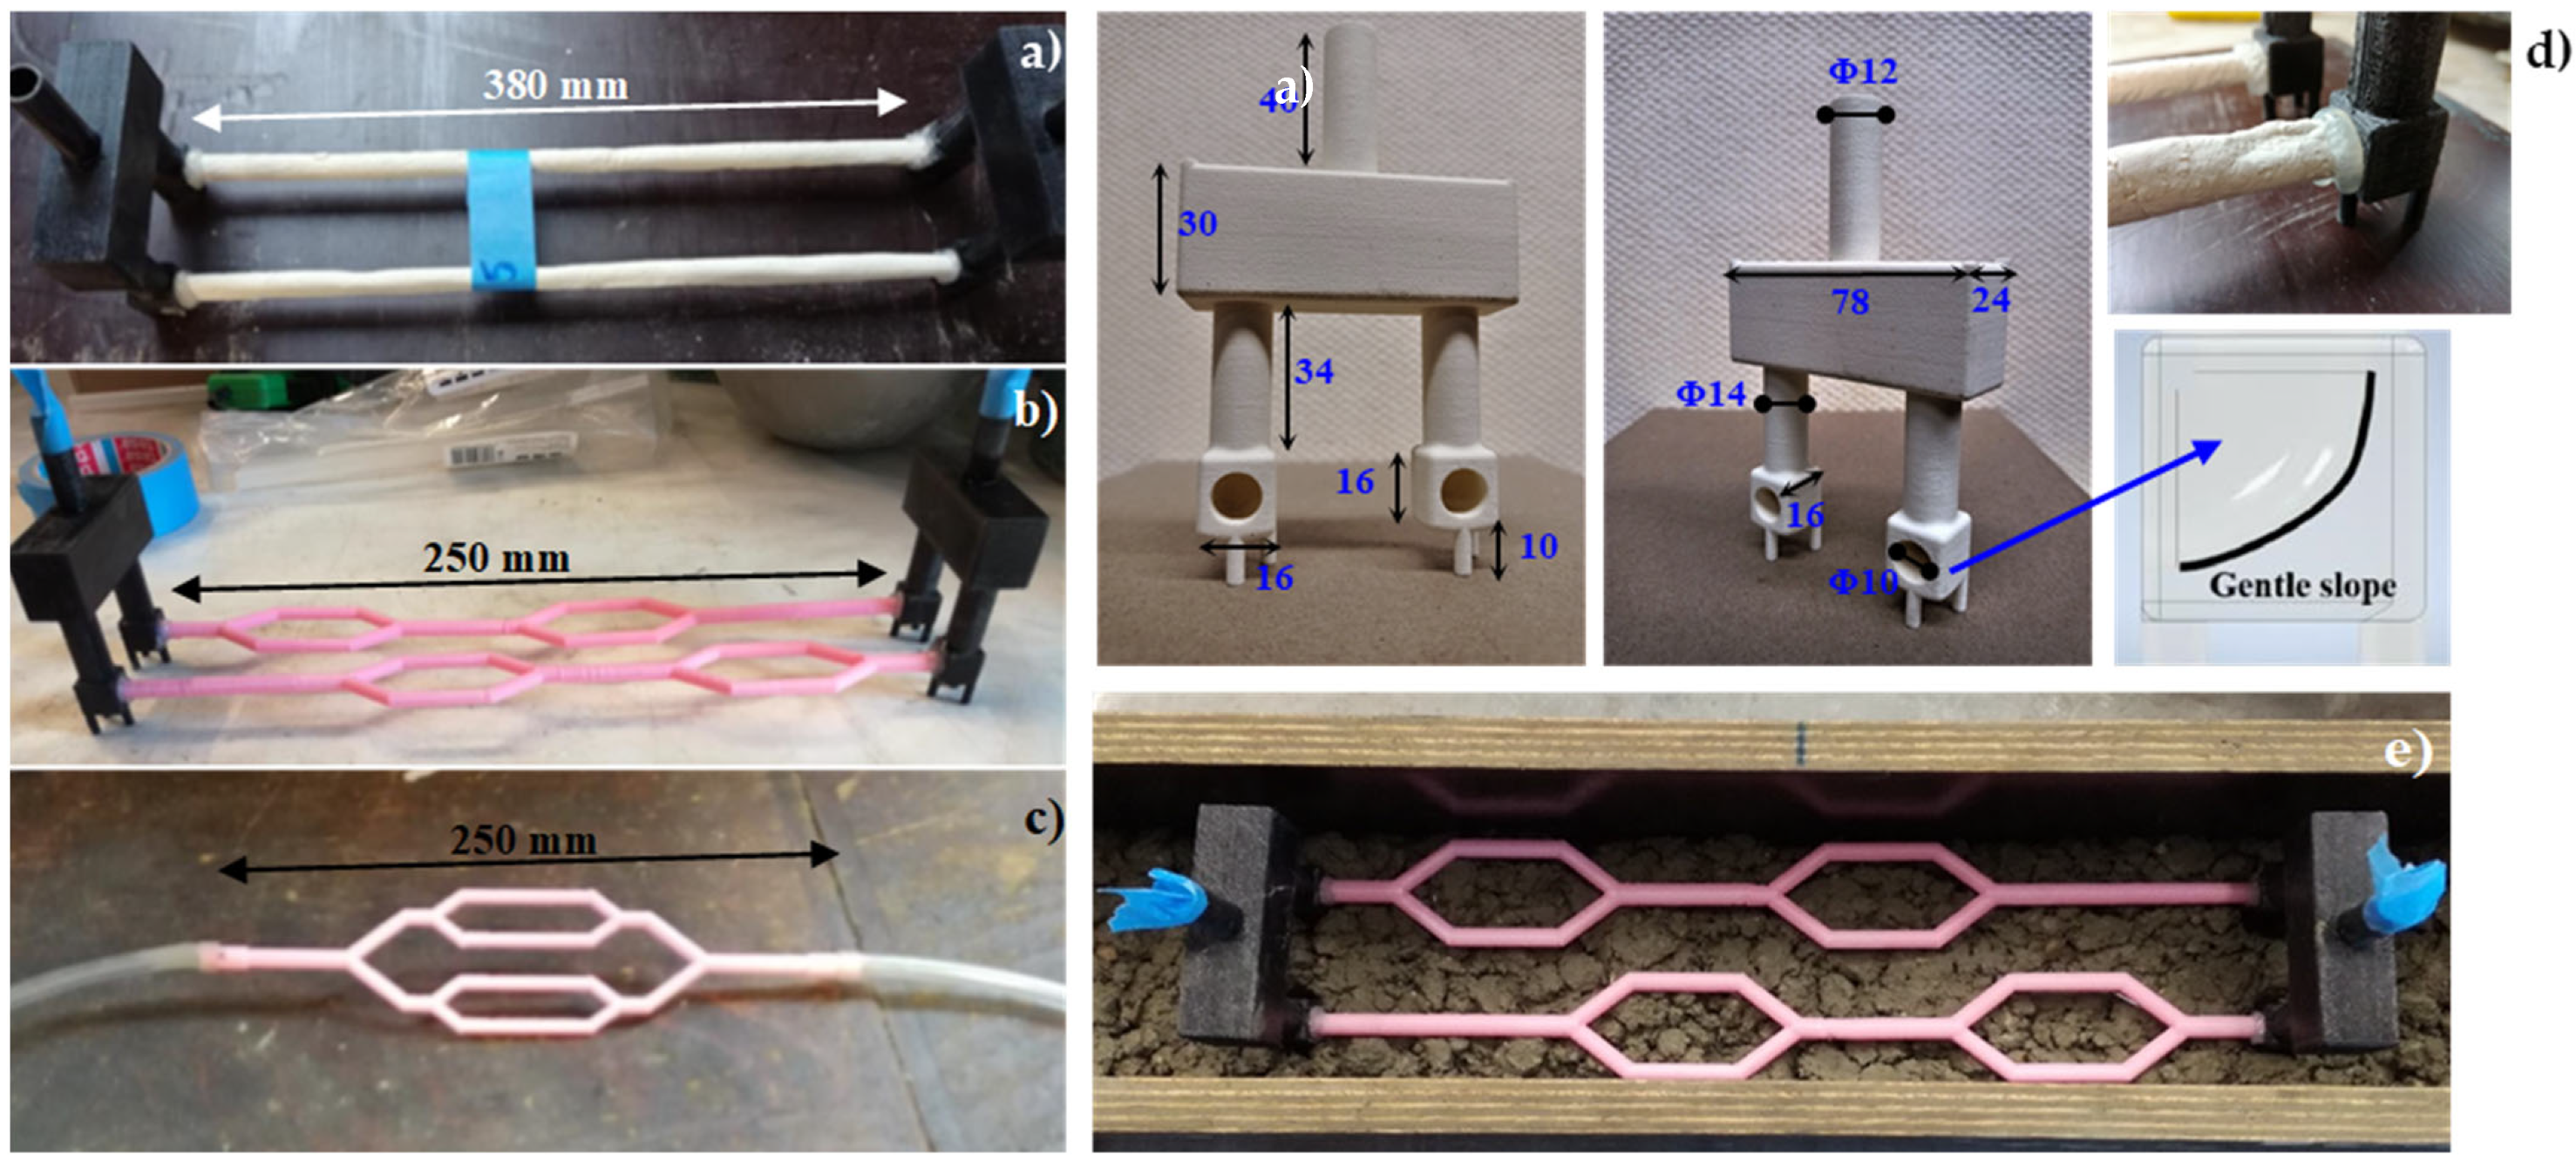
3.2. Healing Networks

In total, three series of five concrete beams were cast. The healing system configuration varied as reported in Table 2. The healing design components are described in this section.
Ceramic tubes: Natural fine-grained, soft, white clay for modelling and pottery was provided by Pebeo (Gedeo). The tubes were hand-crafted in a ceramic studio. The ceramic paste was cast in a 400 × 400 mm2 plate 2 mm-thick and rolled on a long wooden stick with an inner diameter of 6 mm. The stick was carefully removed after an hour. The ceramic tubes were fired up to 950 °C with a rate of 100 °C/h and cooled down in a period of 3 days. The solid tubes were then stored in ambient conditions until the concrete casting. The length obtained was 380 ± 43 mm, often constrained due to hand-crafting and shape irregularities at the endpoints (Figure 1a).
3D printed tubes: Polylactic acid (PLA) 0.8 mm-thick tubes were additively manufactured up to 250 mm long with an inner diameter of 6 mm. The networks were printed using an Ender 5 Pro fused deposition modelling (FDM) printer, using a 0.4 mm nozzle, a layer height of 0.2 mm, printing speed of 60 mm/s, nozzle temperature of 200 °C and a heated build plate temperature of 60 °C. Each network was printed vertically to the build plate to give the network brittle properties under a bending load. The tubes geometric design is summarized in Figure 1b,c. Due to the size limitation of the 3D printer, the vascular structure shown in Figure 1b was printed in two parts before being soldered together. The radius relationship of parent to daughter branches was in accordance with Murray’s law, which minimizes the power required for fluid transport (Equation (1)):
r p 3 = r d 1 3 + r d 2 3
where rp is the radius of the parent branch and rd1 and rd2 are the radii of the daughter branches. For this cube law, the optimal branching angle is 75°. For the network shown in Figure 1c, an internal diameter of 3 mm for the smallest daughter branches was chosen as that was the minimum that could be stably printed. The network shown in Figure 1b was designed to be secured to the reservoir system with an adhesive glue, which constrained the parent branch’s internal diameter to exactly 6.4 mm.
Inlet/outlet: Two connection systems ‘were considered: (1) A flexible PVC tube with an inner and outer diameter equal to 10 and 11 mm, respectively, was manually mounted on each side of the vasculature shown in Figure 1c. An effort was made to fit the flexible tube at least 3 mm deep onto the vasculature; (2) for the remaining systems, 3D-printed polyethylene terephthalate (PET) reservoir blocks were manufactured by PrintPlace using FDM technology. The additively manufactured PET reservoir blocks were previously applied and proven to effectively circulate the agent through the healing network [6]. Geometrical details of the reservoir blocks are given in Figure 1d.

3.3. Healing Agent

A one-component expansive (up to 30 times in volume) foam polyurethane (PU) was selected as the healing agent. Moisture was the polymerization trigger of the PU agent and its chemical features are summarized in Table 1. This agent was selected as the optimal solution after thorough comparison to alternative commercial solutions due to its high load recovery and expansive properties, as extensively discussed in [11]. Although the expected curing time was 1–5 min, the PU was shown to take longer to fully harden, therefore for these tests the curing time was extended to a 24 h period.
Only after the crack creation (see Section 3.4) was the agent inserted into the healing network by a syringe, while the outlet remained closed. First, up to 20 mL of PU agent was inserted, with the exact volume depending on the crack shape and volume. Next, pressurized air was applied at the inlet as the outlet was capped off. This way, due to high-pressure conditions, the agent was forced to circulate throughout the network and fill up the open cracks. After a few minutes, extra air was applied at the inlet, and this time the agent could be flushed out of the outlet tube in order to clean up the healing system. A curing period of 24 h followed as the agent polymerized inside the cracks.

3.4. Four-Point Bending Test
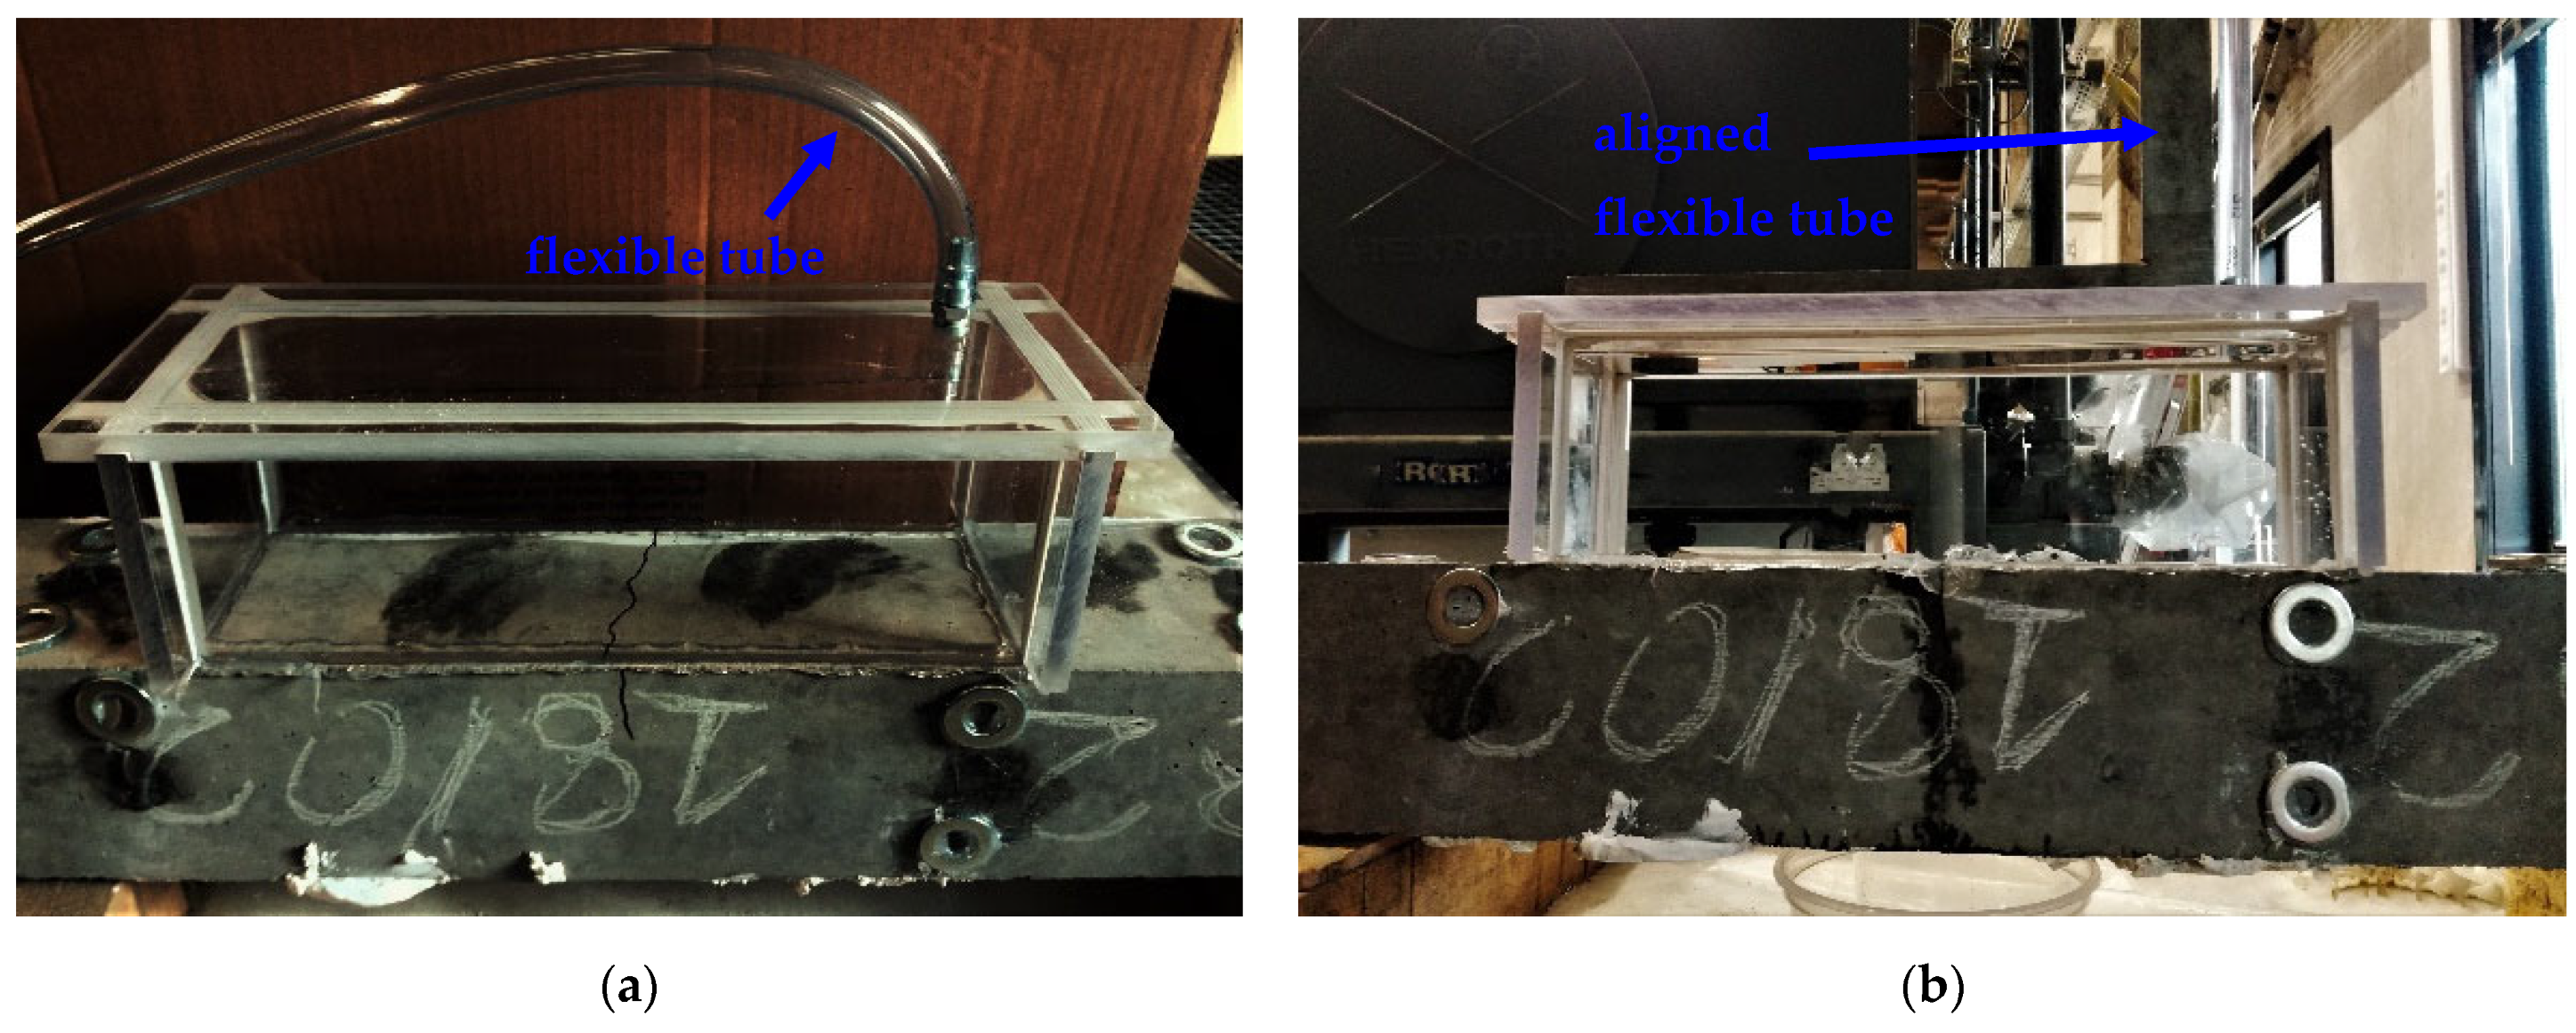
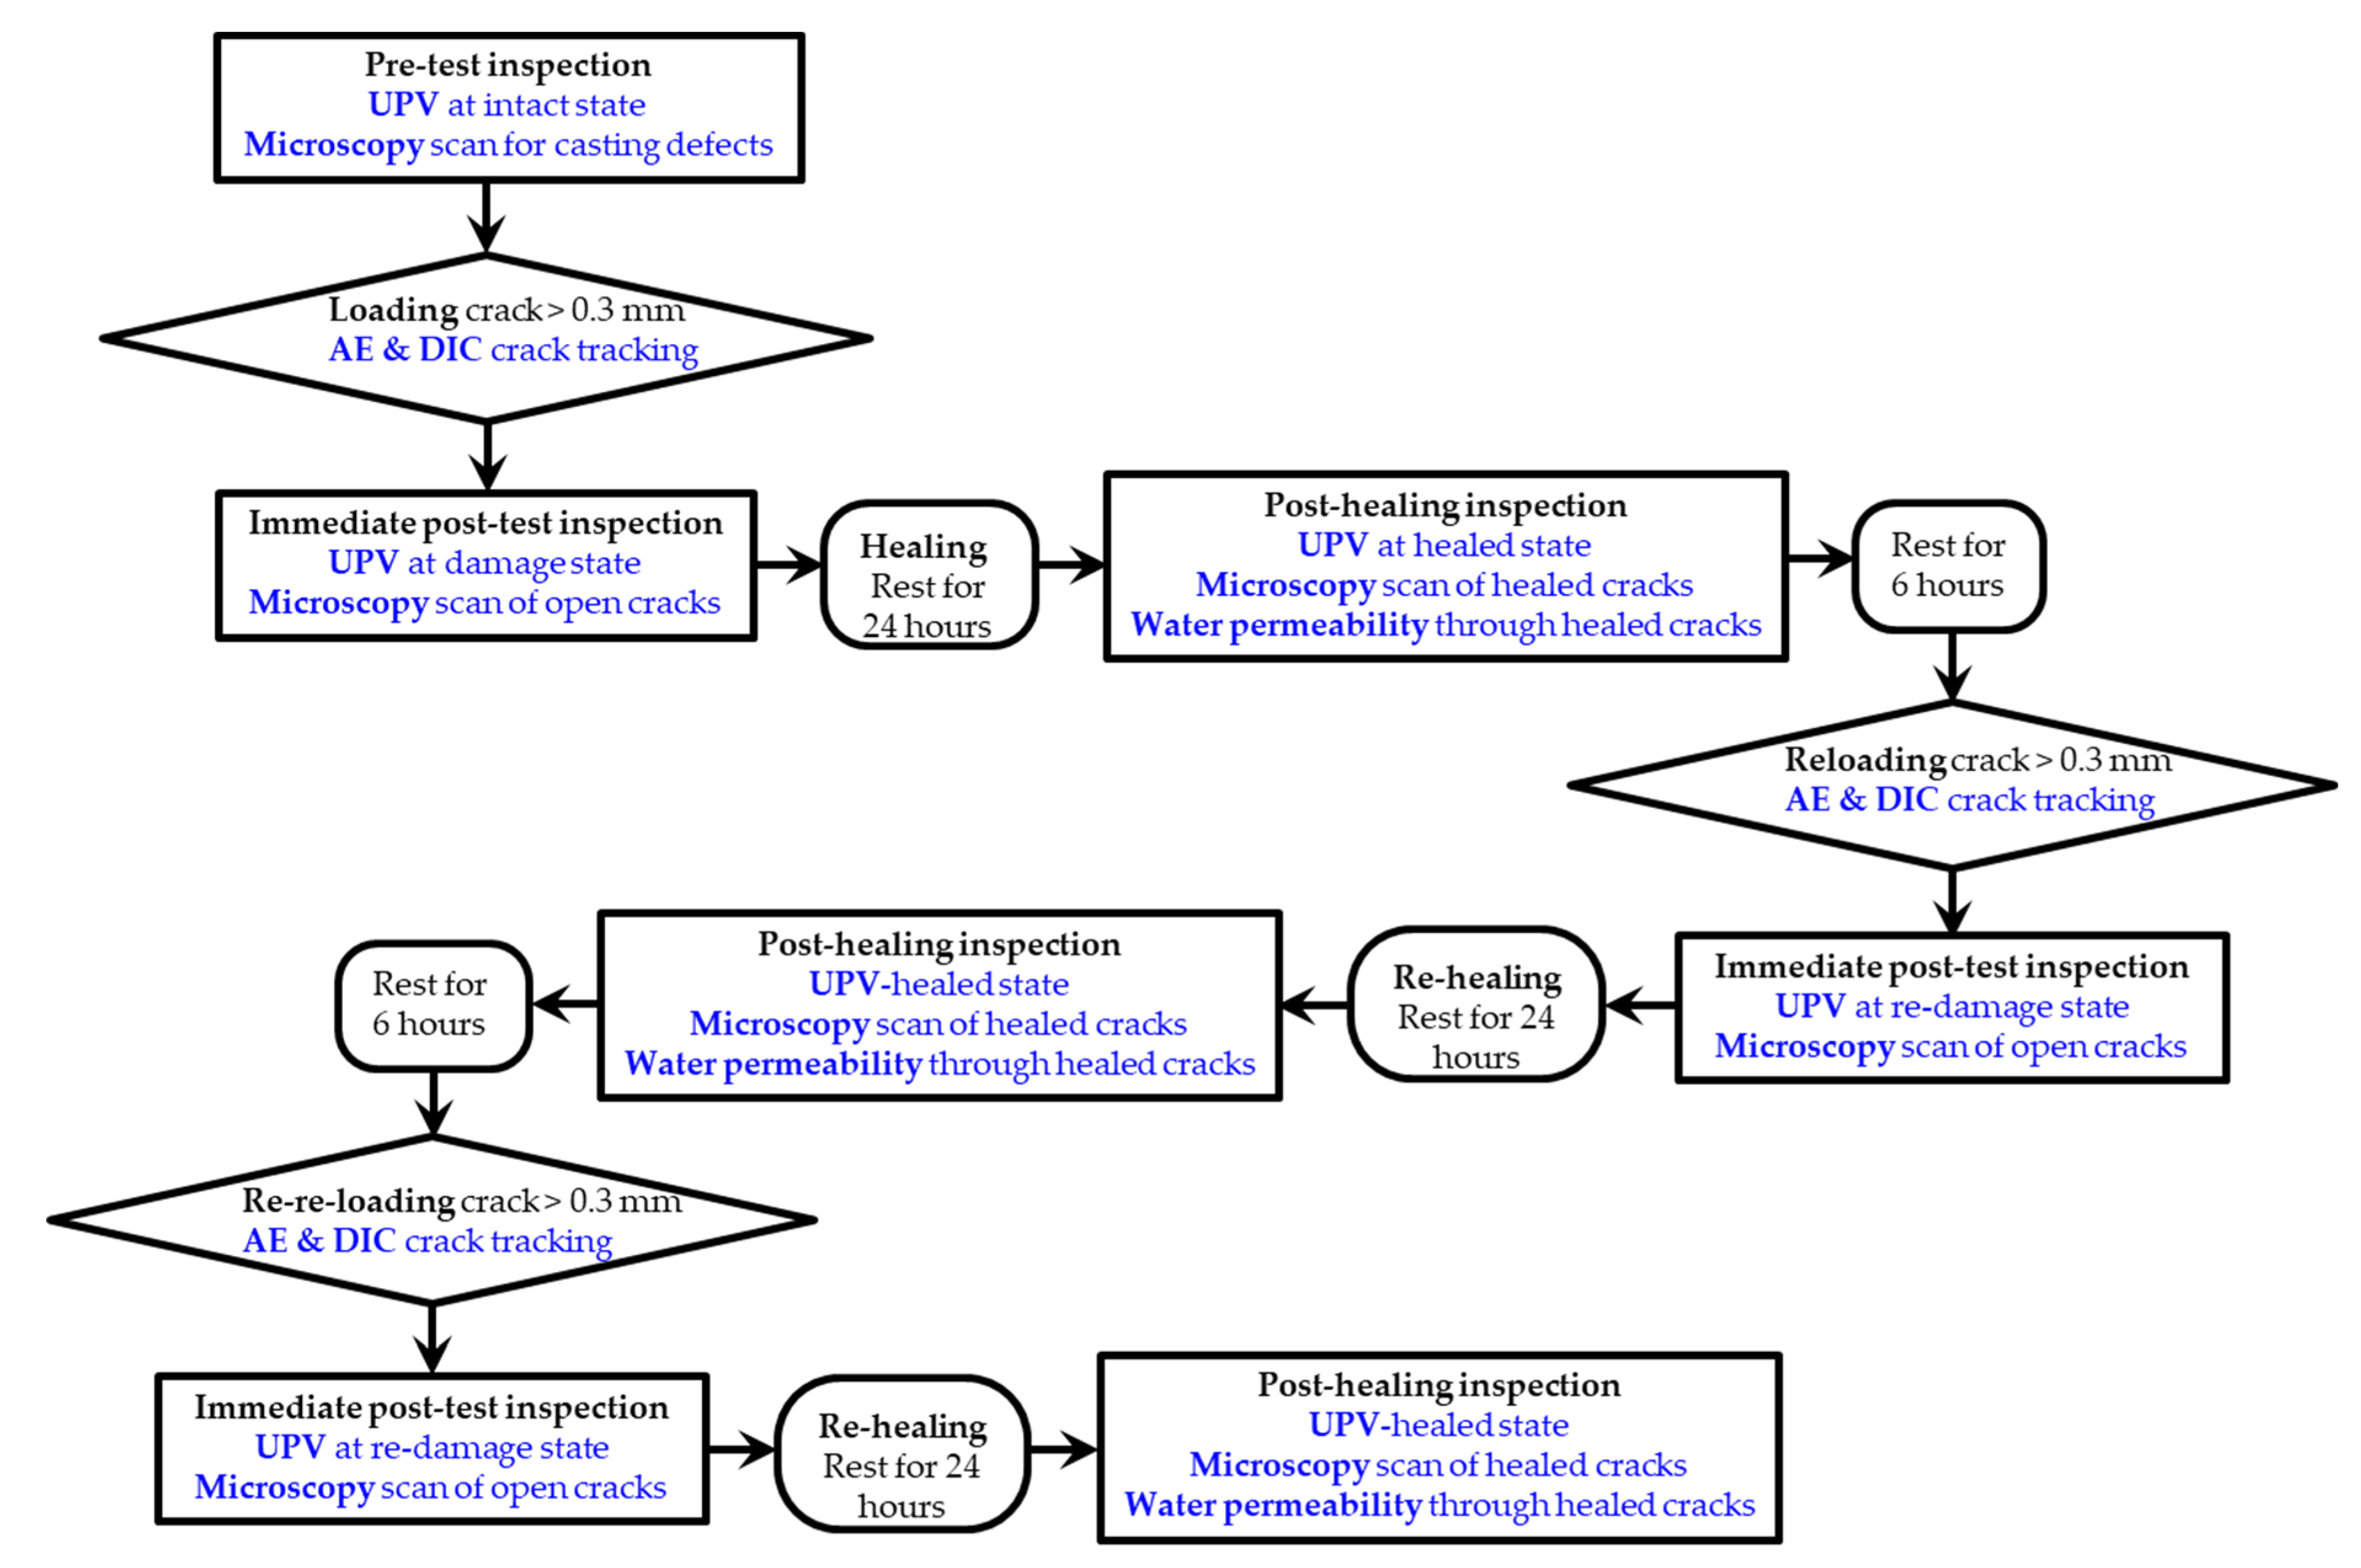
The beams were loaded in four-point bending as illustrated in Figure 2. The upper span was set at 200 mm and the bending span was equal to 800 mm. The quasi-static test was displacement controlled and the load was applied at a rate of 0.1 mm/min. The load and deflection were recorded in a sampling rate of 100 Hz. The test ended when at least one crack was up to 0.3 mm large (crack opening obtained by DIC). After testing, the ultimate load and loading compliance were reported. The compliance (crack opening/load) at the early loading stage, as a relative expression of stiffness, was calculated as the ratio of the DIC crack opening over the applied load. The relative toughness as an expression of damage energy was measured as the area below the load-crack opening curve.

3.5. Inspection

Microscopy: A Dino-lite AM4113T handheld digital microscope was used to capture high-resolution 1.3-megapixel images of the cracked zones at the concrete surface. The surface was scanned considering a wide magnification range (up to 200×) and using all 8 LED illumination probes. The images were captured and stored with the Dino-Capture 2.0 software.
Water permeability: A water basin was developed in-house by means of poly (methyl methacrylate) (PMMA), the design was chosen according to the testing procedure and is illustrated in Figure 3. The inner dimensions of the basin were 300 × 100 × 80 mm3. Before testing, the basin was positioned at the bottom side of the beam, centered to the middle zone and sealed with silicone glue. A hole was drilled through the basin top plate, and a measuring tube with an inner diameter of 12 mm was screwed on the basin (Figure 3a). The basin was fully filled with water through the tube at the top (Figure 3a) to ensure enough water pressure was built at the crack face during testing. The tube was aligned vertically before testing (Figure 3b) and the test started when the water in the tube was up to 200 mm high. Starting from this point, the water level drop was tracked by a chronometer. The time at which the water level dropped by 100 mm was recorded and the permeability coefficient (k in m/s) was obtained accordingly [8] (Equation (2)):
k = α T A t   ln h 0 h f
where α is the tube cross-section (m2); A is the water-beam contact area (m2); T is the beam height (m); t is the measured time (s); and h0 and hf are the initial and final water levels, respectively (m).
Ultrasonic pulse velocity (UPV): The velocity of ultrasonic pulses through the beam was measured using the Controls PULSONIC portable device according to ASTM C597. The transmitter probe was mounted to the beam side as illustrated in Figure 2 and the receiver was mounted at the other end of the sample. This way the emitted pulses travelled through the beam’s length and transversely crossed the cracked plane. The pulse had a magnitude of 2500 V and frequency of 54 kHz, recorded in a sampling rate of 10 MHz. The transit time (Δt in s) was measured and the pulse velocity (UPV in m/s) was obtained taking into account the wave propagation distance (Δx) equal to 0.85 m (Equation (3)):
UPV = Δ x Δ t
The crack opening was assumed negligible relative to the beam length, therefore it was not considered when defining the wave propagation distance.
Acoustic emission (AE): An array of eight AE transducers were mounted on the concrete surface using Vaseline couplant and the transducers were fixed with magnetic holders. The probes had a resonant frequency response at 150 kHz and recorded the damage-emitted signals pre-amplified by 40 dB. An amplitude threshold was set at 35 dB to eliminate the ambient noise and the frequency bandwidth was fixed from 20 kHz to 1 MHz. The waveforms were recorded with a sampling rate of 1 MSPS. The DiSP-24 monitoring device was equipped with a PCI/DSP-4 data acquisition board and PowerPAC software provided by Physical Acoustics. AEWin software was used to process the recorded AE data and the post-processing was completed with Noesis software. Three-dimensional AE events localization analysis was performed considering the AE transducers position (Table 3) and assuming a constant wave propagation velocity equal to 4000 m/s. The velocity was obtained by measuring the transit time between two sensors following Hsu-Nielsen excitation (pencil lead break) [20] at an intact state. Inaccuracy on AE events localization at the cracking state was acknowledged since at that moment, the wave velocity significantly dropped, as illustrated by the UPV measurements as well; however, for reasons of consistency, the velocity was assumed constant throughout testing. At the damage state (crack width up to 0.3 mm), this loss of localization accuracy was approximately 20 mm/m as reported in [19].
Digital image correlation: Prior to loading, the front side of the concrete beams were painted white and random black speckle patterns with a diameter up to 1 mm were marked by ink-rolling on the white surface. The speckle pattern covered the bending zone in an area of 100 × 500 mm2, as illustrated in Figure 2. A pair of high-resolution cameras were fixed on a tripod at a distance of 0.8 m from the beam, facing the front side in a stereoscopic setup (angle 30°). Lenses of 12 mm focal length were mounted on the cameras and the aperture was set at 1/5.6. Correlated Solutions provided the Vic-Snap software for the synchronous triggering of images captured each 2 s during loading. The load and displacement of the test bench were also recorded. Stereoscopic calibration was performed prior to testing.
The captured images were post-processed using Vic-3D computational software to extract the deformation and strain maps. The analysis subset was fixed at 21 pixels and the step at 7 pixels, whereas the strain window size was 15 pixels. A spatial resolution of 0.08 mm/px was obtained.
Testing procedure: The testing procedure is summarized in Figure 4. Before and after loading, inspection of the cracks was performed combining the UPV, microscopy scan and water permeability tests. It should be noted that the UPV measurements were conducted on dry concrete beams and earlier to permeability tests. After the latter, the samples were left to dry for at least 6 h prior to loading. Cyclic loading occurred as long as the cracks were healed and the healing network was clear, therefore the agent could be cleaned out after loading. Up to three loading cycles were performed at each beam.

4. Results

4.1. Mechanical Tests

After healing, the recovery of mechanical features was the first indication of a successive intervention. The load is plotted in Figure 5 against the crack opening as measured by the DIC horizontal displacement of two points fixed at both crack faces at the bottom of the beam. In contrast to other studies that report on load-deflection curves, herein the DIC online and continuous displacement tracking permits accurate tracking of the crack onset and progress. Three cases are illustrated in Figure 5 and their mechanical results are summarized in Figure 6:
-
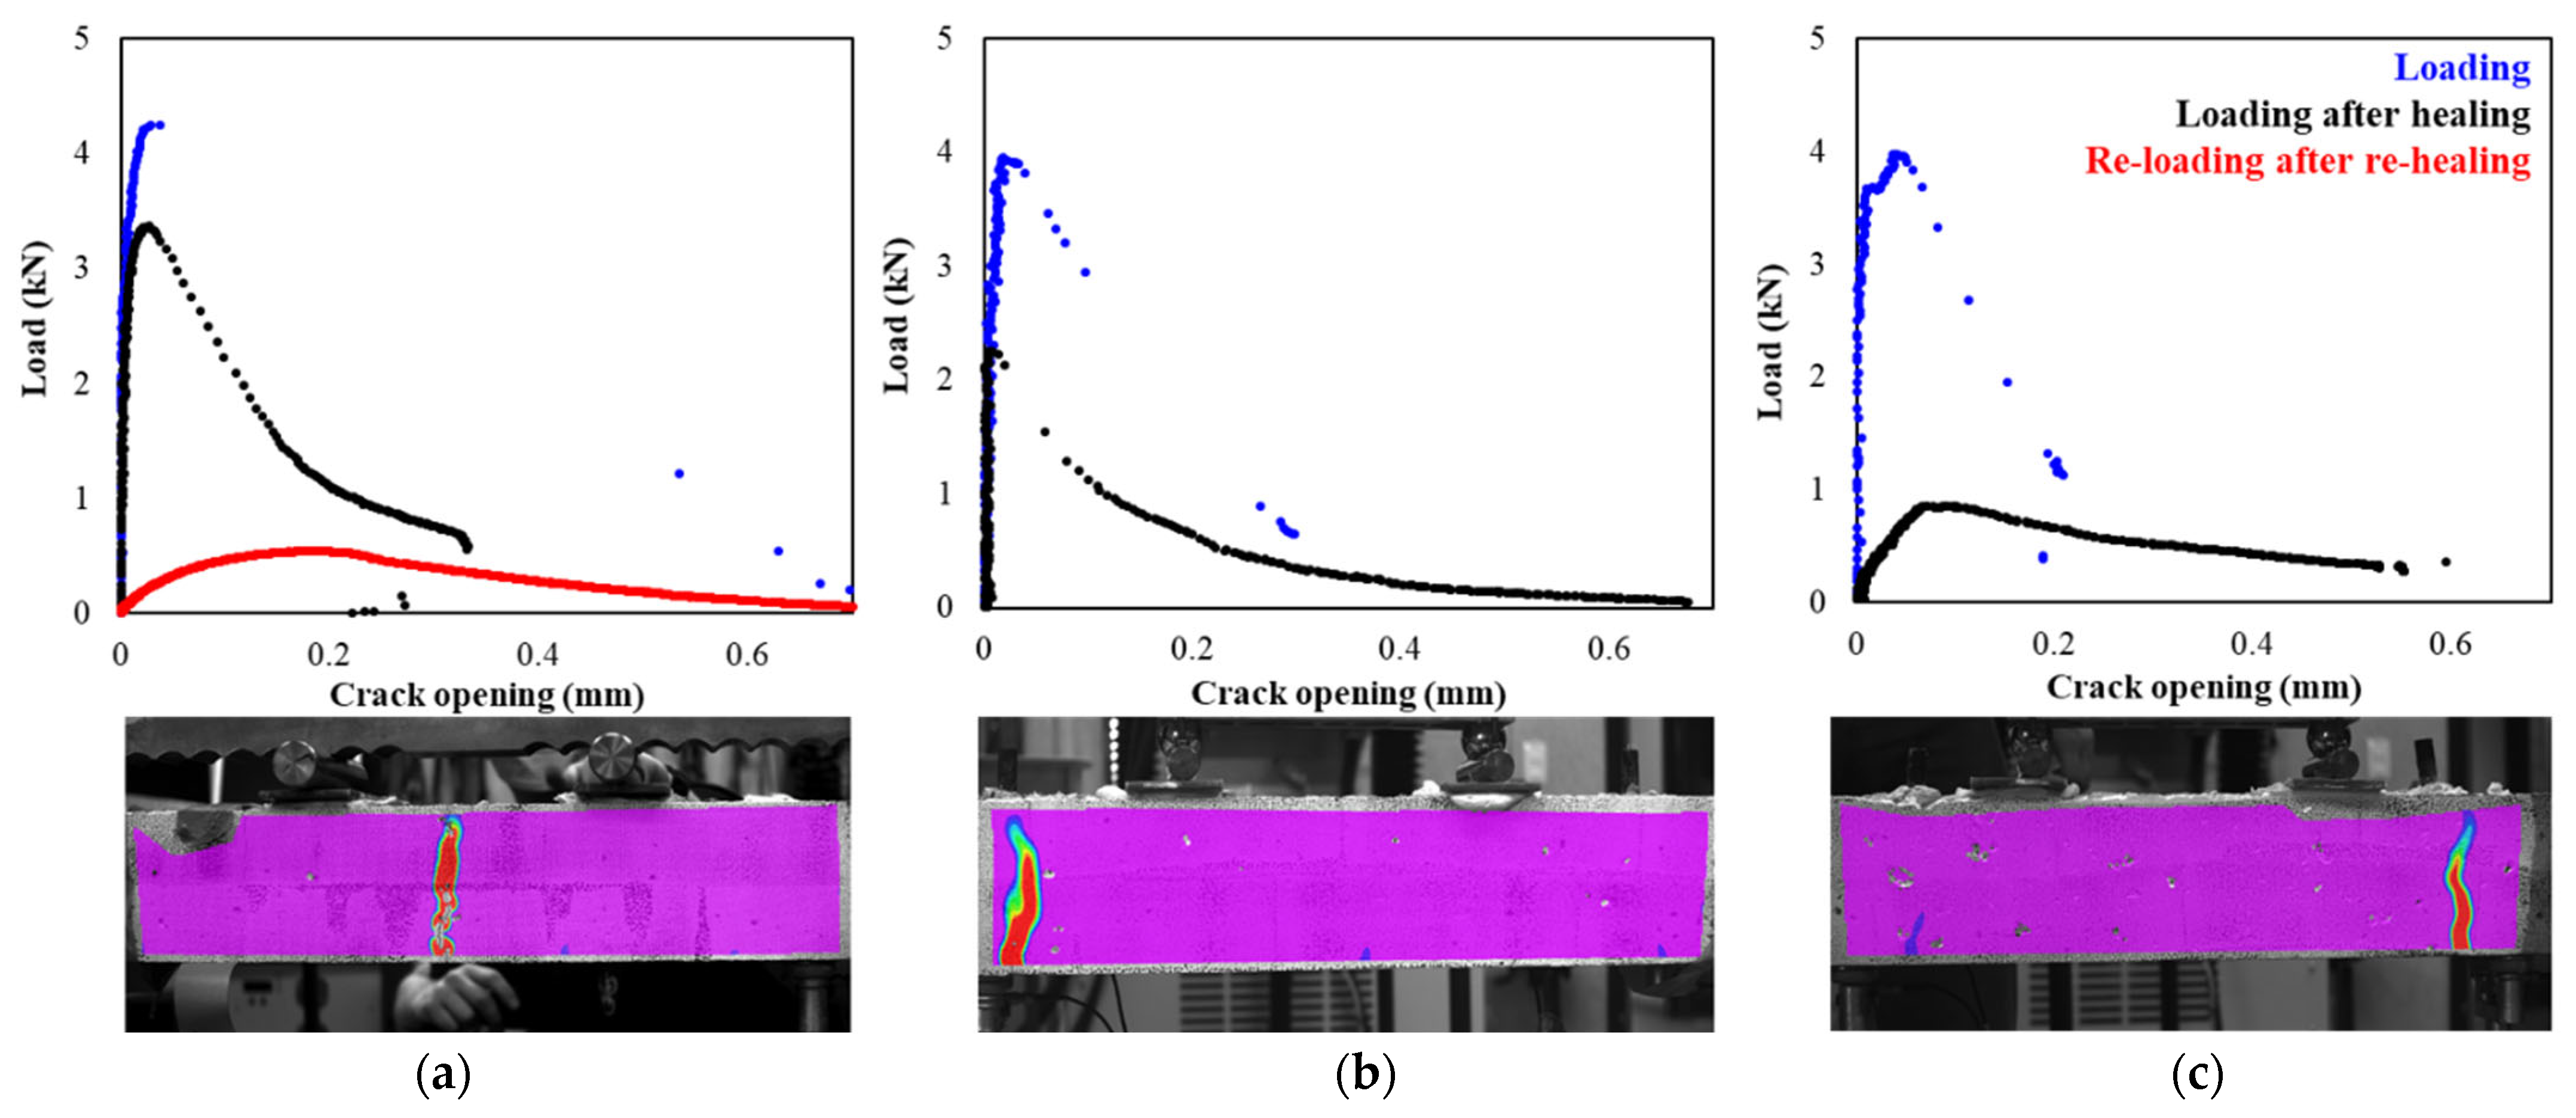
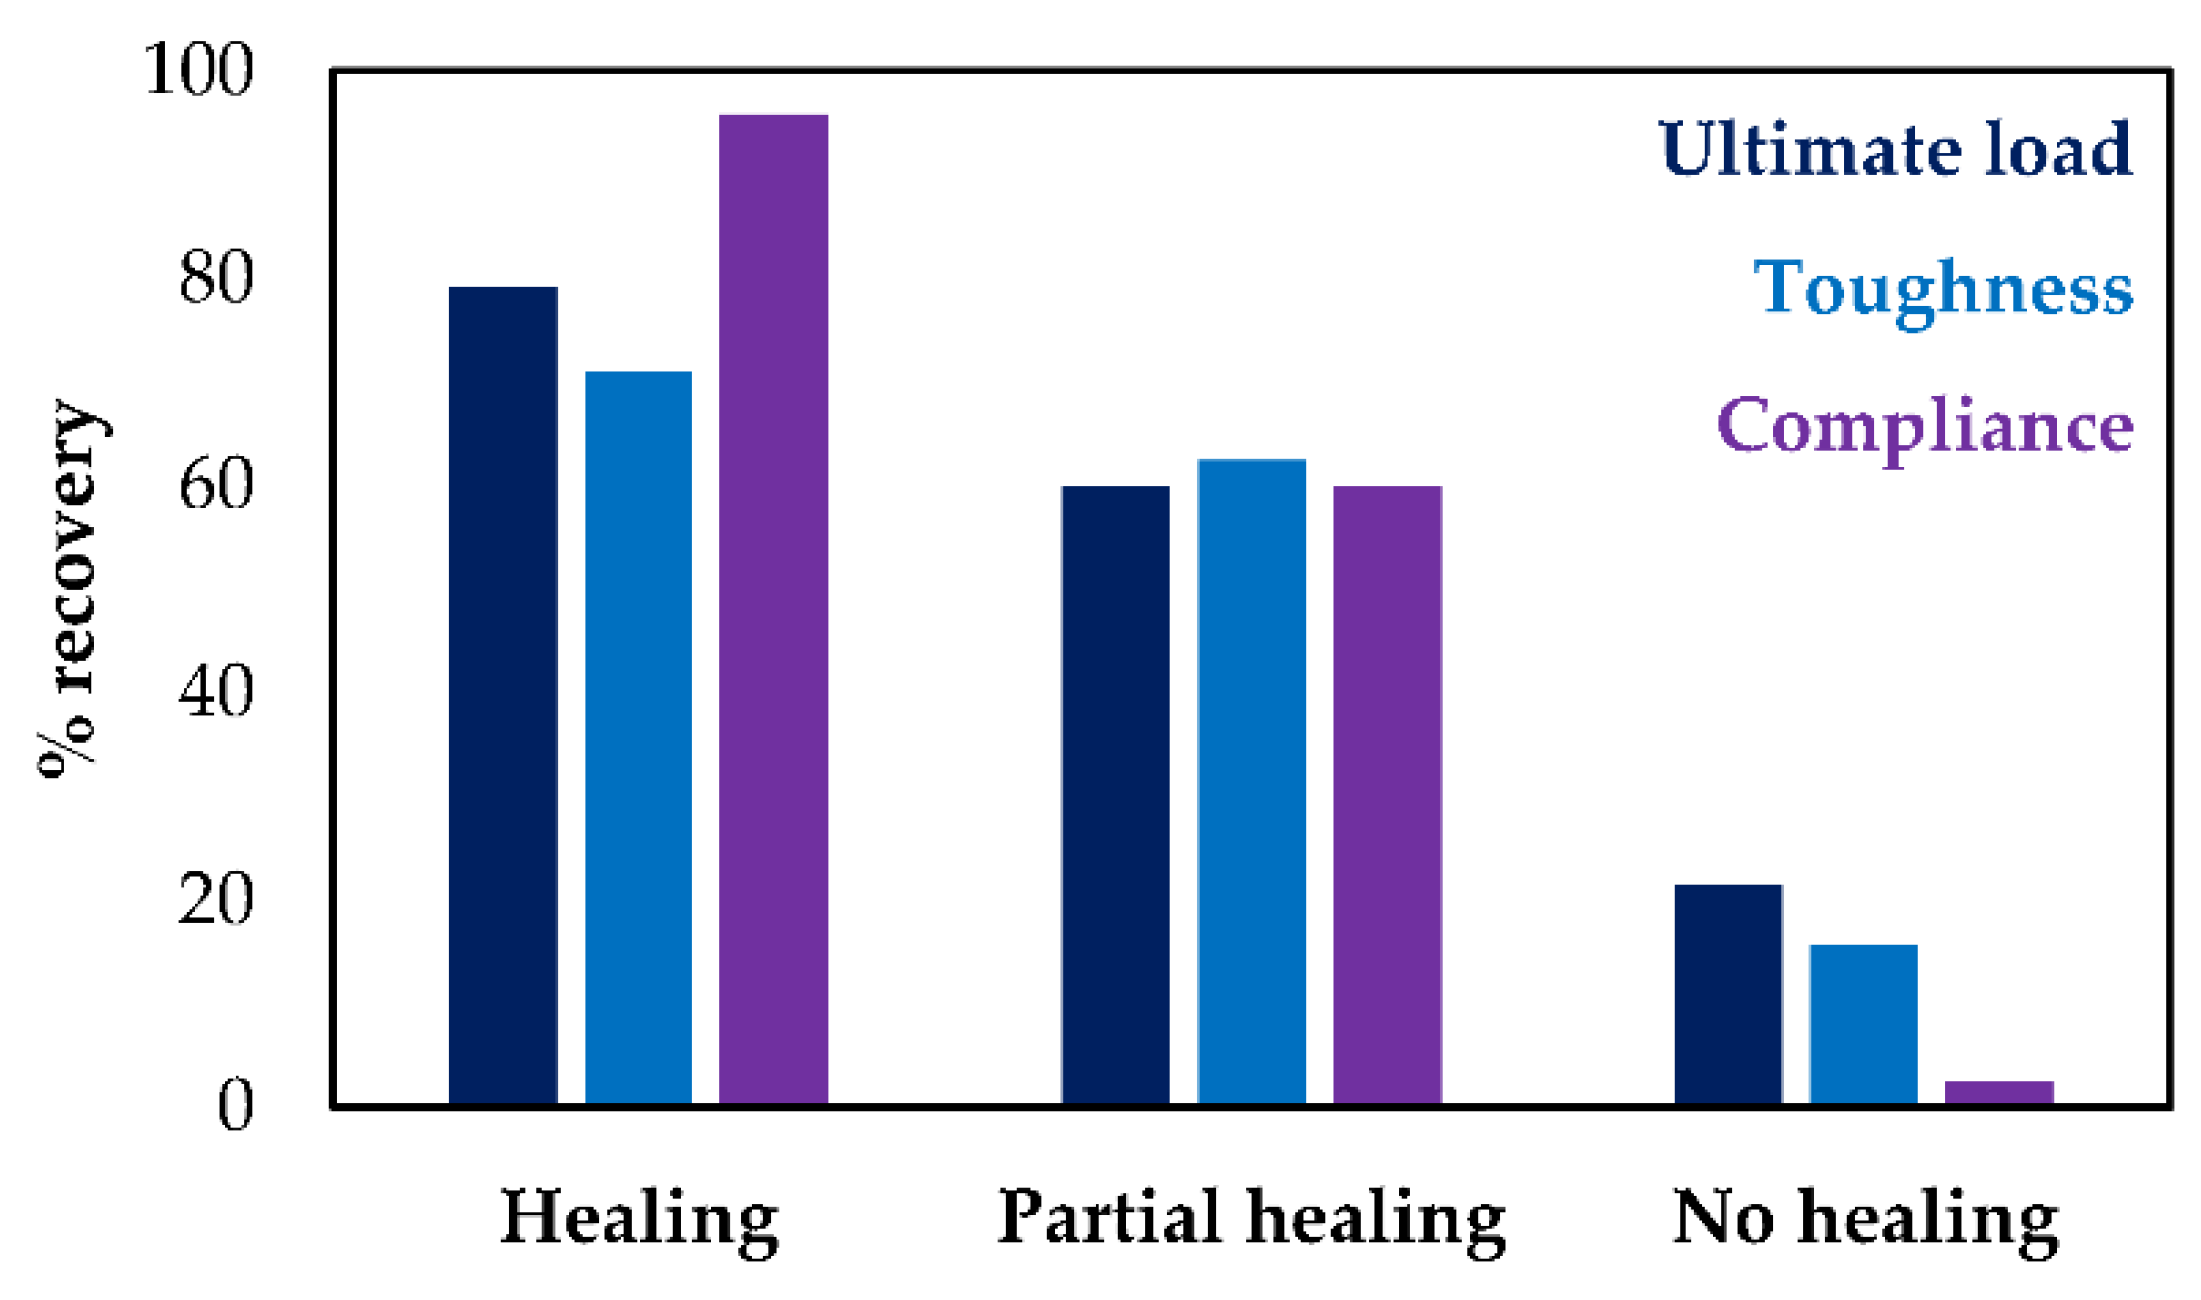
Full crack healing (Beam 4): The early compliance was fully recovered (96%) and the ultimate load reached after healing was up to 80% of the original value. The initial crack reopened after healing; however, significant resistance to fracture was foreseen (Figure 5a), as proven by the significant toughness recovery (71%, Figure 6).
-
Partial healing (Beam 11): Figure 5b demonstrates the case of a beam at which partial healing and moderate restoration was reported (i.e., recovery of mechanical features by approximately 60%, see Figure 6). In this case, unexpectedly the crack was located at the limits of the bending zone. This phenomenon was reported for the majority of beams that carried 3D printed PET reservoirs. It was shown that the healing system design impacted both healing efficacy and crack formation. Since the PET reservoirs were standing only 30 mm away from the end of the limits of the bending zone, the cracks were attracted by the boundary effect at the reservoir-concrete interface. It should be noted that a clear distinction between the fully and partially healed samples could not be made with confidence; however, this classification was chosen to underline the healing potentials of the systems under design.
-
No healing (Beam 9): In a few cases, the crack was formed out of the healing zone; therefore, the agent delivery could not be obtained. This case reports the limited recovery (Figure 6). Indicatively, the ultimate load at re-loading stage was equal to the load reached at the end of the loading cycle. Additionally, considering the limited toughness measured after healing and the absence of compliance recovery, this case will be considered further in this study as the unhealed scenario.
By implementing DIC analysis, the crack position and propagation could be obtained, a result that demonstrates the potential of this technology for the online inspection of healing phenomena in the laboratory.
Effective crack re-healing was not achieved in any beam under study, as illustrated with the red plot in Figure 5a. The failure of the vascular network after healing will be further discussed in the following sections. It is concluded that the presence of 3D printed PET reservoirs in the beam affects the crack formation since in all cases, the crack deviates from the middle bending zone.

4.2. Healing Inspection

The results of the UPV and permeability tests are presented in this section to highlight the impact of reservoir systems on the crack healing. In Figure 7 the UPV measurements are reported and the data are split into two groups: Figure 7a presents UPV values for partially and fully healed beams (B2–B4 and B11–B12) and Figure 7b illustrates the results for unhealed beams (B7–B10 and B13–B15).
It is shown that the UPV through the crack after healing was almost fully recovered (black compared to the intact light blue points series) for all beams where healing was present (Beams 2, 3, 4, 11 and 12). The UPV recovered by 95% on average and increased by 126% relative to the damaged state (dark blue dot series).
On the contrary and as expected, the UPV recovery was not evident in the unhealed series (Beams 5–10 and 14–15). Indicatively, in none of the cases, the UPV did reach values higher than 4000 m/s after cracking. The UPV results demonstrate the potential of the technique to track the crack refilling, agent polymerization and mechanical restoration after healing.
It should be reported that the UPV was also measured after the second round of healing and no recovery of UPV was evident (red series), another indication that repeatable healing cannot be reached with this beam’s design.
The water permeability test results validate the crack tightness by tracking the water transport rates [21]. As reported in Figure 8, the permeability coefficient reached very high values in the unhealed case (black series), whereas low values were obtained for partially healed beams (red series).
It should be noted that both Figure 7 and Figure 8 report on inspection relative to the crack size at the end of the first loading cycle as obtained by DIC. This way the authors wish to communicate the critical role of crack opening on healing feasibility. The UPV inspection accuracy was proven by the fact that the velocity remained high relative to the intact state for small-size cracks (see dark blue dots series) and significantly dropped as the cracks were open up to 550 μm. Interestingly, after healing, all cracks, regardless of their size, appeared well-sealed and recovered in Figure 7a. Thus, it is shown that the healing provided by vascular networks can be effective at any crack size.
On the contrary, no link between the crack width and the water permeability could be acquired. Previous studies reported on the fact that healing can be achieved, although the crack is partially sealed [22]. The crack plane roughness and spatial topography appeared to control the water flow and as a result, cracks of identical size appeared to have different permeability coefficients [23].

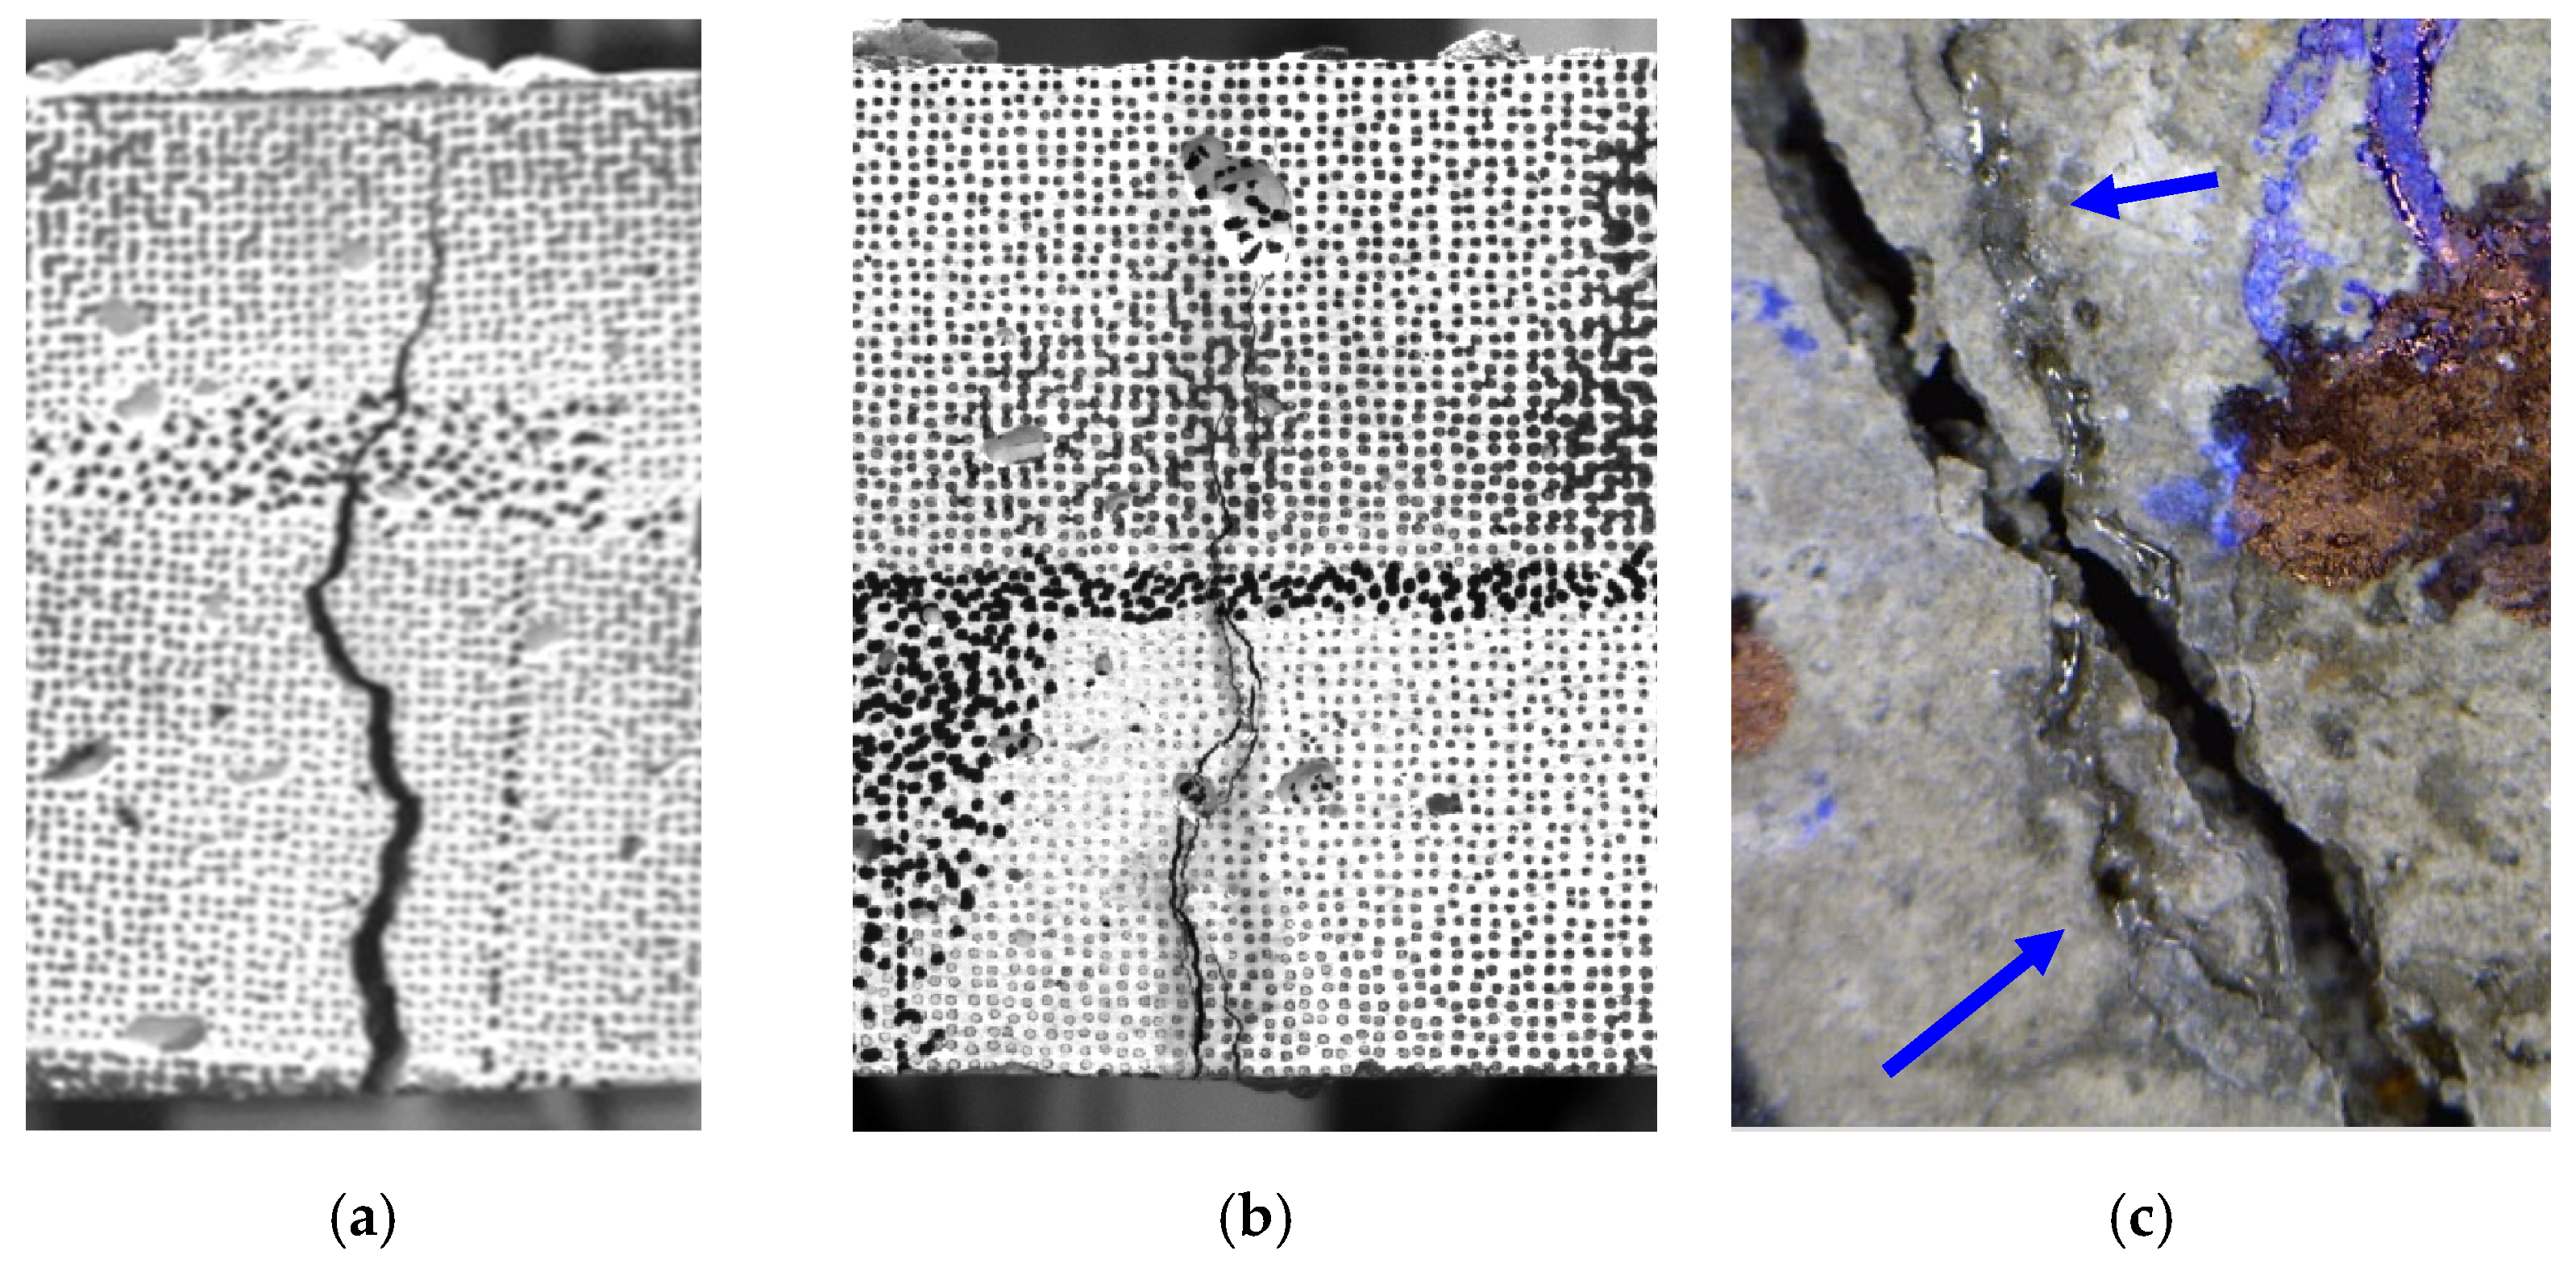
4.3. Post-Softening Fracture after Healing

The transition from a brittle to a pseudo-ductile mode with progressive cracking, only after successful healing, was tracked by DIC horizontal displacement and AE hits analyses for Beam 4, as illustrated in Figure 9a,b, respectively. The case of a fully healed sample after loading is presented herein. It should be noted that the damage progress remained invariable for the beams at which limited or negligible healing was reported, therefore, and due to space limitations, these results are not extensively reported.
The AE and DIC results are presented standardized to maximum deflection for comparison reasons. Both methods validate that the crack initially formed in the brittle mode, almost instantly reaching the ultimate load. The crack re-opening was characterized by a limited crack opening at the ultimate load; however, extensive post-softening occurred and as a result the crack gradually widened and, due to healing, the brittle catastrophic failure was not developed. This is also reported by the progressive rise on AE hits, compared to the late and steep increase of this at the first loading cycle (Figure 9b). At the third loading cycle, the material resistance to damage was limited as depicted by the early large crack opening and the premature high population of AE hits, clear evidence of unsuccessful re-healing.
Analytically, the crack profile at each loading cycle is given in Figure 10. The DIC full-field view of the crack’s morphology illustrates the damage state, respectively:
-
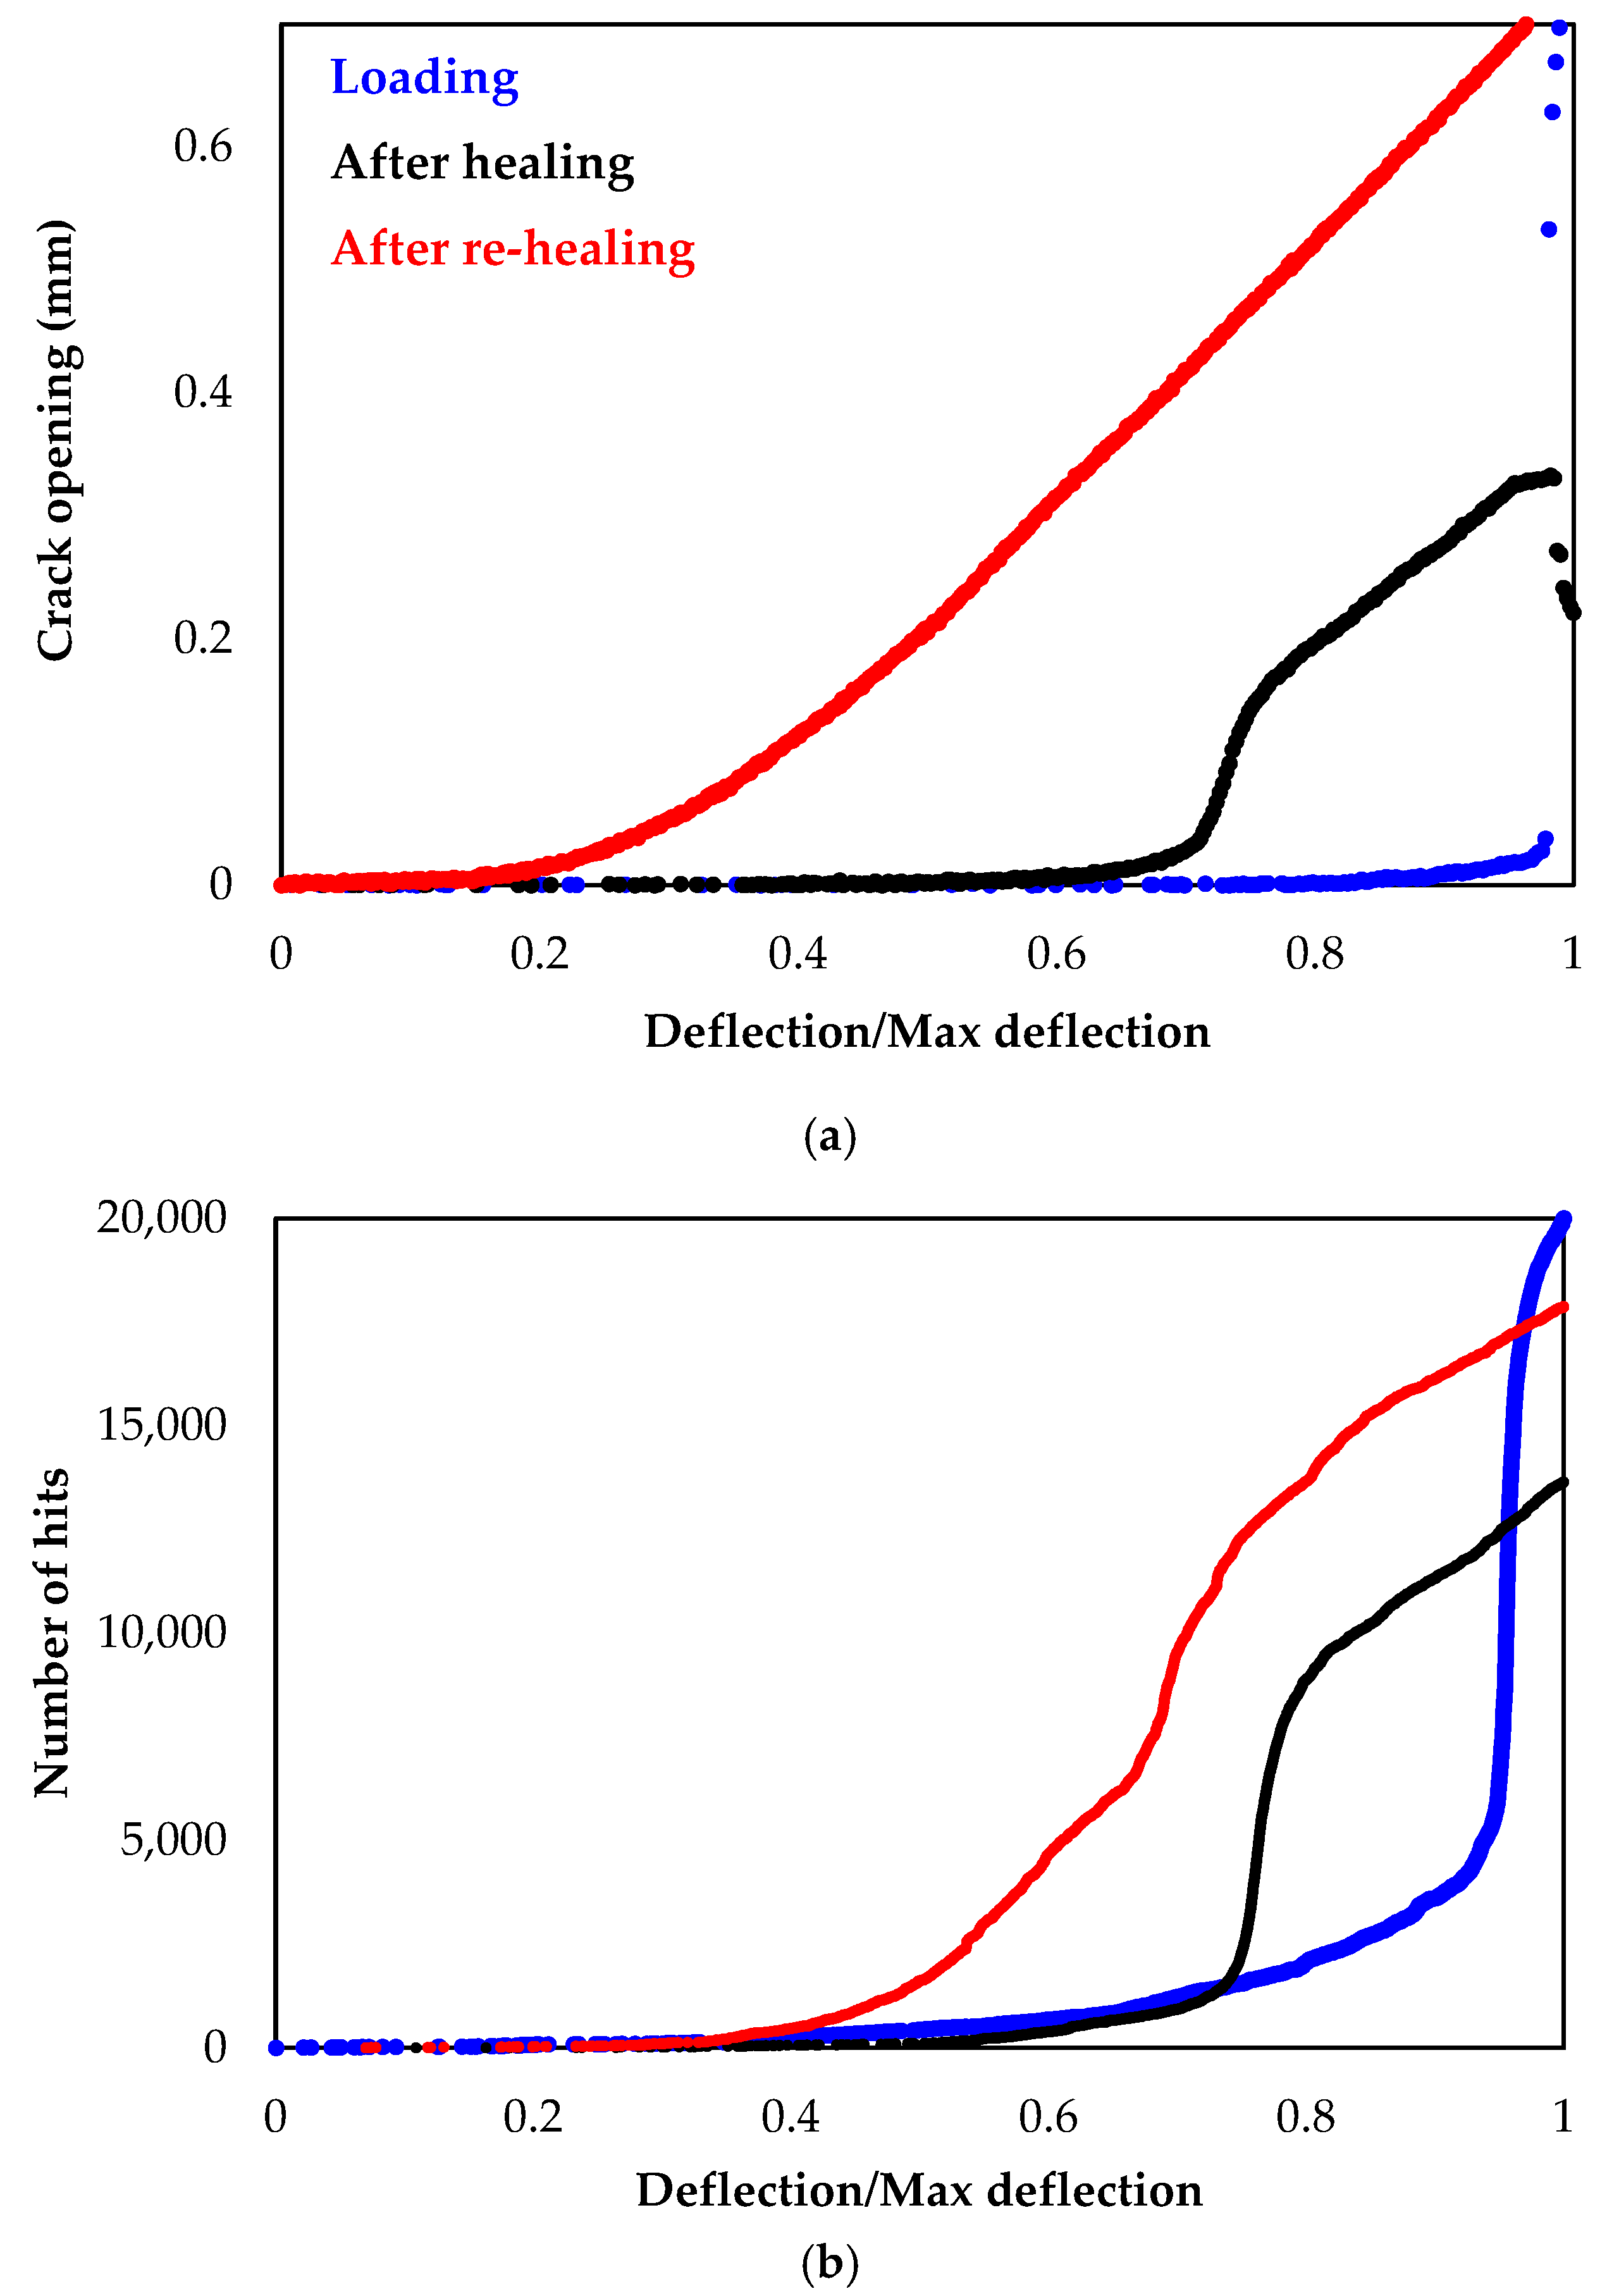
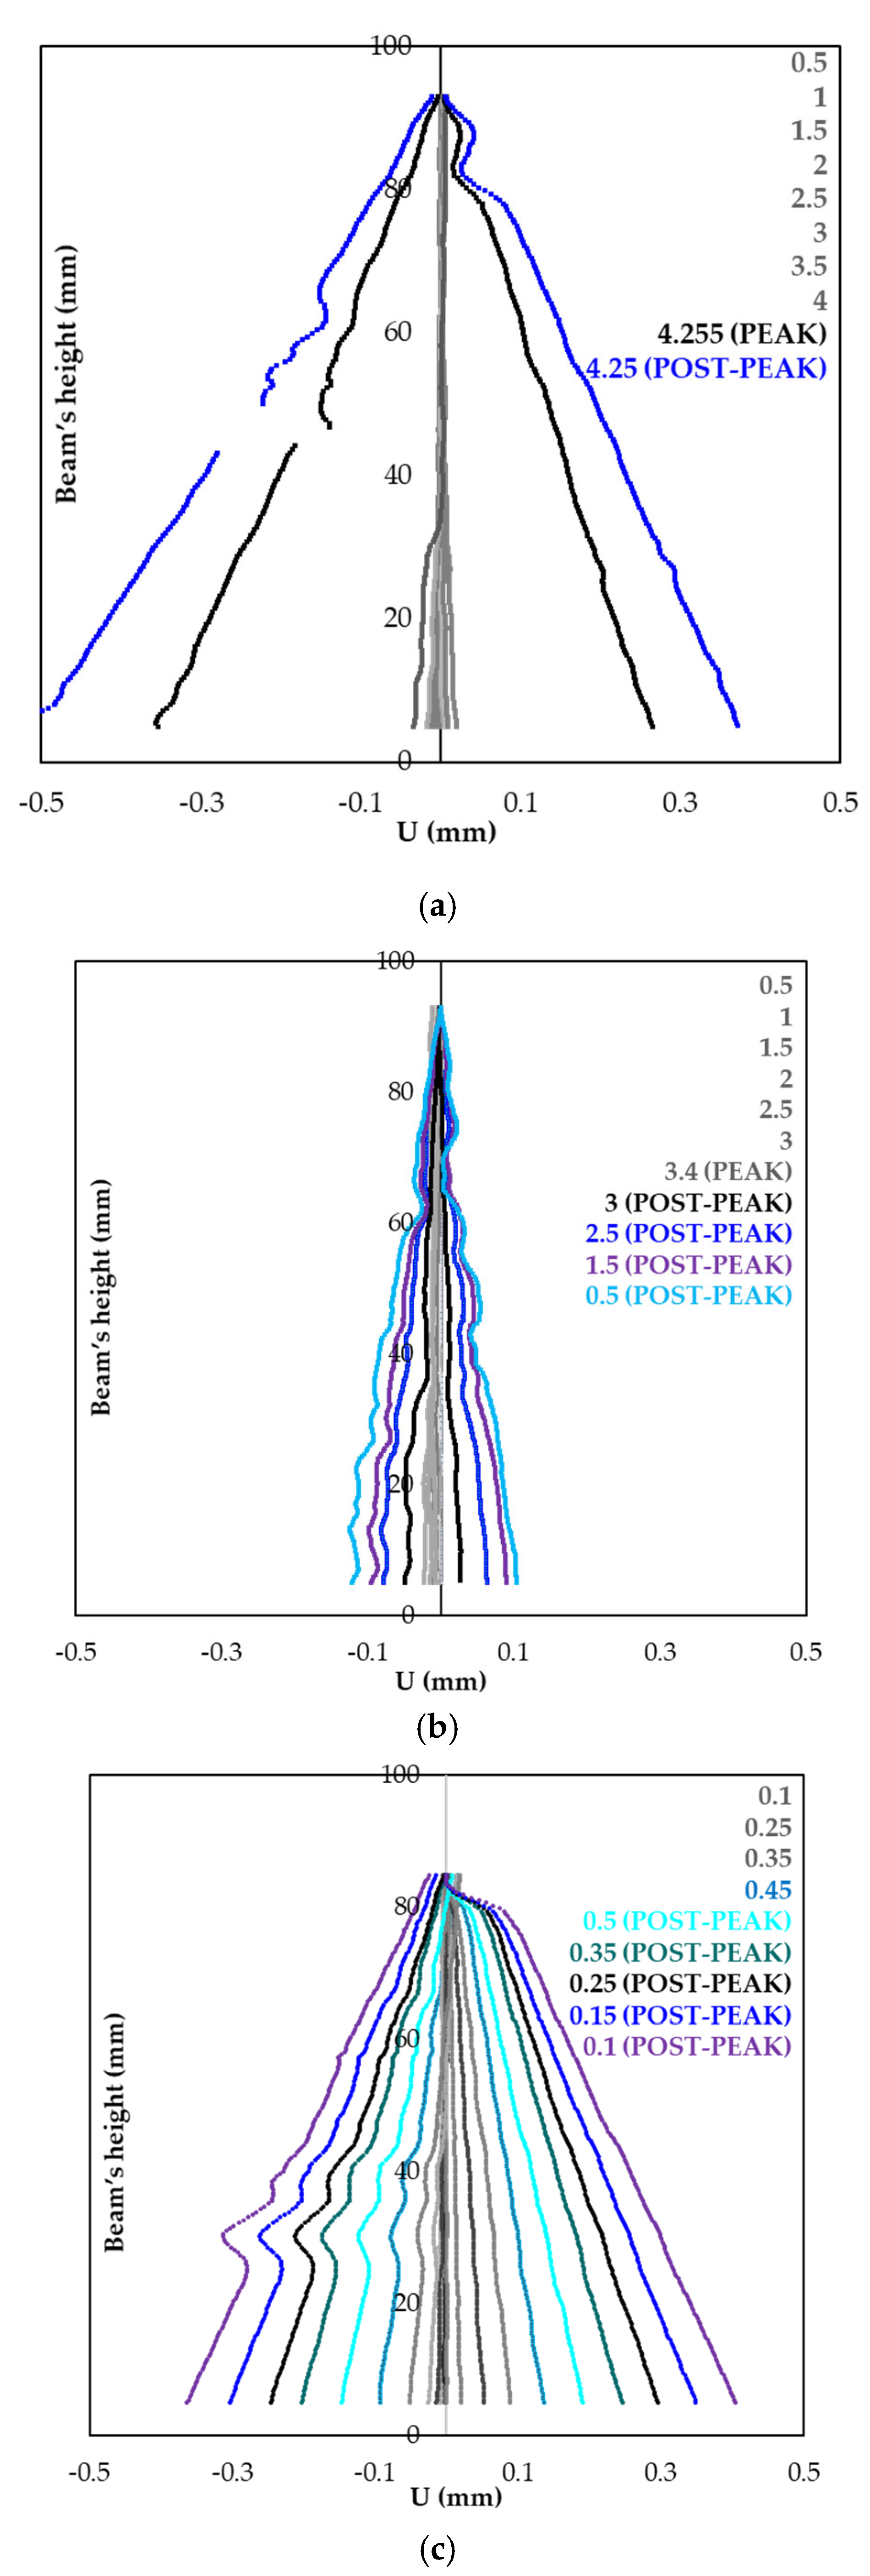
The crack initially forms in a brittle mode and opens instantly (Figure 10a).
-
After healing, the cracked zone is restored and as a result, the crack widening is limited and occurs in a stable mode at the post-softening stage (Figure 10b).
-
After re-healing and since any additional healing agent cannot be delivered, the crack freely re-opens. At the post-softening stage, the crack is up to four times larger compared to the healed state (Figure 10c).

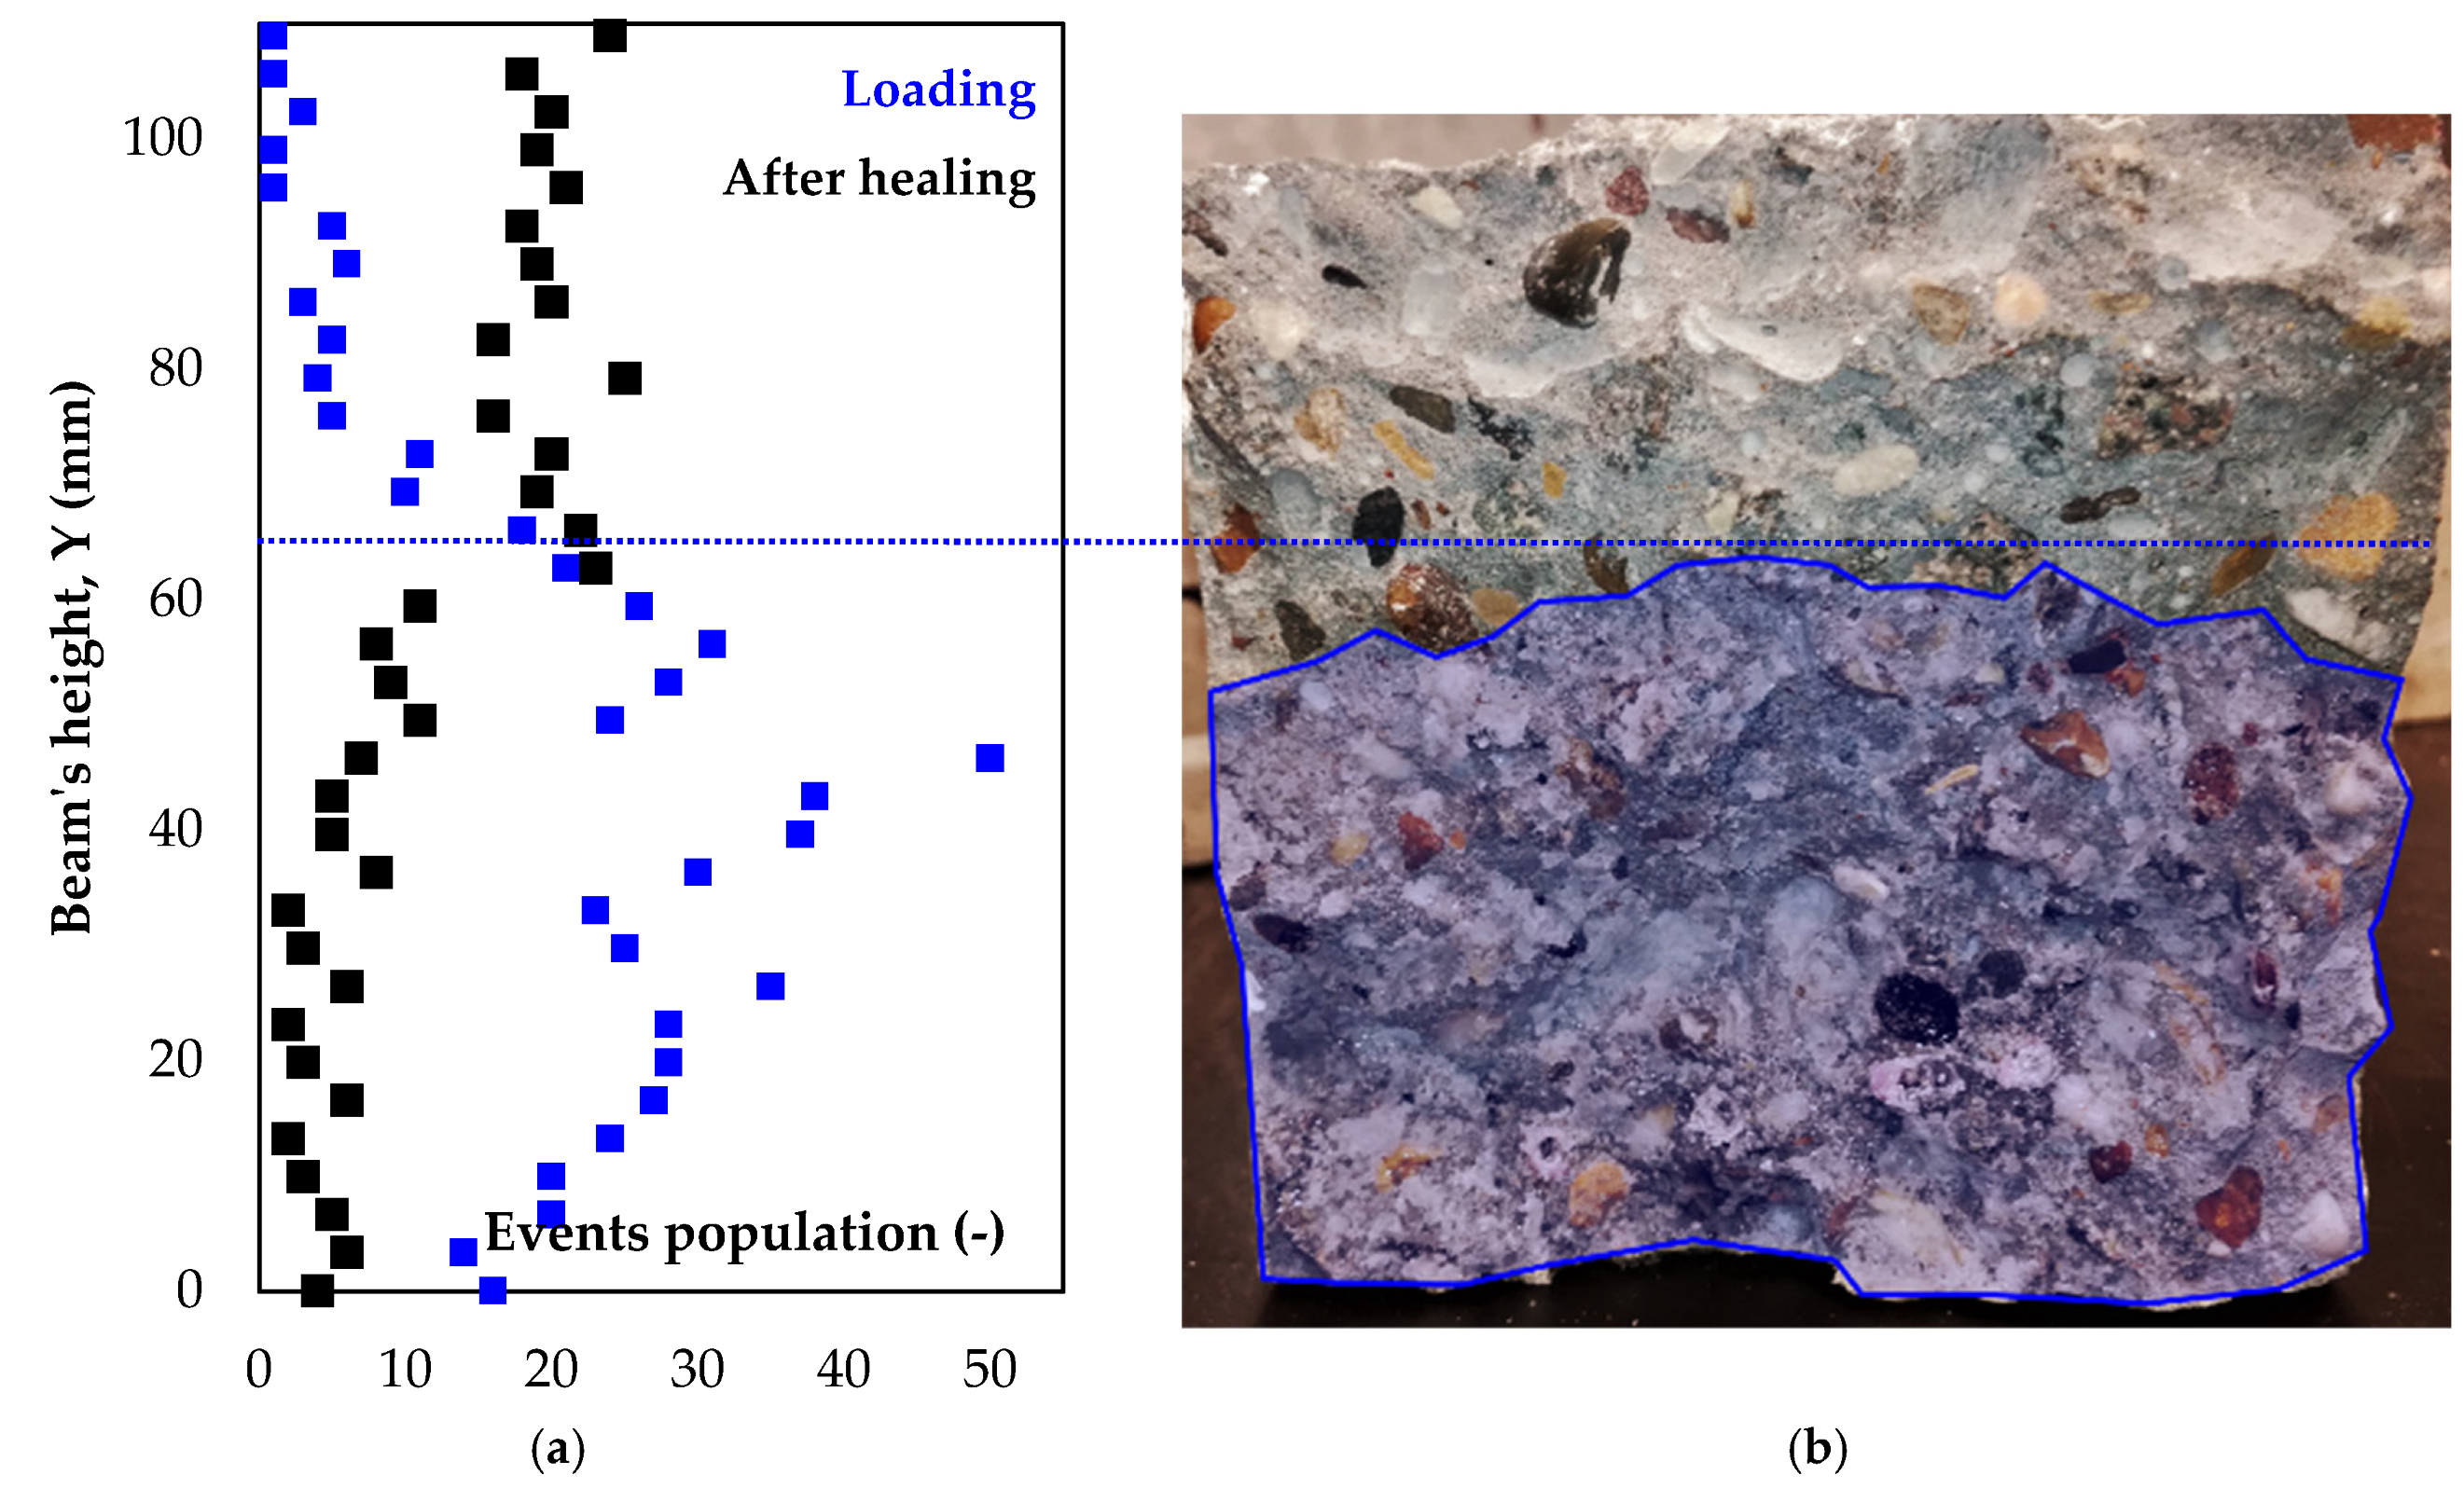
4.4. AE as a Tool to Track Crack Extension after Healing

AE reports on crack onset, formation and re-opening with an accuracy at nanoscale. For this reason, AE has proven to precisely localize the fracture process zone built surrounding the macro-crack [24,25]. In this section, an additional outcome of AE is discussed that can validate effective healing. In Figure 11a, the AE events distribution along the height of the beam are presented for the loading (blue series) and reloading (black series) tests. A marginal zone of 10 mm at the top of the beam was also taken into account to compensate on the AE localization accuracy. A shift in AE events population was observed from the lower to higher crack levels at the reloading cycle. Due to the healing agent’s elastic response to loading, no extra AE activity was developed at the healed section (marked in Figure 11b) as the crack reopened. Only the higher part of the concrete beam, where the agent could not effectively penetrate was further cracked and the AE activity was emitted due to local friction and micro-cracking at the main crack and the surrounding fracture process zone.

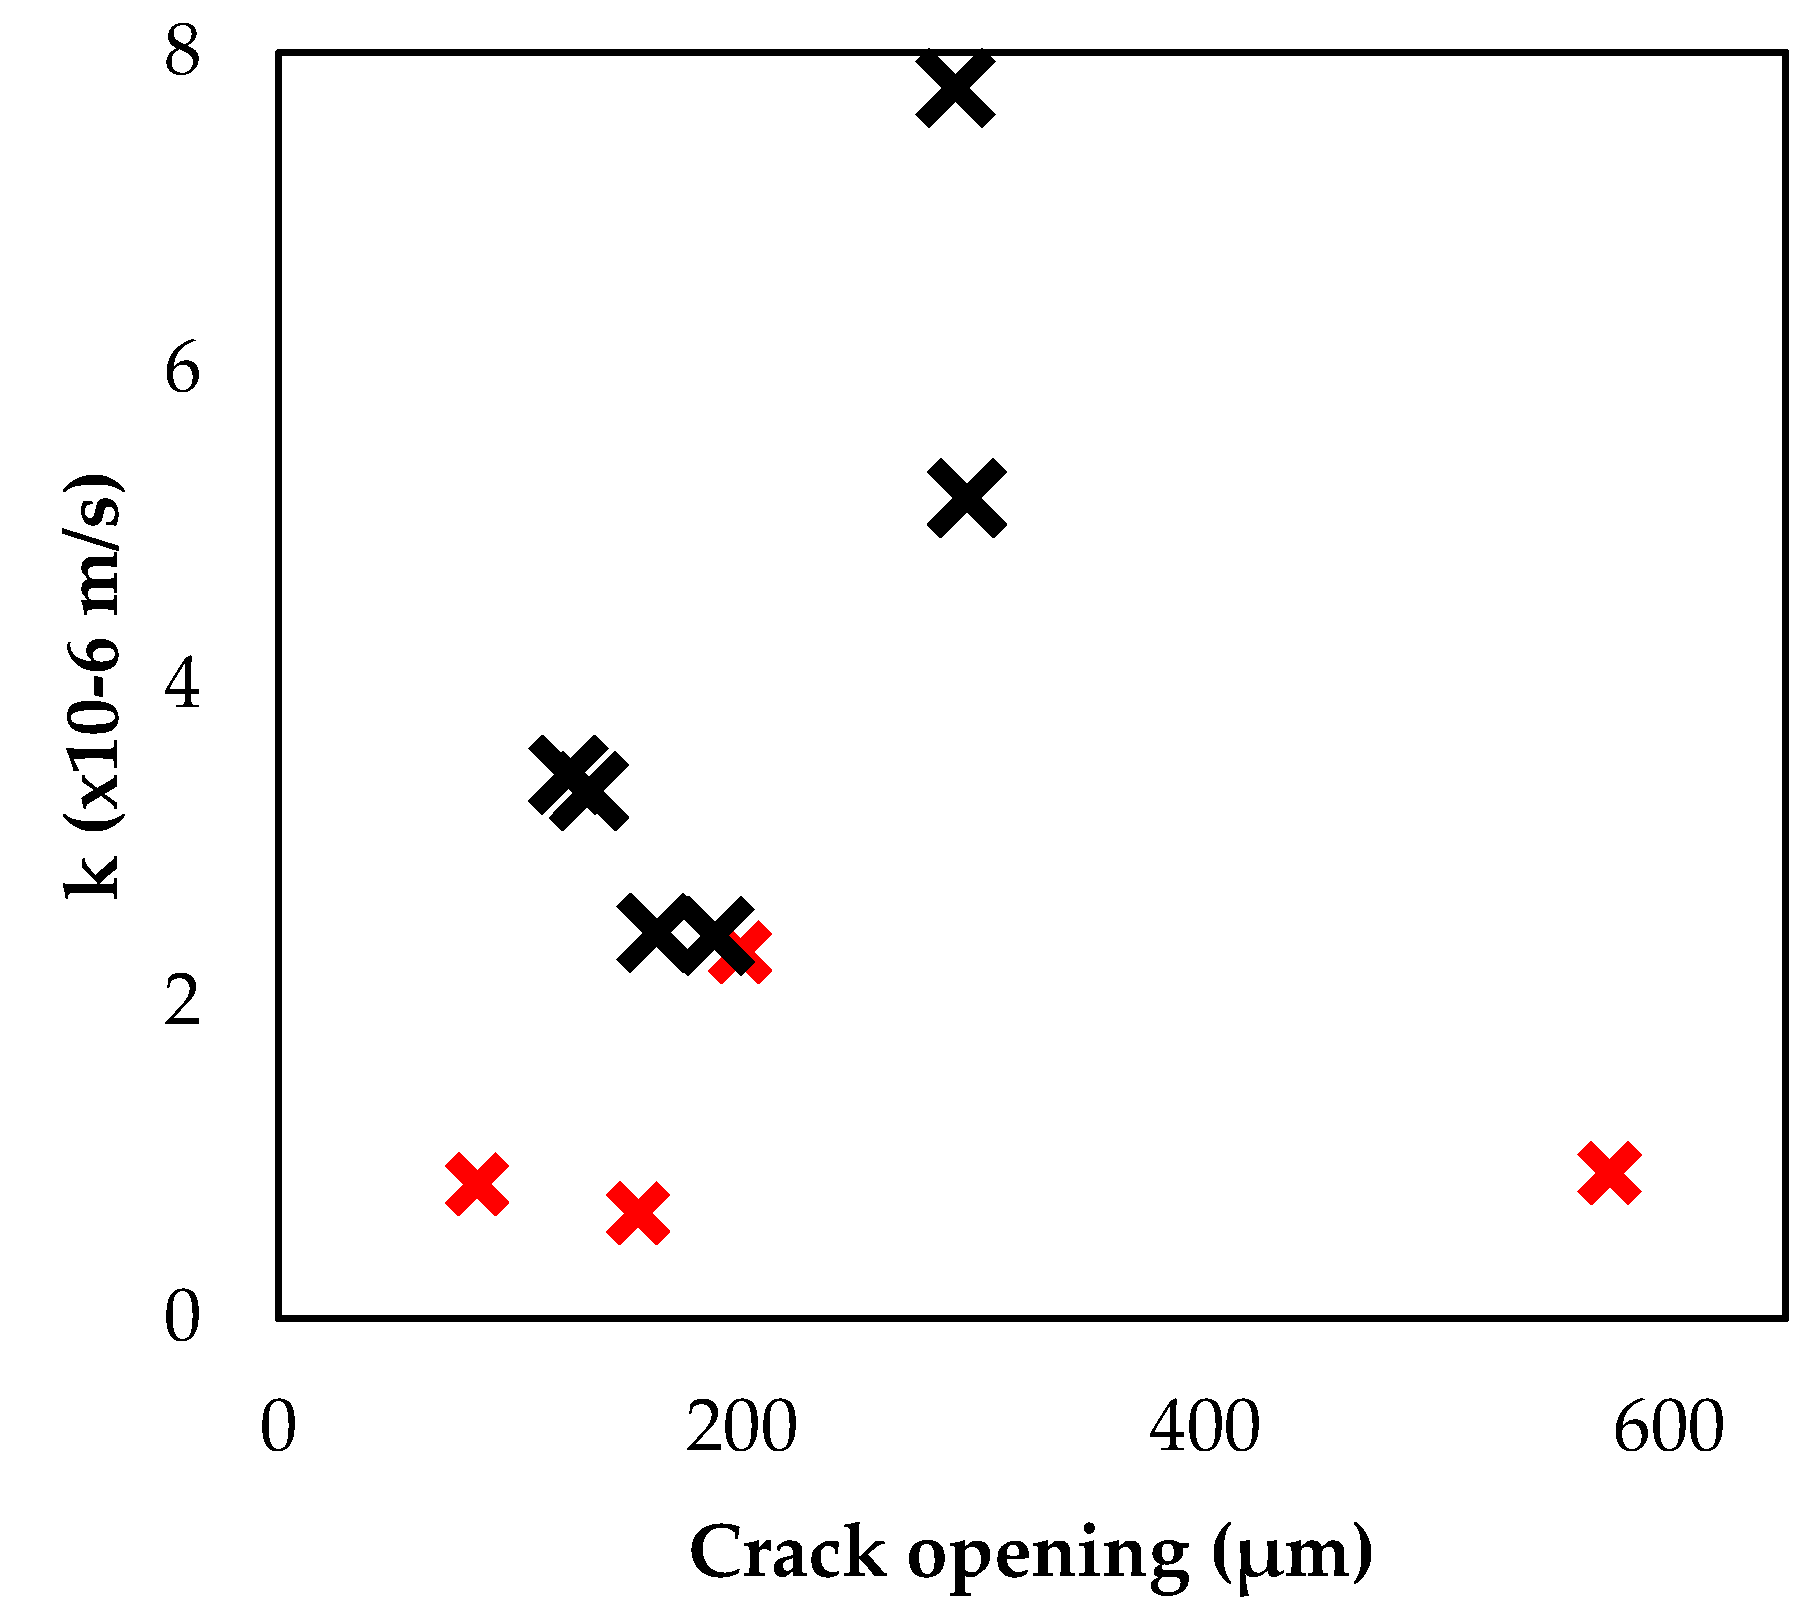
4.5. Effect of Crack Morphology on Healing

The crack shape was modified when healing agent was delivered, filling the crack void. As shown in Figure 12a, a discrete unique crack formed and re-opened in the case of an unhealed beam. On the contrary, a second branch of the initial crack was formed in the case of a healed crack depicted in Figure 12b. The right branch of this crack formed at initial loading, whereas the left formed in the following test cycles after healing. Additionally, another branch of this crack initiated at the bottom of the beam at the end of the reloading cycle (detail view—Figure 12c).
These post-testing pictures illustrate the complex crack-healing relation proving that healing does occur on an ideal plane. In reality, the micro-cracks formed surrounding the principal crack were also interacting with the agent that was transported throughout the fracture process zone. The tortuous and uneven crack plane at the first loading cycle was controlled by the aggregate distribution [26]; however, the role of the healing agent on crack morphology should be investigated at the reloading cycles.
The crack size at different positions along the beam’s height appeared to also control the healing agent delivery. As shown in Figure 13a,b, the agent fully covered a crack with an opening up to 0.2 mm; however, the crack void was filled up by the agent and air bubbles at a lower height across the same crack where the opening was larger than 0.3 mm. This occurred because the large crack void could not be filled with the agent delivered at once, therefore the pressurized air that transports the agent in steps was also entrapped. These air voids can detrimentally affect the agent polymerization into the crack void and trigger premature agent detachment at future loading.

5. Discussion

5.1. Cracking Deviation Due to Reservoirs

Post-testing visual inspection of the crack planes validated the hypothesis that the 3D printed reservoirs crossed the cracked sections of the beam. As illustrated in Figure 14a, the reservoir system was fully de-bonded from the concrete along the crack plane. It is evident that the reservoir material was too stiff and the component was cast in such a large volume that it attracted the cracks and was responsible for the deviation of damage from the middle bending zone to the edges of the beam. Additionally, the cracking at the reservoirs instead of the middle section appeared to lower the ultimate load reached. The ultimate load measured for beams with a crack at the middle was about 4.71± 0.32 kN, whereas the load dropped to 3.94 ± 0.77 kN. The reservoir design should be revised in future work and the possibility to replace the PET skeleton with a flexible, smaller in size component should be explored. It was shown that the flexible tube did not impact the crack formation and effectively delivered the healing agent.

5.2. Casting Irregularities Due to Vascular Network

Another issue detected at post-testing visual inspection of the cracked section was the formation of large air voids underneath the tubes during casting. As shown in Figure 14b,c, this phenomenon was observed for both ceramic and 3D printed tubes. It is concluded that the position of the vascular network should be adjusted to higher levels in order to ensure that the aggregates can freely move and settle below. Additionally, the beam’s vibration can be of a higher magnitude to eliminate these casting irregularities.

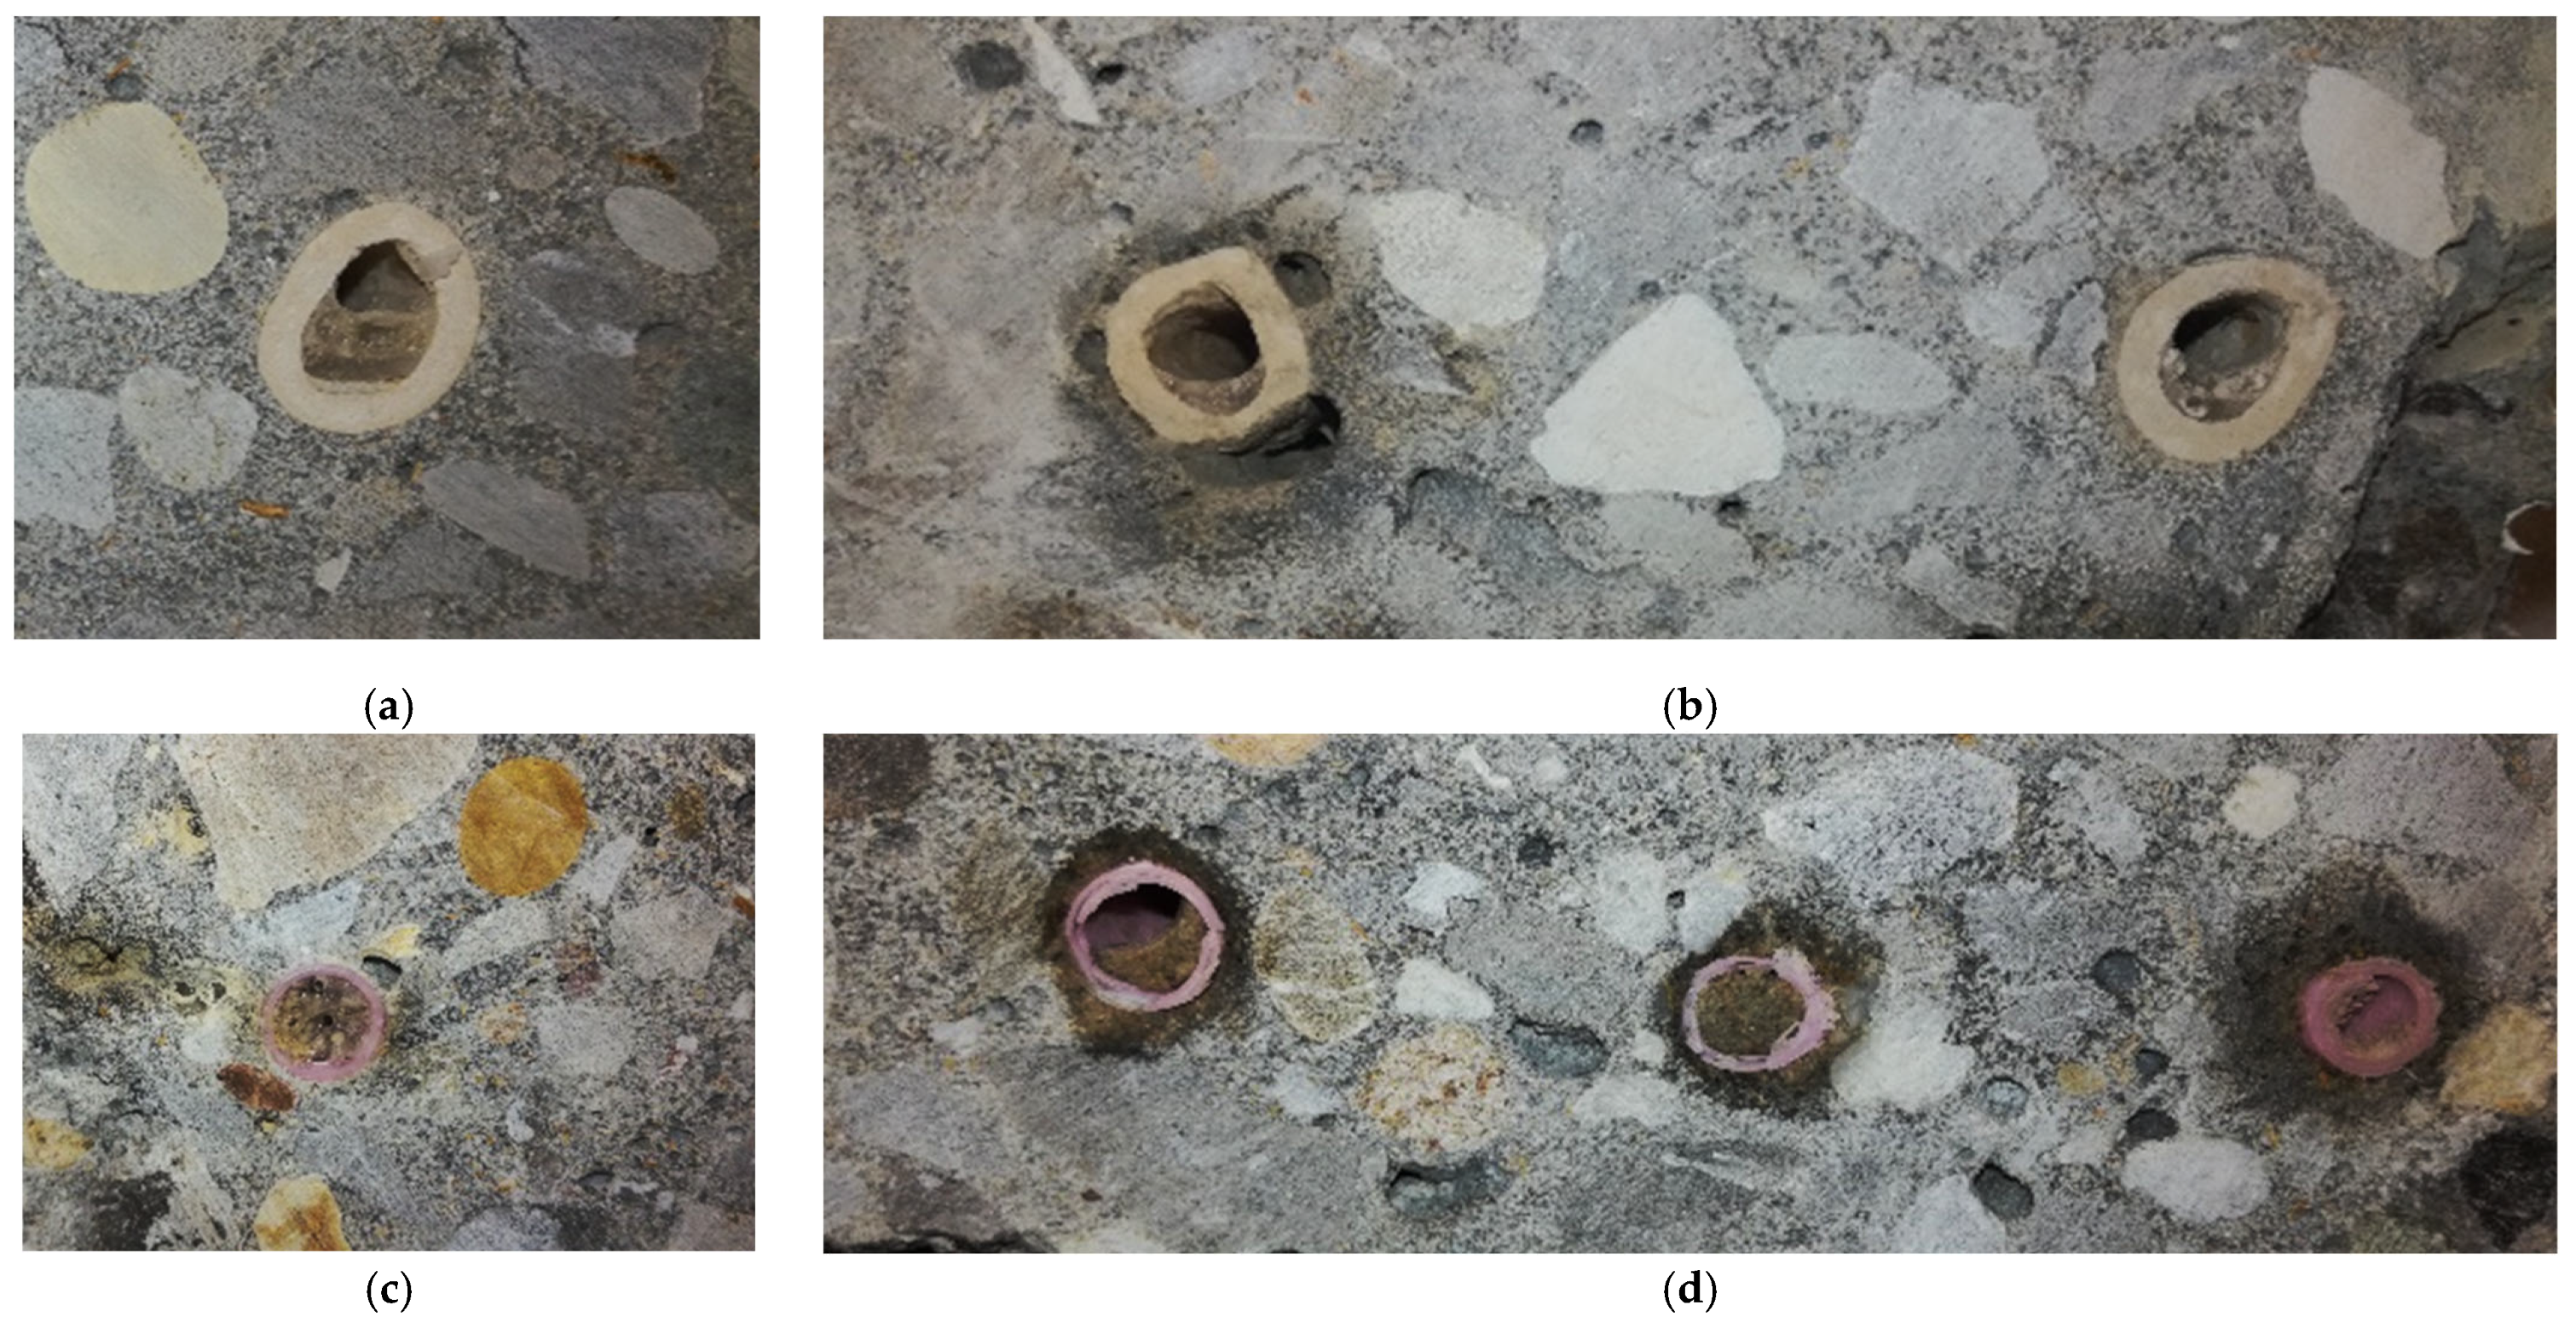
5.3. Tubes’ Thrombosis and Cleansing after Healing

The unsuccessful repeatable healing can be attributed to extensive clogging of the vascular network tubes as illustrated in Figure 15. Post-testing visual inspection proved that up to 50% of the cross-section of the ceramic tubes was filled up with healing agent that polymerized into the vascular network (Figure 15a,b). Although a high pressure (up to 6 bar) was applied during the tubes’ cleansing to omit this phenomenon, the agent’s viscosity was too high for the experimental needs and the agent was entrapped into the printing folds. The phenomenon was severe for the 3D printed tubes, where some sections were 100% clogged. Based on Figure 15c,d, it is hypothesized that the 3D printed vascular networks were either too thin, and therefore permeable, or otherwise and due to a thin section, the tubes were suspected to have easily broken during the concrete casting since the tubes appeared filled with cement paste as well. These remarks should be taken into account in the future design modifications and while the tubes should be sufficiently brittle to fracture along with the concrete during a damage event, they must also have a high enough strength to survive the casting process.

6. Conclusions

The performance of a novel vascular network healing system is evaluated in this study by performing cyclic loading on concrete beams and monitoring the cracks response by advanced non-destructive testing techniques. Among the different healing configurations, the 3D printed polymer network with flexible inlet/outlet tubes achieves effective sealing and the greatest mechanical recovery of the crack after a healing intervention. As an extension to previous work and considering the remarks and herein experimental evidence, this novel, additively manufactured healing network can be implemented in the future when designing large-scale concrete elements configured for repeatable healing.
The main findings with respect to the healing design are summarized below:
-
The detrimental impact of embedded bulk agent reservoirs is reported since under bending the cracks deviate from the middle bending zone towards the reservoir sections and failure occurs at the concrete-reservoir interface. The incompatibility of concrete with a stiff polymer reservoir suggests that alternative agent delivery systems should be explored. The use of a thin flexible plastic inlet/outlet tube system proved its efficacy and it is recommended for future designs. The position of the connection tubes into the beam and relative to the vascular networks should be also revised.
-
The 3D printed polymer network appears equally effective compared to the conventional ceramic tubes since in both cases the tubes break instantly upon cracking and the subsequently healing agent is effectively released and distributed into the cracks.
-
The healing agent viscosity should be modified (reaching lower viscosity) since the tubes are only partially cleaned by pressurized air after the healing intervention. Future work should explore the tightness of the 3D printed vascular networks as it is observed that cement paste can penetrate through the tubes during concrete casting. Clogging phenomena should be eliminated in the future by printing polymers with a higher thickness.
-
Repeatable healing could not be reached due to the tubes’ internal clogging and to re-opening of the same crack or of a crack in its vicinity at the reloading cycles. The complex fracture process and dense cracks network should be taken into account in future works in order to design a network that performs optimally under concrete service loads.
-
Effective crack healing is described by a combination of two fracture phenomena: (1) the healed crack section elastically deforms under load, building great strength and toughness recovery; and (2) as the crack forms, the fracture gradually propagates along the crack contributing to great post-softening.
The main observations and updates regarding the well-established inspection methodology are:
-
AE and DIC complementarily contribute to the online monitoring of crack formation and reopening after healing. The use of DIC for a precise crack opening analysis appears crucial for the accurate assessment of healing efficacy. The AE hits distribution indicates the transition of damage from brittle to pseudo-ductile for a healed crack. The AE localization analysis can identify the active cracking zones even after healing. In an upcoming study dedicated to the AE as a tool for damage and healing identification, both the damage mode shift and the post-healing crack kinetics will be associated to the AE wave features’ trends and variations during testing.
-
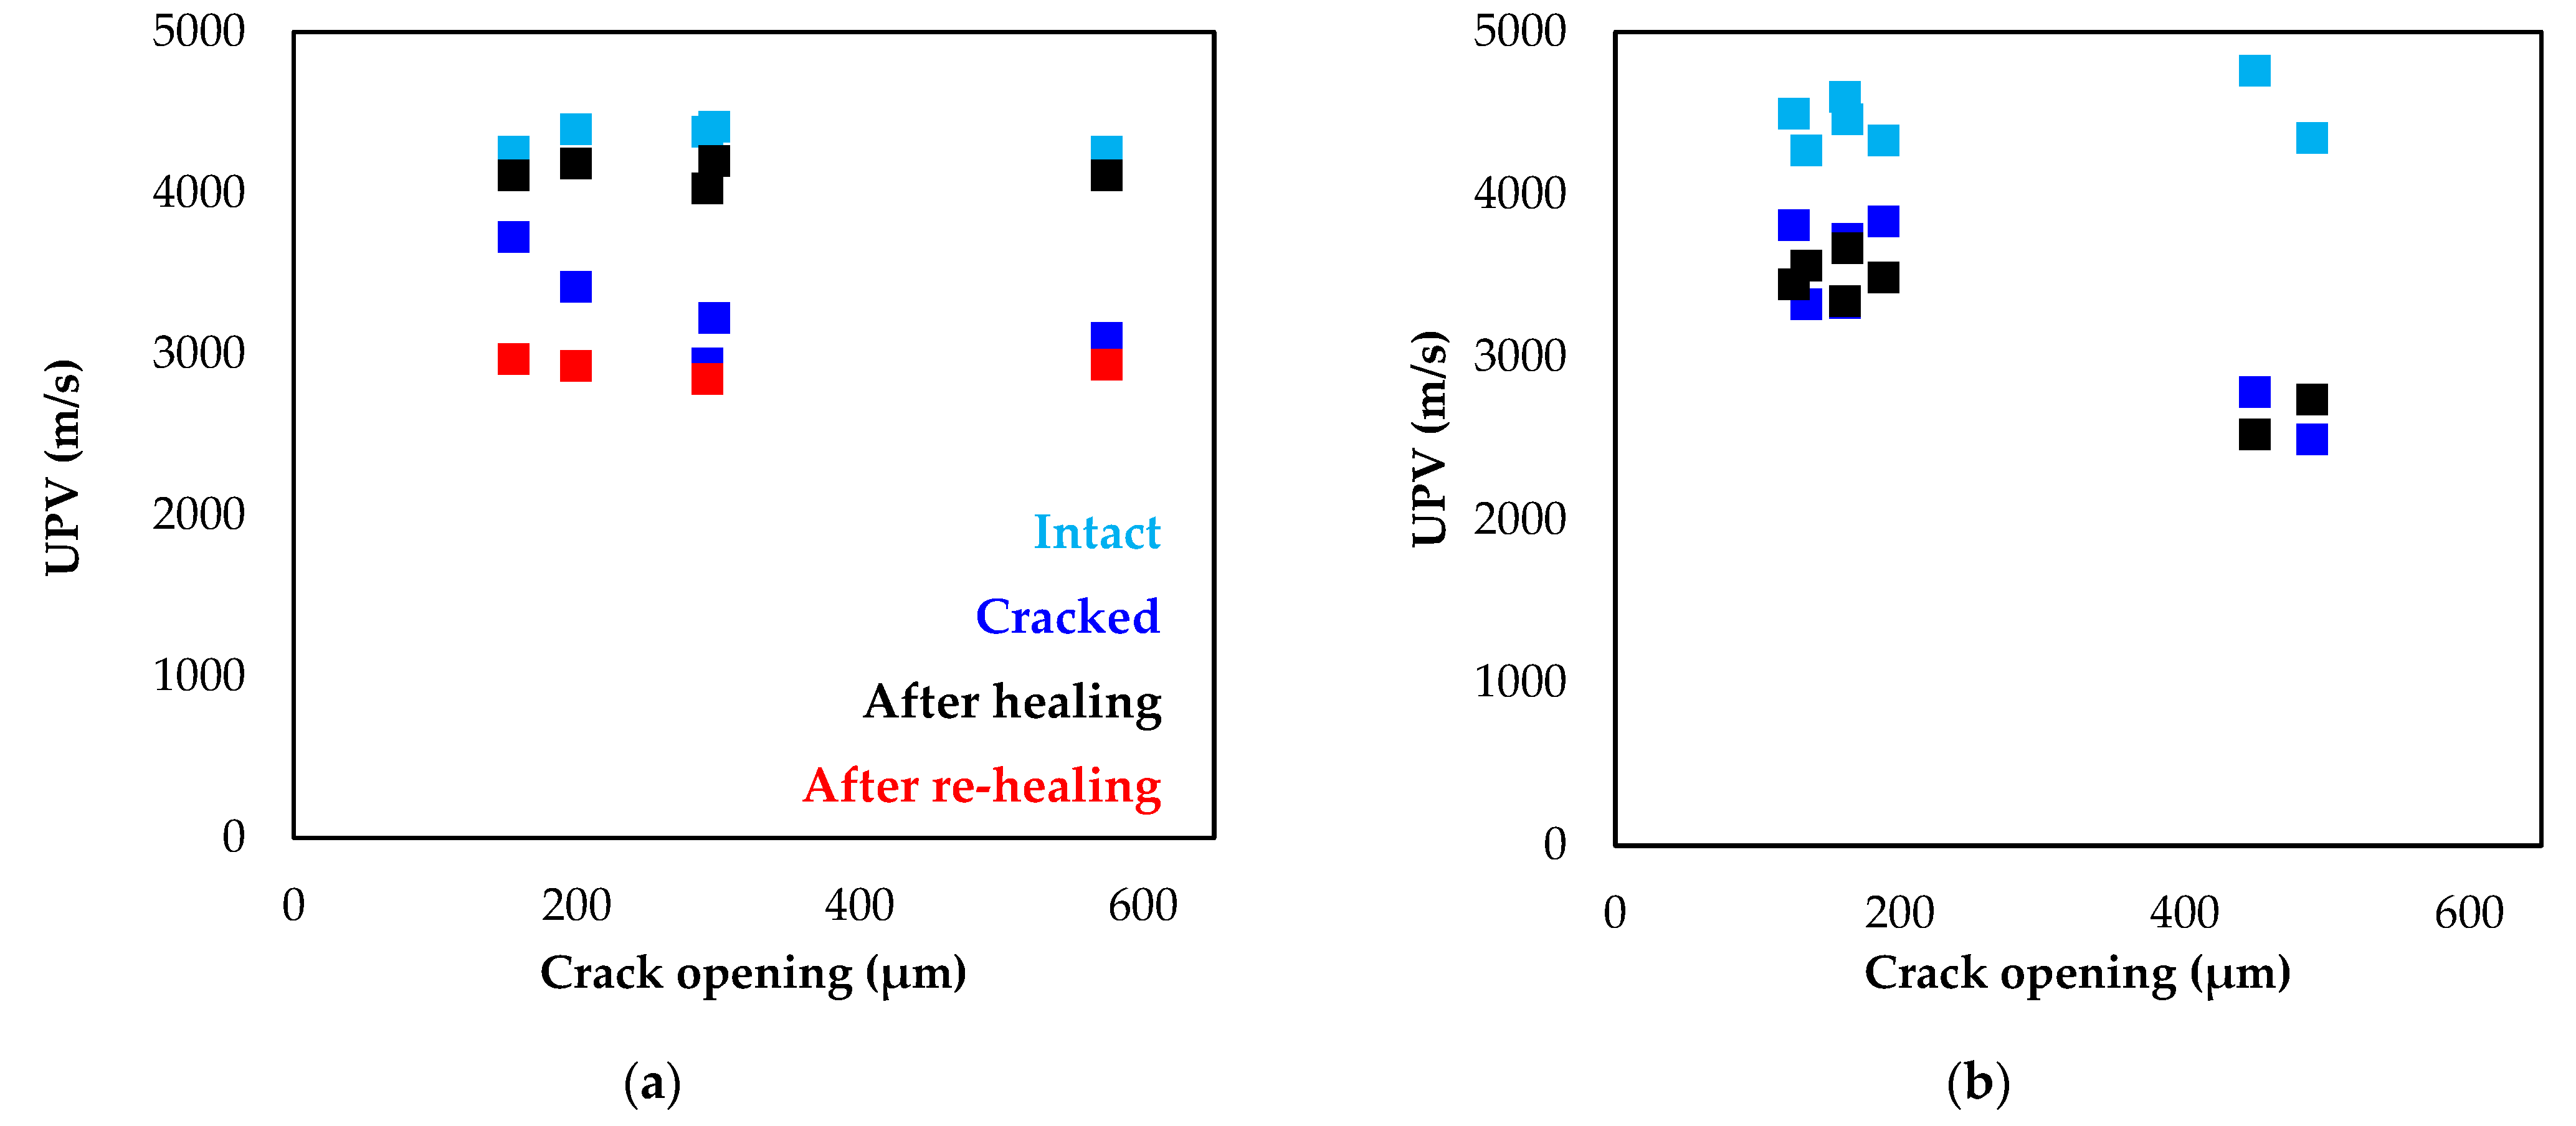
UPV inspection before and after cracking and healing intervention provides direct information on the damage state of the concrete and can pinpoint the crack recovery cases.
-
Optical microscopy after each test cycle effectively detects the crack filling by agent and visual inspection at post-testing reports on the tubes clogging, cleansing issues and failures of the network.
In the next steps of this research, the focus will be placed on improving the 3D printed network tightness, modifying the agent viscosity to ensure effective cleansing and replacing the reservoirs with a less stiff and potentially flexible component that does not affect the concrete’s response to fracture.

Author Contributions

Conceptualization, Y.S. and E.T.; methodology, E.T., Y.S. and C.V.L.; validation, D.G.A., K.V.T. and N.D.B.; investigation, C.V.L., Y.S. and E.T.; data curation, C.V.L. and E.T.; writing—original draft preparation, E.T. and C.V.L.; writing—review and editing, D.G.A., Y.S., K.V.T. and N.D.B. All authors have read and agreed to the published version of the manuscript.

Funding

Financial support of FWO (Fonds Wetenschappelijk Onderzoek-Vlaanderen, 12J7720N (of Tsangouri Eleni)) is gratefully acknowledged. Yasmina Shields acknowledges funding from the European Union’s Horizon 2020 research and innovation program under the Marie Sklodowska-Curie grant agreement no. 86006.
Applsci 12 04821 i001

Institutional Review Board Statement

Not applicable.

Informed Consent Statement

Data available on request from the authors.

Data Availability Statement

Not applicable.

Conflicts of Interest

The authors declare no conflict of interest.

References

  1. Tsangouri, E. A decade of research on self-healing concrete. In Sustainable Construction and Building Materials; IntechOpen: London, UK, 2018; pp. 21–36. [Google Scholar]
  2. Davies, R.; Teall, O.; Pilegis, M.; Kanellopoulos, A.; Sharma, T.; Jefferson, A.; Gardner, D.; Al-Tabbaa, A.; Paine, K.; Lark, R. Large scale application of self-healing concrete: Design, construction, and testing. Front. Mater. 2018, 2018, 51. [Google Scholar] [CrossRef] [Green Version]
  3. Papaioannou, S.; Amenta, M.; Kilikoglou, V.; Gournis, D.; Karatasios, I. Synthesis and integration of cement-based capsules modified with sodium silicate for developing self-healing cements. Constr. Build. Mater. 2022, 316, 125803. [Google Scholar] [CrossRef]
  4. Shields, Y.; De Belie, N.; Jefferson, A.; Van Tittelboom, K. A review of vascular networks for self-healing applications. Smart Mater. Struct. 2021, 30, 063001. [Google Scholar] [CrossRef]
  5. Tsangouri, E.; Lelon, J.; Minnebo, P.; Shiotani, T.; Van Tittelboom, K.; De Belie, N.; Aggelis, D.G.; Van Hemelrijck, D. Feasibility study on real-scale, self-healing concrete slab by developing a smart capsules network and assessed by a plethora of advanced monitoring techniques. Constr. Build. Mater. 2019, 228, 116780. [Google Scholar] [CrossRef]
  6. Minnebo, P.; Thierens, G.; De Valck, G.; Van Tittelboom, K.; De Belie, N.; Van Hemelrijck, D.; Tsangouri, E. A novel design of autonomously healed concrete: Towards a vascular healing network. Materials 2017, 10, 49. [Google Scholar] [CrossRef] [PubMed]
  7. Dry, C. Matrix cracking repair and filling using active and passive modes for smart timed release of chemicals from fibers into cement matrices. Smart Mater. Struct. 1994, 32, 118. [Google Scholar] [CrossRef]
  8. Van Tittelboom, K.; Tsangouri, E.; Van Hemelrijck, D.; De Belie, N. The efficiency of self-healing concrete using alternative manufacturing procedures and more realistic crack patterns. Cem. Concr. Compos. 2015, 57, 142–152. [Google Scholar] [CrossRef]
  9. Huang, H.; Ye, G.; Shui, Z. Feasibility of self-healing in cementitious materials–By using capsules or a vascular system? Constr. Build. Mater. 2014, 63, 108–118. [Google Scholar] [CrossRef]
  10. Hossain, M.; Sultana, R.; Patwary, M.; Khunga, N.; Sharma, P.; Shaker, S.J. Self-healing concrete for sustainable buildings. A review. Environ. Chem. Lett. 2022, 20, 1265–1273. [Google Scholar] [CrossRef]
  11. Shields, Y.; Van Mullem, T.; De Belie, N.; Van Tittelboom, K. An Investigation of Suitable Healing Agents for Vascular-Based Self-Healing in Cementitious Materials. Sustainability 2021, 13, 12948. [Google Scholar] [CrossRef]
  12. Li, Z.; de Souza, L.R.; Litina, C.; Markaki, A.E.; Al-Tabbaa, A. A novel biomimetic design of a 3D vascular structure for self-healing in cementitious materials using Murray’s law. Mater. Des. 2020, 190, 108572. [Google Scholar] [CrossRef]
  13. Selvarajoo, T.; Davies, R.E.; Freeman, B.L.; Jefferson, A.D. Mechanical response of a vascular self-healing cementitious material system under varying loading conditions. Constr. Build. Mater. 2020, 254, 119245. [Google Scholar] [CrossRef]
  14. Selvarajoo, T.; Davies, R.E.; Gardner, D.R.; Freeman, B.L.; Jefferson, A.D. Characterisation of a vascular self-healing cementitious material system: Flow and curing properties. Constr. Build. Mater. 2020, 245, 118332. [Google Scholar] [CrossRef]
  15. Jefferson, A.; Selvarajoo, T.; Freeman, B.; Davies, R. An experimental and numerical study on vascular self-healing cementitious materials. In Proceedings of the Concrete Solutions- 7th International Conference on Concrete Repair, Cluj, Romania, 30 September–2 October 2019. [Google Scholar]
  16. De Nardi, C.; Gardner, D.; Jefferson, A.J. Development of 3D printed networks in self-healing concrete. Materials 2020, 13, 1328. [Google Scholar] [CrossRef] [PubMed] [Green Version]
  17. Kanellopoulos, A. Self-Healing Construction Materials: Fundamentals, Monitoring and Large-Scale Applications; Springer Nature: Berlin, Germany, 2022. [Google Scholar]
  18. De Belie, N.; Gruyaert, E.; Al-Tabbaa, A.; Antonaci, P.; Baera, C.; Bajare, D.; Darquennes, A.; Davies, R.; Ferrara, L.; Jefferson, T.; et al. A review of self-healing concrete for damage management of structures. Adv. Mater. Interfaces 2018, 5, 1800074. [Google Scholar] [CrossRef]
  19. Tsangouri, E.; Karaiskos, G.; Deramaeker, A.; Van Hemelrijck, D.; Aggelis, D.G. Assessment of acoustic emission localization accuracy on damaged and healed concrete. Constr. Build. Mater. 2016, 129, 163–171. [Google Scholar] [CrossRef] [Green Version]
  20. Hsu, N.N. Acoustic Emissions Simulator. U.S. Patent 4018084 A, 19 April 1977. [Google Scholar]
  21. Hou, S.; Li, K.; Wu, Z.; Li, F.; Shi, C. Quantitative evaluation on self-healing capacity of cracked concrete by water permeability test–A review. Cem. Concr. Compos. 2022, 127, 104404. [Google Scholar] [CrossRef]
  22. Wang, J.; Mignon, A.; Trenson, G.; Van Vlierberghe, S.; Boon, N.; De Belie, N. A chitosan-based pH-responsive hydrogel for encapsulation of bacteria for self-sealing concrete. Cem. Concr. Compos. 2018, 93, 309–322. [Google Scholar] [CrossRef]
  23. Van Mullem, T.; Gruyaert, E.; Debbaut, B.; Caspeele, R.; De Belie, N. Novel active crack width control technique to reduce the variation on water permeability results for self-healing concrete. Constr. Build. Mater. 2019, 203, 541–551. [Google Scholar] [CrossRef]
  24. Zhang, F.; Pahlavan, L.; Yang, Y. Evaluation of acoustic emission source localization accuracy in concrete structures. Struct. Health Monit. 2020, 19, 2063–2074. [Google Scholar] [CrossRef]
  25. Carpinteri, A.; Lacidogna, G.; Niccolini, G. Critical behaviour in concrete structures and damage localization by acoustic emission. Key Eng. Mater. 2006, 312, 305–310. [Google Scholar] [CrossRef]
  26. Zhang, X.; Qian, C. Effects of the crack geometric features on the probability density of spherical healing agent particles in concrete. Constr. Build. Mater. 2021, 301, 124083. [Google Scholar] [CrossRef]
Figure 1. Reservoir-vascular network details: (a) pair of ceramic tubes mounted on 3D printed reservoirs; (b) 3D printed PLA tubes mounted on 3D printed reservoirs; (c) 3D printed PLA tubes mounted on flexible inlet/outlet tubes; (d) detail view of the 3D printed reservoir; (e) the networks embedded into the concrete mold during casting.
Applsci 12 04821 g001
Figure 2. Testing setup with AE sensors 1-8 marked in red.
Applsci 12 04821 g002
Figure 3. The water permeability test setup: (a) before and (b) during testing.
Applsci 12 04821 g003
Figure 4. Testing procedure.
Applsci 12 04821 g004
Figure 5. Load-crack opening curves and strain maps at ultimate force for: (a) healed (Beam 4); (b) partially healed (Beam 11); and (c) unhealed beam (Beam 9).
Applsci 12 04821 g005
Figure 6. Ultimate force, toughness and compliance recovery for the healed (Beam 4), the partially healed (Beam 11) and the unhealed beam (Beam 9). The load-crack opening curves of these samples are reported in Figure 5.
Applsci 12 04821 g006
Figure 7. UPV measurements for (a) partially and fully healed (B2–B4 and B11–B12) and (b) unhealed beams (B7–B10 and B13–B15). The UPV is not measured at the re-healing phase for the unhealed series.
Applsci 12 04821 g007
Figure 8. Water permeability coefficient, k as measured on healed (red series, with flexible PVC inlet/outlet tubes, B2–B5) and unhealed (black series, with 3D printed PET reservoirs, B8–B13) beams.
Applsci 12 04821 g008
Figure 9. Beam 4: (a) crack opening as extracted by DIC horizontal displacement and (b) number of AE hits for the case of the healed beam.
Applsci 12 04821 g009
Figure 10. Beam 4: (a) crack profile at loading; (b) reloading after healing; (c) reloading after re-healing.
Applsci 12 04821 g010
Figure 11. (a) AE events distribution along the beam’s height (Beam 4); (b) detail of the crack plane with the area covered by healing agent marked in blue.
Applsci 12 04821 g011
Figure 12. (a) crack of an unhealed beam (B9); (b) crack of a healed beam (B4); (c) detail view of crack branches after healing (B3).
Applsci 12 04821 g012
Figure 13. (a) fully filled with healing agent (B3); (b) air bubbles entrapped into a large crack (B2).
Applsci 12 04821 g013
Figure 14. (a) reservoir de-bonded from the concrete at the crack plane (B14); (b,c) air voids underneath a ceramic (B12) and 3D printed polymer tube (B7), respectively.
Applsci 12 04821 g014
Figure 15. (a,b) clogged ceramic (B11–B15) and (c,d) 3D printed polymer tubes (B1–B10).
Applsci 12 04821 g015
Table 1. Healing agent properties and concrete composition.
Polyurethane (PU) Healing AgentConcrete
Polymerization TriggerMoistureComponentWeight (kg/m3)
Curing time (20 °C)1–5 minCEM I 52.5 N300
Density (20 °C)1.12 g/cm3Sand 0/4670
Viscosity (20 °C)4200 mPa·sAggregate 2/8490
Shelf life6 monthsAggregate 8/16790
Cost14 EUR/ltWater150
Table 2. Healing configuration per beam.
BeamHealing NetworkSupply System
1 to 53D printed PLA tubesFlexible PVC inlet/outlet tubes
6 to 103D printed PLA tubes3D printed PET reservoirs
11 to 15Ceramic tubes3D printed PET reservoirs
Table 3. AE sensors position.
BeamX (mm)Y (mm)Z (mm)
1150050
2700050
3200500
4650500
525010050
660010050
705075
88505075
Publisher’s Note: MDPI stays neutral with regard to jurisdictional claims in published maps and institutional affiliations.

