
A Study on Correggio Wall Paintings: Characterization of Technique and Materials of Abbey Church of S. Giovanni Evangelista in Parma, Italy


Abstract
:Featured Application
Abstract
1. Introduction
2. Experimental
2.1. Samples
2.2. Instruments and Methods
2.2.1. Optical Microscopy
2.2.2. Scanning Electron Microscopy Coupled with Energy-Dispersive X-ray Spectroscopy (SEM-EDS)
2.2.3. Micro-Raman Spectroscopy
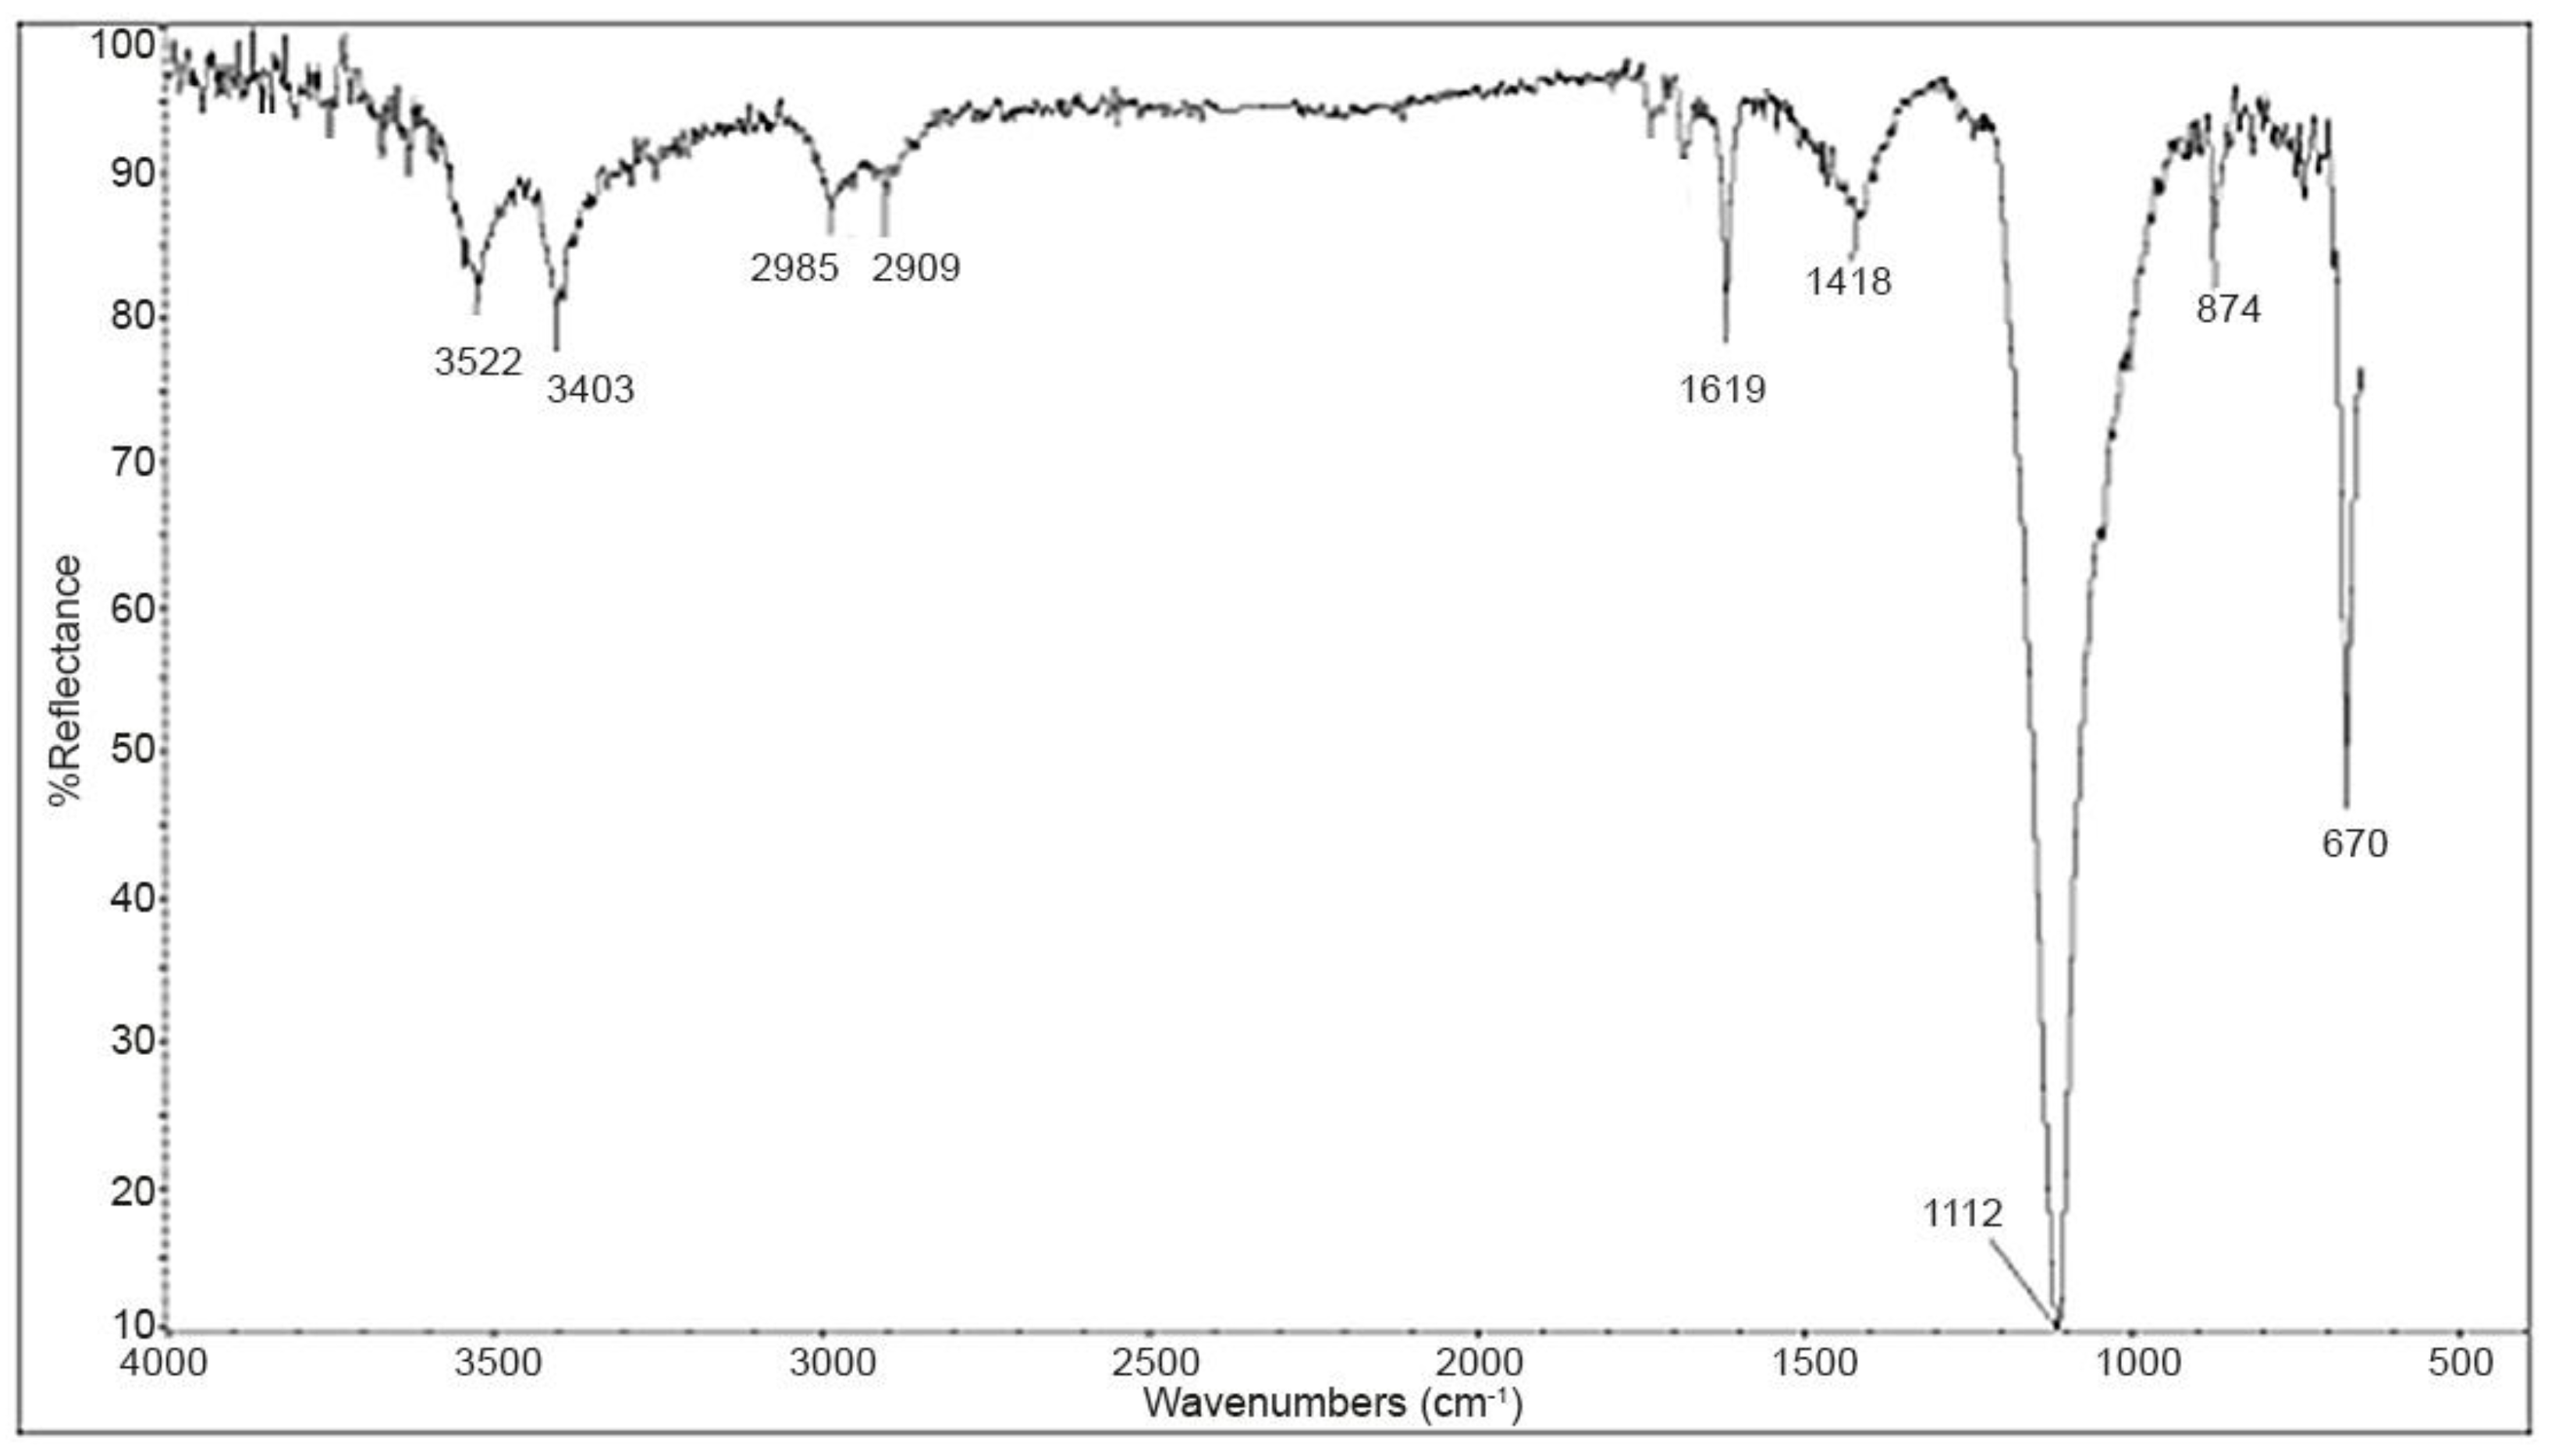
2.2.4. Micro-Fourier Transform Infrared Spectroscopy (FTIR)
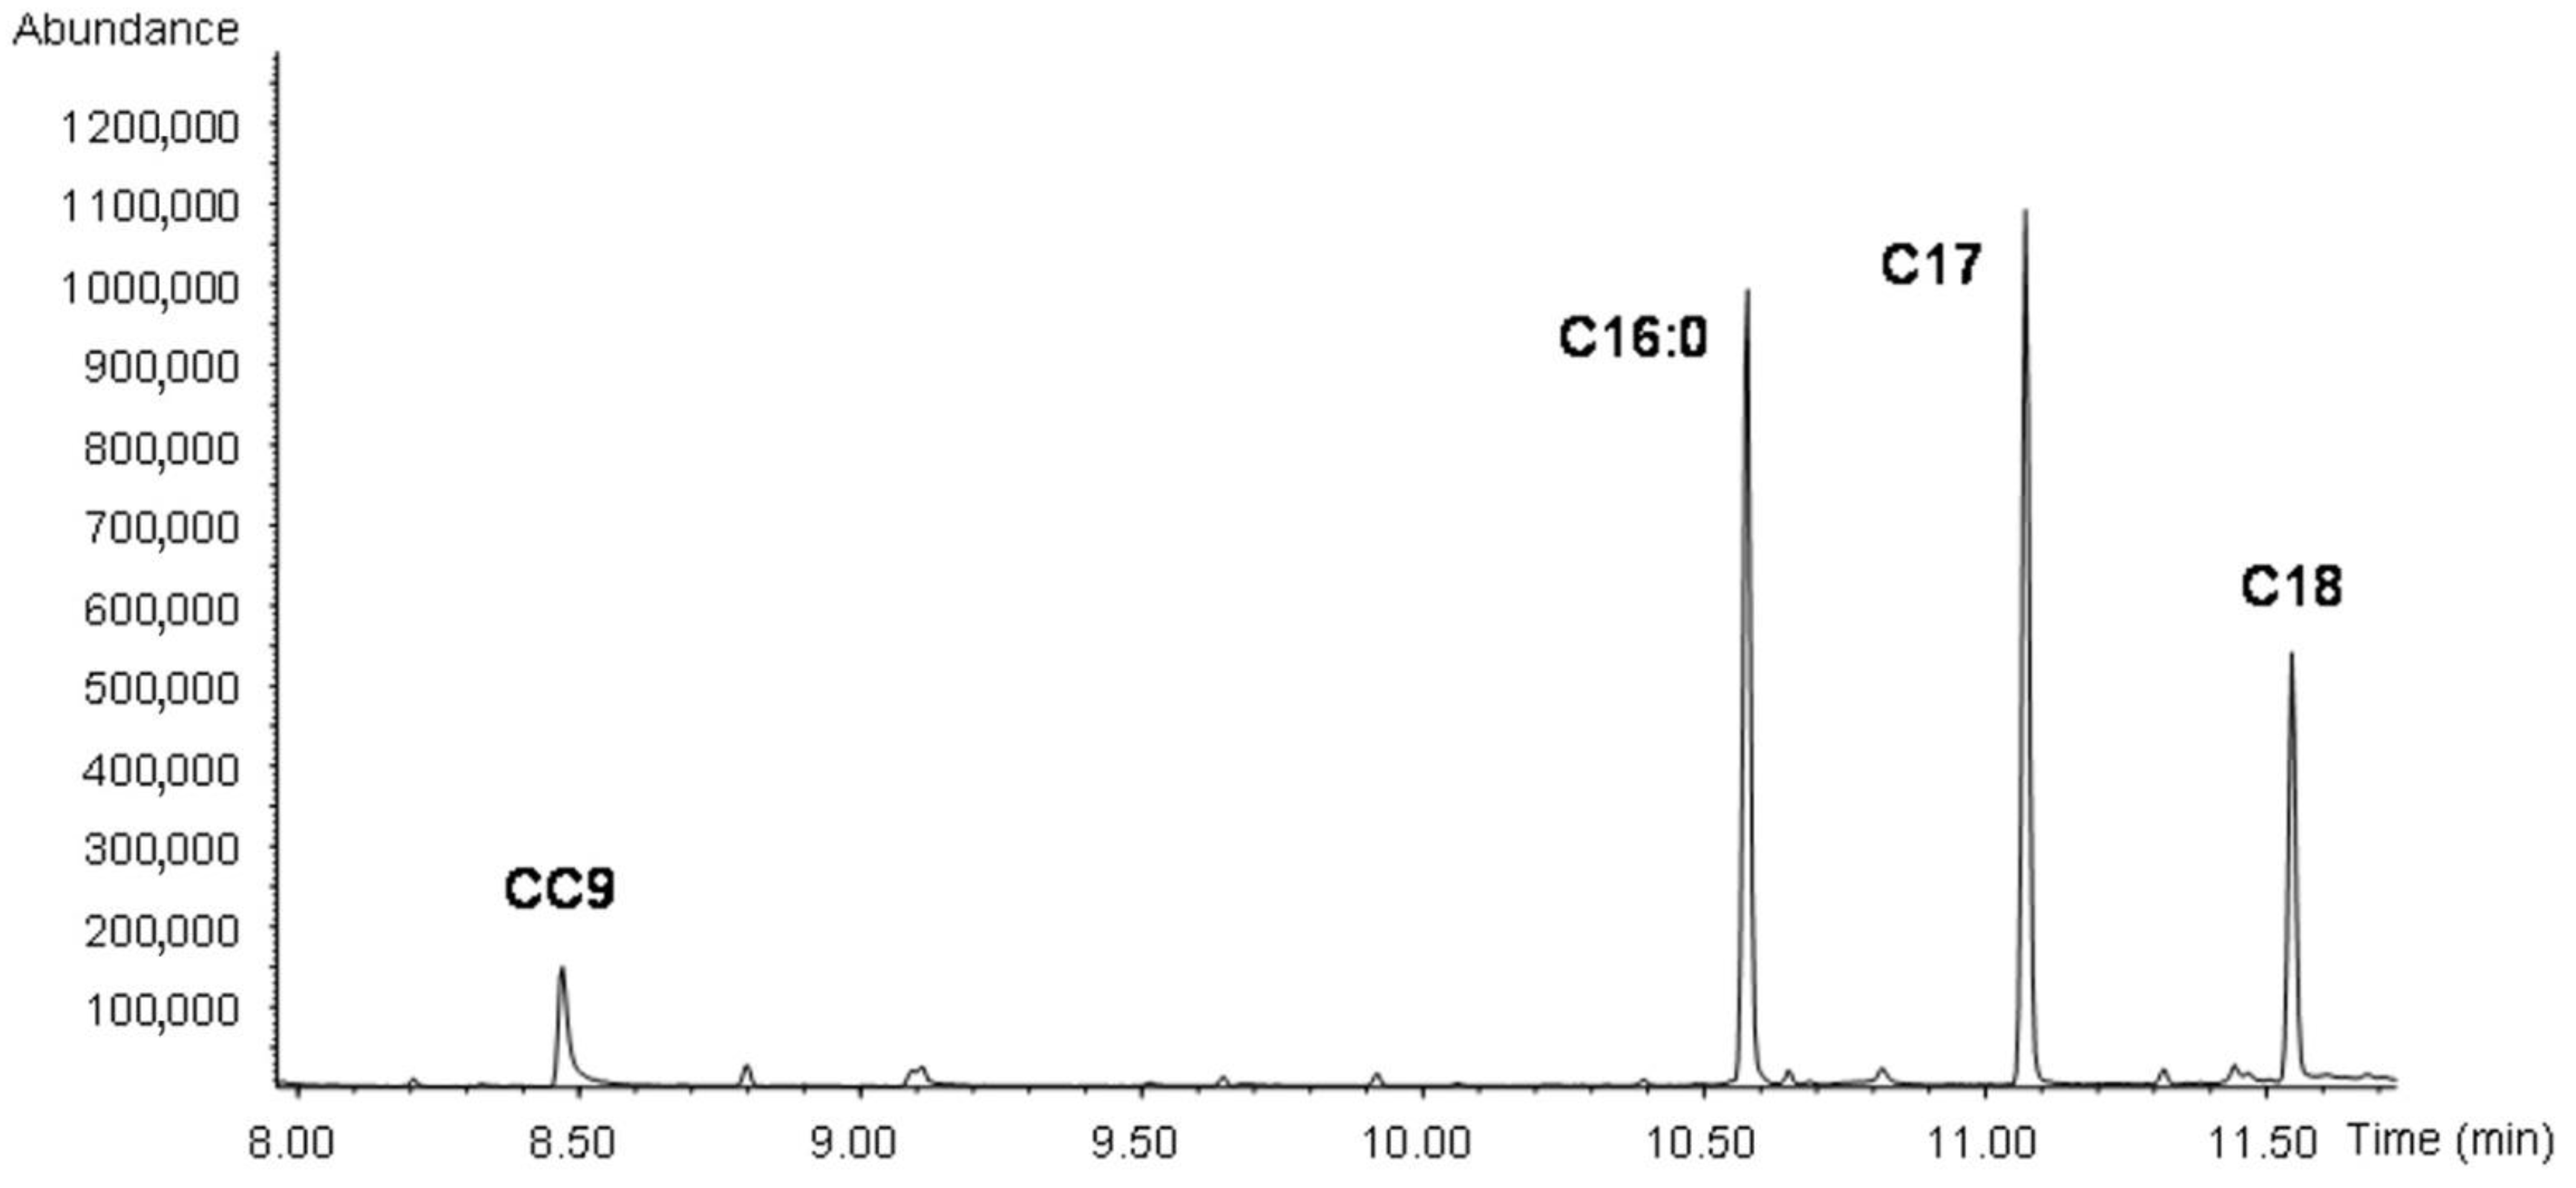
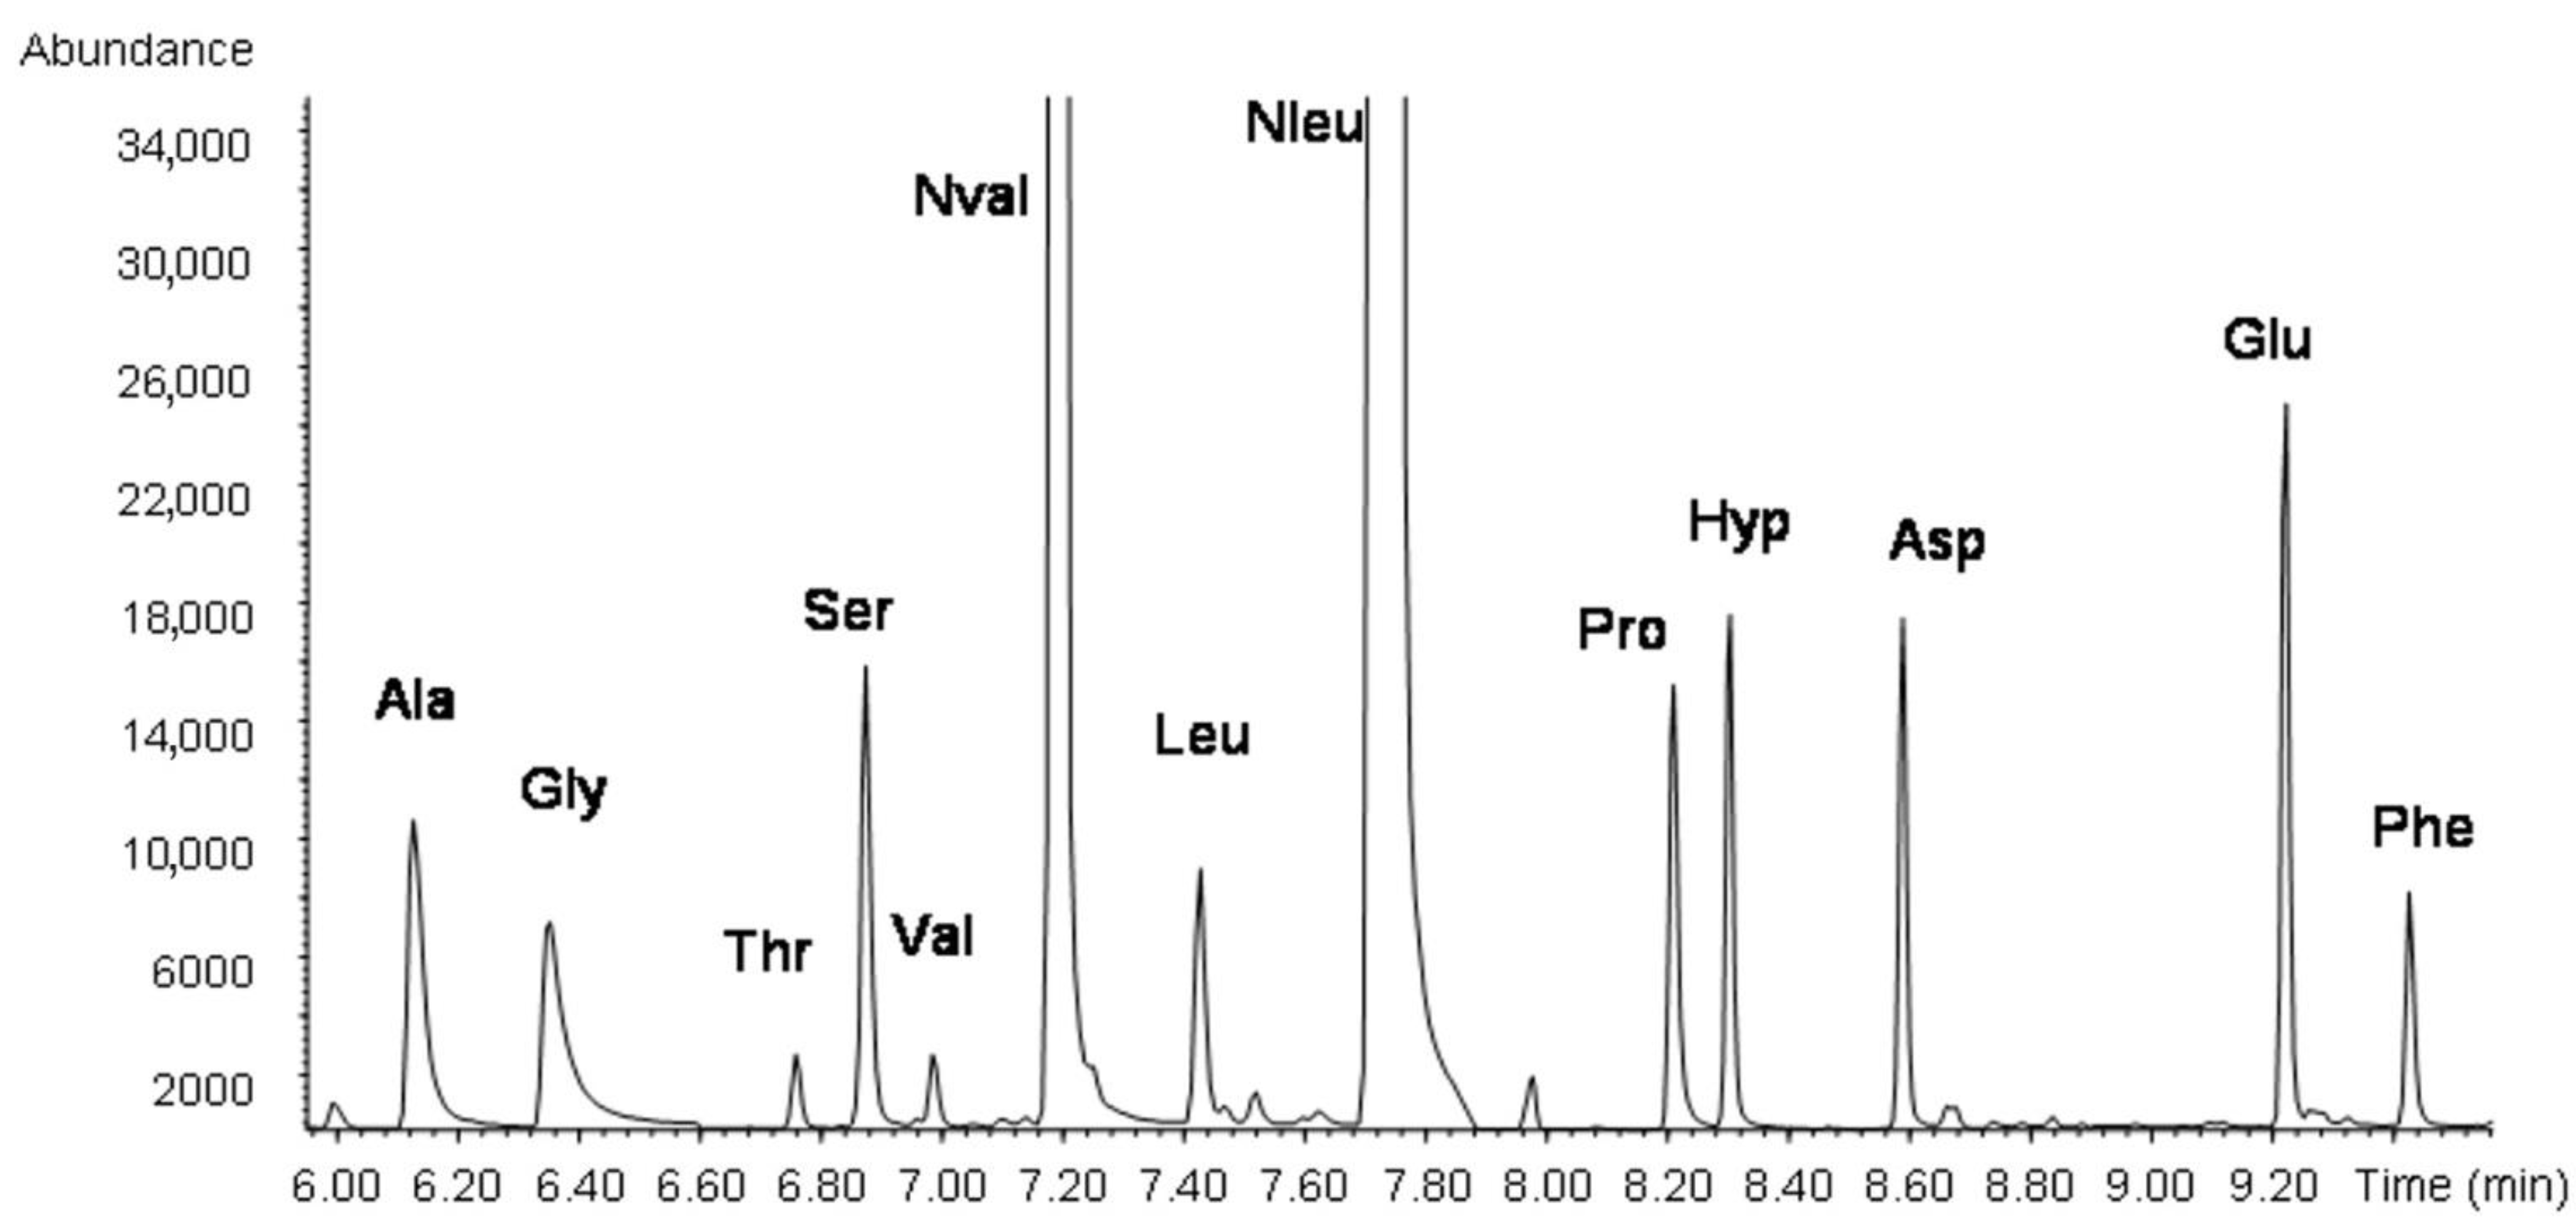
2.2.5. Gas Chromatography—Mass Spectrometry (GC-MS)
3. Results and Discussion
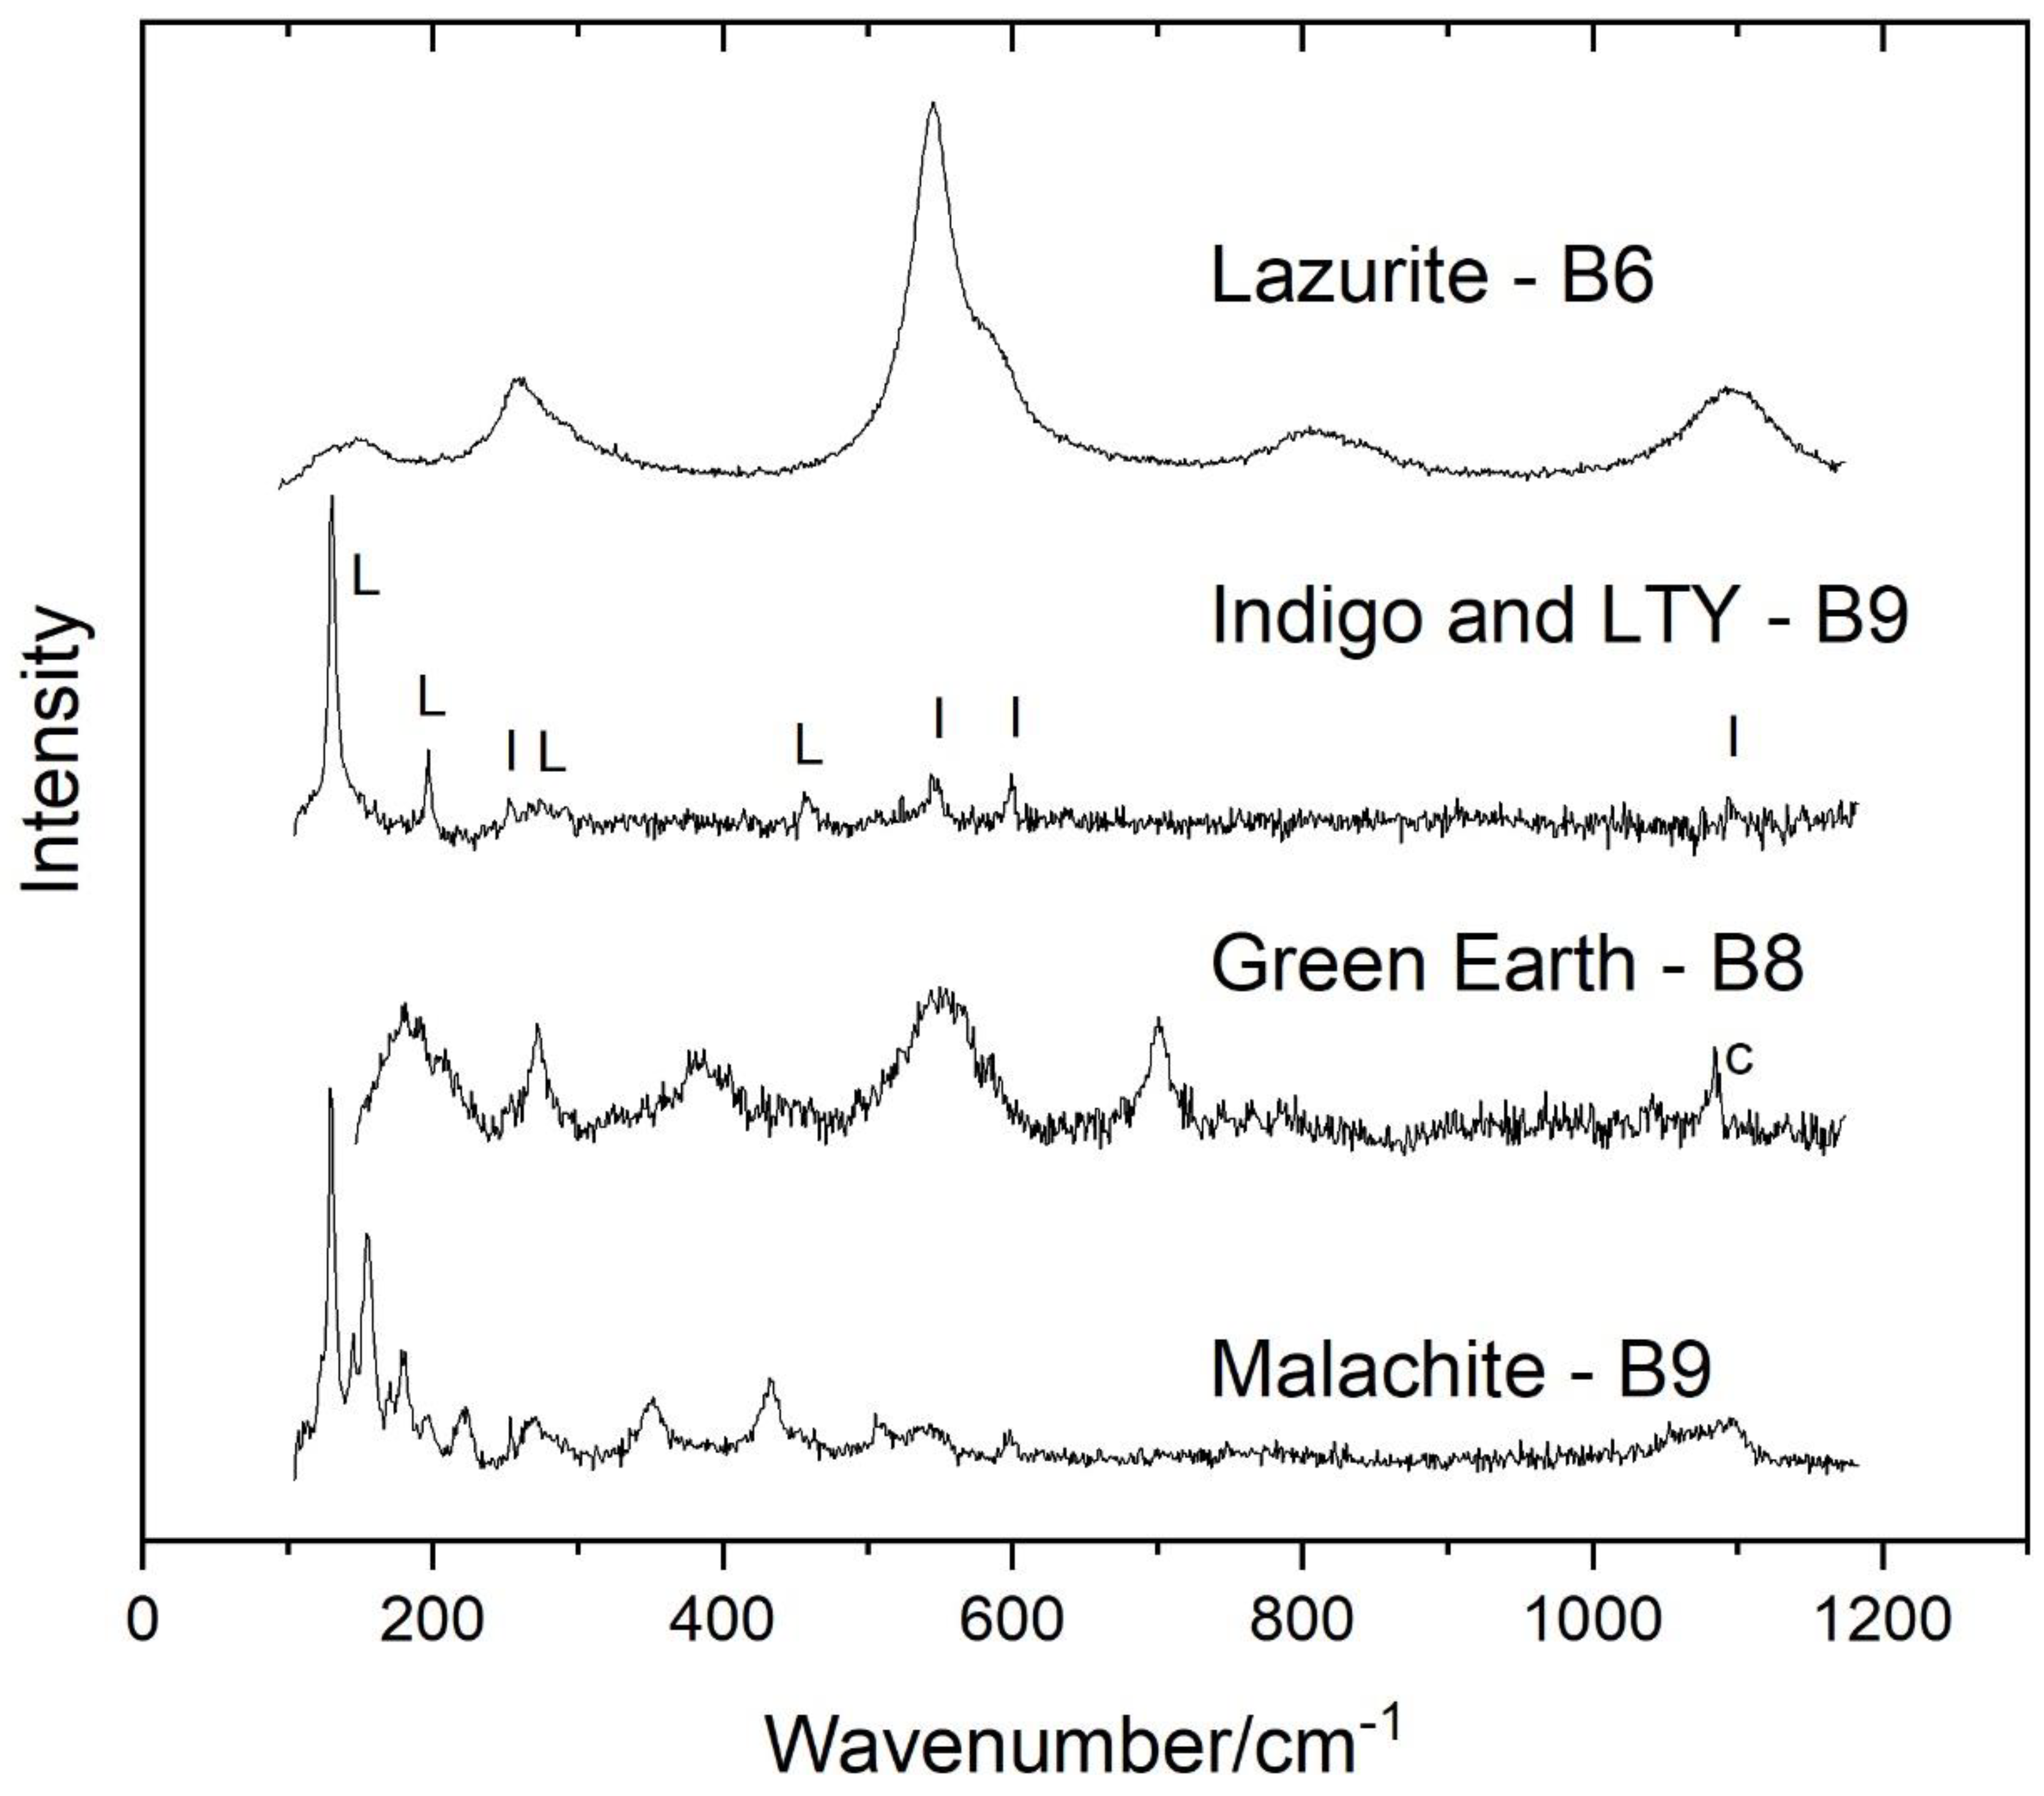
3.1. Pigments
3.1.1. Blue
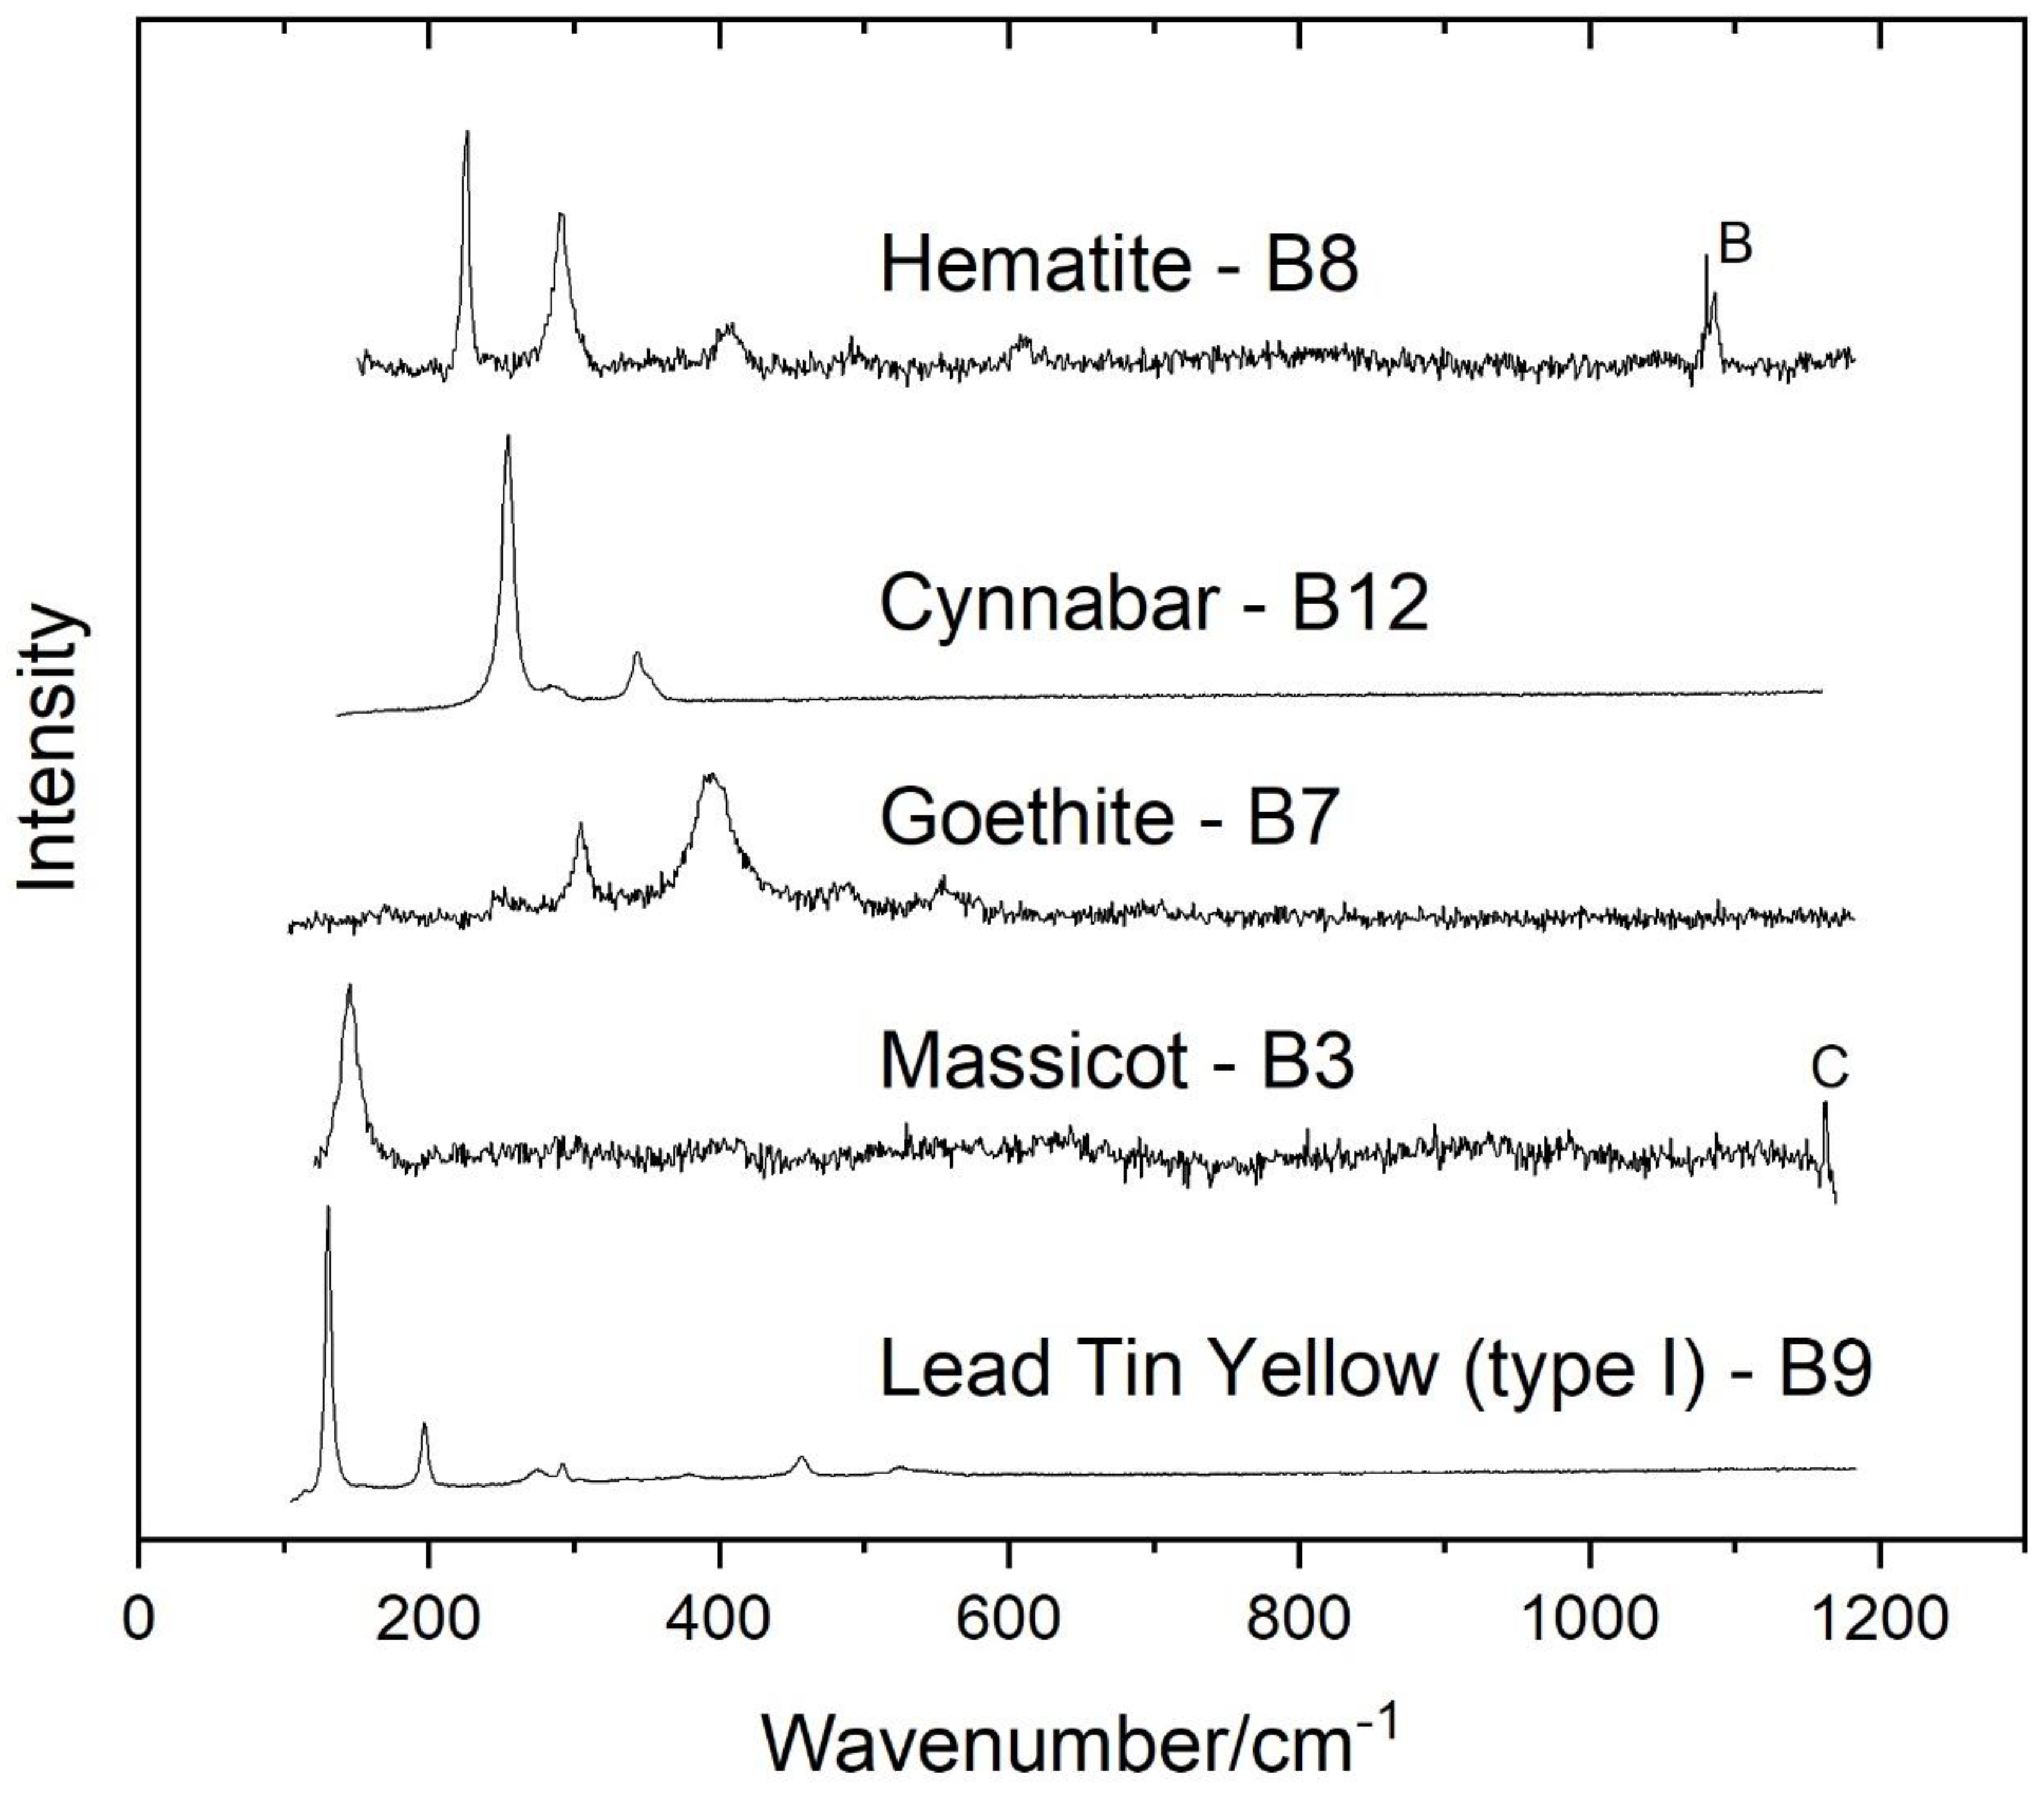
3.1.2. Red and Purple
3.1.3. Yellow and Brown
3.1.4. Green
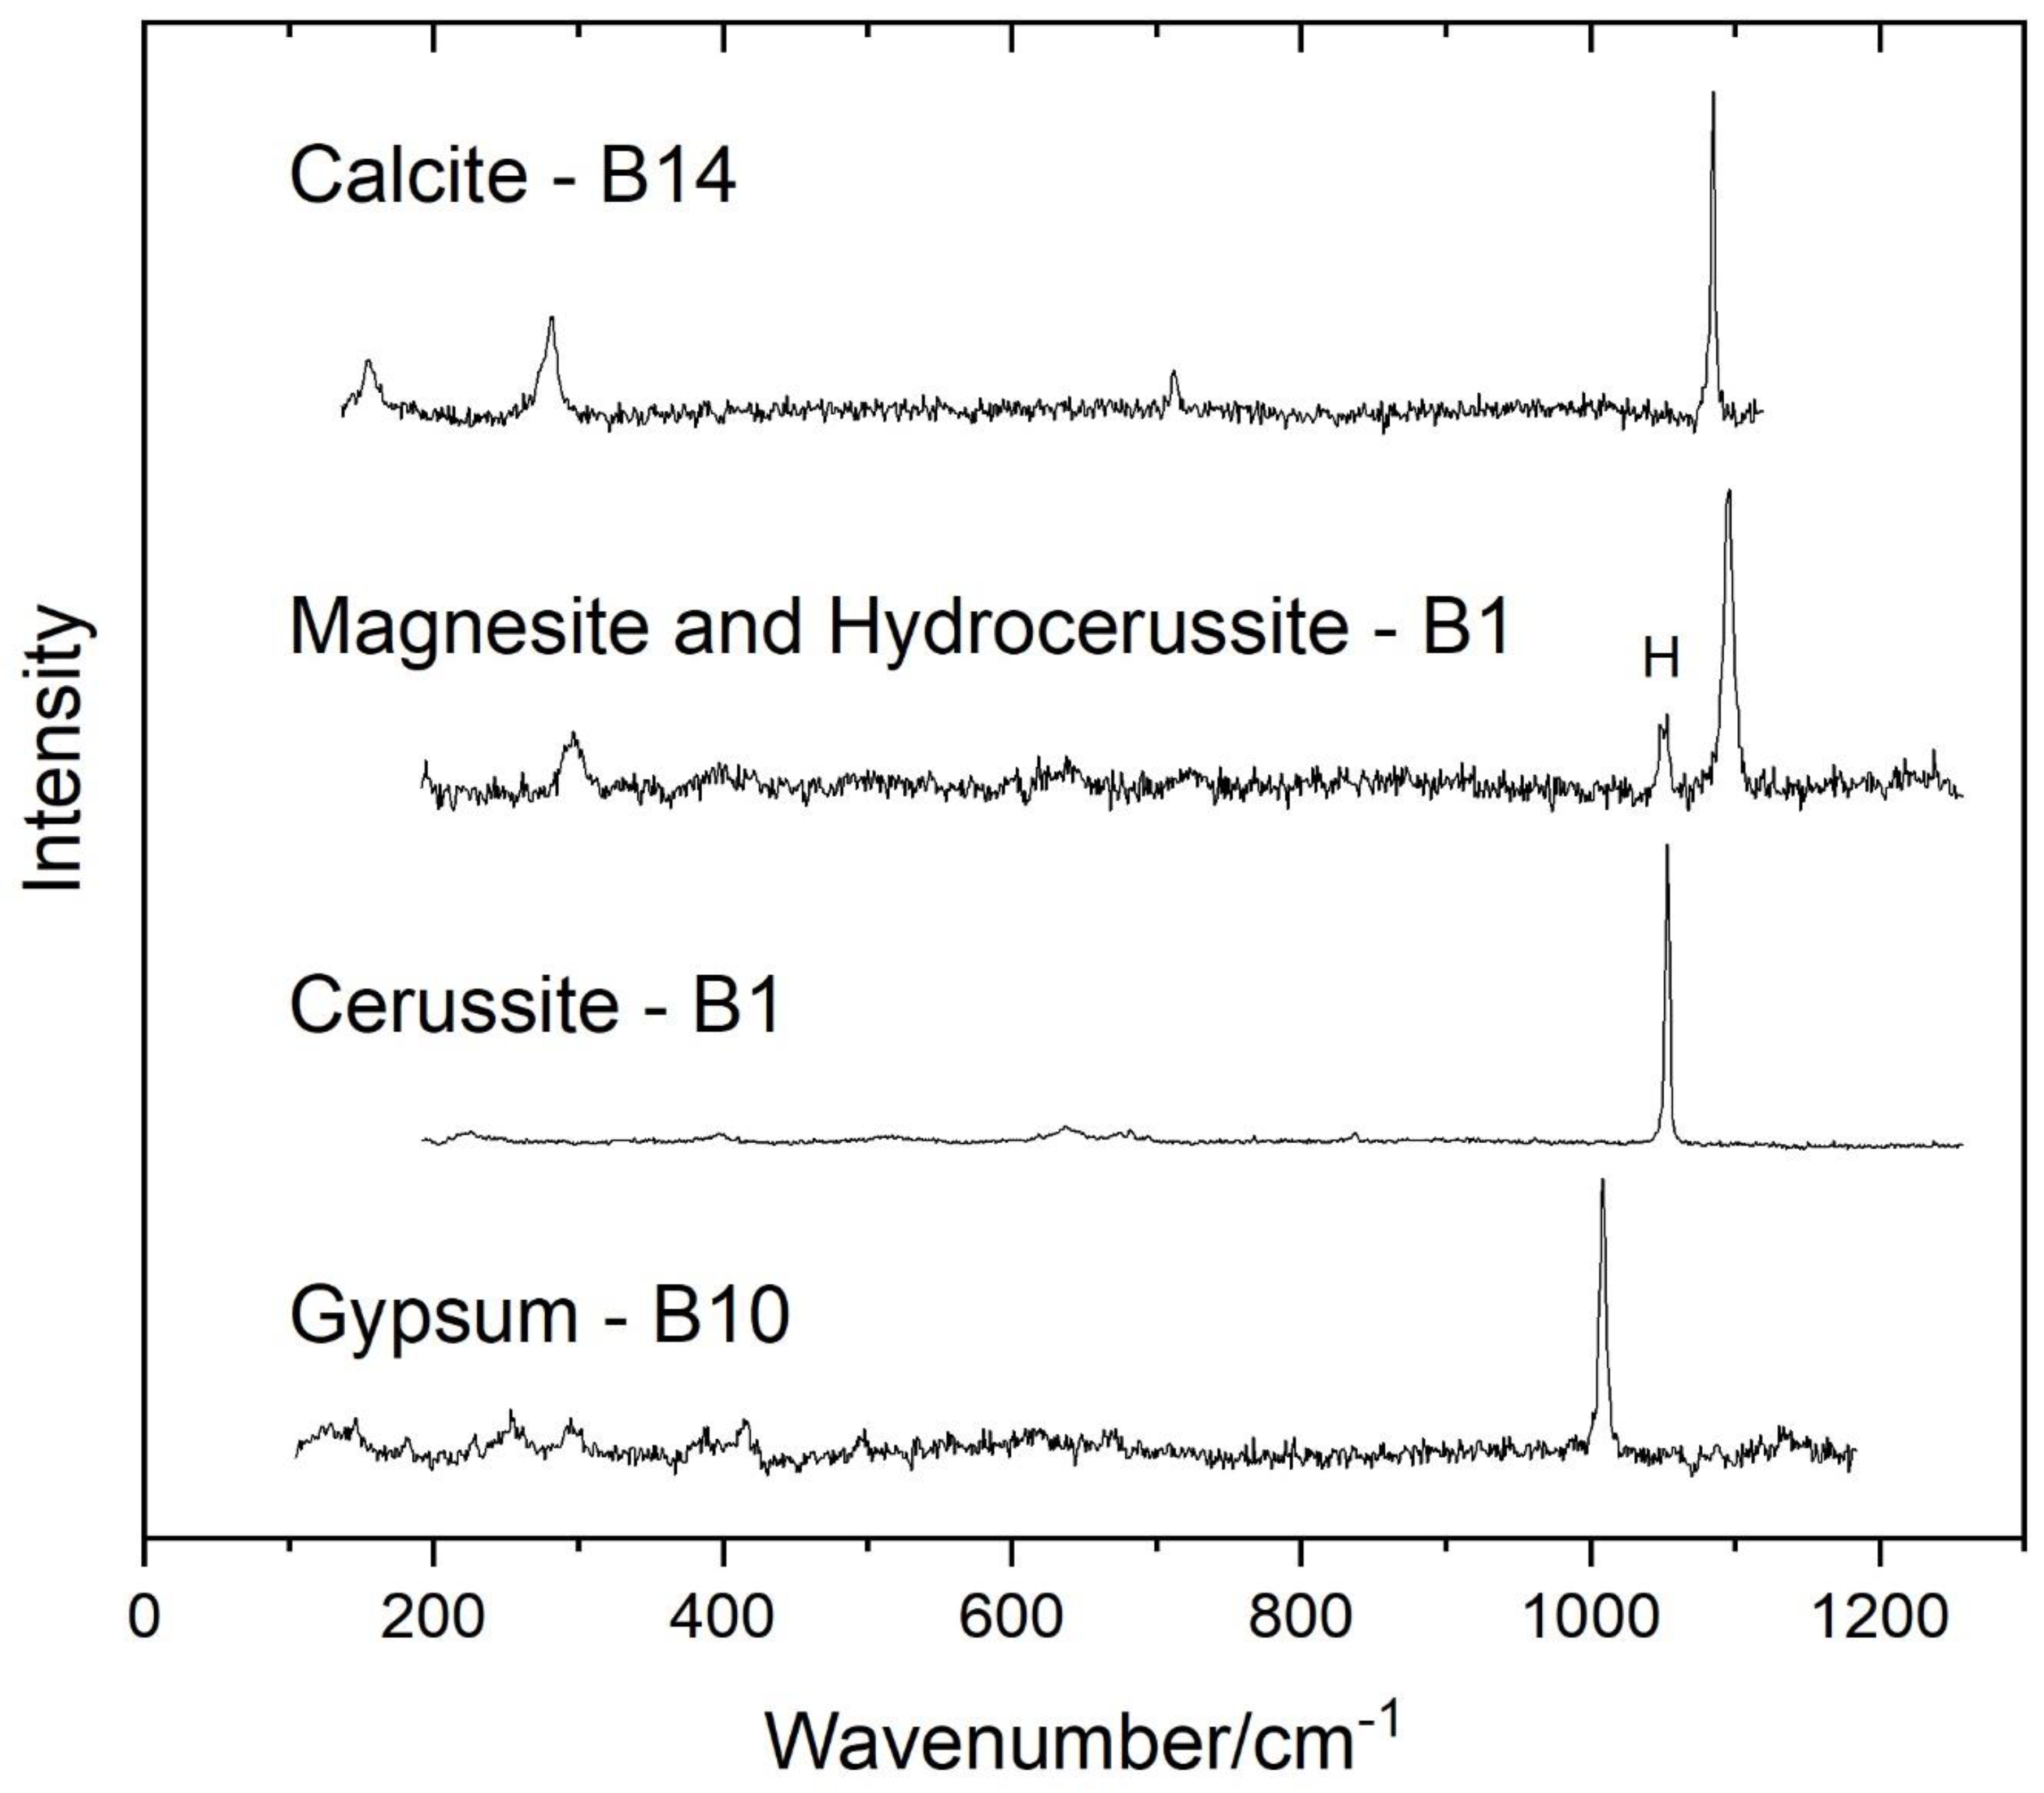
3.1.5. White
3.1.6. Black
3.1.7. Gilding
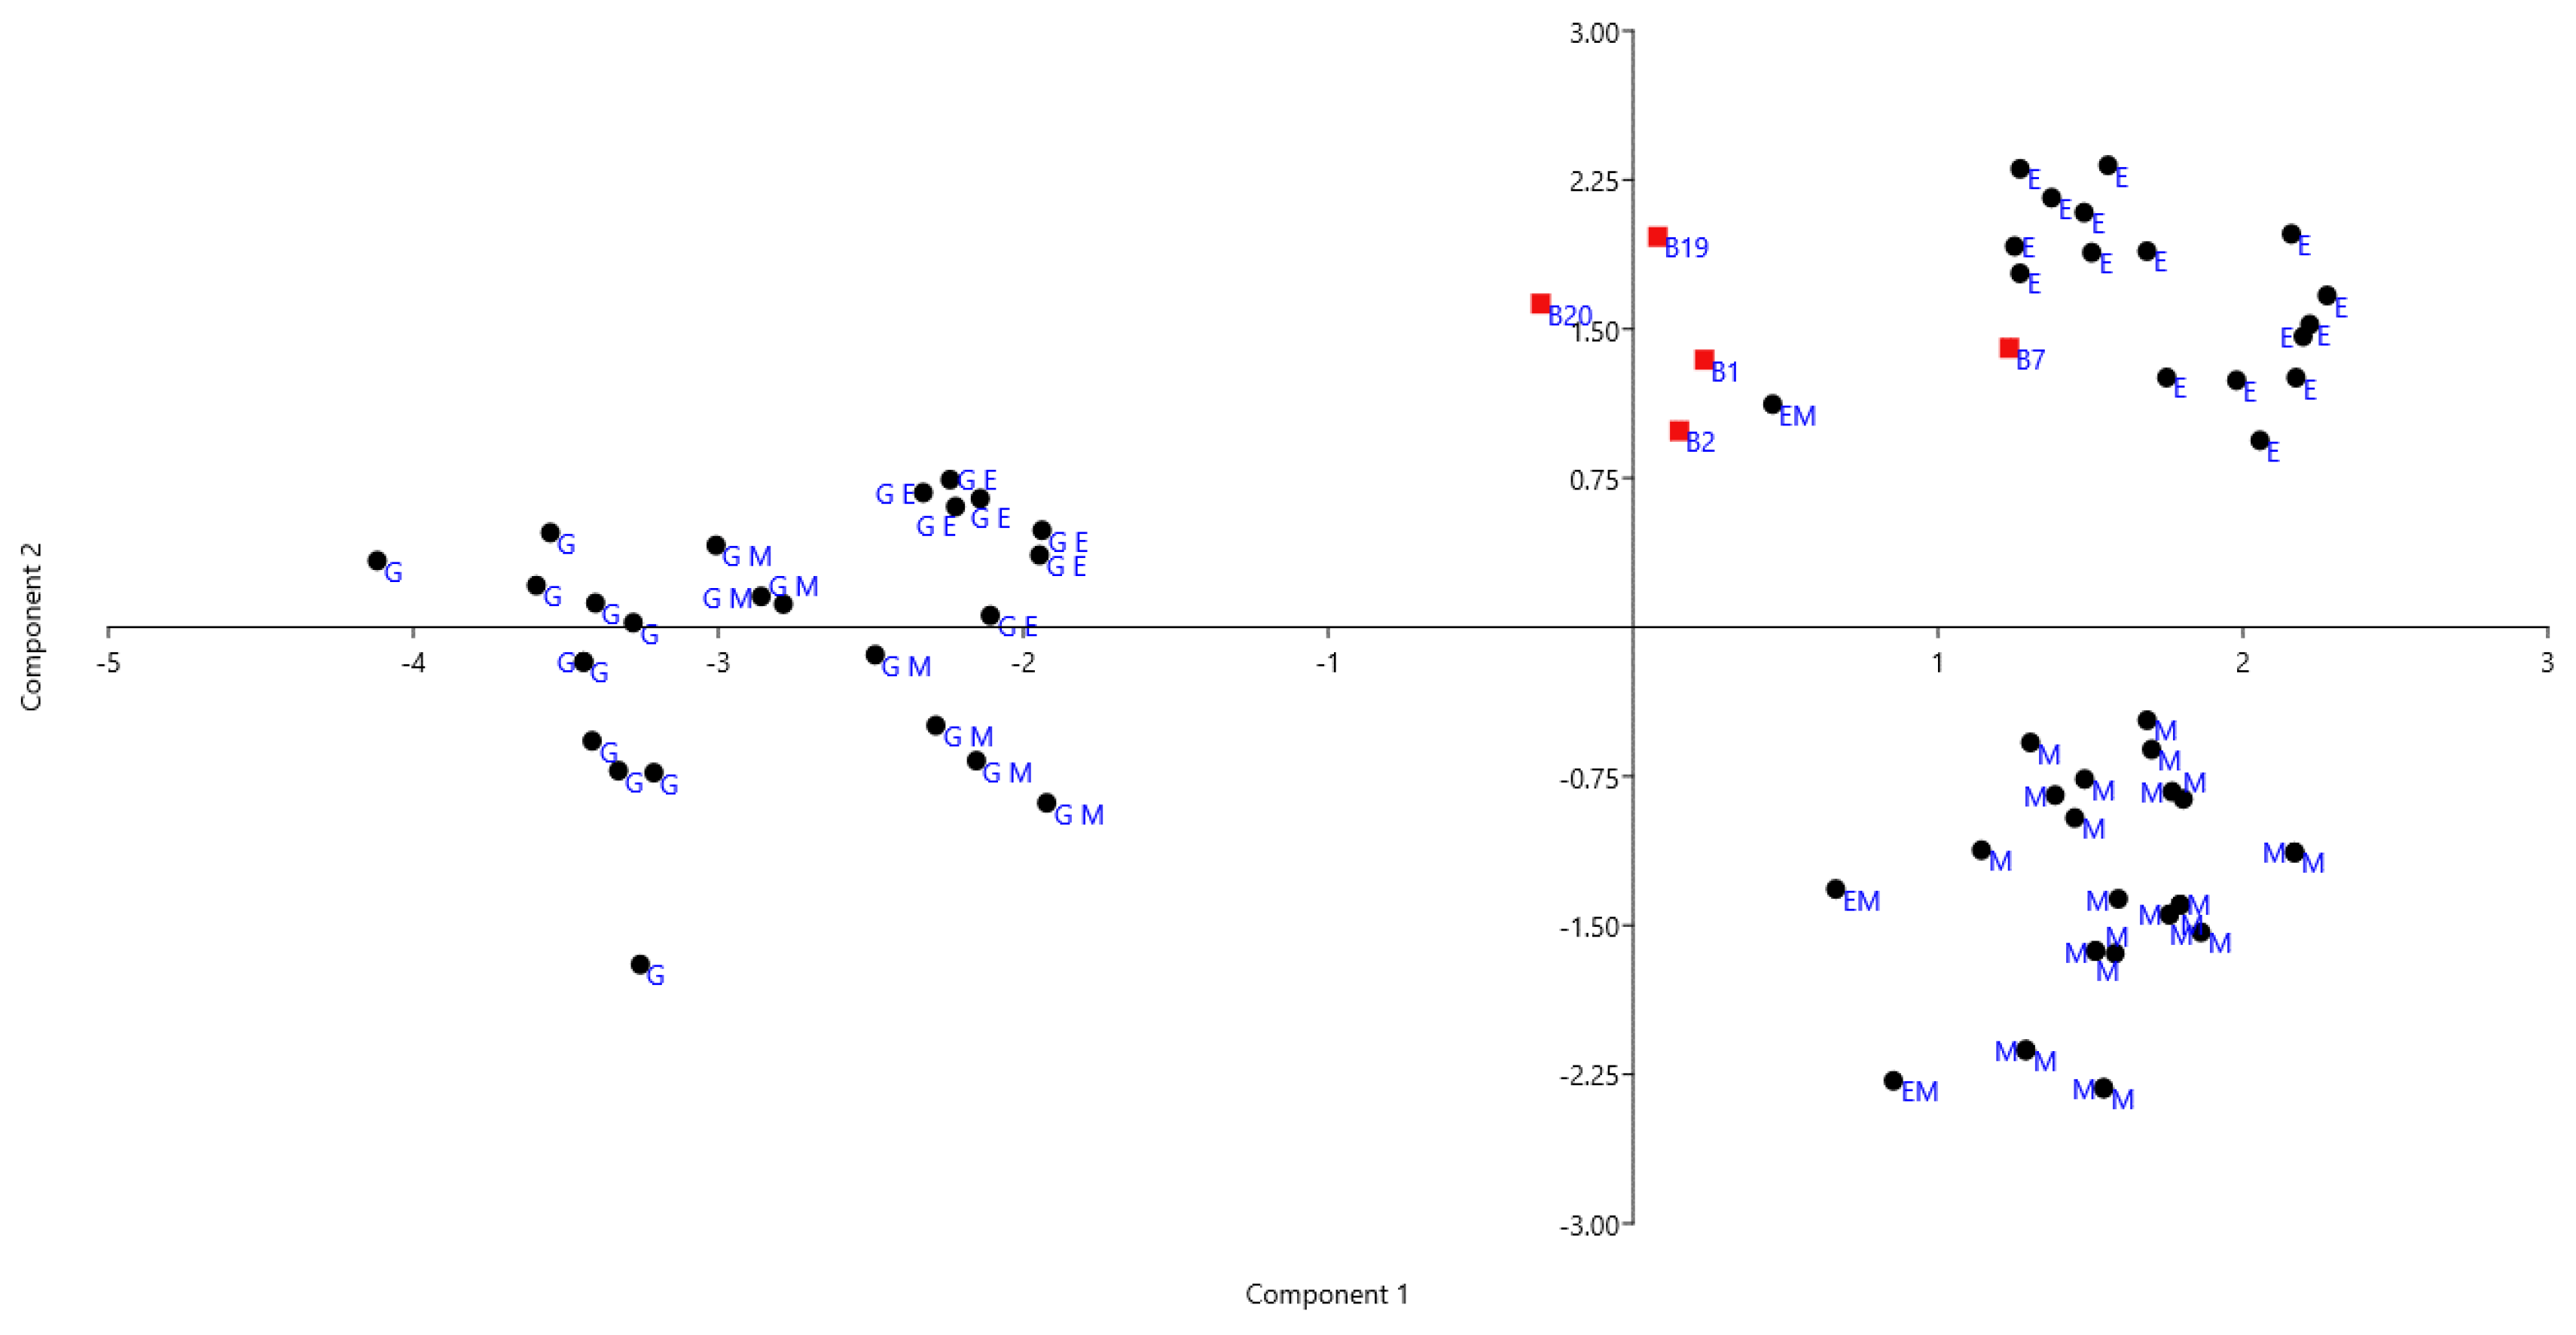
3.2. Organic Binding Media
3.3. Restoration and Degradation Materials
4. Conclusions
Author Contributions
Funding
Conflicts of Interest
References
- Toscano, G.M. Nuovi Studi sul Correggio; Libreria Aurea Parma: Parma, Italy, 1974. [Google Scholar]
- Ghidiglia Quintavalle, A. Gli affreschi del Correggio in San Giovanni Evangelista; Silvana Editoriale d’Arte: Milano, Italy, 1962. [Google Scholar]
- Ghidiglia Quintavalle, A. La cupola del Correggio in San Giovanni a Parma; Sansoni: Firenze, Italy, 1962. [Google Scholar]
- Mendogni, P. Il Correggio a Parma; Ugo Guanda Editore: Parma, Italy, 1989. [Google Scholar]
- Ekserdjian, D. Correggio; Yale University Press: New Haven, CT, USA, 1997. [Google Scholar]
- Available online: https://www.fondazioneilcorreggio.it (accessed on 15 February 2022).
- Bersani, B.; Berzioli, M.; Caglio, S.; Casoli, A.; Lottici, P.P.; Medeghini, L.; Poldi, G.; Zannini, P. An integrated multi-analytical approach to the study of the dome wall paintings by Correggio in Parma Cathedral. Microchem. J. 2014, 114, 80–88. [Google Scholar] [CrossRef]
- Bonazzi, A.; Bonomi, R.; Casoli, A.; Mangia, A.; Sgarabotto, P. Indagini chimiche e mineralogiche dei dipinti murali del Correggio. In Un Miracol d’arte Senza Esempio. La cupola del Correggio in S. Giovanni Evangelista a Parma; Tipolitografia Benedettina Editrice: Parma, Italy, 1990; pp. 83–84. [Google Scholar]
- Antonioli, G.; Bersani, D.; Lottici, P.P.; Campani, E.; Casoli, A. Indagini Scientifiche. In Correggio, Parmigianino, Anselmi nella Chiesa di San Giovanni Evangelista a Parma; Sgarbi, V., Ed.; Skirà: Lausanne, Switzerland, 2008; pp. 265–274. [Google Scholar]
- Mairinger, F. UV-, IR- and X-ray Imaging. Compr. Anal. Chem. 2004, 42, 15–71. [Google Scholar] [CrossRef]
- Verri, G.; Clementi, C.; Comelli, D.; Cather, S.; Piqué, F. Correction of Ultraviolet-Induced Fluorescence Spectra for the Examination of Polychromy. Appl. Spectrosc. 2008, 62, 1295–1302. [Google Scholar] [CrossRef] [PubMed]
- Bersani, D.; Lottici, P.P.; Casoli, A. Micro-Raman and GC-MS of Frescoes. In Raman Spectroscopy in Archaeology and Art History; Edwards, H.G.M., Chalmers, J.M., Eds.; Royal Society of Chemistry, Analytical Spectroscopy Monographs: London, UK, 2005; pp. 130–141. [Google Scholar]
- La Russa, M.F.; Ruffolo, S.A.; Barone, G.; Crisci, G.M.; Mazzoleni, P.; Pezzino, A. The Use of FTIR and Micro-FTIR Spectroscopy: An Example of Application to Cultural Heritage. Int. J. Spectrosc. 2009, 2009, 893528. [Google Scholar] [CrossRef] [Green Version]
- Casoli, A.; Santoro, S. Organic materials in the wall paintings in Pompei: A case study of Insula del Centenario. Chem. Cent. J. 2012, 6, 107. [Google Scholar] [CrossRef] [PubMed] [Green Version]
- Bonaduce, I.; Ribechini, E.; Modugno, F.; Colombini, M.P. Analytical Approaches Based on Gas Chromatography Mass Spectrometry (GC/MS) to Study Organic Materials in Artworks and Archaeological Objects. Top. Curr. Chem. 2016, 374–376. [Google Scholar] [CrossRef] [PubMed]
- Mortari, C.; Nobre Pais, A.; Esteves, L.; Gago da Câmara, A.; Carvalho, M.L.; Manso, M. Raman and X-ray fluorescence glaze characterisation of Maria Keil’s decorative tile panels. J. Raman Spectrosc. 2020, 52, 60–70. [Google Scholar] [CrossRef]
- Mühlethaler, B.; Thissenj, J. Smalt. Stud. Conserv. 1969, 14, 47–61. [Google Scholar] [CrossRef]
- Ospitali, F.; Bersani, D.; Di Lonardo, G.; Lottici, P.P. ‘Green earths’: Vibrational and elemental characterization of glauconites, celadonites and historical pigments. J. Raman Spectrosc. 2008, 39, 1066–1073. [Google Scholar] [CrossRef]
- Bersani, D.; Antonioli, G.; Lottici, P.P.; Casoli, A. Raman micro spectrometric investigation of wall paintings in S. Giovanni Evangelista Abbey in Parma: A comparison between two artists of the 16th century. Spectrochim. Acta Part A 2003, 59, 2409–2417. [Google Scholar] [CrossRef]
- Sandu, I.C.A.; Afonso, L.U.; Murta, E.; De Sa, M.H. Gilding Techniques in Religious Art Between East and West, 14th–18th Centuries. Int. J. Conserv. Sci. 2010, 1, 47–62. [Google Scholar]
- Colombini, M.P.; Modugno, F.; Fuoco, R.; Tognazzi, A. A GC-MS study on the deterioration of lipidic paint binders. Microchem. J. 2002, 73, 175–185. [Google Scholar] [CrossRef]
- Mills, J.S.; White, R. Analyses of paint media. Natl. Gallery Tech. Bull. 1980, 4, 65–67. [Google Scholar]
- Casoli, A.; Cauzzi, D.; Palla, G. The study of binding media in polychrome works of art: The drying oils. OPD Restauro 1999, 11, 111–121. [Google Scholar]
- Sandu, I.; Anca, C.; de Sà, M.H.; Pereirac, M.C. Ancient ‘gilded’ art objects from European cultural heritage: A review on different scales of characterization. Surf. Interface Anal. 2011, 43, 1134–1151. [Google Scholar] [CrossRef]
- Cennini, C. The Book of the Art of Cennino Cennini: A Contemporary Practical Treatise on Quattrocento Painting; Taylor & Francis Ltd.: London, UK, 2018. [Google Scholar]
- Lanterna, G.; Mairani, A.; Matteini, M.; Rizzi, M.; Vigato, P.A. Characterisation of Decay Markers on Pictorial Models Simulating Ancient Polychromies: Target 2.2.2 of the Special Project on Cultural Heritage—CNR—Italy. In Proceedings of the 2nd International Congress on Science and Technology for the Safeguard of Cultural Heritage in the Mediterranean Basin, Paris, France, 5–9 July 1999; Guarino, A., Ed.; Elsevier: Paris, France, 2000; pp. 487–489. [Google Scholar]
- Casoli, A.; Alberici, L.; Cauzzi, D.; Palla, G. Study of models simulating ancient polychromies. In Proceedings of the 2nd International Congress on Science and Technology for the Safeguard of Cultural Heritage in the Mediterranean Basin; Guarino, A., Ed.; Elsevier: Amsterdam, The Netherlands, 2000; pp. 591–593. [Google Scholar]
- Casoli, A.; Montanari, A.; Palla, G. Painted models simulating ancient polychromies: A statistical analysis of chemical results. In Proceedings of the 3rd International Congress on Science and Technology for the Safeguard of Cultural Heritage in the Mediterranean Basin, Alcalá De Henares, Spain; Elsevier: Paris, France, 2001; pp. 839–845. [Google Scholar]

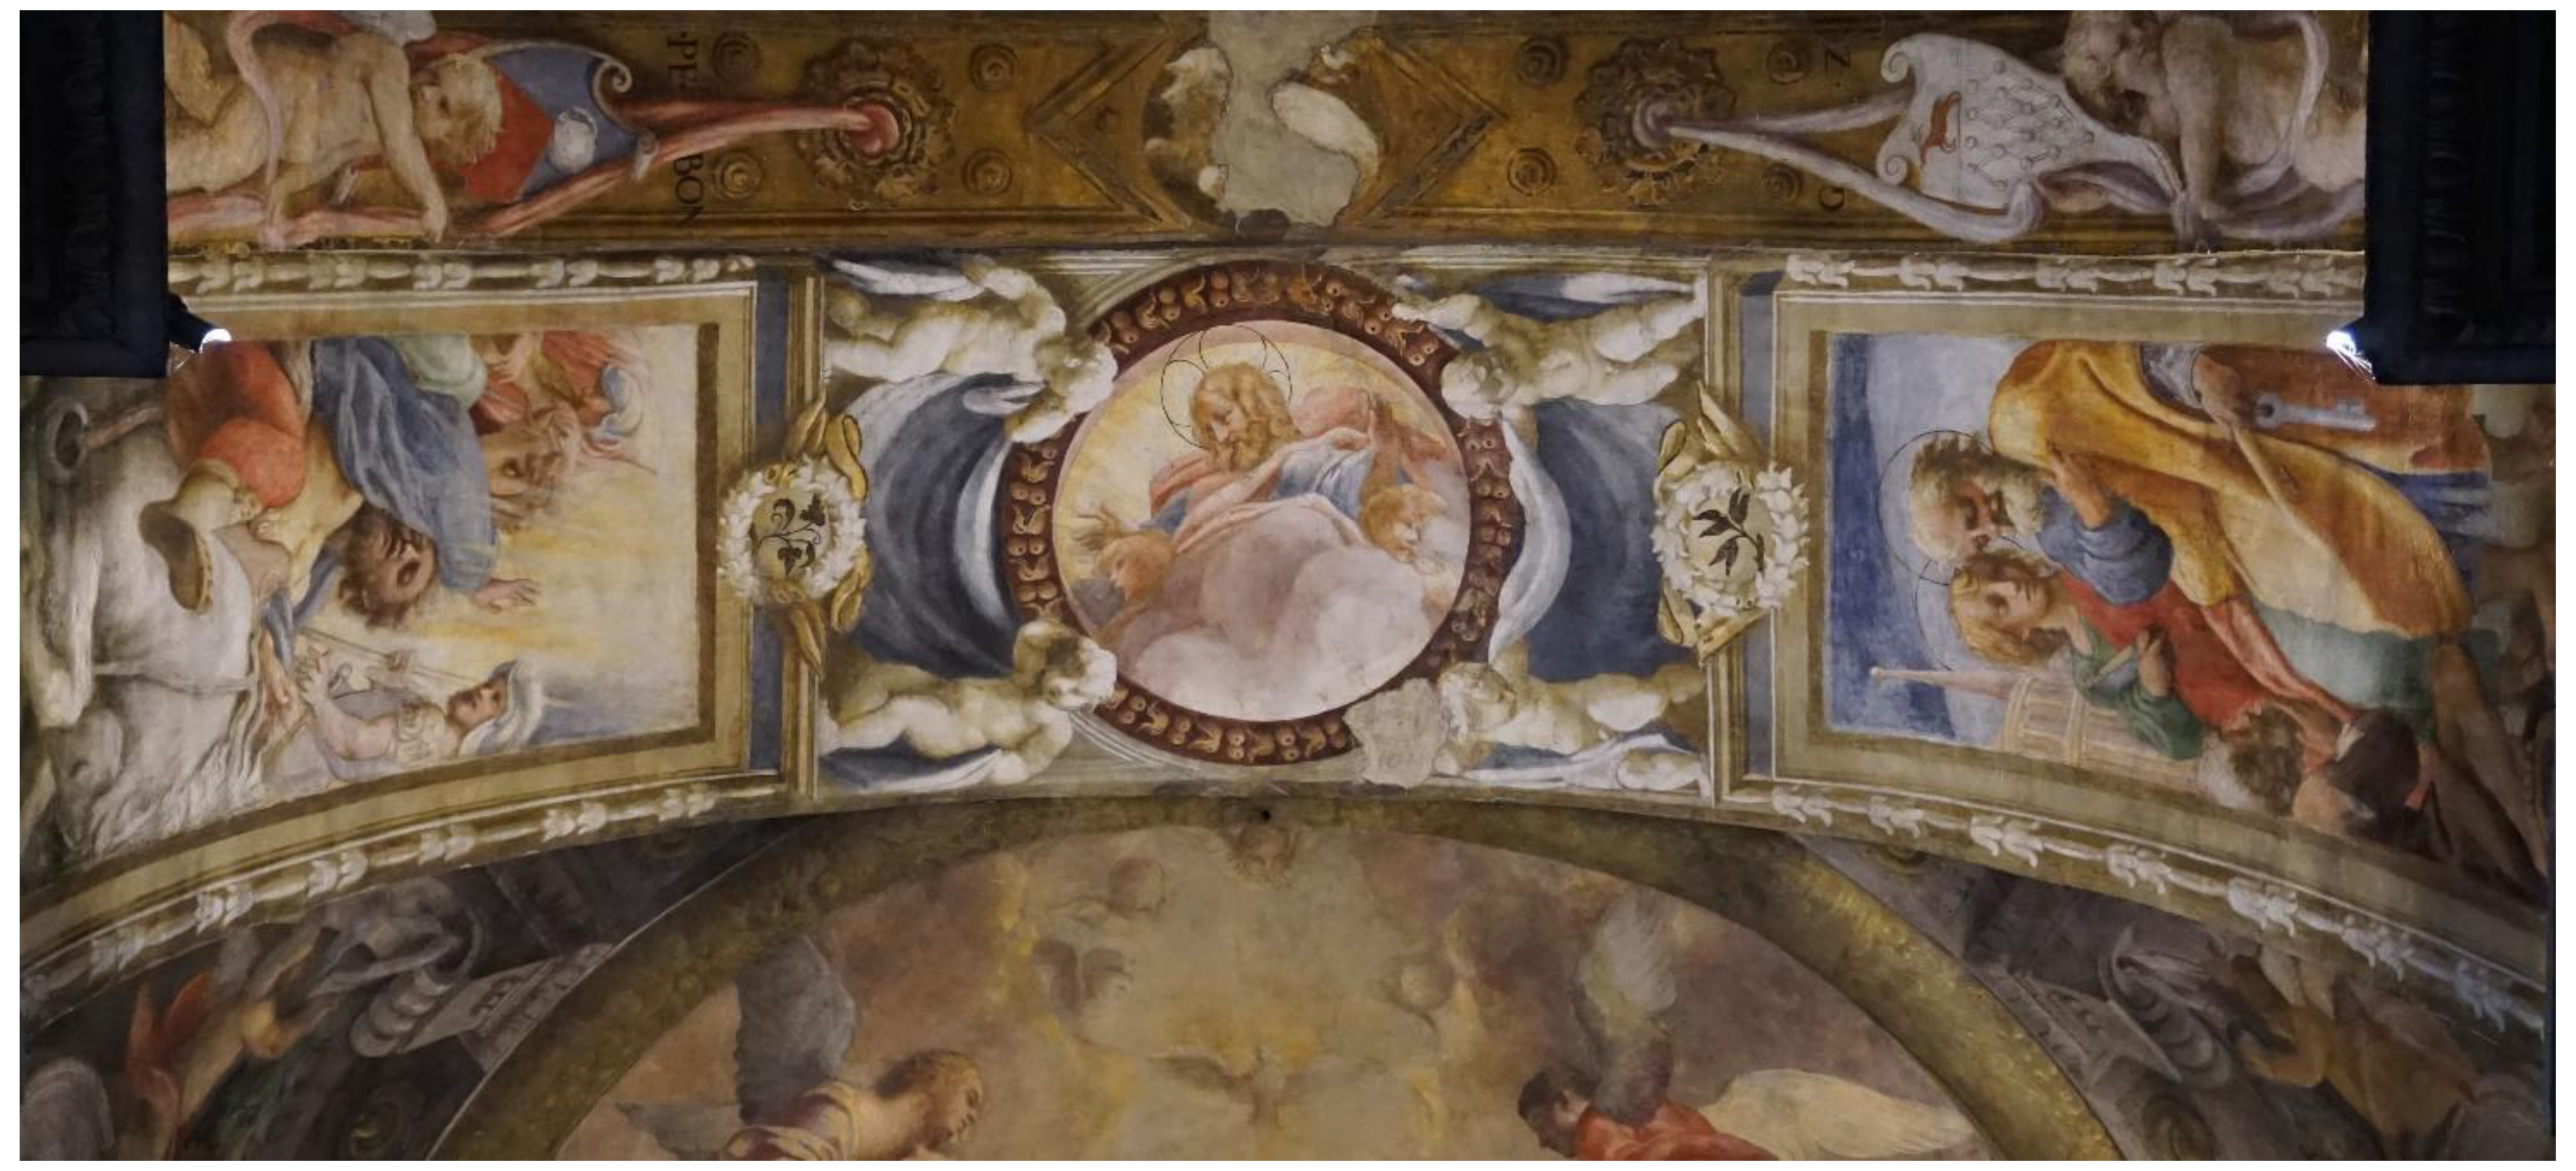
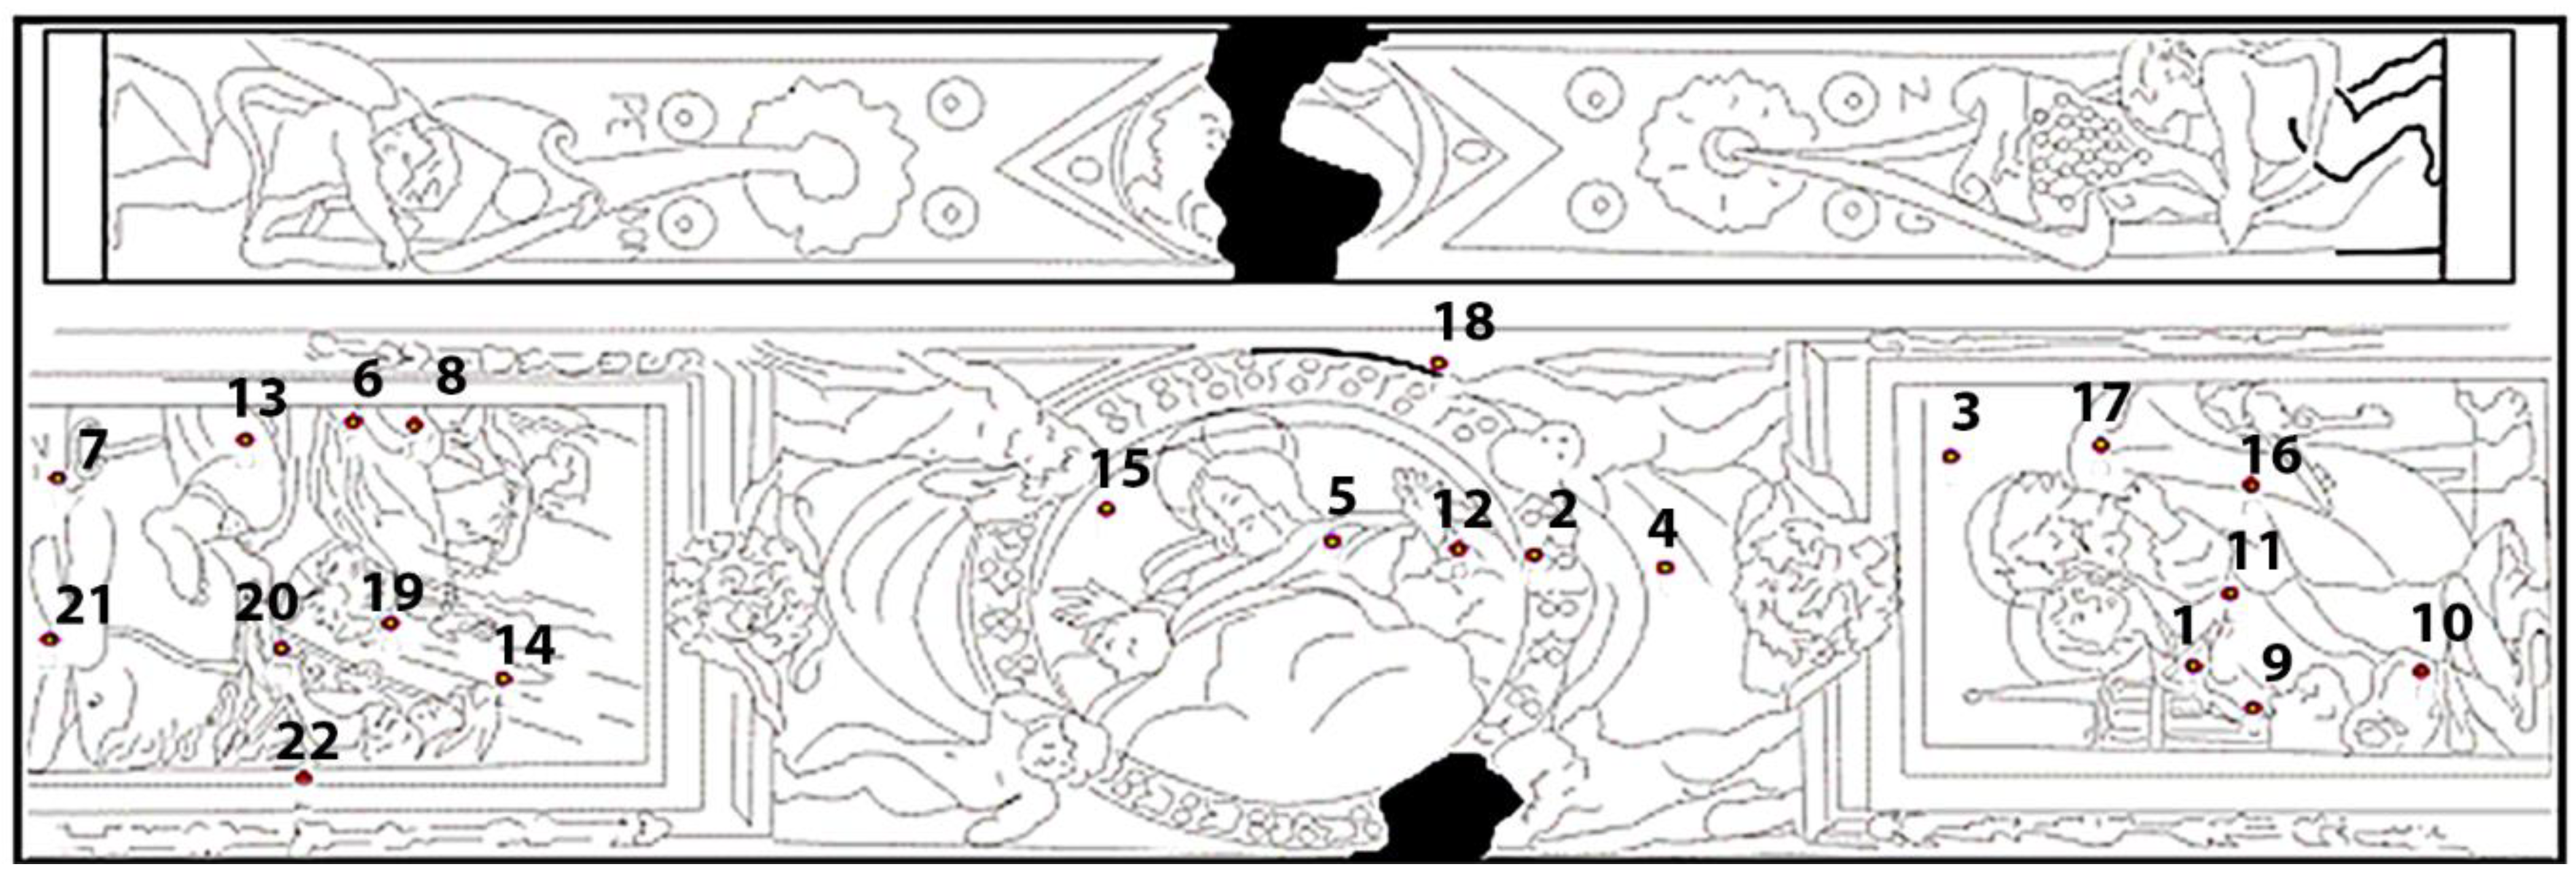
B1 Blue robe of St. Andrew | B2 Gilding central garland around the Christ | B3 Blue Heaven over St. Peter and St. Andrew |
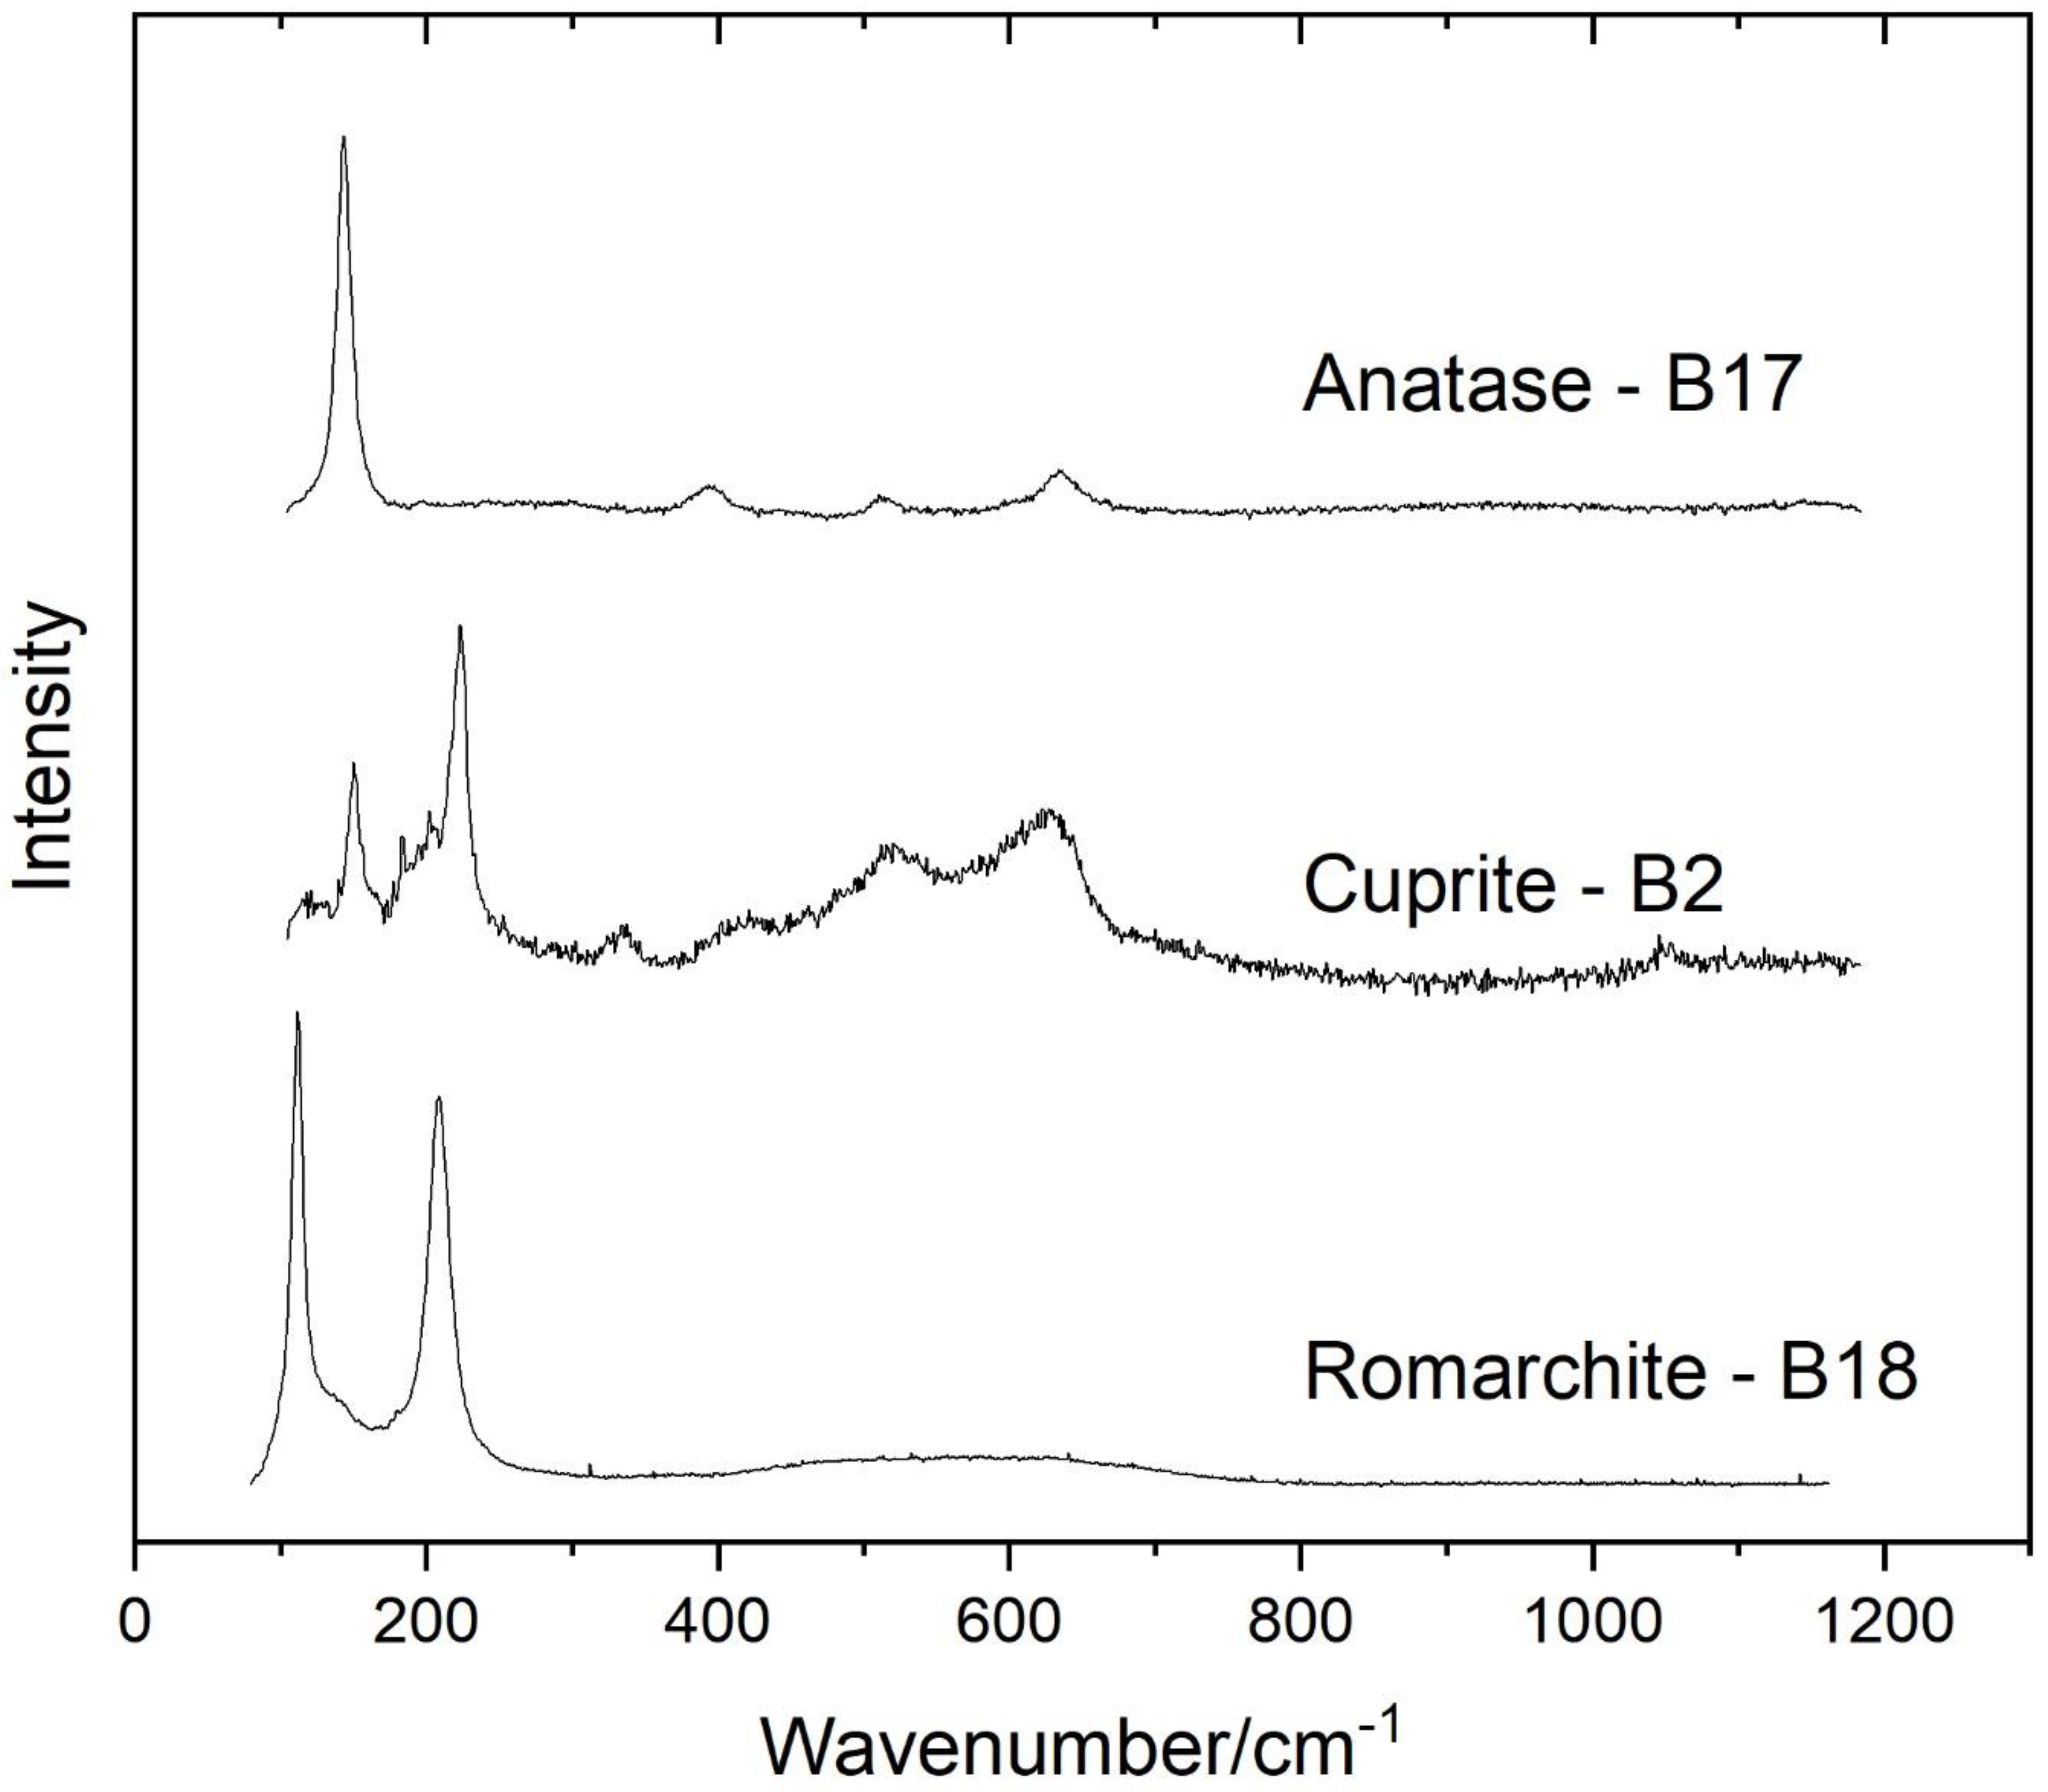
| P: lazurite, smalt, green earth (probably celadonite), lead white, lead tin yellow type I, massicot, cinnabar, calcite, magnesite, gypsum, anatase. Binders: egg, animal glue. | P: romarchite, cuprite, calcite, gypsum, anatase. Binders: egg, animal glue, linseed oil | P: smalt, calcite, massicot |
B4 Blue drape between the angels | B5 Blue robe of the Christ on central round | B6 Blue robe of St. Paul |
| P: smalt, carbon, calcite, gypsum. | P: smalt, cinnabar, calcite. | P: lazurite, smalt, cinnabar, calcite. |
B7 Green meadow under the horse | B8 light green near the mantle of St. Paul | B9 Green shoulder of St. Andrew |
| P: green earth, goethite, hematite, cinnabar, calcite, carbon black. Binders: egg, animal glue. | P: green earth, lazurite, hematite, cinnabar, calcite. | P: malachite, lazurite, goethite, lead tin yellow type I, cinnabar, indigo. |
B10 Bright Green the dress of St. Andrew | B11 Red drape on the robe of St. Andrew | B12 Red mantle of the Christ |
| P: green earth, unidentified blue organic dye, cinnabar (traces), calcite, gypsum, hematite, anatase. | P: cinnabar, calcite. | P: cinnabar, hematite, calcite, gypsum. |
B13 Red the trousers of St. Paul | B14 Yellow rays of light on St. Paul | B15 Yellow around the Christ |
| P: hematite, cinnabar (traces), calcite. | P: hematite, goethite, calcite. | P: goethite, cinnabar (traces), calcite. |
B16 Dark Yellow mantle of St. Peter | B17 Light Yellow mantle of St. Peter | B18 Purple garland around Christ |
| P: cinnabar, hematite, calcite. | P: goethite, massicot, hematite, calcite, gypsum, anatase. | P: goethite, cerussite, calcite. |
B19 Light Yellow over the hair of St. Paul | B20 Yellow under the hand of the soldier | B21 Black shadow of the paw of the horse |
| P: goethite, cerussite, calcite. Binders: egg, animal glue. | P: cerussite, cinnabar, anatase, calcite, carbon black. Binders: egg, animal glue. | P: carbon black, goethite. |
B22 Brown band of the scene with St. Paul | ||
| P: carbon black, goethite, calcite. |
Publisher’s Note: MDPI stays neutral with regard to jurisdictional claims in published maps and institutional affiliations. |
© 2022 by the authors. Licensee MDPI, Basel, Switzerland. This article is an open access article distributed under the terms and conditions of the Creative Commons Attribution (CC BY) license (https://creativecommons.org/licenses/by/4.0/).
Share and Cite
Casoli, A.; Lottici, P.P.; Bersani, D. A Study on Correggio Wall Paintings: Characterization of Technique and Materials of Abbey Church of S. Giovanni Evangelista in Parma, Italy. Appl. Sci. 2022, 12, 4810. https://doi.org/10.3390/app12104810
Casoli A, Lottici PP, Bersani D. A Study on Correggio Wall Paintings: Characterization of Technique and Materials of Abbey Church of S. Giovanni Evangelista in Parma, Italy. Applied Sciences. 2022; 12(10):4810. https://doi.org/10.3390/app12104810
Chicago/Turabian StyleCasoli, Antonella, Pier Paolo Lottici, and Danilo Bersani. 2022. "A Study on Correggio Wall Paintings: Characterization of Technique and Materials of Abbey Church of S. Giovanni Evangelista in Parma, Italy" Applied Sciences 12, no. 10: 4810. https://doi.org/10.3390/app12104810
APA StyleCasoli, A., Lottici, P. P., & Bersani, D. (2022). A Study on Correggio Wall Paintings: Characterization of Technique and Materials of Abbey Church of S. Giovanni Evangelista in Parma, Italy. Applied Sciences, 12(10), 4810. https://doi.org/10.3390/app12104810