Article

Evaluating 3D Human Motion Capture on Mobile Devices

by
Lara Marie Reimer
1,2,*,
Maximilian Kapsecker
1,2,
Takashi Fukushima
3 and
Stephan M. Jonas
2
1
Department of Informatics, Technical University of Munich, Boltzmannstr. 3, 85748 Garching, Germany
2
Institute for Digital Medicine, University Hospital Bonn, Venusberg-Campus 1, 53127 Bonn, Germany
3
Department of Sports and Health Sciences, Technical University of Munich, Georg-Brauchle-Ring 60/62, 80992 München, Germany
*
Author to whom correspondence should be addressed.
Appl. Sci. 2022, 12(10), 4806; https://doi.org/10.3390/app12104806
Submission received: 21 March 2022 / Revised: 3 May 2022 / Accepted: 6 May 2022 / Published: 10 May 2022
(This article belongs to the Special Issue Applied Biomechanics and Motion Analysis)

Abstract

:

Featured Application

Mobile 3D motion capture frameworks can be integrated into a variety of mobile applications. Of particular interest are applications in the sports, health, and medical sector, where they enable use cases such as tracking of specific exercises in sports or rehabilitation, or initial health assessments before medical appointments.

Abstract

Computer-vision-based frameworks enable markerless human motion capture on consumer-grade devices in real-time. They open up new possibilities for application, such as in the health and medical sector. So far, research on mobile solutions has been focused on 2-dimensional motion capture frameworks. 2D motion analysis is limited by the viewing angle of the positioned camera. New frameworks enable 3-dimensional human motion capture and can be supported through additional smartphone sensors such as LiDAR. 3D motion capture promises to overcome the limitations of 2D frameworks by considering all three movement planes independent of the camera angle. In this study, we performed a laboratory experiment with ten subjects, comparing the joint angles in eight different body-weight exercises tracked by Apple ARKit, a mobile 3D motion capture framework, against a gold-standard system for motion capture: the Vicon system. The 3D motion capture framework exposed a weighted Mean Absolute Error of 18.80° ± 12.12° (ranging from 3.75° ± 0.99° to 47.06° ± 5.11° per tracked joint angle and exercise) and a Mean Spearman Rank Correlation Coefficient of 0.76 for the whole data set. The data set shows a high variance of those two metrics between the observed angles and performed exercises. The observed accuracy is influenced by the visibility of the joints and the observed motion. While the 3D motion capture framework is a promising technology that could enable several use cases in the entertainment, health, and medical area, its limitations should be considered for each potential application area.

1. Introduction

Human Motion Capture (HMC) is a highly researched field and covers the detection of all kinds of human motion, including movements of the whole body or smaller parts such as the face or hands [1]. In their publications from 2001 and 2006, Moesland et al. found more than 450 publications researching vision-based HMC and analysis [1,2], not considering HMC using different technologies such as inertial or magnetic sensors.
Traditional HMC systems are bound to an off-field setting [3,4] and are expensive in installation and operation [5,6], limiting their application to professional use cases. In their review of motion capture systems in 2018, van der Kruk and Reijne identified five types of motion capture systems: Optoelectronic Measurement Systems (OMS), Inertial Sensor Measurement Systems, Electromagnetic Measurement Systems (EMS), Ultrasonic Localization Systems (ULS), and Image Processing Systems (IPS) [7]. They introduce OMS as the gold standard for motion capture [7]. Indeed, many studies [8,9,10,11,12,13] used OMS such as the Vicon motion capture system (Vicon, Oxford, UK) [14] or the Qualisys motion capture system (Qualisys AB, Göteborg, Sweden) [15] as reference measurement systems in their studies. OMS require multiple cameras or sensors around a subject and reflection markers on the subject’s anatomical landmarks, which are then captured by the cameras or sensors. The Inertial Measurement Sensor Systems rely on Inertial Measurement Units (IMU), which are placed on the subject’s body to capture motion and mapped onto a rigid-body model. Examples for IMU-based systems are the Xsens systems (Xsens Technologies B.V., Enschede, The Netherlands) [16] or Perception Neuron (Noitom Ltd., Miami, FL, USA) [17]. Through the traveling time of electromagnetic or ultrasonic waves between a tagged person and a base station, EMS and ULS track the position of the subject [7,18]. In contrast to the other systems, these systems allow tracking one or more subjects’ positions, but do not capture joint kinematics [7]. While the described systems are well-validated systems for HMC, their complex setup and costs prevent them from application in mHealth applications. With the advancements in technology and machine learning, IPS became more relevant in human motion capture. IPS rely on video input and different machine learning approaches to detect specific body landmarks and capture human motion. Among the most researched systems is Kinect (Microsoft Corp., Redmond, WA, USA), which uses a combination of an RBG-camera and infrared sensors and can capture motion in 3-dimensional space [10,11]. However, the Kinect still requires a specialized setup for motion capture. The offer of IPS has been extended by recent advances in technology, such as enhanced sensors and processing units. These advances enable computer-vision-based motion capture on smartphones and tablets. These IPS systems offer new possibilities for HMC in mobile scenarios such as in mHealth applications. Examples for IPS software which can run on mobile devices are OpenPose (CMU, Pittsburgh, PA, USA) [19], ARKit (Apple Inc., Cupertino, CA, USA) [20], Vision (Apple Inc., Cupertino, CA, USA) [21], and TensorFlow Pose Estimate (Google, Mountain View, CA, USA) [22]. All of these IPS can be integrated into custom applications by developers. The detection of the human body and its position is realized through computer-vision algorithms, which can use Convolutional Neural Networks (CNNs) or Part Affinity Fields (PAFs) [23]. In most systems, a predefined humanoid model is then applied to estimate the shape and kinematic structure of the tracked person [2]. The algorithms deliver the joint coordinates in two or three dimensions for every video frame.
Moeslund et al. identified three main use cases for HMC: (1) surveillance of crowds and their behavior, (2) controlling software through specific movements or gestures or controlling virtual characters in the entertainment industry such as in movies, and (3) analysis of motion for diagnostics, for example in orthopedic patients or performance improvements in athletes [2]. While use case (1) focuses on tracking multiple subjects, (2) and (3) focus on capturing body motion of a single subject and thus require tracking of several parts of the human body. Especially use case (3) offers several applications of HMC, which are often limited to professional use cases such as gait analysis [24] or sports applications [7] due to the lack of a reliable, accessible, and low-priced solution in on-field settings.
In the sports and health sector, the usage of mobile applications has significantly increased in the past years [25,26]. Research has shown that such apps can positively impact their user’s health and lifestyle [27]. However, most fitness and health apps only allow limited tracking and analysis of motion [28]. While smartphone-based motion capture promises a lightweight and consumer-friendly motion capture and analysis, the software systems have only been evaluated to a limited extent. Moreover, research has been focused on 2D systems. Several studies have shown that in 2D-motion analysis, the reliability and validity of the kinematic measurements are dependent on the performed task, which reliability is measured, video quality, and position of the recording device [8,13,29,30]. Especially the camera position influences the accuracy of tracked joint angles. A slightly different viewing angle already distorts the result of the joint angle, which is why triangulation with multiple devices is often performed to overcome the limitations of monocular camera setups [31]. Among mobile 2D motion capture systems, the OpenPose software is widely used and evaluated in several studies [19,23,30,32,33,34,35,36,37]. The results show that OpenPose delivers accurate biomechanical measurements, especially when tracking the joint trajectories. However, the compared joint angles differed significantly from the gold standard systems. D’Antonio et al. measured up to 9.9 degrees difference in the minima and maxima of the tracked joint angles during gait analysis [35], Nakano et al. experienced deviations of more than 40 mm in their study [37]. The measuerements can by improved by using multiple devices to calculate the body position in 3D as in the study by Zago et al. [30]. Mobile 2D motion capture systems have been recently complemented by 3D motion capture algorithms, which estimate the 3D joint positions based on 2D monocular video data [20,38,39,40,41,42]. They detect and calculate the body’s joint coordinates in all three movement planes, making the motion capture more robust against the camera’s viewing angle. Mobile 3D motion capture frameworks could overcome the limitations of 2D motion capture systems. Some of the 3D motion capture frameworks use additional smartphone sensors such as integrated accelerometers to determine the smartphone’s position or depth sensors such as the integrated Light Detection and Ranging (LiDAR) depth sensor to additionally enhance the position detection of the human body [20,38,39]. The LiDAR data can be used to create a dense depth map from an RGB image through depth completion [43]. Among the most well-known mobile 3D motion capture systems is Apple ARKit, which released a body-tracking feature as part of their Software Development Kit (SDK) for developers in 2019 [20]. In contrast to other 3D motion capture frameworks, ARKit is free and easy to use, and widely accessible. On the latest devices, it uses the smartphone’s IMUs and integrated LiDAR sensor to improve the measurements, promising enhanced mobile motion capture. However, only a few scientific studies have evaluated the accuracy of mobile 3D motion capture frameworks and ARKit in particular. Studies mostly focused on evaluating the lower extremity tracking of ARKit [44,45].
Due to the 3D calculations, ARKit is a promising IPS software that has the potential to enable new use cases for mobile HMC previously limited to traditional HMC systems. This research evaluated ARKit’s performance against the Vicon system in a laboratory experiment in eight exercises targeting the whole body. We investigate the following two research questions:
  • RQ 1: How accurate is ARKit’s human motion capture compared to the Vicon system?
  • RQ 2: Which factors influence ARKit’s motion capture results?

2. Materials and Methods

2.1. Study Overview

To evaluate Apple ARKit’s body tracking accuracy, we performed a laboratory experiment in which we compared the joint angles detected ARKit against the joint angles detected by the Vicon System for marker-based, optical motion tracking. In the experiment, ten subjects were instructed to perform eight different body-weight exercises with ten repetitions each, resulting in 80 recorded exercises.
During the exercises, the complete body of the subjects was recorded using the Vicon system and two iPads running ARKit from two different perspectives. All exercises were recorded simultaneously with the Vicon system and the two iPads. The study focused on comparing the motion capture data of each iPad against the data of Vicon to answer the underlying research questions. We calculated the weighted Mean Absolute Error (wMAE) and Spearman Rank Correlation Coefficient (SRCC) between the two systems in our data analysis. In addition, we performed factor analysis using ANOVA, t-tests, and logistic regression to quantify the impact of specific factors on the accuracy of the ARKit performance.

2.2. Participants

We included ten subjects ( n = 10 ) in the study, six males and four females. Their age ranged from 22 to 31 years, with an average of 25.7 years. The subjects’ height ranged between 156 cm and 198 cm with an average of 176 cm, and their weight was between 53 kg and 90 kg, with an average of 69.5 kg. All subjects had a normal body mass index between 20.4 and 25.5 (average: 22.7) and light skin color. All subjects were in good physical condition and did not have any orthopedic or neurological impairments.

2.3. Ethical Approval and Consent to Participate

The study was conducted according to the guidelines of the Declaration of Helsinki. The ethics proposal was submitted to and approved by the Ethics Committee of the Technical University of Munich on 19 August 2021—Proposal 515/21 S. All participants were informed about the process of the study upfront, and informed written consent was obtained from all subjects involved in the study. Due to the non-interventional character of this study, the risks involved for the study participants were low. We further minimized the risk through a sports scientist who supervised the physiologically correct execution of all exercises during the study, preventing the participants from performing potentially harmful movements.

2.4. Exercise Selection

Eight exercises were selected: Squat, Front Lunge, Side Squat, Single Leg Deadlift, Lateral Arm Raise, Reverse Fly, Jumping Jacks, and Leg Extension Crunch. The main objective of the exercise selection was to create a full-body workout to track all selected joints from different angles.
All exercises were tested for the suitability of tracking in both systems to ensure stable tracking of the angles. Both ARKit and the Vicon system exposed problems with the correct detection of exercises, where more extensive parts of the body were hidden from the cameras, for example, push-ups, and were therefore excluded. The testing was done in two steps: (1) We manually inspected the screen recording to see if the ARKit app model recognized the subject. (2) We checked the screen recording to whether the ARKit model overlayed with the subject’s body parts during all parts of the exercise and whether the Vicon system could track all markers in the majority of recorded frames so that the full joint trajectory could be calculated.
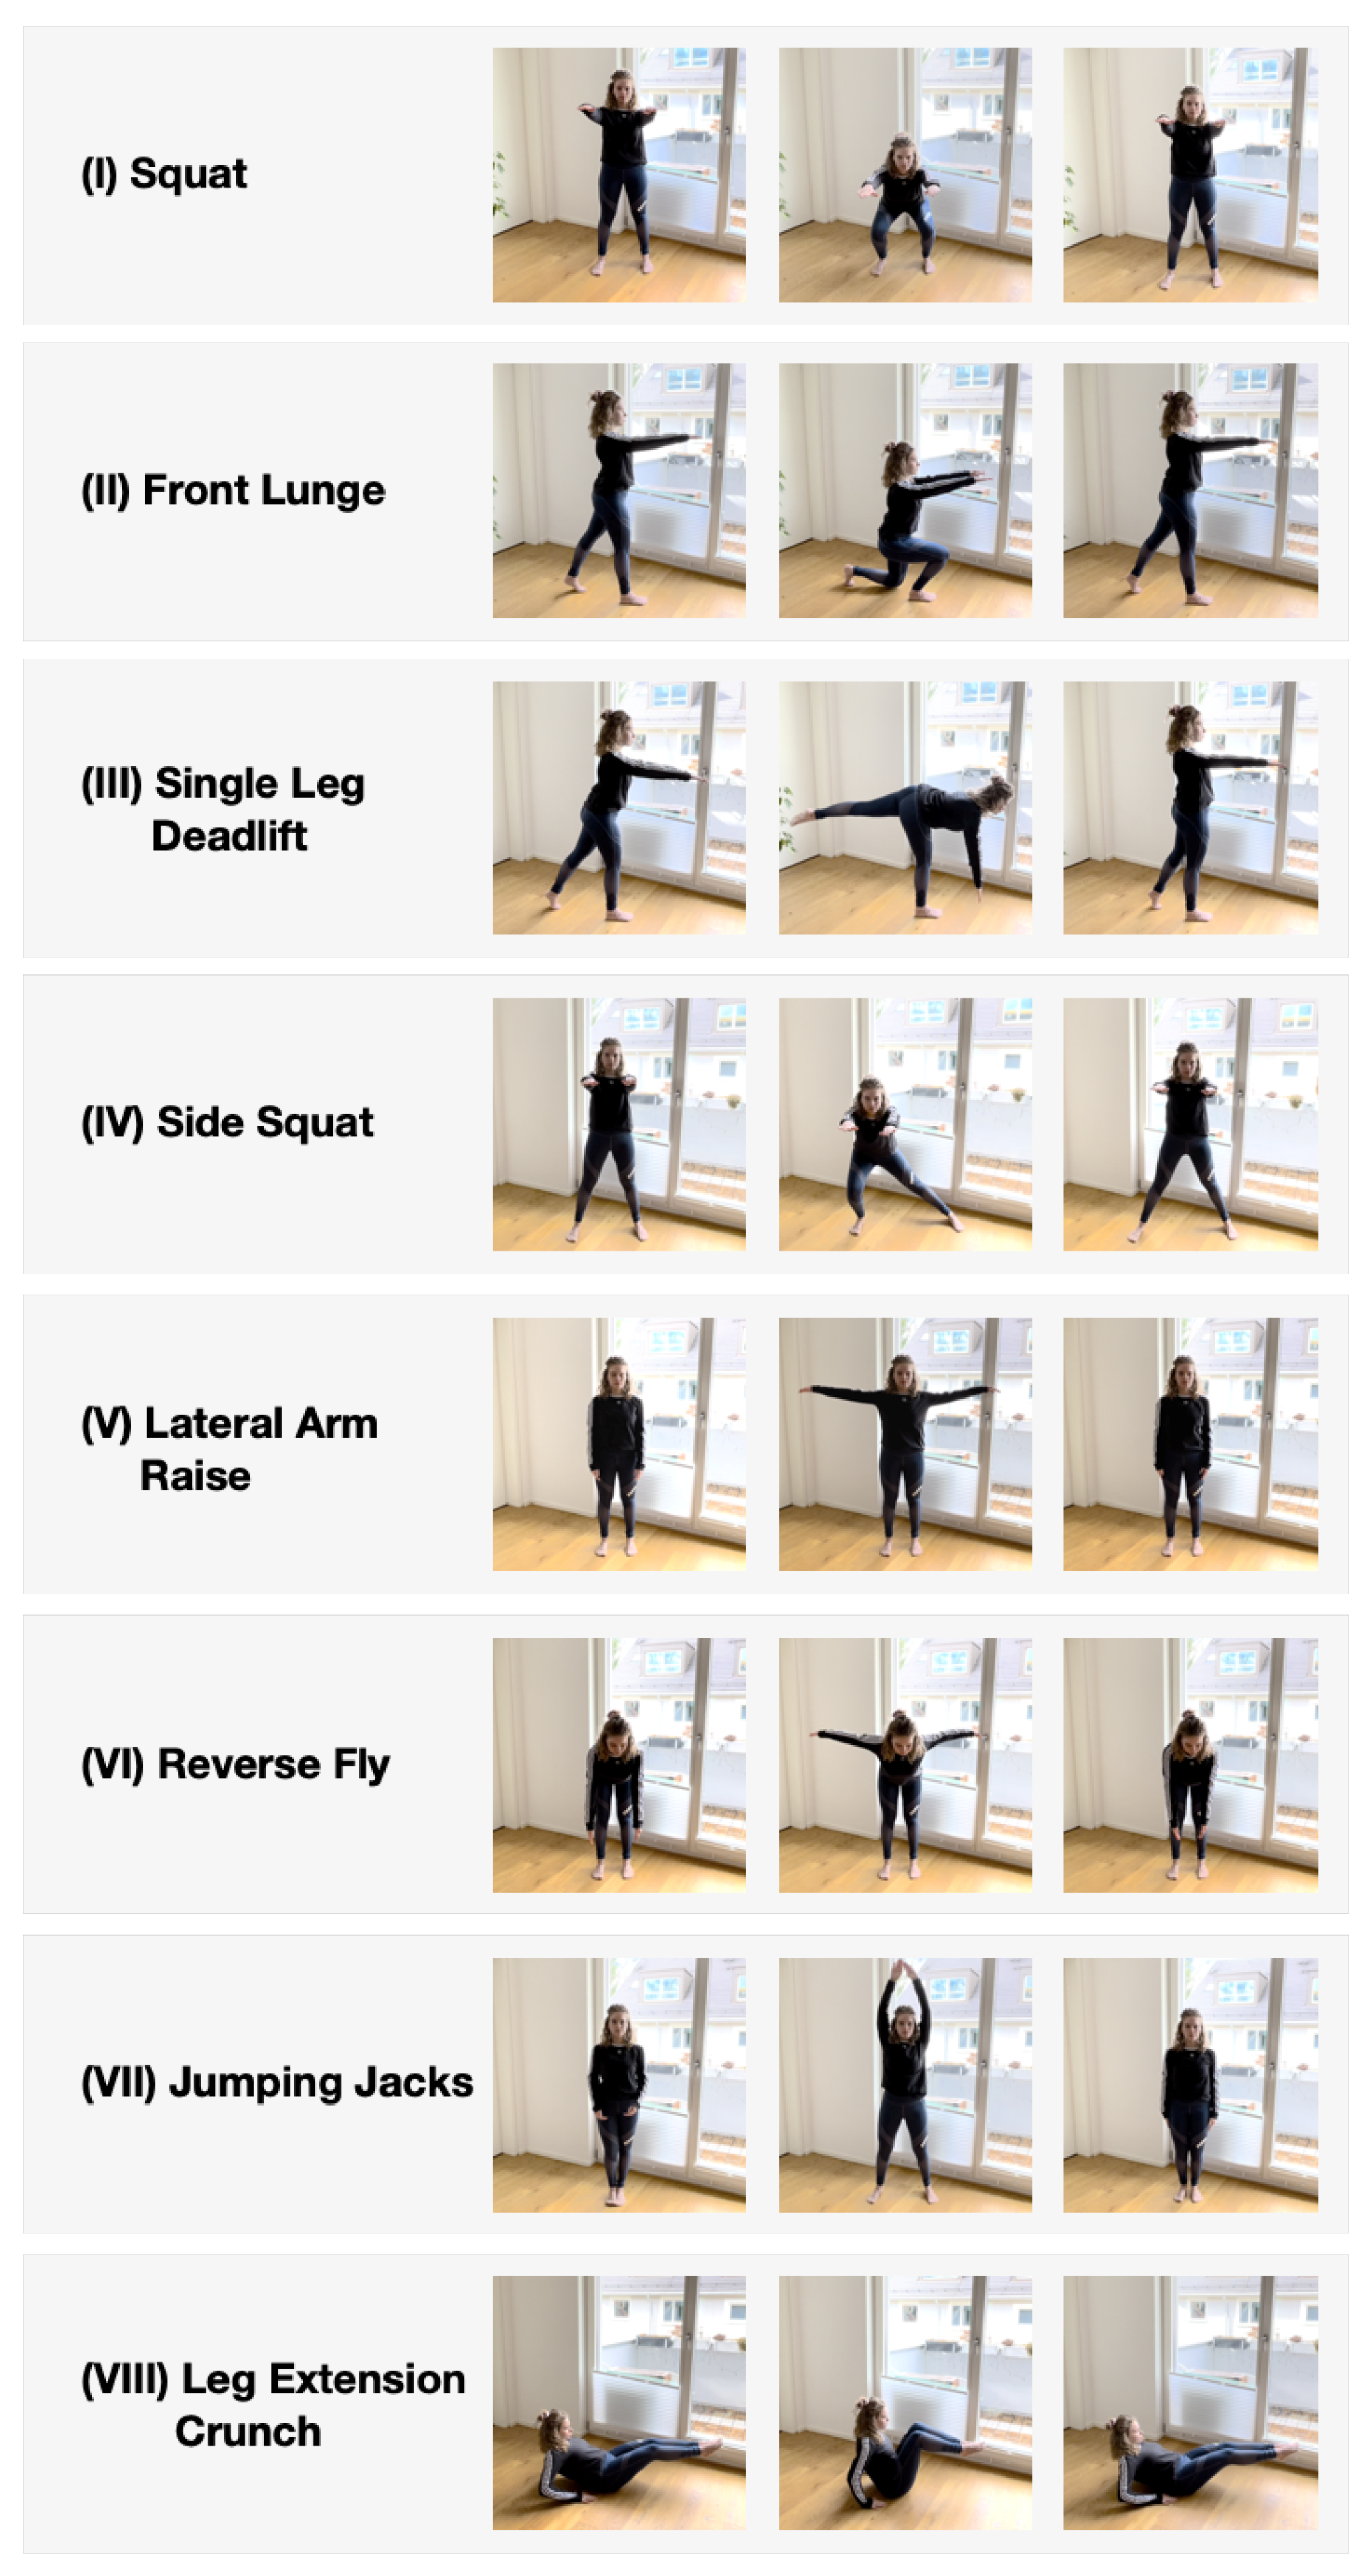
Only if both requirements were fulfilled, we selected the exercise for the study. The final exercise selection included eight exercises. Their execution (E, see Figure 1) and targeting muscle groups (TMG) are explained in the following, and tracked joint angles (TJA) are explained in the following.
(I) Squat: (E:) The subject starts this exercise in an upright standing position. The subject squats down from the starting position by flexing the ankle, knee, and hip without movement compensations such as flexing the trunk and raising the heel. Each subject was asked to hold their arms stretched in front of the body. (TMG:) This exercise targets the lower body, especially the gluteus, quadriceps, hamstrings, and calves. (TJA:) The tracked joint angles include the left and right hip, and left and right knee.
(II) Front Lunge: (E:) The starting position of the exercise is an upright standing with spreading legs front and back. The arms’ position is the same as the squat. From the starting position, the subject goes down by flexing the ankle, knee, and hip in the front leg, flexing the knee and hip, and raising the heel in the back leg. (TMG:) This exercise targets lower body muscles, especially the gluteus, quadriceps, hamstrings, and calves. (TJA:) The tracked joint angles include the left and right hip, and left and right knee.
(III) Side Squat: (E:) The starting position of the exercise is an upright standing with spreading legs laterally. The arms’ position is the same as the squat. From the starting point, the subject squats down with either side with either leg while the other leg is kept straight. (TMG:) This exercise targets similar muscle groups to squats, focusing on adductor muscles. (TJA:) The tracked joint angles include the left and right hip, and left and right knee.
(IV) Single Leg Deadlift: (E:) The starting position of the exercise is an upright standing with a single leg. The arms’ initial position is the same as in the Squat. Th subject leans forward from the starting position by flexing the hip with minimum knee flexion. As the subject leans forward, the arms should be hung in the air. The other side of the leg in the air should be extended backward to maintain balance as the subject leans forward. (TMG:) The exercise targets lower body muscles, especially the hamstring and gluteal muscles. (TJA:) The tracked joint angles include the left and right hip, and left and right knee.
(V) Lateral Arm Raise: (E:) The subject starts the exercise in an upright standing position. Then, the subject laterally abducts the arms. (TMG:) The exercise targets upper body muscles, especially the deltoid muscles. (TJA:) The tracked joint angles include the left and right shoulder, and left and right elbow.
(VI) Reverse Fly: (E:) The subject leans forward with slight knee flexion and hangs the arms in the air in a starting position. The subject horizontally abducts the arms from the position without raising the upper body. (TMG:) The exercise targets upper body muscles such as the rhomboid, posterior deltoid, posterior rotator cuff, and trapezius muscles. (TJA:) The tracked joint angles include the left and right shoulder, and left and right elbow.
(VII) Jumping Jack: (E:) This exercise starts from an upright standing position. Then, the subject abducts both sides of the legs and arms simultaneously with a hop. (TMG:) This exercise targets lower body and upper body muscles, especially the gluteal and deltoid muscles. (TJA:) The tracked joint angles include the left and right shoulder, left and right elbow, left and right hip, and left and right knee.
(VIII) Leg Extension Crunch: (E:) The subject starts this exercise by sitting down on the ground with a backward lean of the upper body. The subject should place the hands on the ground to support the upper body as leaning backward. Then, the subject brings the legs in the air with knee and hip flexion. From the position, the subject extends the knee and hip horizontally on both sides together. (TMG:) This exercise targets core muscles, especially abdominal muscles. (TJA:) The tracked joint angles include the left and right hip, and left and right knee.

2.5. Data Collection

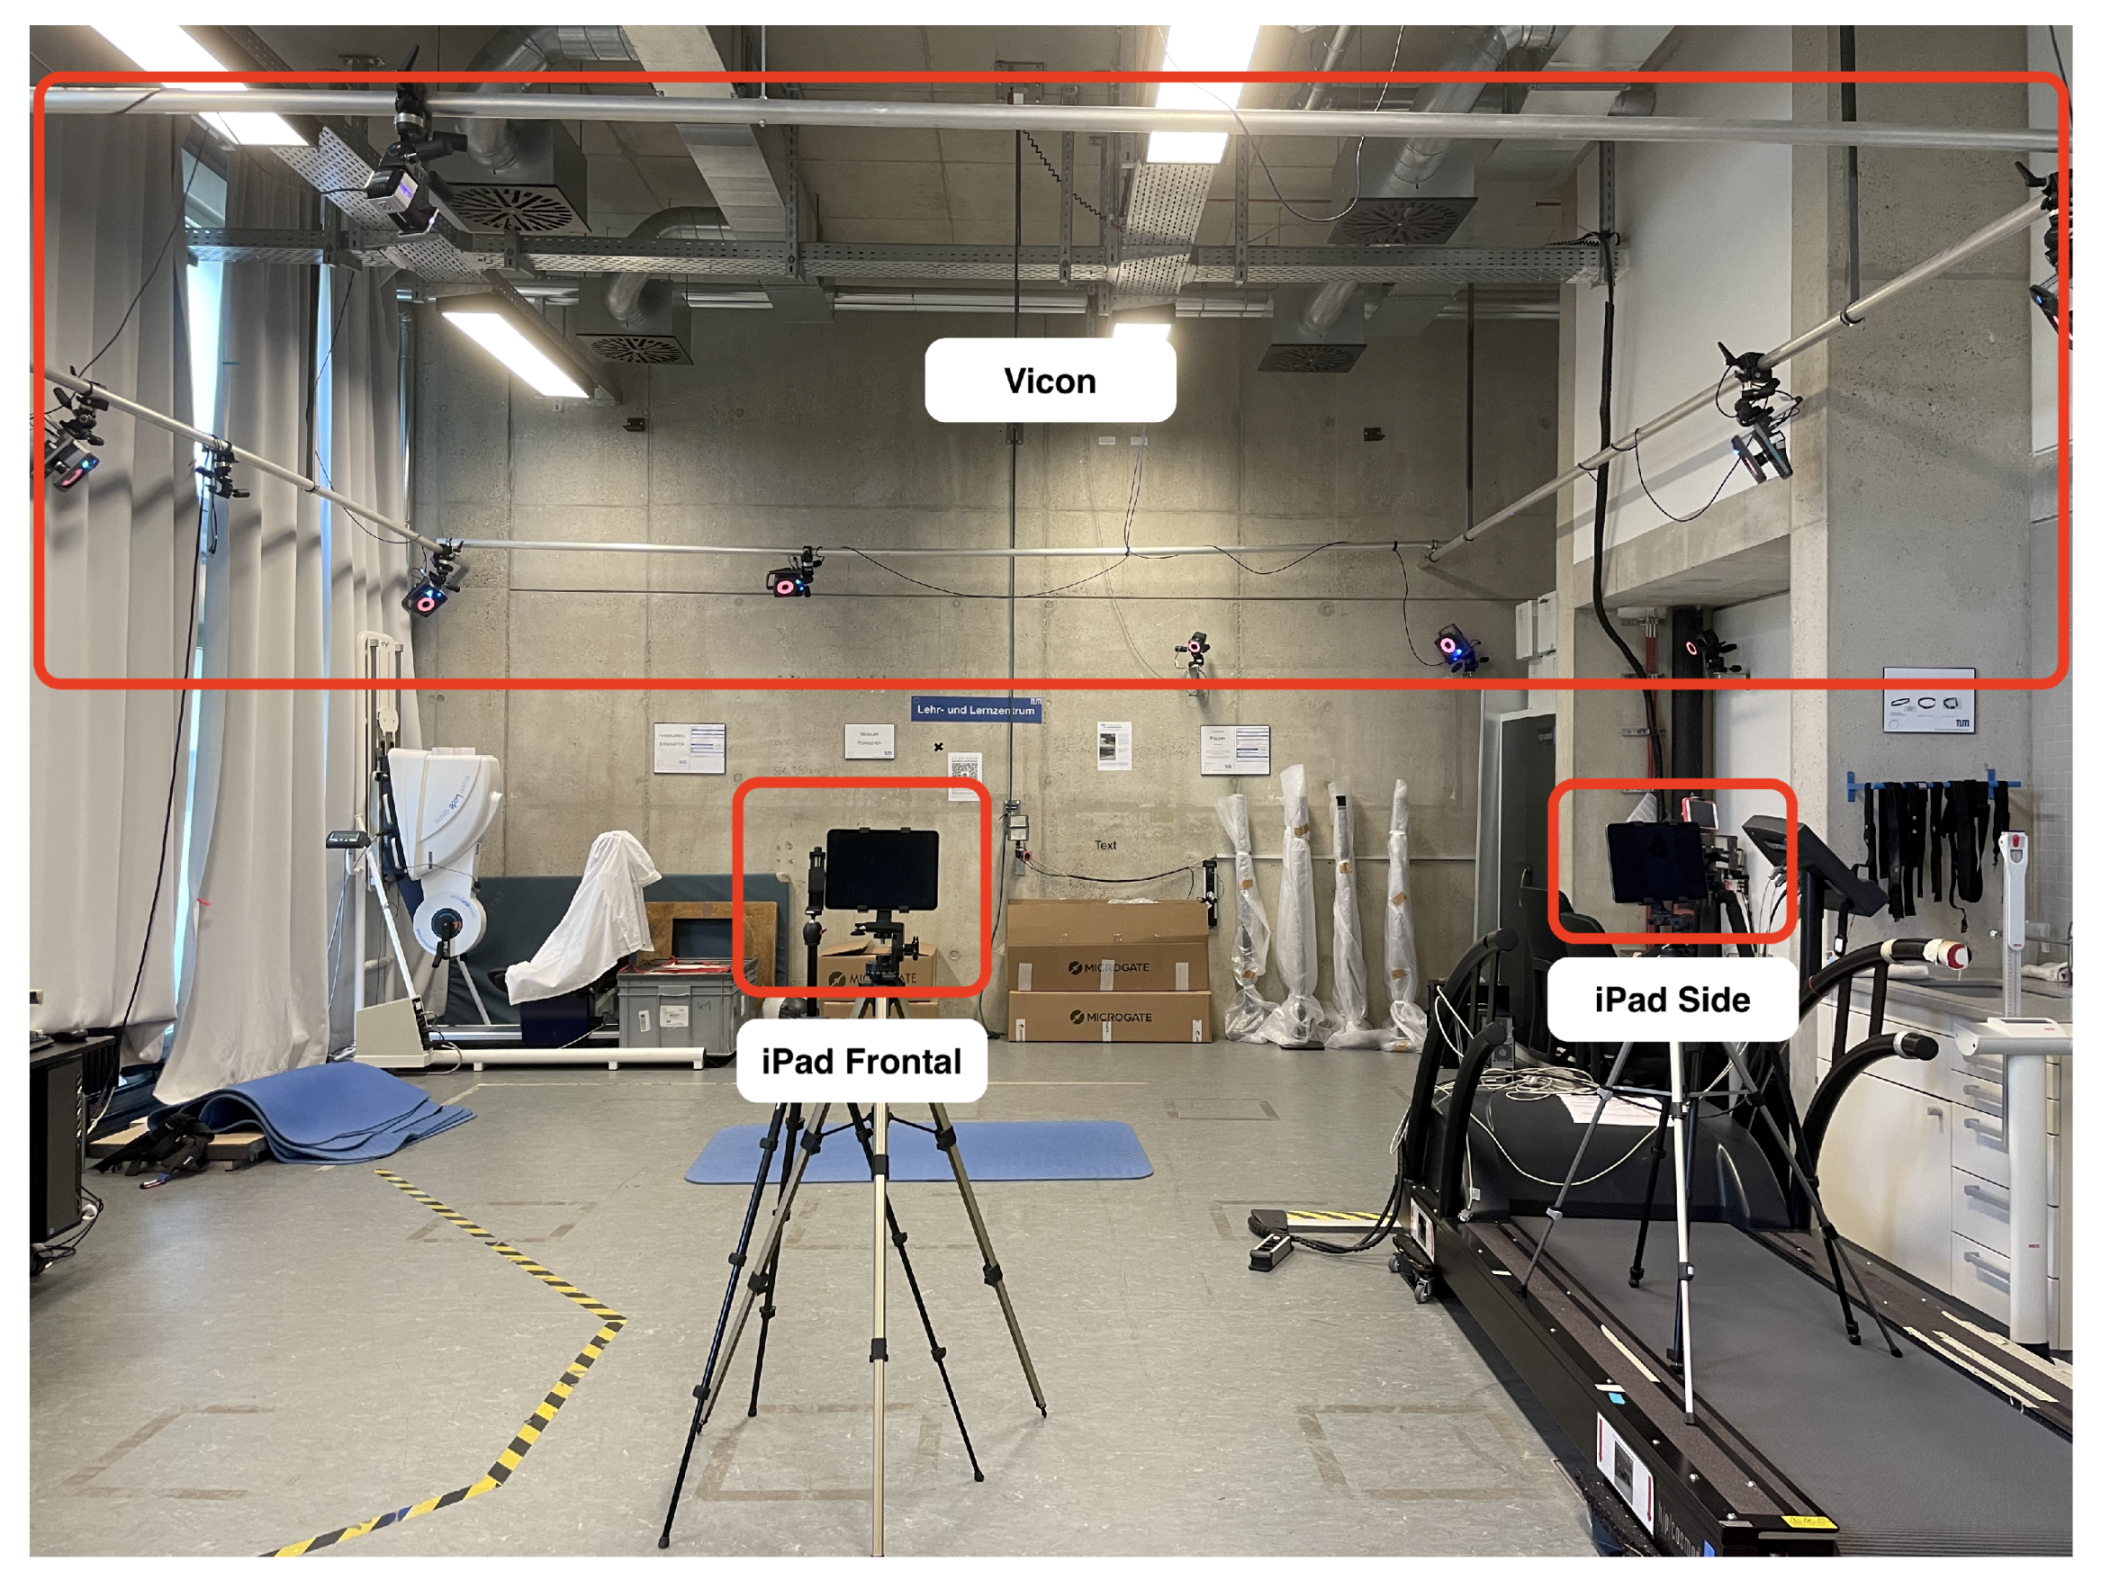
We prepared the laboratory before the subjects arrived to ensure similar conditions for all recordings. Four tripods were positioned, each of them approximately three meters away from the area of the subjects’ position to enable tracking of the entire body. Two tripods held an iPad Pro 11″ (2021 Model; Apple Inc., Cupertino, CA, USA), which were used to run the ARKit motion capture. Two other tripods were equipped with regular cameras to record videos of the experiment. One iPad and one camera were placed facing the subject’s position frontally, the other iPad and camera were placed at an approximate angle of 30° facing the subject, as shown in Figure 2. The Vicon system (Nexus 2.8.2, Version 2.0; Vicon Motion Systems Ltd., Oxford, UK) was installed on the lab ceiling and configured to track the subjects’ whole body.
We developed a protocol to guarantee a similar experiment execution for all participants. The experiment consisted of three phases: (1) the onboarding, (2) the explanation of the exercises, and (3) performing the exercises. During phase (1), the participants entered the lab. We explained the setup, and the participants signed the consent forms. In phase (2), a sports scientist explained each of the eight exercises and showed the participants how they are performed. The participants were asked to perform the exercises once under the supervision of the sports scientist to guarantee correct execution. The actual experiment was performed in phase (3). The participants performed ten repetitions of each exercise.

2.5.1. Vicon Setup

The Vicon setup consisted of 14 infrared cameras. The setup included eight MX-T10-S cameras, four Vero v2.2 cameras, and two Bonita 10 cameras. All cameras were set to a sampling frequency of 250 Hz. We used the Nexus software (version 2.8.2) with the Full-Body Plug-in Gait marker placement model provided by Vicon Motion Systems, Ltd. [46] to capture the motion. A Vicon calibration wand was used to calibrate all the Vicon cameras and determine the coordinate system. Static calibration was done by capturing a subject performing a T-pose.

2.5.2. ARKit Setup

The ARKit setup included two iPad Pro 11″ 2021 with an M1 processor and an additional LiDAR sensor for depth information. Both iPads ran a custom-developed software based on the ARKit 5 framework provided by Apple Inc., which was used for extracting the motion capture information from the iPads’ sensors. Both iPads recorded the motion capture data independently and were not synchronized. The motion capture data included the timestamp of the detection, the performed exercise, and the three-dimensional, positional information of 14 body joints. These data were later used to calculate the joint angles. All joint coordinates are given relatively to the pelvis center, which serves as the origin of ARKit’s coordinate system. ARKit differentiates between bigger joints, which are actively tracked, and calculated joints, which are smaller joints such as the toes and fingers. We decided only to include actively tracked joints in our comparison, as previous tests showed that the calculated position of the smaller joints and their related angles rarely change. The ARKit data were recorded with a default sampling frequency of 60 Hz. However, the sampling frequency of ARKit is variable, as ARKit internally only updates the joint positions when a change is detected. This means that if a subject is standing still, fewer data points are received from ARKit and more when the subject is moving fast. As the toe and finger joints are calculated by ARKit and not actively recognized, we limited the comparison to the actively tracked joints: shoulders, elbows, hips, and knees.

2.5.3. Data Export

After each recorded subject, the collected motion data were exported from the three systems: the frontally positioned iPad (iPad Frontal), the iPad set in a 30° Side Angle (iPad Side) (Figure 2), and the Vicon system. The motion data were stored in CSV files and included the joint center coordinates for each detected frame for the three systems separately. The ARKit data were exported in one file per iPad, resulting in two CSV files per subject. For the Vicon system, each exercise was stored in a separate CSV file. In addition, an XCP file was exported from the Vicon system, which contained meta-information about the cameras, including the start and end timestamps of each recording.
Due to export problems, the upper body joint coordinates of the iPad Side were only included for three of the ten subjects. The Vicon system could not track each joint coordinate throughout the whole exercise due to hidden markers, leading to gaps in the exported data. Smaller gaps were compensated during the Data Analysis, whereas more significant gaps led to the exclusion of the respective angle.

2.6. Preprocessing & Data Analysis

The basis for the data analysis part is 220 files, 22 for each subject. It contains two comma-separated value (CSV) files from the respective ARKit systems (frontal and side view) and ten CSV files from the Vicon system, which records each exercise in a separate file. The remaining ten files are given in the XCP format, which contains the relevant metadata of the Vicon system, such as camera position, the start time, and the end time of the data acquisition process. The following preprocessing steps are performed for each subject to merge all files into a data frame for further analysis.
The Vicon and ARKit data are modified to fit a matrix-like structure in which the rows represent time and columns the joints. Augmentation enhances the data with information such as the timestamp, subject, exercise, and in the case of ARKit, whether the values were recorded frontal or lateral.
The Section 2.5.1 and Section 2.5.2 explain different sampling rates for the systems and the non-equidistant sampling rate of ARKit (57 Hz on average). It motivates to evaluate strategies to merge the system’s data based on the timestamp. Vicon samples the data at a frequency of 250 Hz and implies a maximum of 2 ms distance for a randomly chosen timestamp. Due to this maximal possible deviation, the nearest timestamp is the criterion for merging the Vicon data onto the ARKit data.
The Vicon system records absolute coordinates, while the ARKit system provides normalized coordinates relative to the center of the hip. It still allows for comparing angles since they are invariant under scaling, rotating, translating, and reflecting the coordinate system. Accordingly, the adjacent three-dimensional joint coordinates extraction calculates the angles of interest (AOI). An angle θ is determined by three joints A , B , C R 3 or associated vectors v 1 = A B and v 2 = C B given the formula
θ = arccos v 1 · v 2 v 1 2 v 2 2
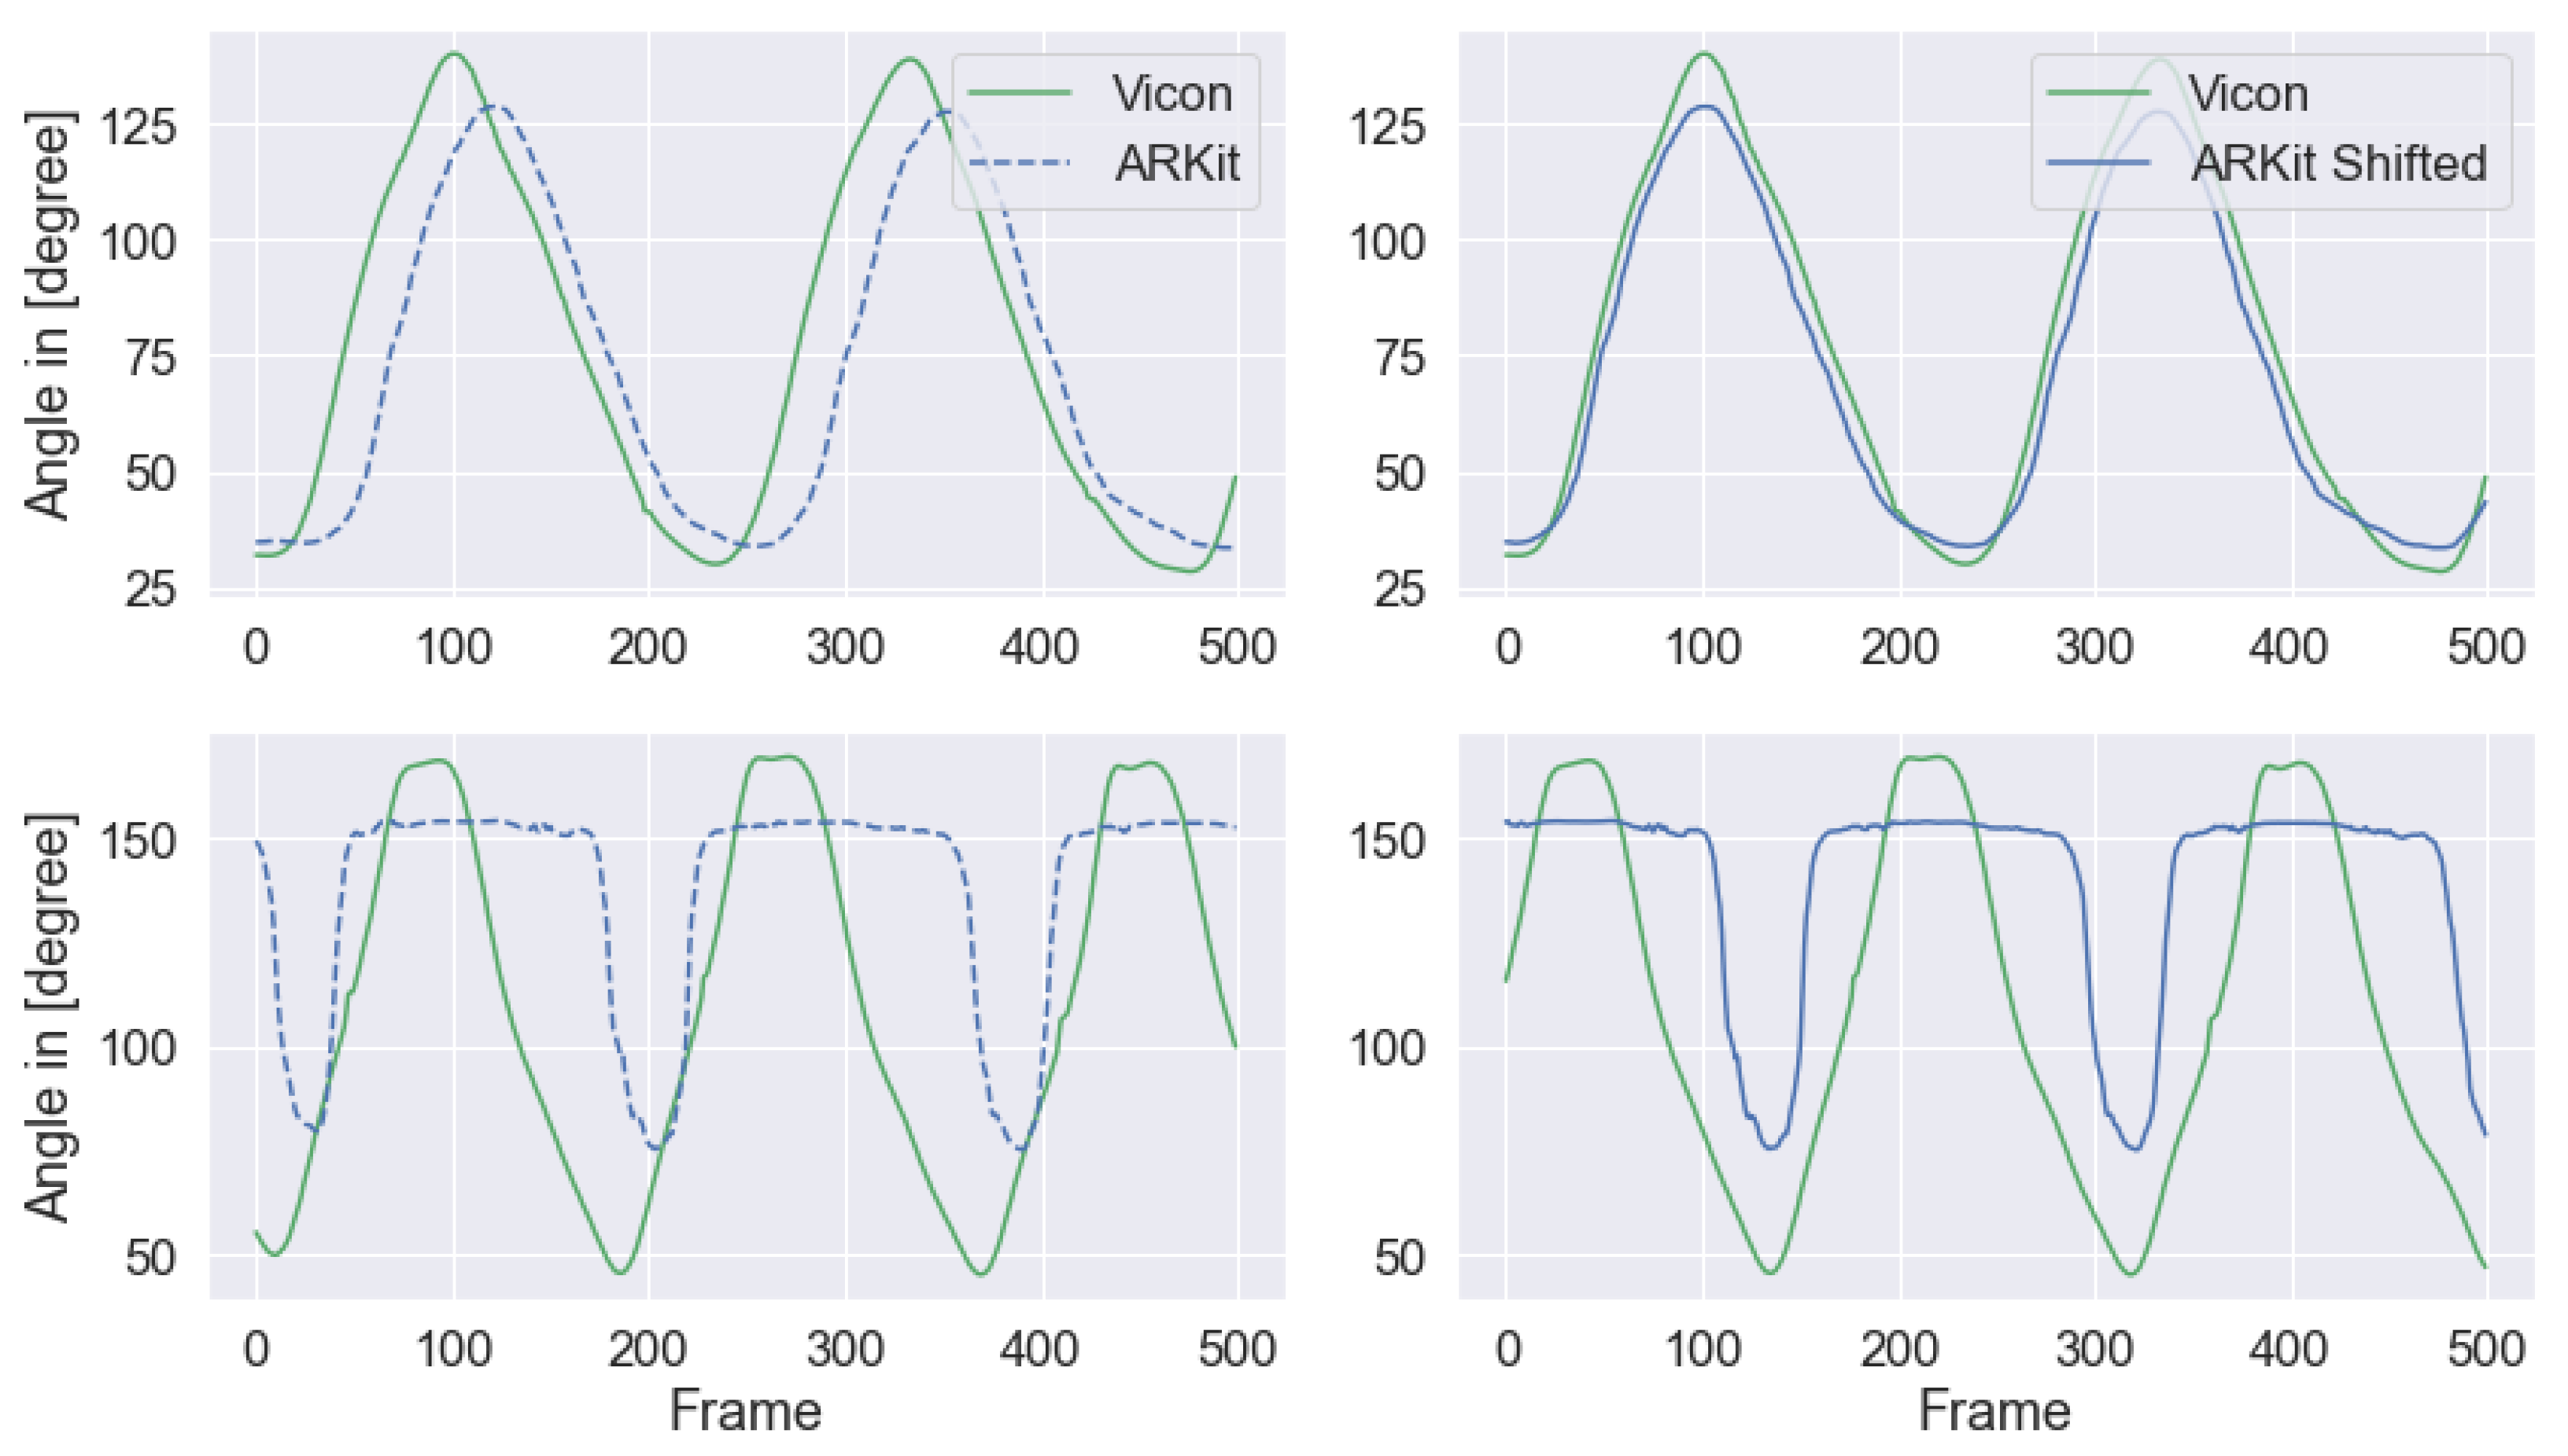
The data reveal a time lag which leads to a misalignment between the Vicon and ARKit angles along the time axis. Accordingly, the related time series require shifting with the objective to maximize the mutual Pearson correlation coefficient. The shift operation is subjected to a maximum of 60 frames to each side. It includes the assumption that the time series of the two systems match best if they exhibit similar behavior in their linear trends. Figure 3 shows two examples of misaligned time series on the left and the result of the shift on the right. The time series alignment is performed brute force and individually for any combination of view, subject, exercise, and AOI. The procedure outputs 1048 ARKit-Vicon time series pairs, 634 for the comparison Vicon—iPad Frontal, and 414 for the comparison Vicon—iPad Side. The number does not correspond to 2 × 10 × 8 × 8 = 1280 pairs due to the missing ARKit recordings of the upper body joints for lateral recording.
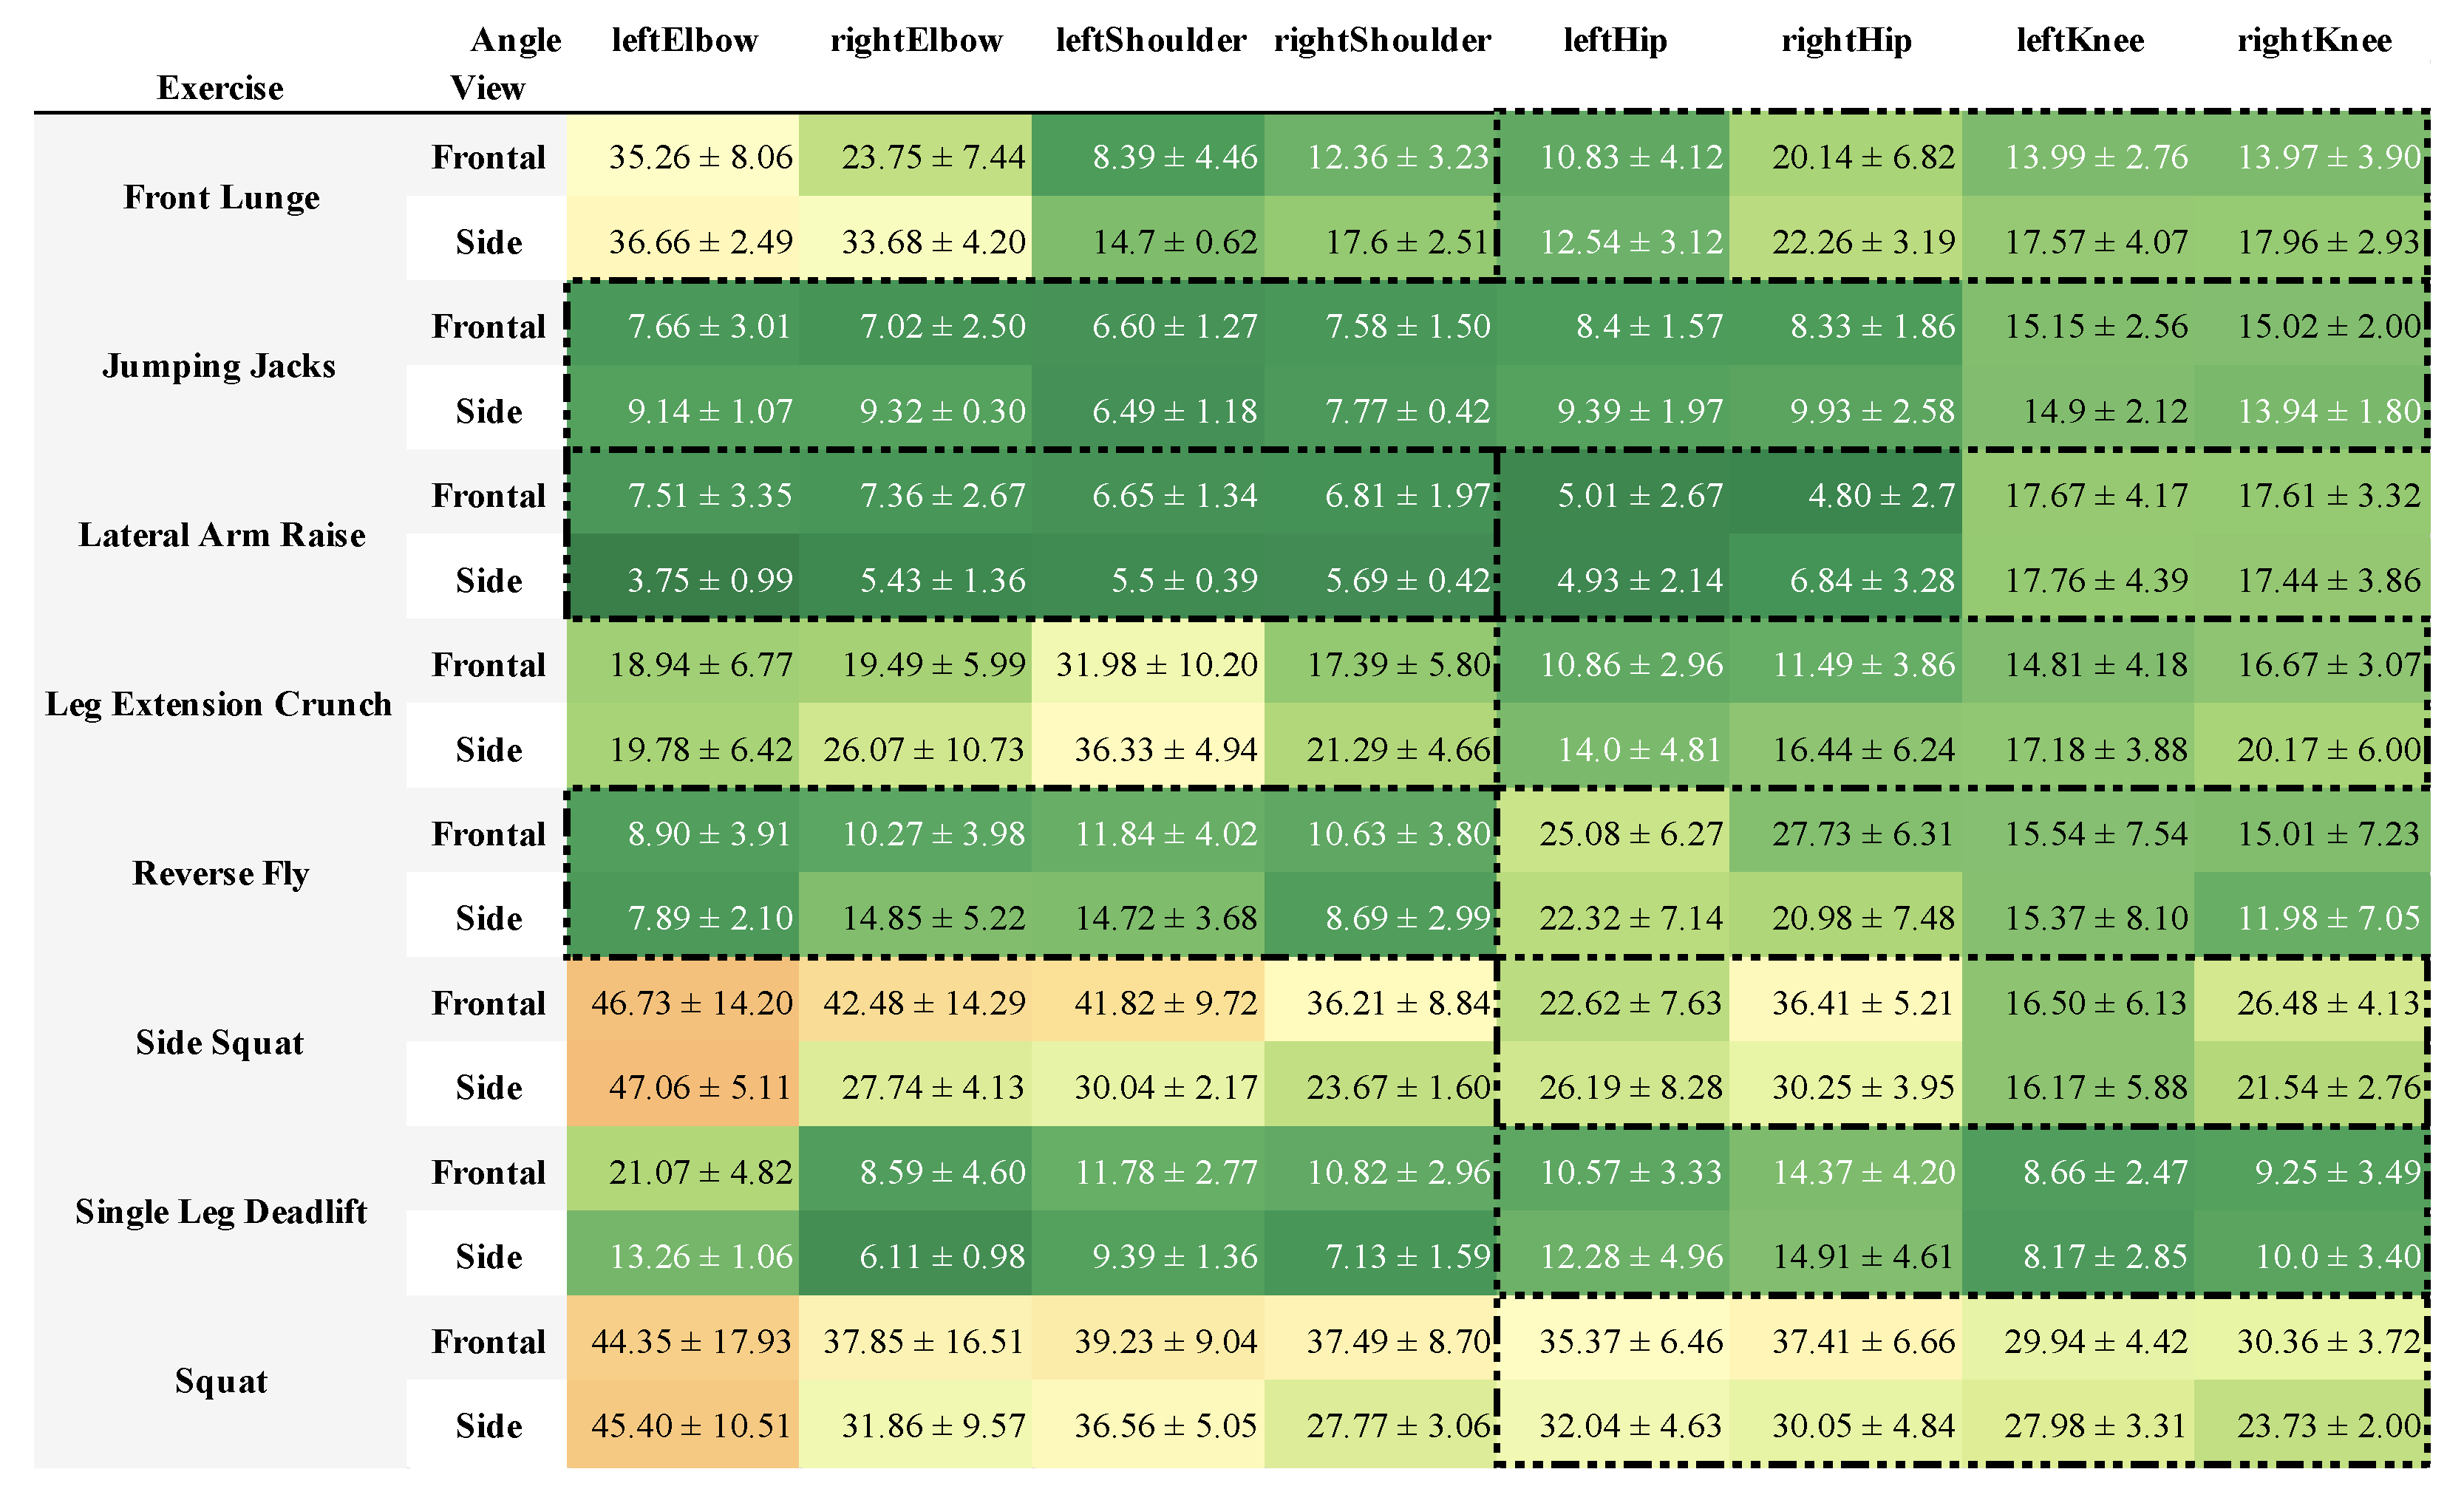
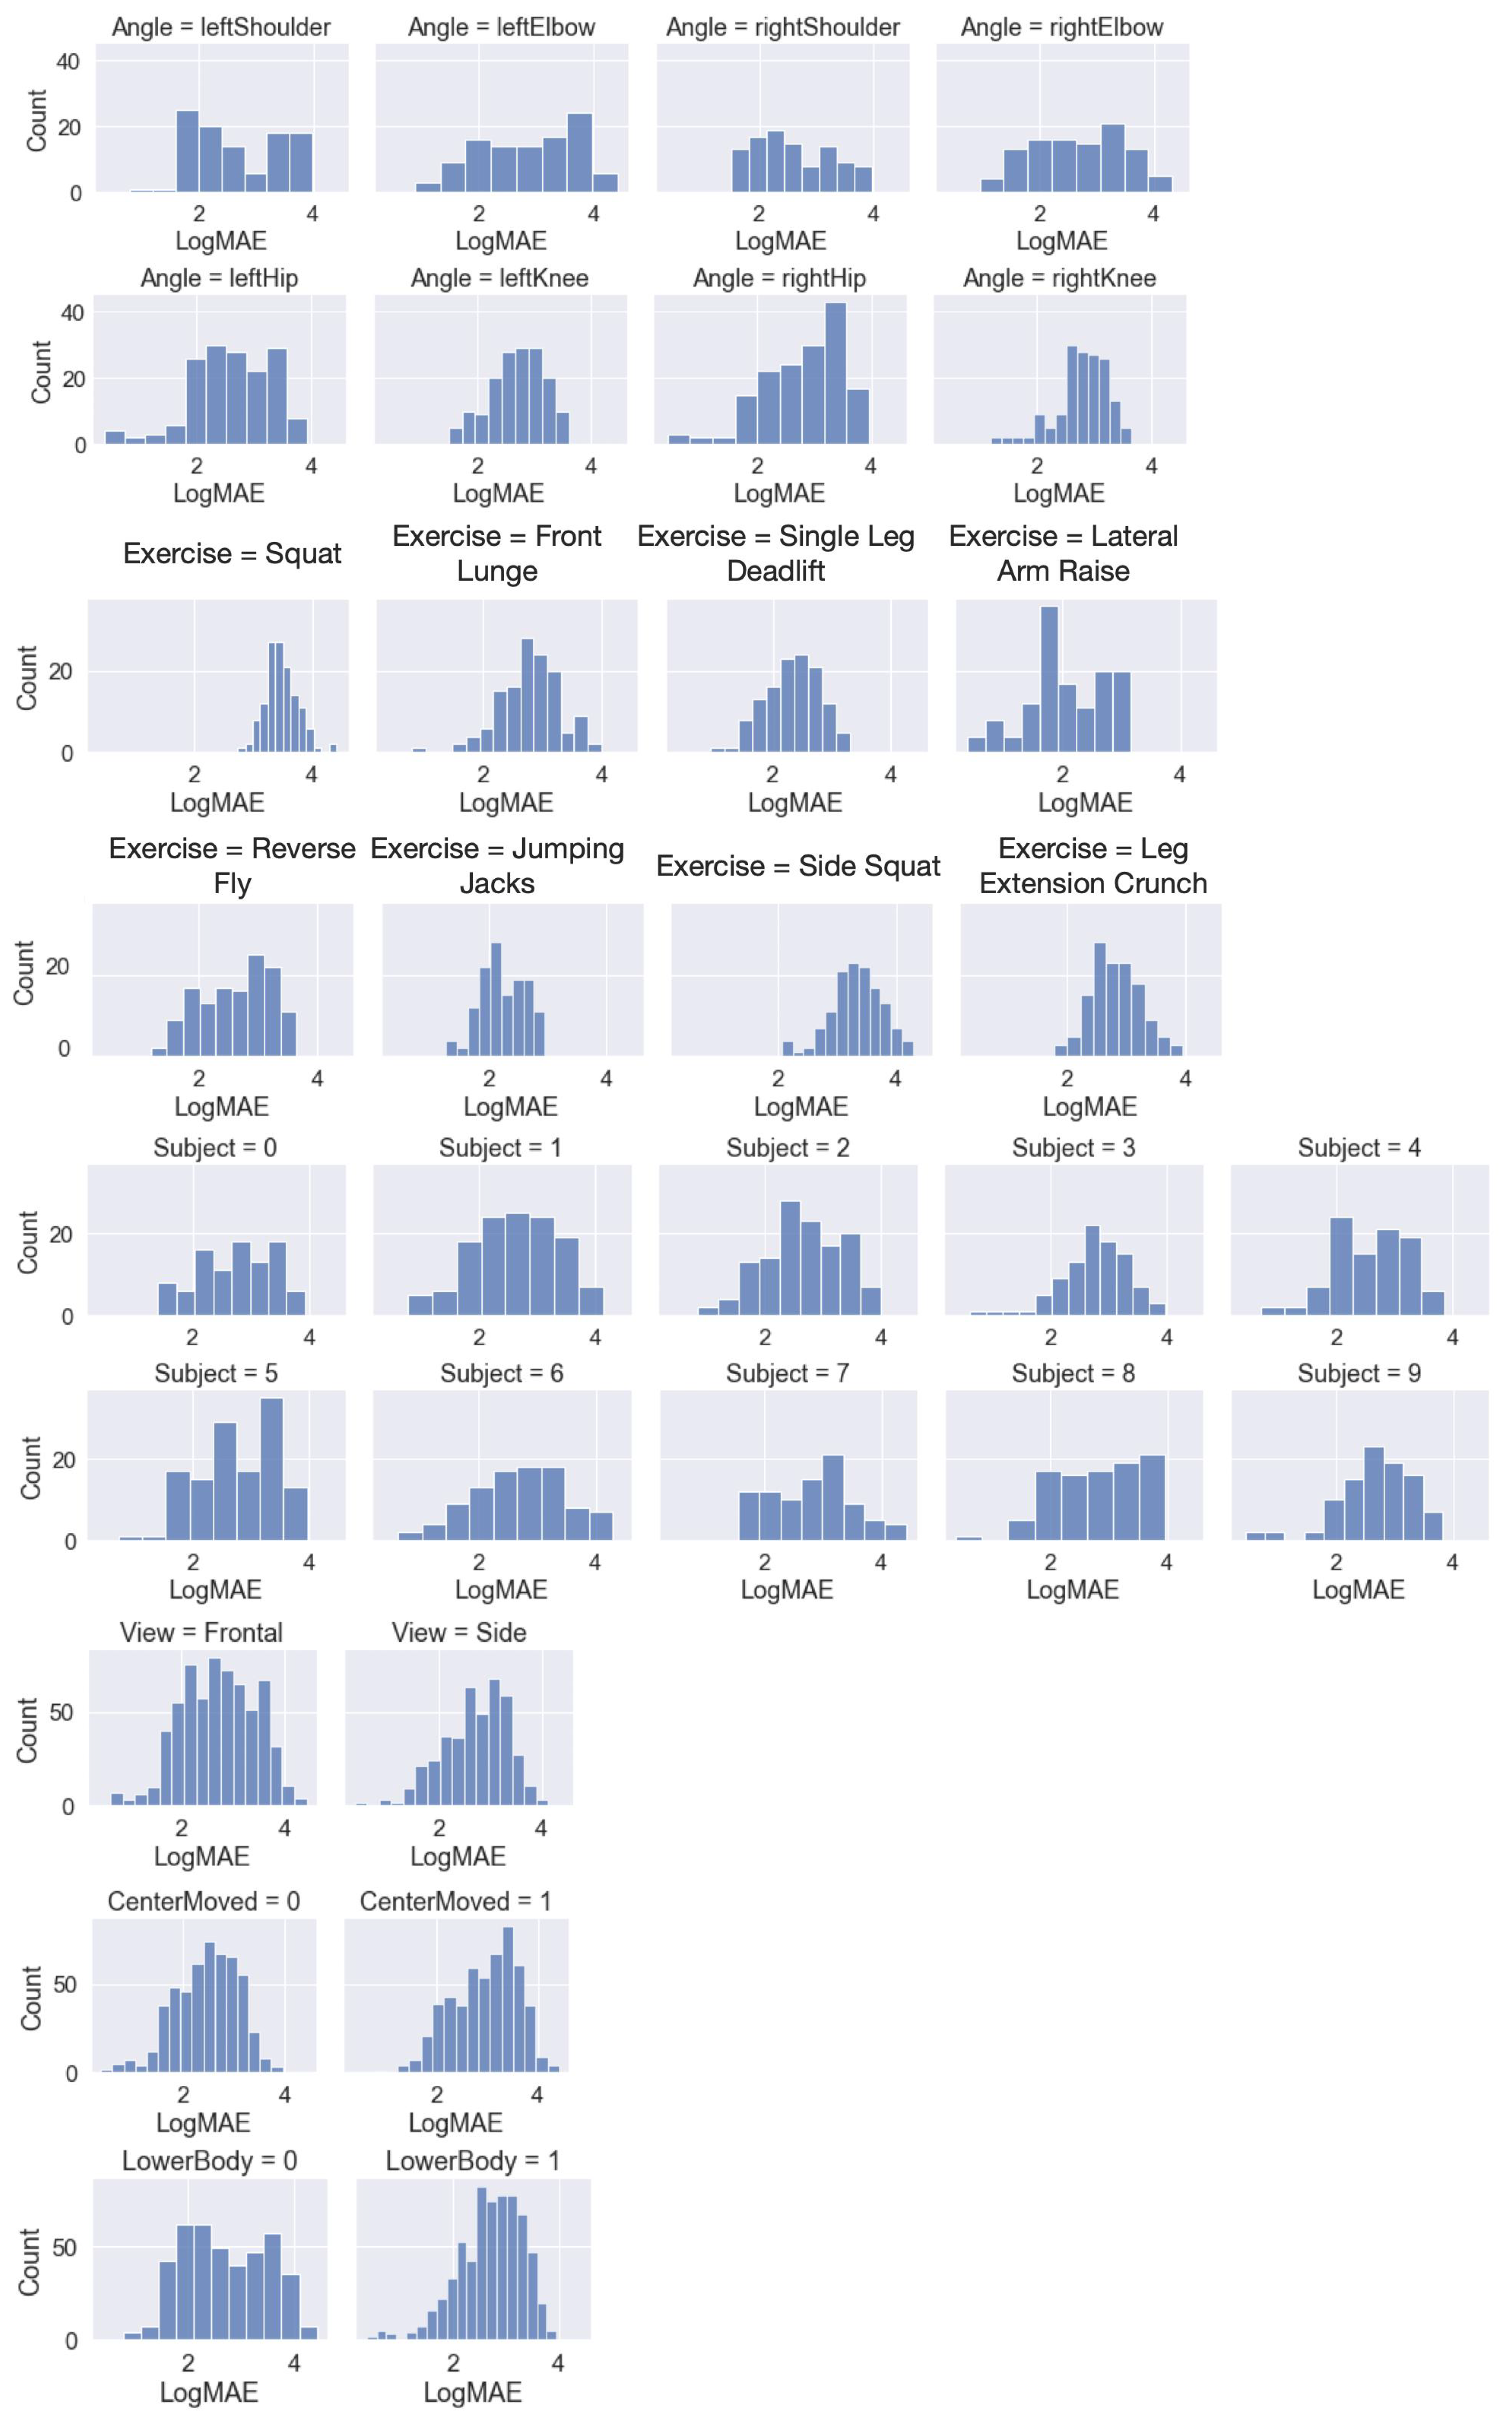
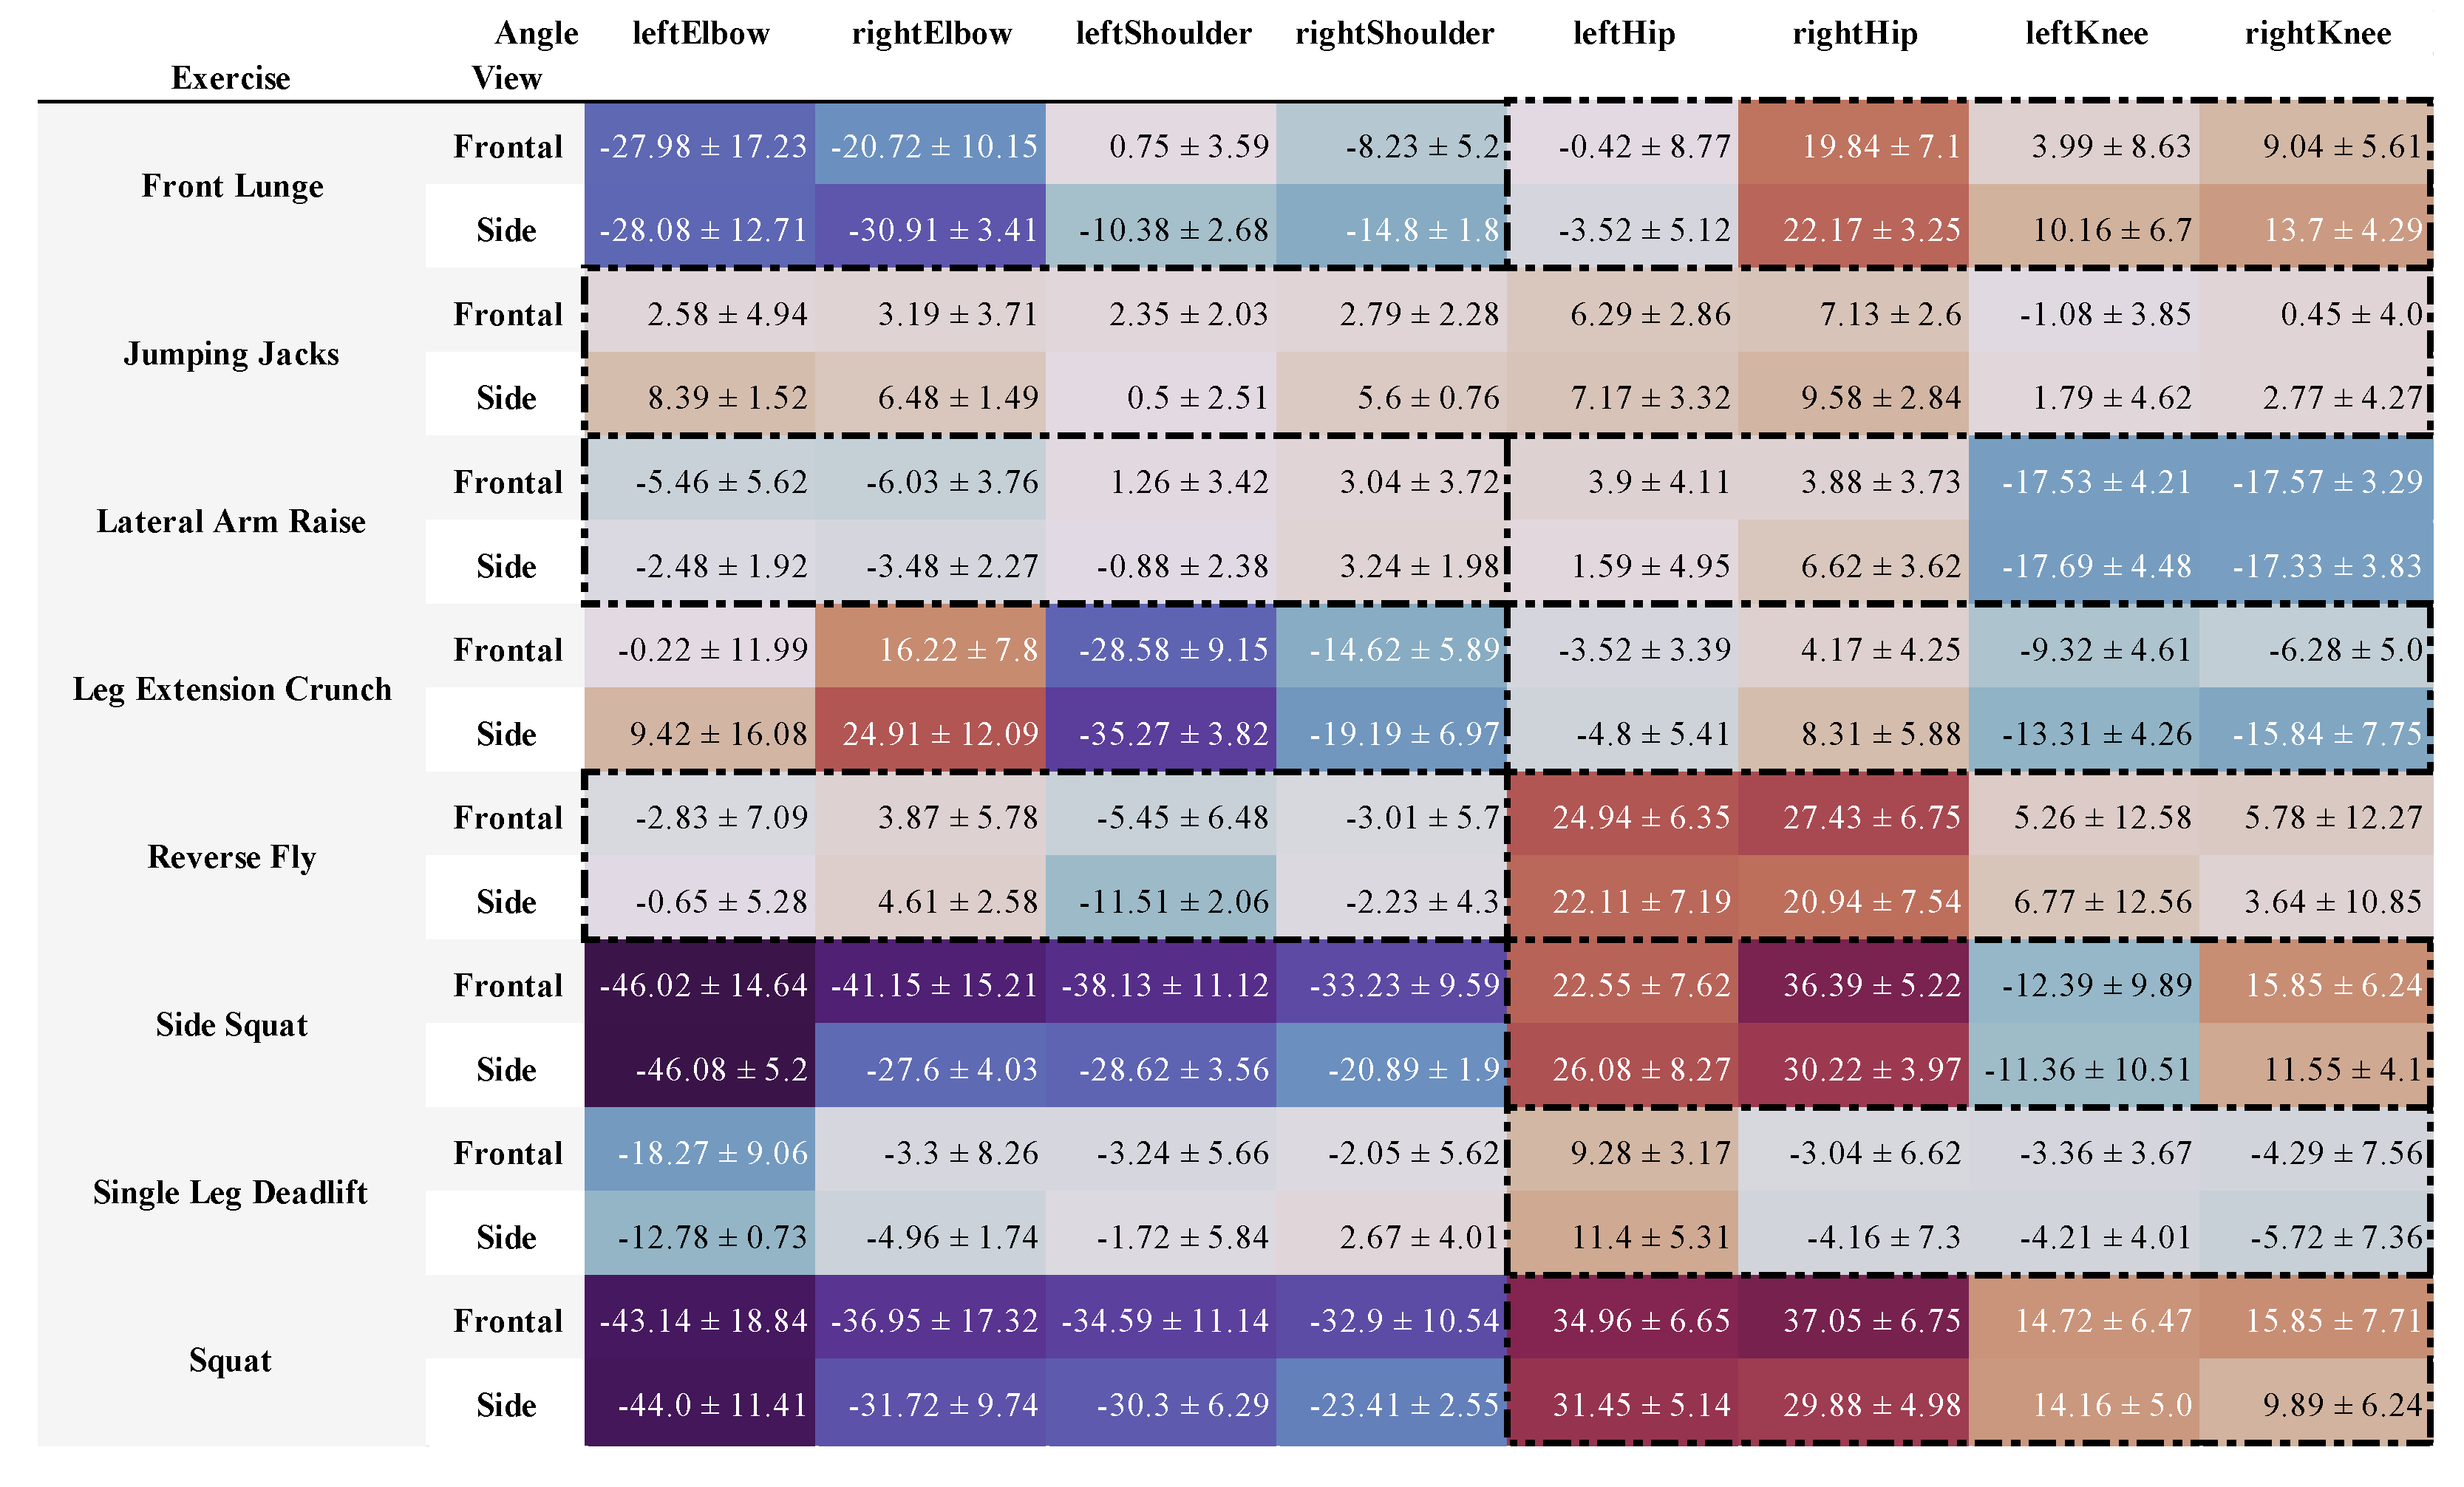
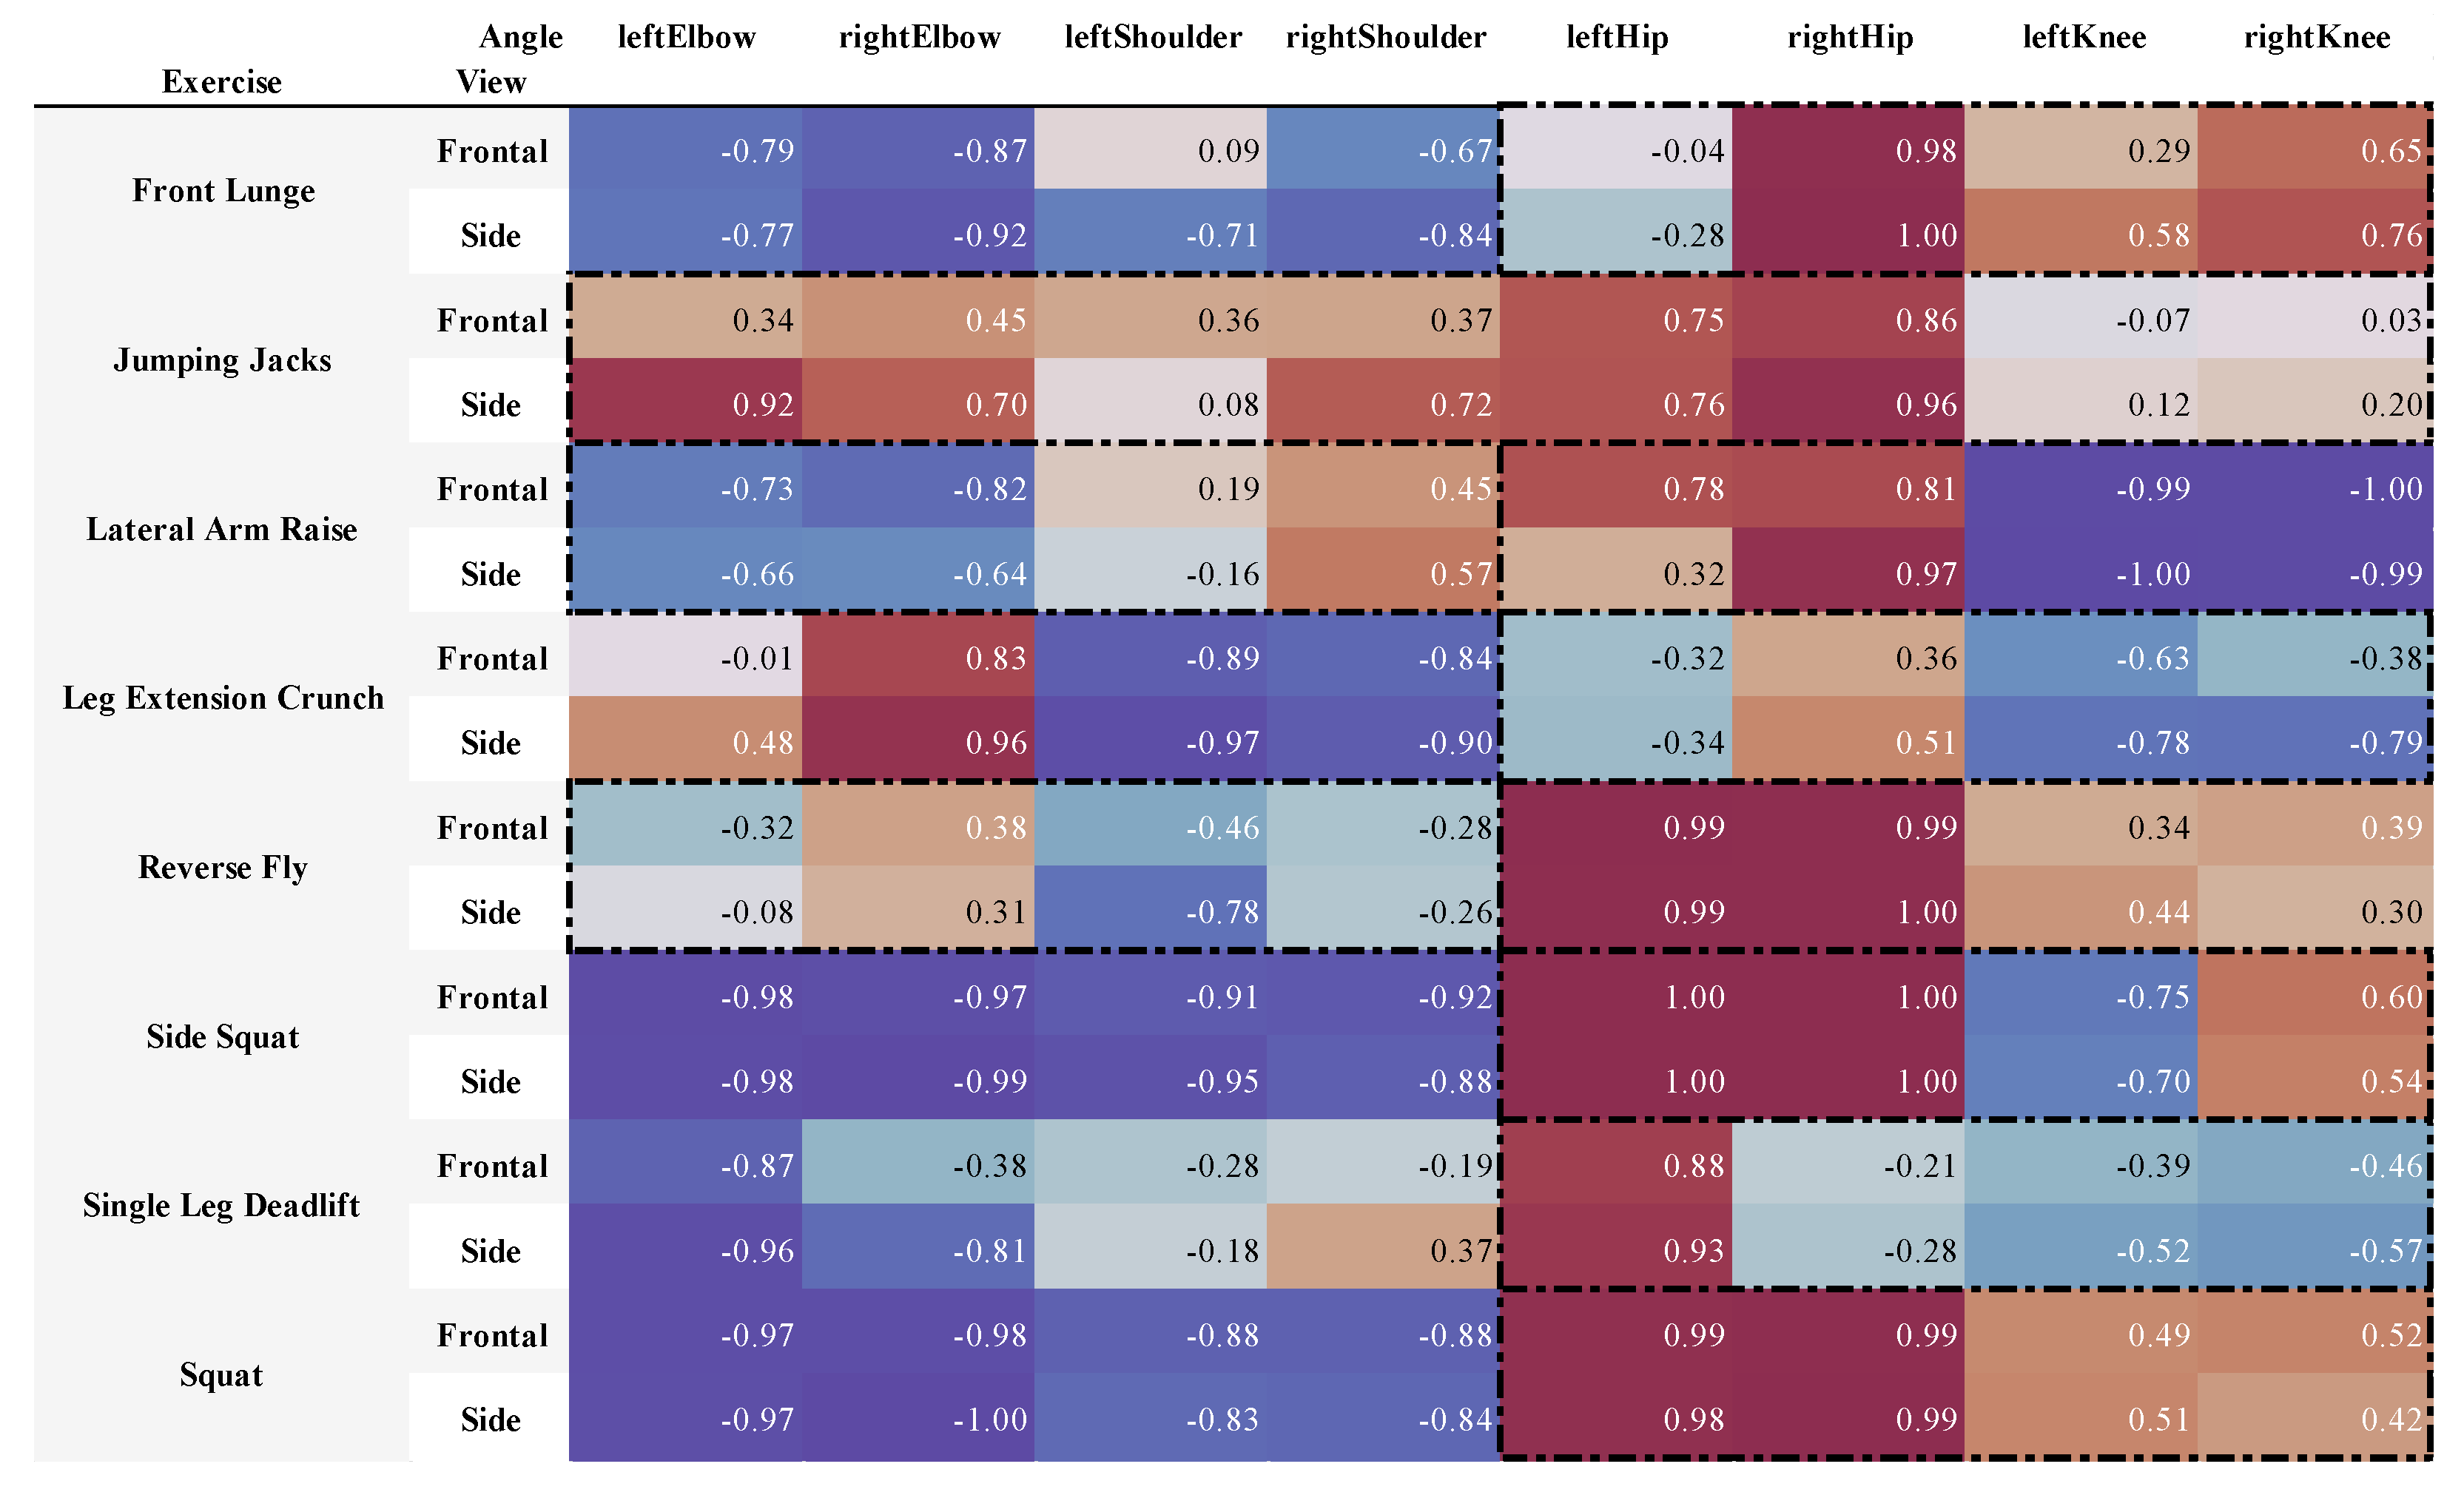
Computing two metrics validates the angle similarity of the systems for each pair of time series, the mean absolute error (MAE) and the non-parametric Spearman’s rank correlation coefficient (SRCC). The obtained MAE and SRCC values of the 1048 time series are aggregated according to predefined grouping criteria, such as exercise, angle, or view. Calculating the sample size’s weighted mean and standard deviation (std) defines a grouping operation for the MAE (Table 1). SRCC values require first a transformation to a normally distributed random variable using the Fisher z-transformation
z = 1 2 ln 1 + r 1 r
where r is the SRCC. It constitutes the prerequisite to applying the averaging operation along with the variables. The result is again a normally distributed variable that needs back transformation into the correlation space using the inverse of (1).
A drawback of the MAE is the lack of interpretation regarding systematic over- or underestimation of the angles. The mean error (ME), which is the average of the time series pair’s difference, can conclude the occurrence of bias but at a granular level, for example segments of the exercise. However, aggregation of the ME is prone to involve effects such as error cancellation. The ratio of ME and MAE, for instance ME MAE , draws insights into the occurrence of systematic bias (Figure A4). A value close to ± 1 implies less tendency of ARKit to fluctuate around the Vicon’s angle estimation, for example either under-, perfect- or overestimation takes place. Values nearby zero indicate the ME’s cancellation effect (over- and underestimation) but require further analysis, such as the difference between MAE and ME, for conclusions.
One-way analysis of variance (ANOVA) is performed to quantify the effects of the categorical metadata such as angle (fixed effect), exercise (fixed effect), and subject (random effect), on the continuous variable MAE. The random effect was taken into account performing one-way ANOVA using a random effects model. The distribution of MAE shows a divergence towards the normal distribution, which is one of the requirements in ANOVA. However, research verified robustness in violating this assumption in certain bounds [
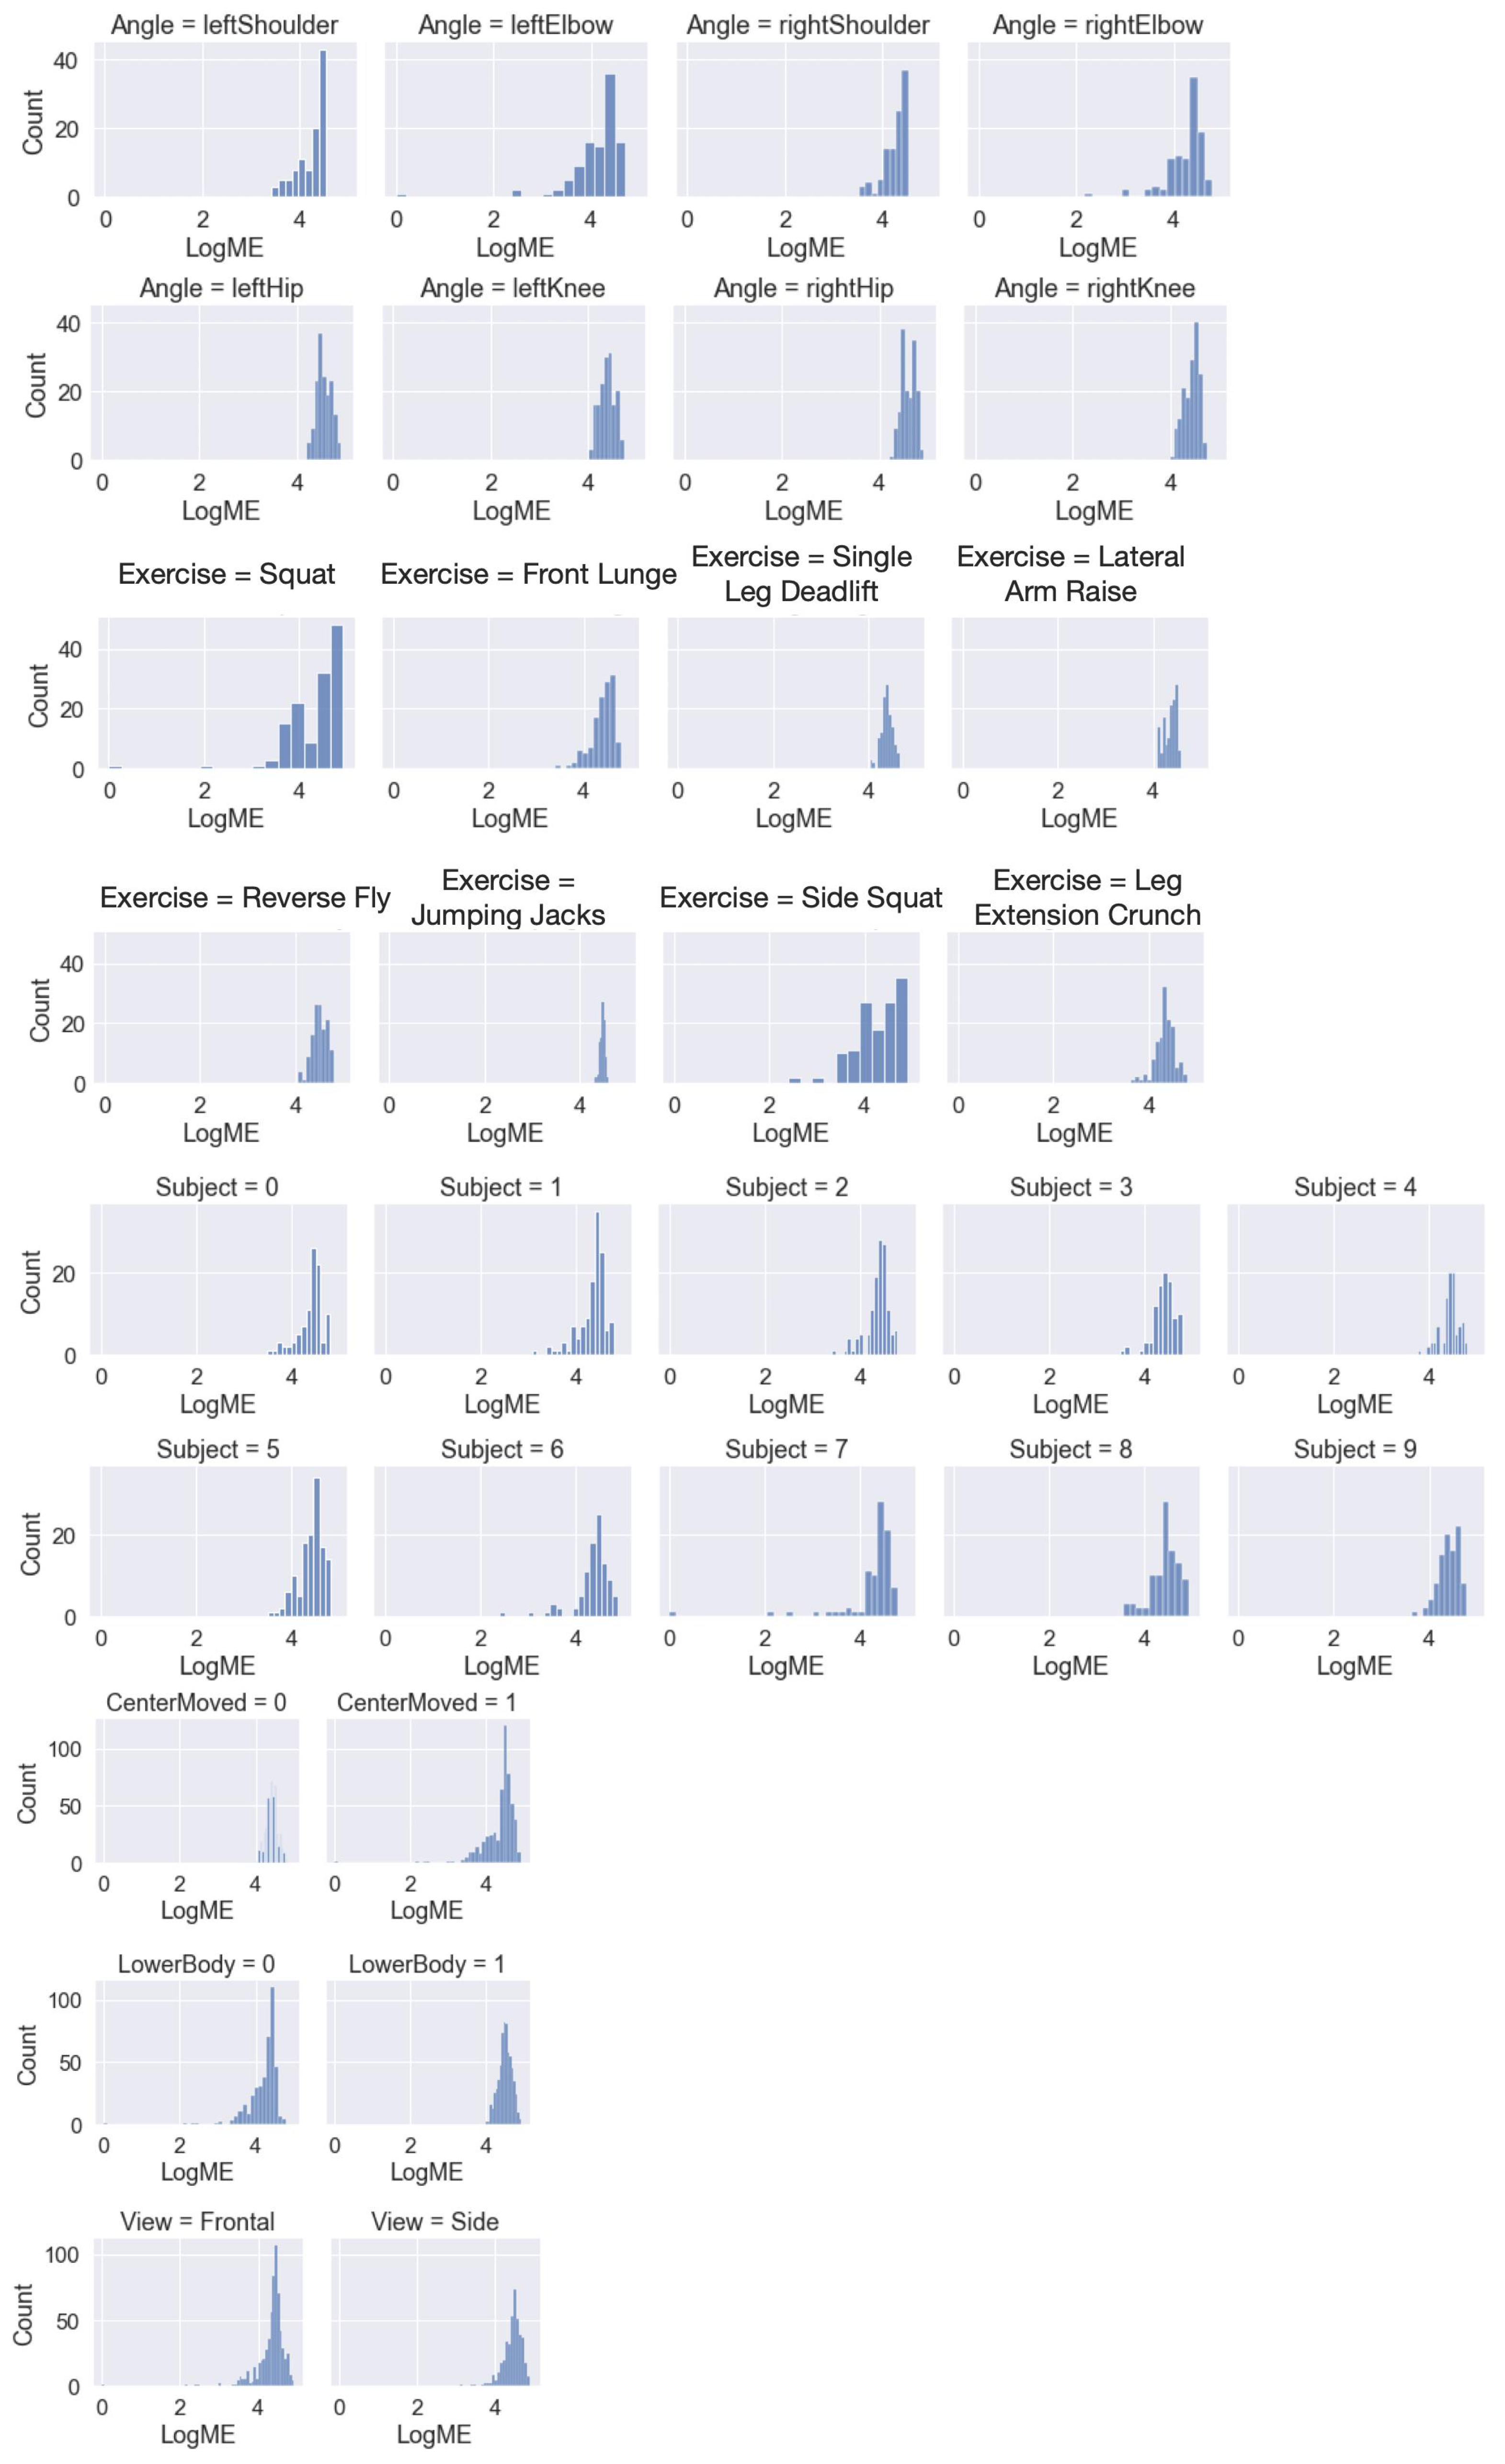
47]. A logarithm (basis 10) transform on the MAE variable ensures stronger normalization (Appendix A, Figure A1). In particular, it makes the model multiplicative and more robust to dispersion. The visual inspection of histograms reveals a lack of homogeneous intergroup variance and motivates to apply Welch’s ANOVA. Finally, the Games-Howell post-hoc test [48] compares the individual categorical factors for significant results (here defined as an effect size larger than 0.1).
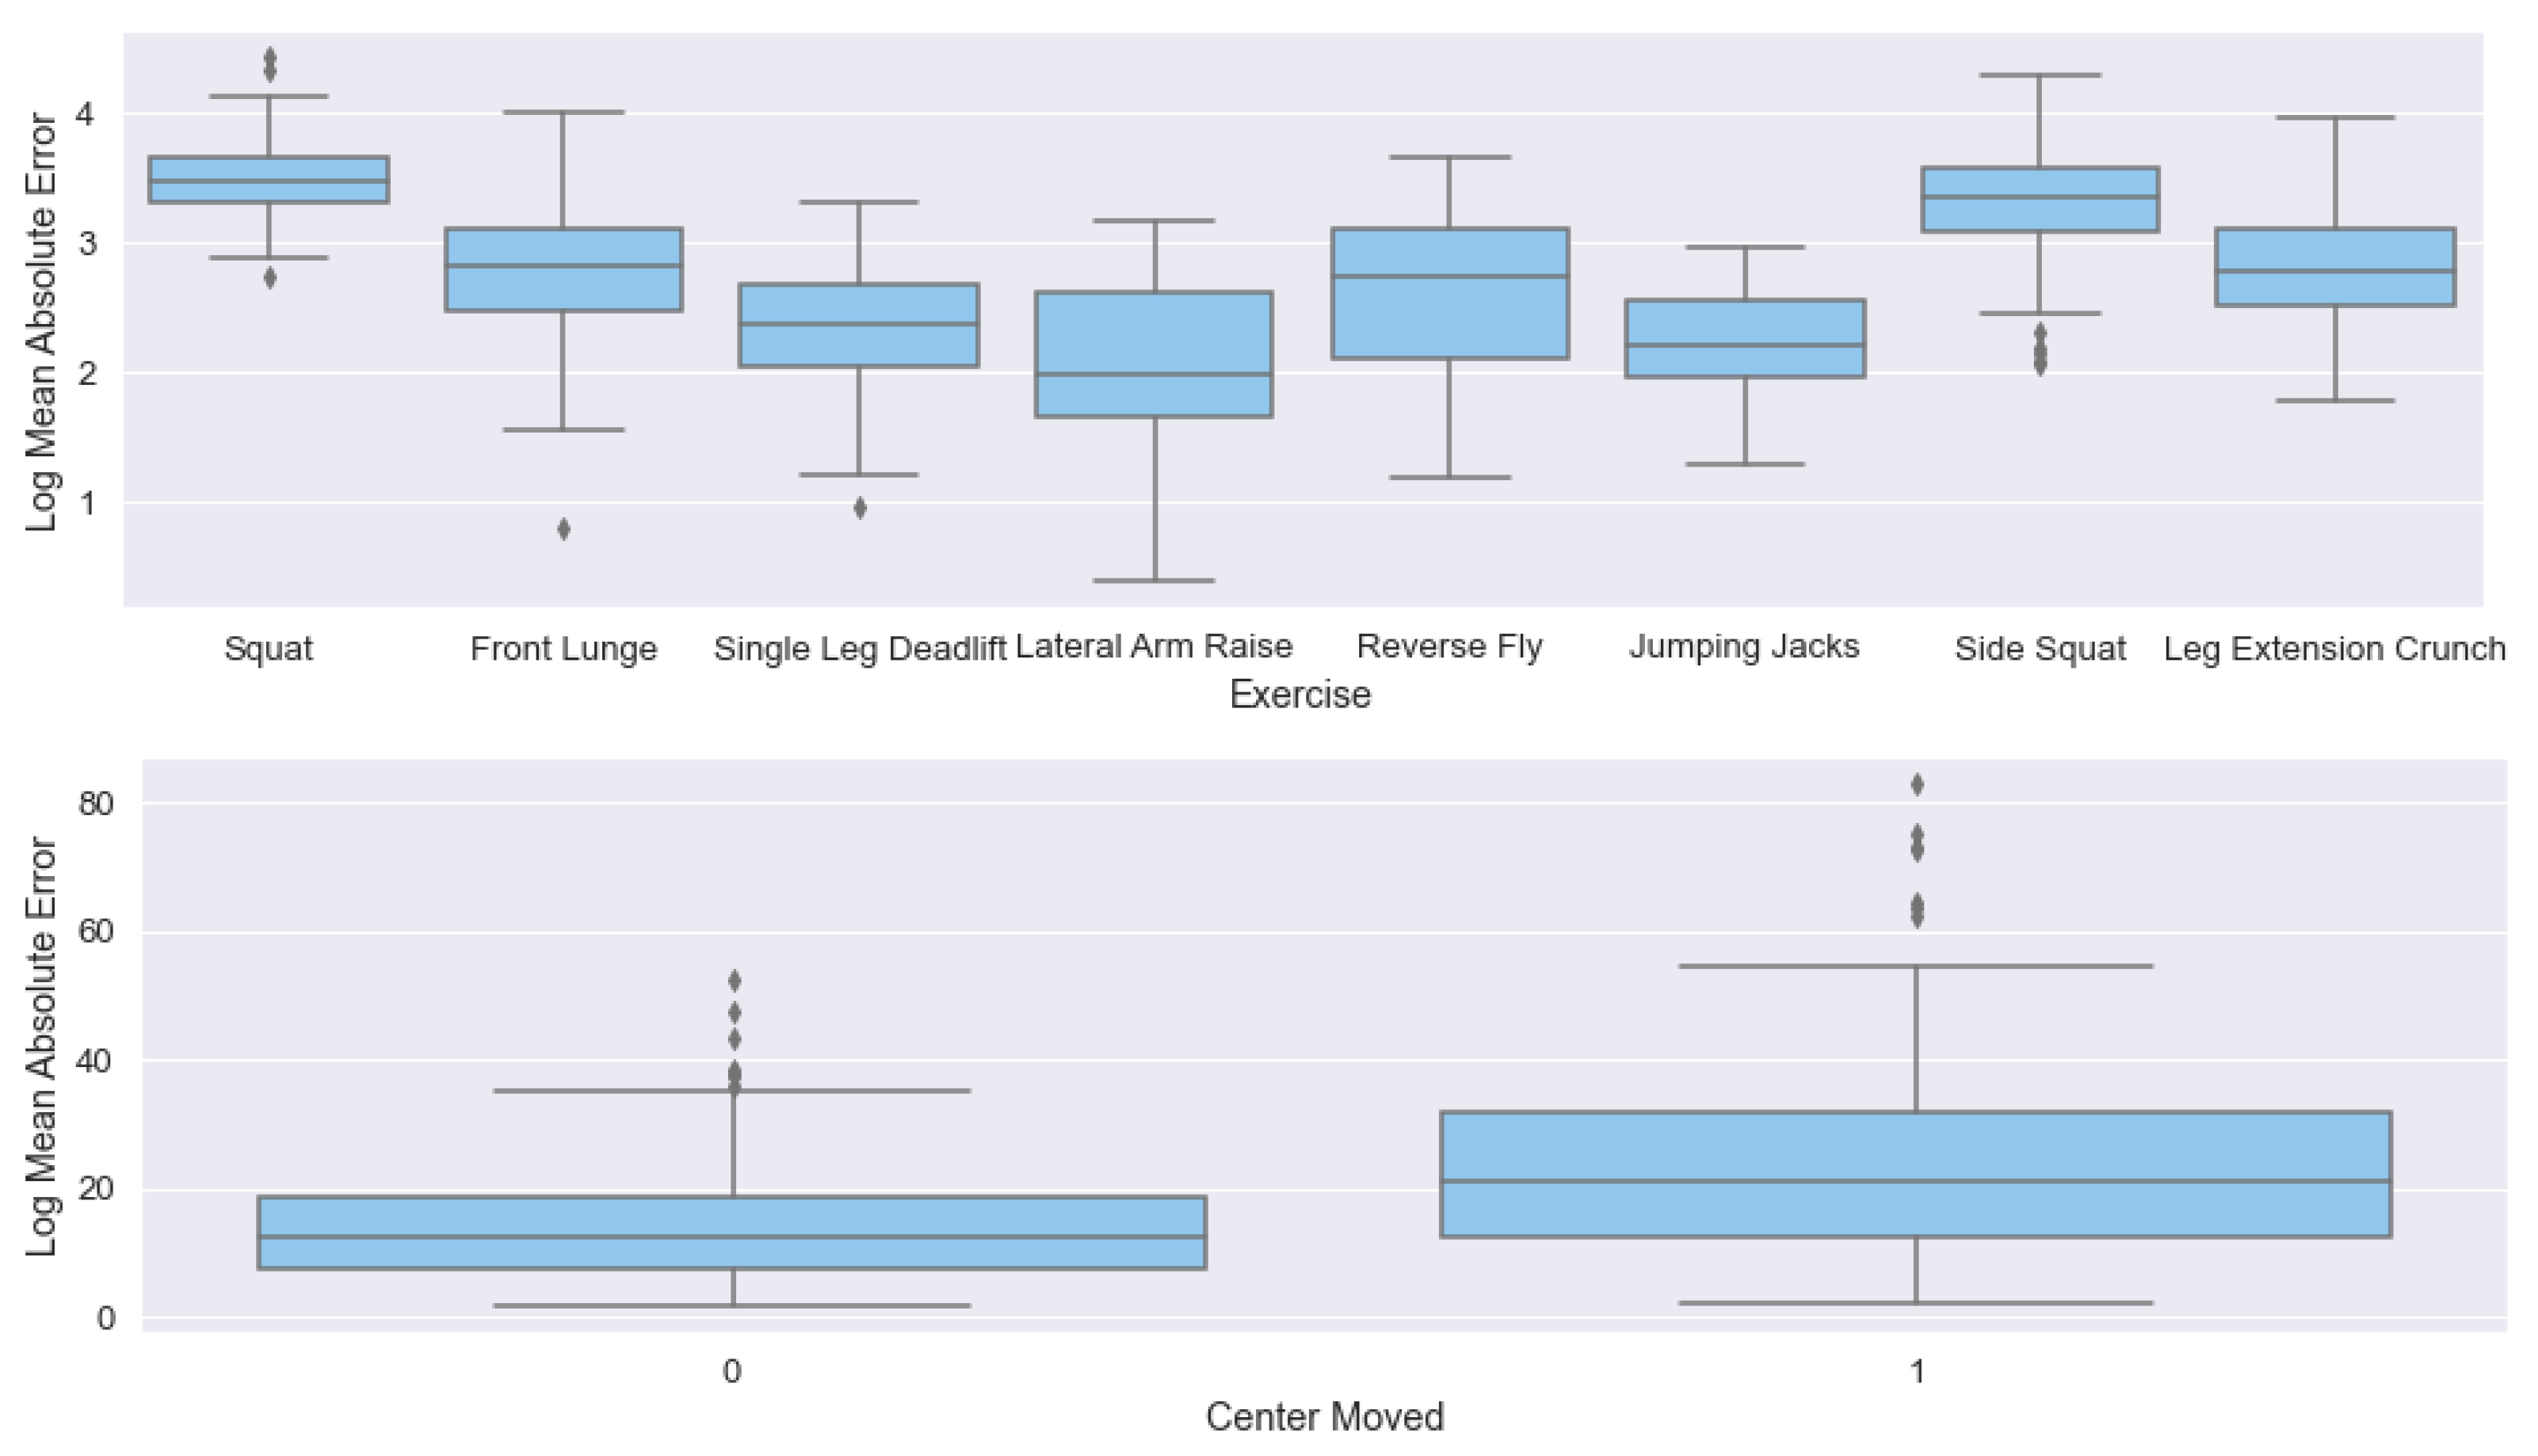
Besides view (frontal or side), the binary independent variables are the body segment of the angle (lower or upper) and information on the movement of the pelvis. The latter is declared as the variable center moved and indicates whether the proper execution of the exercise involves the movement of the pelvic’s center, the origin of the ARKit coordinate system. To quantify the binary variables’ effect, we fitted a logistic regression model based on the MAE and applied Welch’s t-test. The results, including β coefficient, R 2 p-value, and confidence interval, are compiled in a table.
Assumptions about the data are made and can restrict the interpretation of the results. A more detailed outline of this topic is given in the limitations section (Section 5.8).

3. Results

3.1. Weighted Mean Absolute Error

3.1.1. Aggregated Results

The data analysis exposed a wMAE of 18.80 ± 12.12 degrees for all angles in the whole data set. The wMAE across all exercises, views, and angles is visualized in Figure 4 to enable more profound insights into the performance based on exercises and joint angles.
The data exposed high differences in the detected error rates with the wMAE ranging between 3.75 ± 0.99 (Lateral Arm Raise, Left Elbow, Side) and 47.06 ± 5.11 (Side Squat, Left Elbow, Side), depending on the performed exercise and observed joint. To generate better insights into the different factors, we aggregated the wMAE by angle, performed exercise, view, and subject.
Considering the aggregated wMAE for the individual joints (Table 1), the mean value ranged between 16.61 ± 7.47 for the left knee up to 24.00 ± 17.43 for the left elbow. The left hip exposed a wMAE of 16.91 ± 10.67 , followed by the right shoulder with a wMAE of 17.39 ± 12.18 and the right knee with a value of 17.57 ± 7.25 . The right elbow had a wMAE of 20.00 ± 15.32 , the left shoulder 20.01 ± 14.89 and the right hip 20.17 ± 11.25 .
The observed wMAE differed between the exercises, with the Lateral Arm Raise ( 9.56 ± 6.13 ), Jumping Jacks ( 10.09 ± 3.81 ), Single Leg Deadlift ( 11.35 ± 5.04 ), Reverse Fly ( 15.80 ± 8.5 ), Leg Extension Crunch ( 18.15 ± 8.21 ), and Front Lunge ( 18.19 ± 8.98 ) exposing significantly lower error rates than the Side Squat ( 30.49 ± 12.73 ) and the Squat ( 33.79 ± 10.25 ) (Table 2).
When only considering the targeted joints, the wMAE ranged between 3.75 ± 0.99 (Lateral Arm Raise, Left Elbow, Side View) and 38.41 ± 6.66 (Squat, Right Hip, Frontal View). The exercises Lateral Arm Raise, Reverse Fly, and Single Leg Deadlift performed best with wMAE values below 15.00 in the relevant joints for the respective exercises. The wMAE of Jumping Jacks, Front Lunge, and Leg Extension Crunch remained below 25.00 across the targeted joints. The Squat and Side Squat Exercises exposed error rates of up to 38.41 in the targeted joints and thus performed worst in the experiment.
When only considering the targeted joints per exercise, the wMAE was reduced for all exercises except the Jumping Jacks, where the wMAE remained the same (Table 2).
The difference between the view of the recording device was smaller than the observed differences between the exercises, with an wMAE of 17.91 ± 9.68 for the side view and 19.35 ± 13.38 for the frontal view.
When considering the different subjects, the observed wMAE was relatively consistent among the individuals, with mean values ranging from 16.20 ± 9.44 to 22.32 ± 17.08 .

3.1.2. Bias of the ARKit System

For detecting a possible bias of over- and underestimation of the ARKit data, we investigated the ME and the ratio of ME/MAE. The aggregated results of the ME/MAE ratio exhibits only seven values below 0.1 for the exercise—angle—view configurations (Appendix B Figure A3 for the ME, Appendix B Figure A4 for ratio ME/MAE). In 4 of these cases, the wMAE is above 10 : Front Lunge—left hip—Frontal, Jumping Jacks—left knee—Frontal, Jumping Jacks—right knee—Frontal, and Leg Extension Crunch—left elbow—Frontal. Most other values remain relatively close to 1 or −1.

3.2. Spearman Rank Correlation

The whole dataset exposed a mean Spearman Rank Correlation Coefficient of 0.76. The p-value was below 0.01 for 1019 of the 1048 exercises. A detailed overview of the individual SRCCs, including the standard deviation for the exercises, is visualized in Figure 5.
The SRCC varied between the tracked angles with a range of −0.27 to 0.99 as mean values per exercise and angle as displayed in Figure 5. When considering the results aggregated per joint angles (Table 3), all negative correlations were observed for the elbow angles (left elbow 0.36, right elbow 0.42) in both iPad views, with the side view performing worse than the frontal view. The shoulder angles exposed a mean SRCC of 0.81 for both shoulders. Knee and hip joints were also tracked with moderate SRCC values (left hip: 0.82, right hip: 0.84, left Knee: 0.75, right knee: 0.81).
While the SRCCs differed between the exercises, all of them exposed moderate linear correlations with values above 0.5 (Table 4). The Leg Extension Crunch showed a correlation of 0.84. Front Lunge correlated with 0.80, followed by the Single Leg Deadlift with an SRCC of 0.79. The Squat and Side Squat exercises showed a correlation of 0.78. The SRCC of the Lateral Arm Raise was 0.68, and the SRCC of the Reverse Fly was 0.67. The Jumping Jacks performed worst with a correlation of 0.60.
Similar to the wMAE, considering only the relevant joints for the specific exercises positively influenced the SRCCs of all exercises except for the Jumping Jacks, where it remained the same, and the Single Leg Deadlift, where it was reduced by 0.01 (Table 4).
Comparing the two positions of the iPads, the side view performed slightly better than the frontal view, with SRCCs of 0.80 and 0.73, respectively.
Similar to the wMAE, the SRCC is relatively consistent across the recorded subject, with values between 0.72 and 0.82.

3.3. Factor Analysis

3.3.1. ANOVA Analysis

To further investigate the influence of the observed exercise, angle, and subject on the performance of ARKit, we performed a Welch ANOVA factor analysis on the Mean Absolute Error for the factors Exercise and Angle and a random effects model for the factor Subject. The MAE exhibited a high dependency on the observed exercise with an effect size of η 2 = 0.51 ( p = 0.00 ). It did not expose a dependency on the observed angle ( η 2 = 0.03 , p = 0.00 ). The random effects model analysis did not exhibit an influence of the subject, with 0.29% of the variance explained by the subject (Table 5).
To further investigate the influencing factors of the performed exercise in the MAE, we performed a Post-hoc analysis using the Games-Howell test (Appendix C, Table A1). The exercise analysis exhibits significant differences between 20 of the 28 exercise pairs.

3.3.2. Welch t-Test Analysis

All binary influencing factors of the MAE were analyzed using Welch’s t-test (Table 6). The results of the t-test showed a dependency on the pelvic center movement ( c o h e n d = 0.82 , p o w e r = 1.00 , p = 0.00 ). No dependency was measured for the view ( c o h e n d = 0.01 , p o w e r = 0.06 , p = 0.82 ), and whether the measured angle is a lower body angle ( c o h e n d = 0.01 , p o w e r = 0.05 , p = 0.88 ).

3.3.3. Logistic Regression Analysis

In addition to the t-test, we applied logistic regression to the three variables View, LowerBody, and CenterMoved (Table 7). The logistic regression model for the LowerBody shows a slight effect with β c o e f = 0.0684 ( p = 0.00 ). The model exposed a P s e u d o R 2 of 0.165. While the View model exposed no significant effect ( β c o e f = 0.0141 , p = 0.00 ), the fitness of the model is low ( P s e u d o R 2 = −0.019). The CenterMoved variable showed no effect ( β c o e f = 0.0018 , p = 0.575 ). Similar to the View variable, the P s e u d o R 2 of 0.000 indicated bad fitness of the model to explain the data.

4. Findings

While the results showed that ARKit is generally capable of tracking human body motion, the accuracy of the joint angles is highly variable and dependent on several factors, especially the performed exercise.

4.1. RQ 1: How Accurate Is ARKit’s Human Motion Capture Compared to the Vicon System?

To answer RQ 1, we investigated both the wMAE and the SRCC of the experiment data. A wMAE of 0° and an SRCC of 1.0 would represent a perfect accuracy of ARKit’s human motion capture. The ARKit data showed a MAE of 18.80° and an average SRCC of 0.76 for the whole data set, with variations when examining different joints and exercises. Based on the results of the ANOVA analysis, the accuracy mainly depends on the observed angle and exercise. However, the accuracy could be influenced by other additional factors which were not specifically targeted by the performed experiment. Remarkably, ARKit was able to achieve an almost perfect correlation and accuracy for some exercise executions in specific angles (Figure 6). In many cases, the movement pattern is recognizable in the ARKit data. Still, the amplitude is reduced, or a baseline drift on the y-axis is observable (Figure 7, which explains the good correlation but relatively high wMAE values. In some cases, the ARKit data exhibits high wMAE values and no or even a negative SRCC. These effects often occurred in the elbow joints, especially when the lower body joints moved and the upper body joints were held straight, such as in the Squat or Side Squat exercises. In this situation, ARKit often failed at detecting the movement correctly (Figure 8), which is visible both in the high wMAE and the low to negative correlation values for the elbow angles. In general, the accuracy was lower in those exercises where the root position did not remain stable, including the Front Lunge, Side Squat, and Squat exercises. The results of the factor analysis further confirmed these results.
To investigate whether a systematic baseline drift can be observed in the ARKit data, we aligned the ARKit and Vicon data via cross-correlation. We measured the y-axis offset (Figure 9). As the offset was normally distributed around 0, no systematic baseline drift was present in the recorded data set, indicating that other factors cause shifts.
Finding 1: ARKit is able to track the general progression of a movement with good accuracy but with significant deviations from the actual values measured by the Vicon system. The performance is influenced by external factors such as the performed motion.

4.2. RQ 2: Which Factors Influence ARKit’s Motion Capture Results?

We performed factor analysis using Welch ANOVA, t-test analysis, and logistic regression on the dependent variable MAE to answer RQ2.
The MAE depended on the performed exercise. This dependency is visible when inspecting the respective boxplots of the MAE (Figure 10). Especially both Squat exercises (Squat, Side Squat) show significantly higher mean values than the other exercises. This observation is supported by the post-hoc analysis results of the ANOVA results. The logistic regression indicated an additional small influence of whether upper or lower body angles are considered. While the t-test showed an additional effect on whether the pelvic’s center was moved during an exercise, this effect was not visible in the logistic regression. The impact of this factor remains inconclusive.
Finding 2: The factor analysis results show that the accuracy of ARKit’s human motion capture mainly depends on the performed exercise.
While there is a slight difference between the frontal and side view data for both the wMAE and the SRCC, this difference is comparably small. The results of the side view show a 1.44 difference of the wMAE and a difference in the SRCC of 0.07, with the side view performing slightly better than the frontal view. These findings are supported by the factor analysis results, where no dependency of the view was measured. It also needs to be considered that the upper body angles in the side view only contained data of three subjects due to export problems, limiting the comparison’s explanatory power.
Another aspect of the device’s position influence is the visibility of specific body parts. Limited visibility of body joints, such as the left side of the body in the Front Lunge, Single Leg Deadlift, and Leg Extension Crunch, or the elbow joints in the Side Squat and Squat, is associated with a higher wMAE and worse correlation results, especially in the left elbow joint. Hidden joints often led to ARKit confusing the left and right body side for the respective joints, which caused unexpected peaks in the recorded data (Figure 11). The tracking of the upper body joints worked significantly better when other body parts did not hide them, as in the remaining three exercises Jumping Jacks, Lateral Arm Raise, and Reverse Fly.
Finding 3: When positioning the device, ensuring good visibility of the targeted joints improves the accuracy of the results.

5. Discussion

5.1. Factors Influencing ARKit’s Performance

Based on the findings presented in Section 4, we identified several factors that influence the accuracy of ARKit’s motion capture. The main requirement for good tracking is ensuring that the joints of interest are well visible to the camera and not hidden by other parts of the body during the movement. The exercise or motion itself is also of relevance. The results of the t-test hinted at a relevance of the coordinate system’s stability during the exercise. However, this was not supported by the results of the logistic regression, so that the interpretation is unclear and requires further investigation.
The results of capturing human motion using ARKit could be influenced by several other factors, which were not further investigated within this research. This includes technical factors such as the device’s processing power and additional sensors to improve the motion capture, the tracking environment such as lighting conditions or the background, or factors regarding the captured person, such as their clothing, body mass index, or skin color.

5.2. Bias of the Motion Capture Results

The upper body angles exposed a tendency of underestimation, and the results of the hips hinted at systematic overestimation as described in Section 3.1.2. Several values were located close to −1 or 1, which hints at a tendency to either systematic rather than cyclically occurring over- or underestimation. When aggregating the values for the different joints (Table 8), the results suggest that the upper body angles are underestimated, while the hip gets overestimated. The knee angles remain inconclusive with values relatively close to zero. They could hint at the mentioned cyclically occurring over- and underestimations or over- and underestimation based on the executed movement.

5.3. Influence of the Tracked Joint Angle

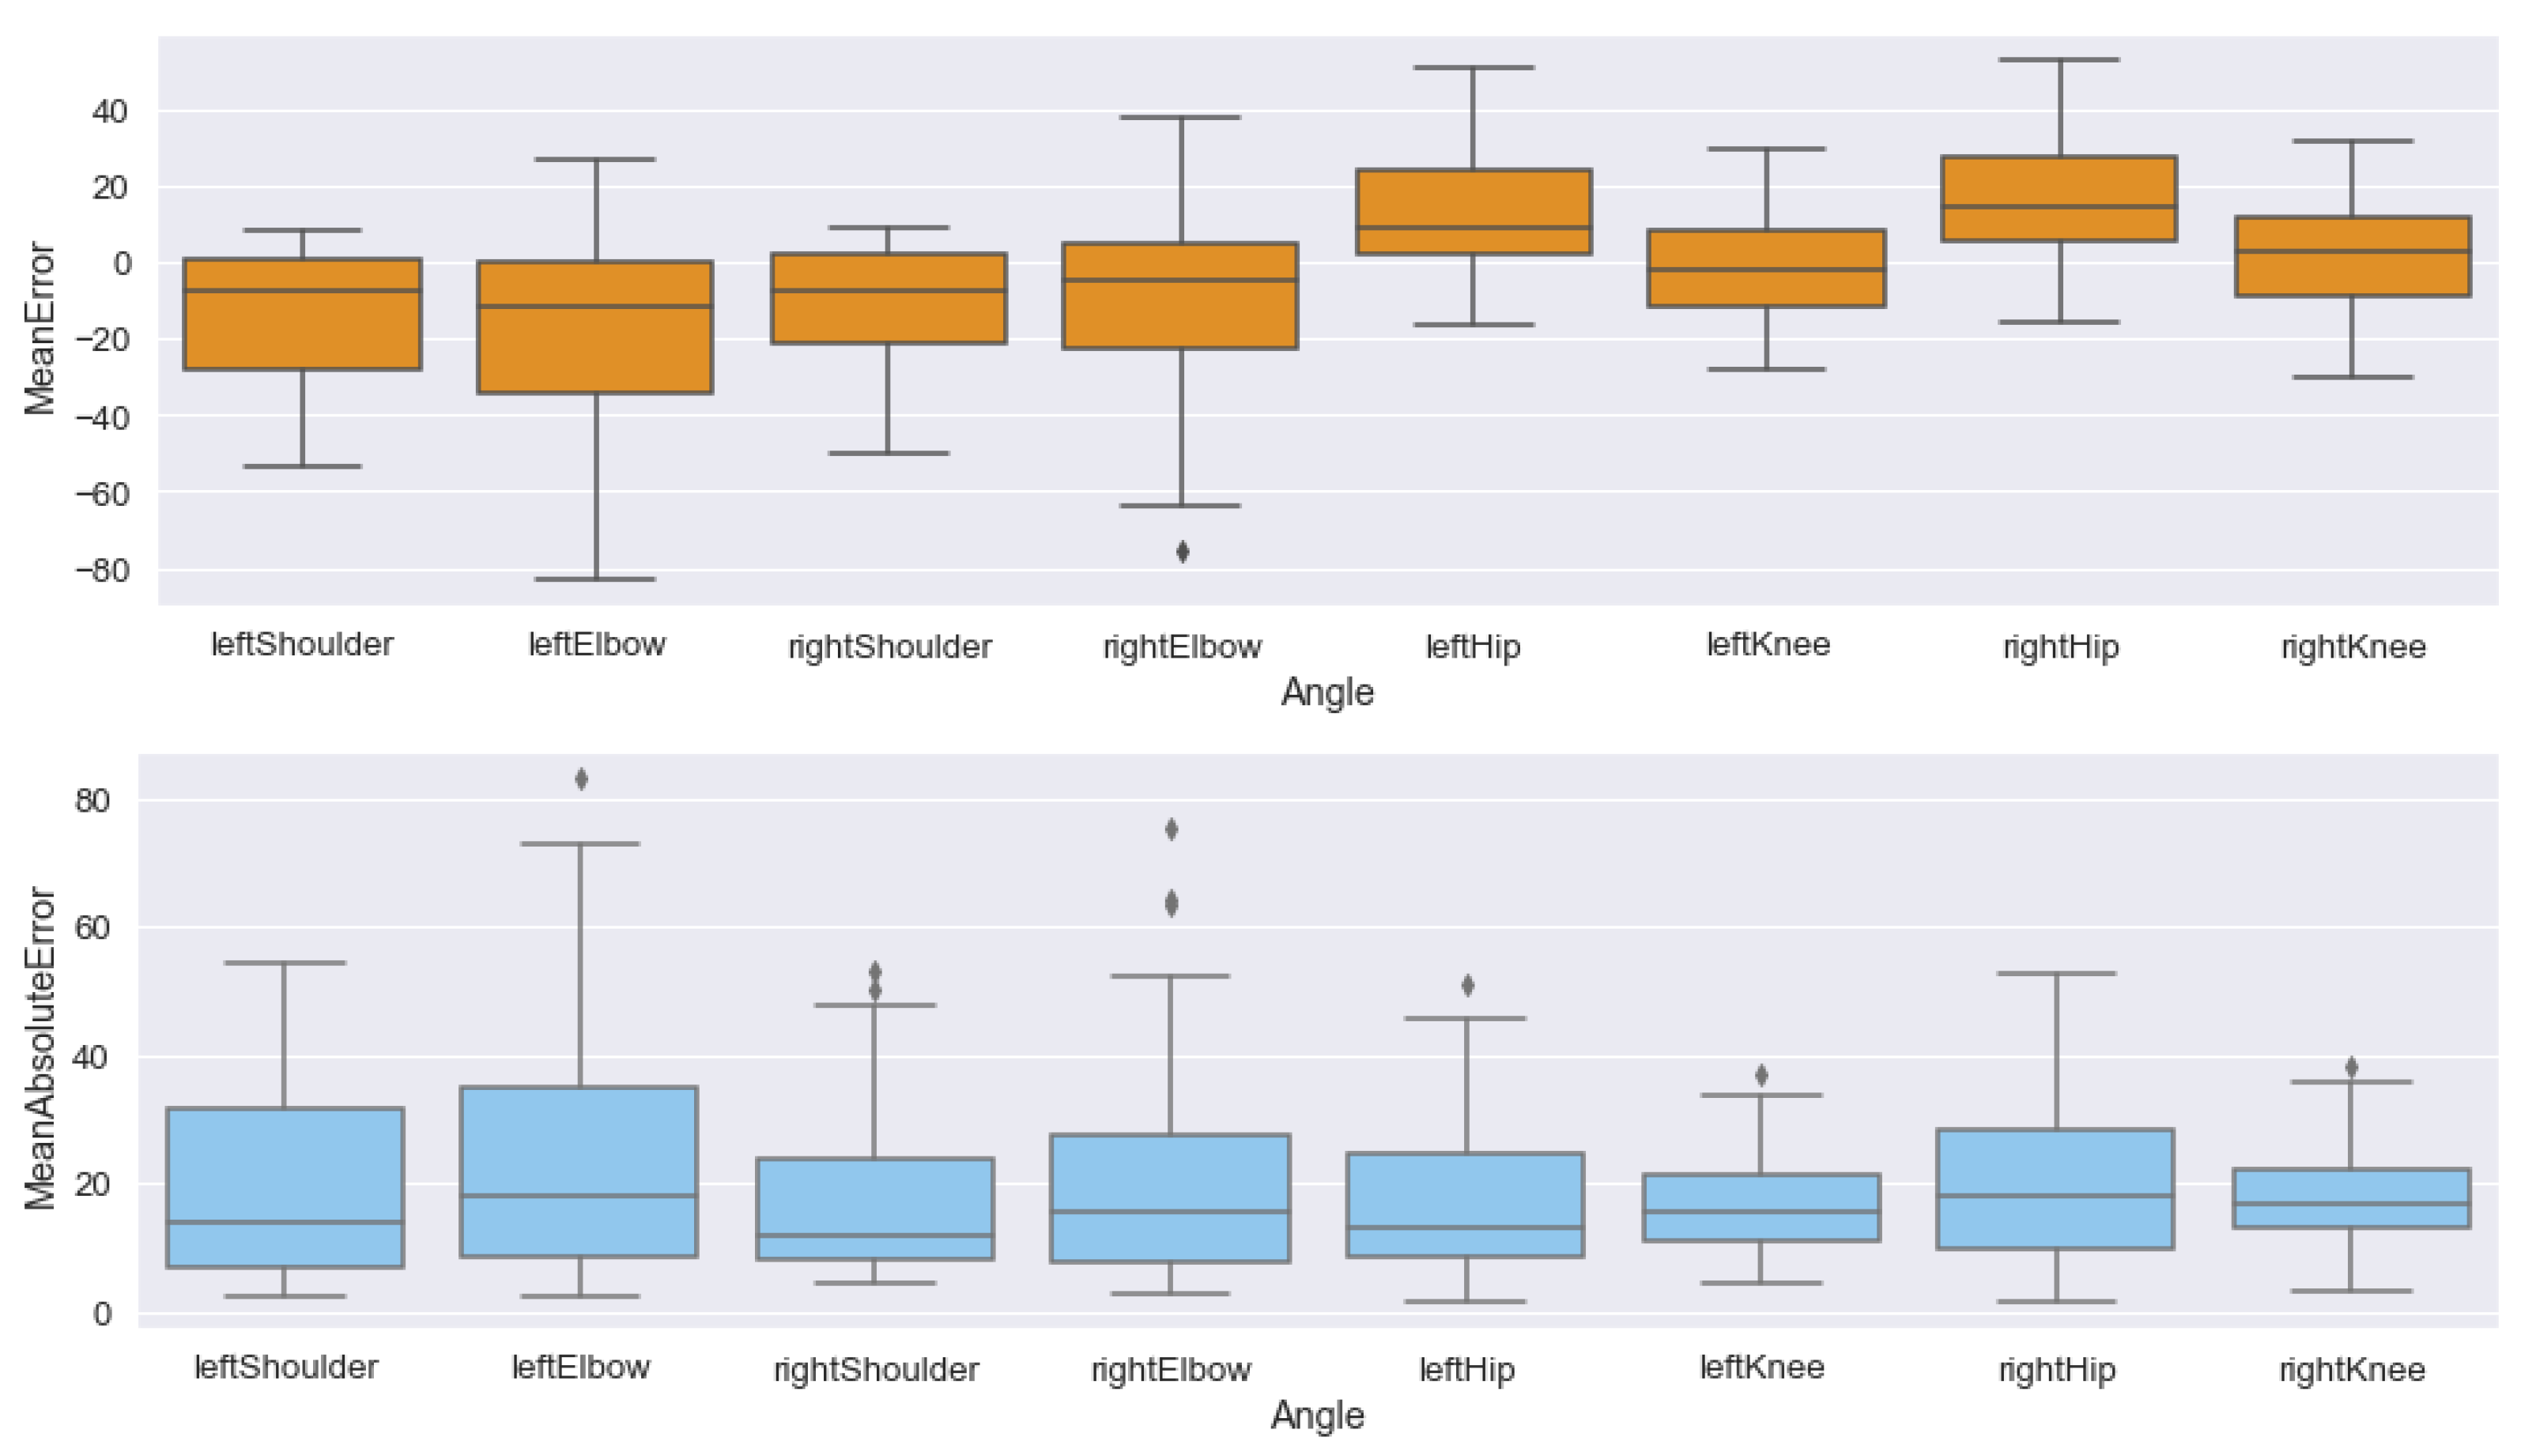
The logistic regression results indicated a small, but significant effect of the lower body variable. These impressions are supported when inspecting the boxplot of the angles in the ME (Figure 12). The boxplot shows a tendency of underestimating the upper body angles, overestimating the hip angles, and a difference in the mean between the knee and hip angles. To investigate this effect, we performed the ANOVA analysis on the ME. We shifted the ME to only include positive values and applied the logarithmic transformation similar to our proceedings of the MAE as described in Section 2.6. The observed angles show an influence on the result ( η 2 = 0.26 , p = 0.00 ). Post-hoc analysis using Games-Howell supports the suggestions that the differences lie between the upper body angles and lower body angles and between the hip and knee angles (Appendix C, Table A2).
Interestingly, the exercise and movement of the hip center were the influencing factors for the MAE in contrast to the results of the ME. In the MAE, the difference between the angles is not observable anymore. The upper body error is mapped to a similar MAE as the lower body joints by only considering the absolute error (Figure 12). The ME for the whole dataset is −0.83°, meaning that overestimating the lower body joints and underestimating the upper body joints could be subject to error cancellation when considering the entire body. This effect could explain the MAE’s dependency on the selected exercise while no dependency on the angle was observed.
The ANOVA results show an effect for the upper body variable and support the respective tendency of over-and underestimation. However, as explained in Section 2.6, the ME is prone to error cancellation effects. This unclear influence impacts the explanatory power, so we did not include these thoughts in the results and findings.

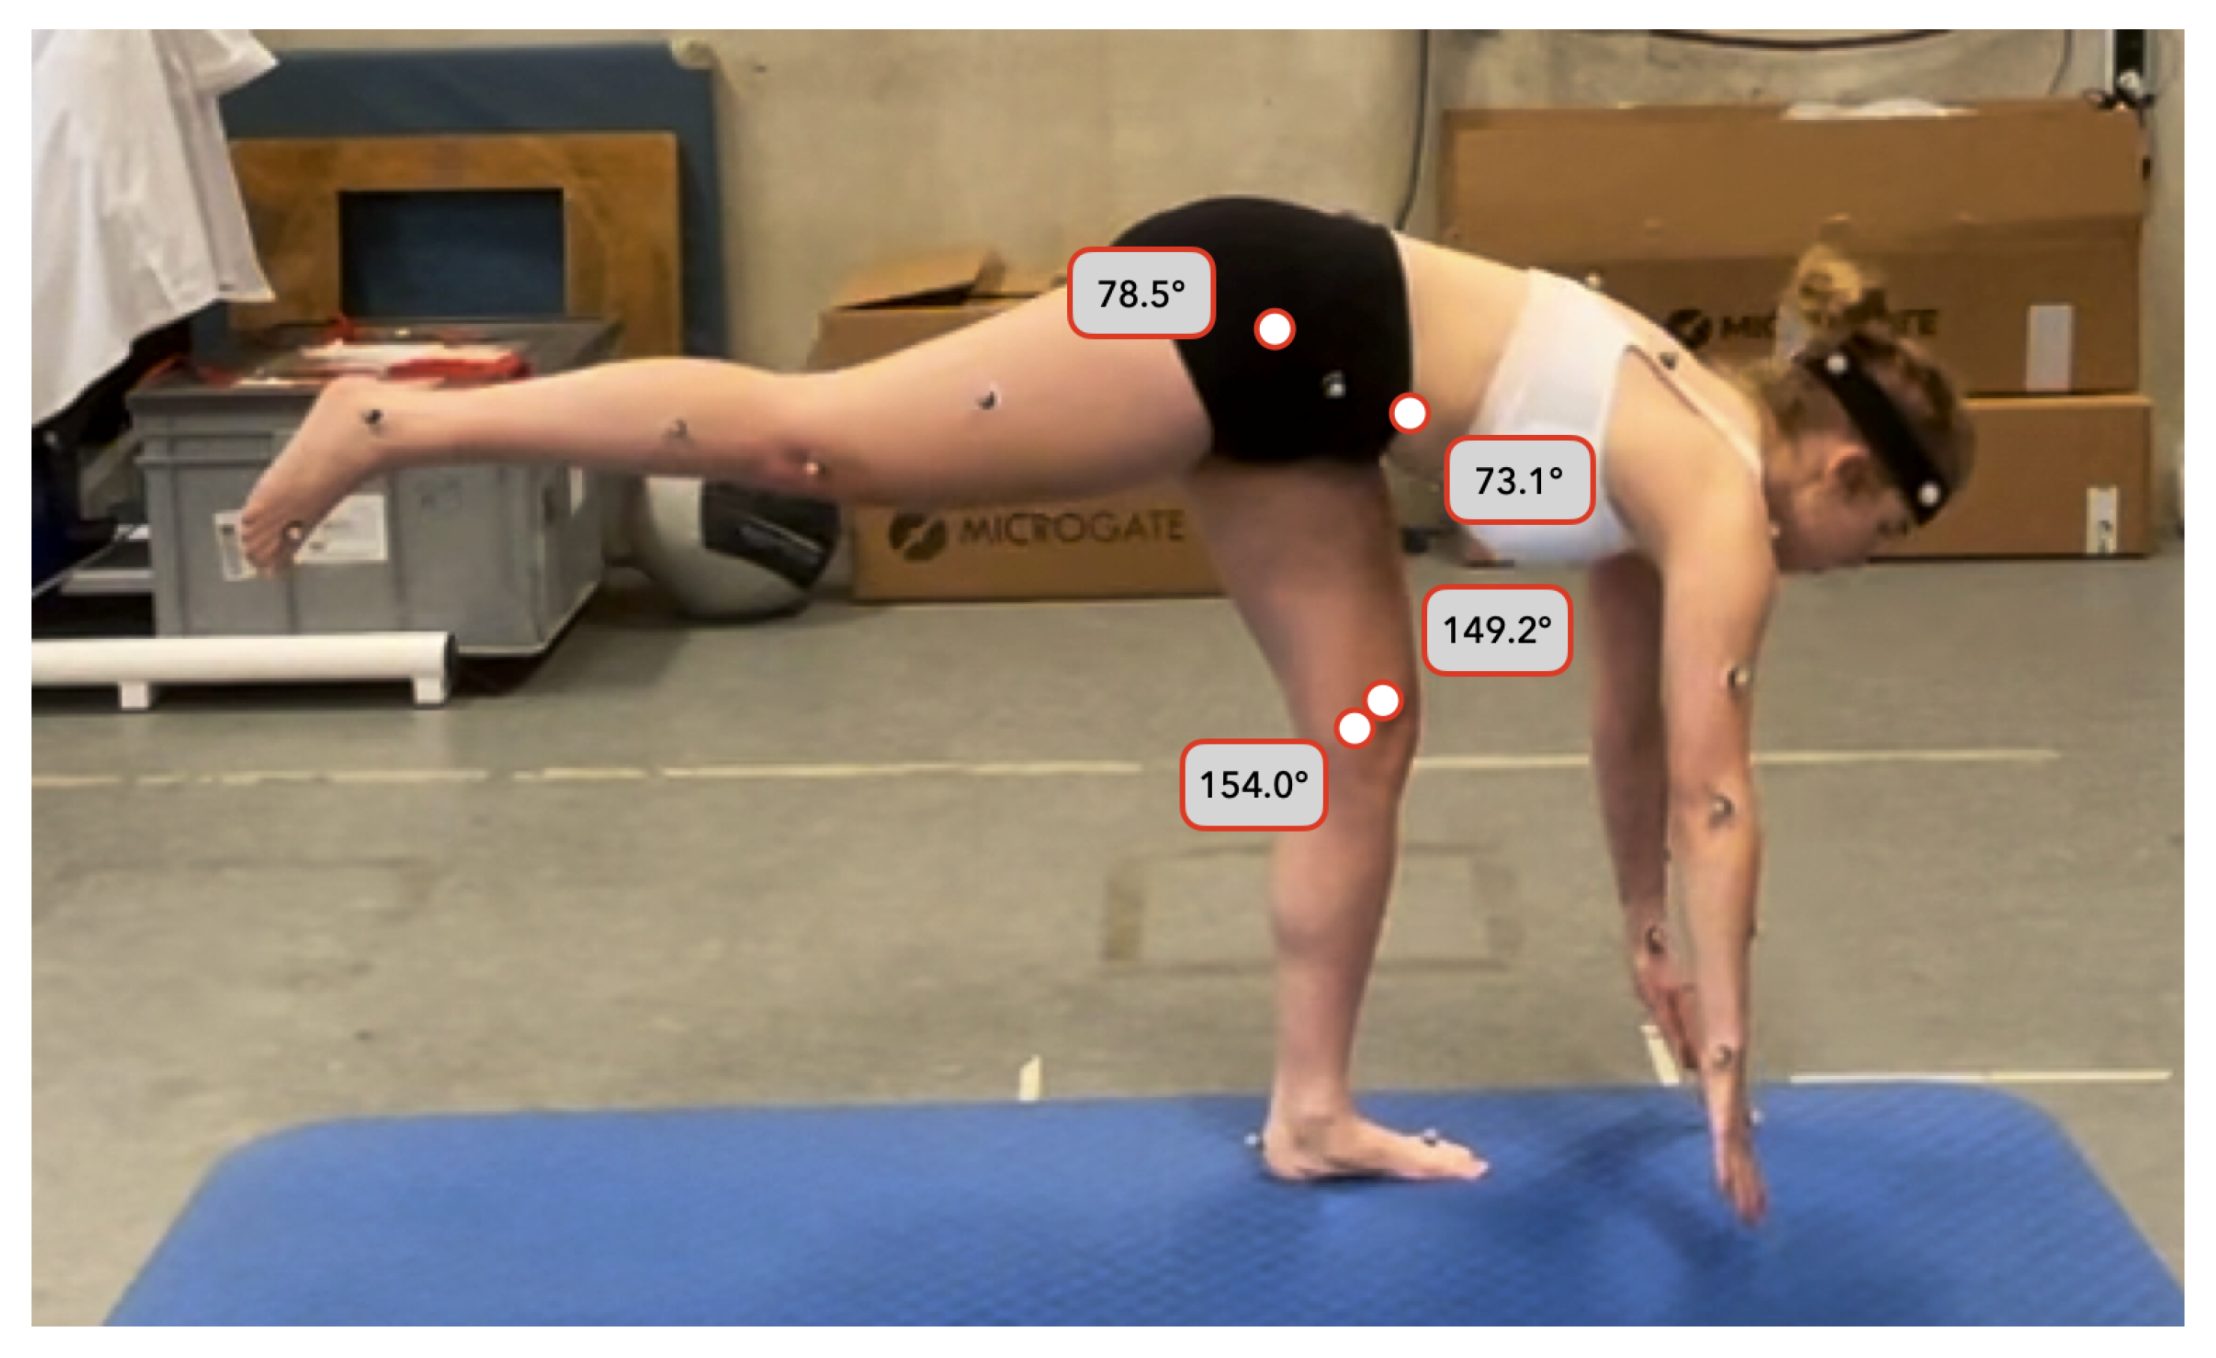
5.4. Impact of Incorrect Hip Detection

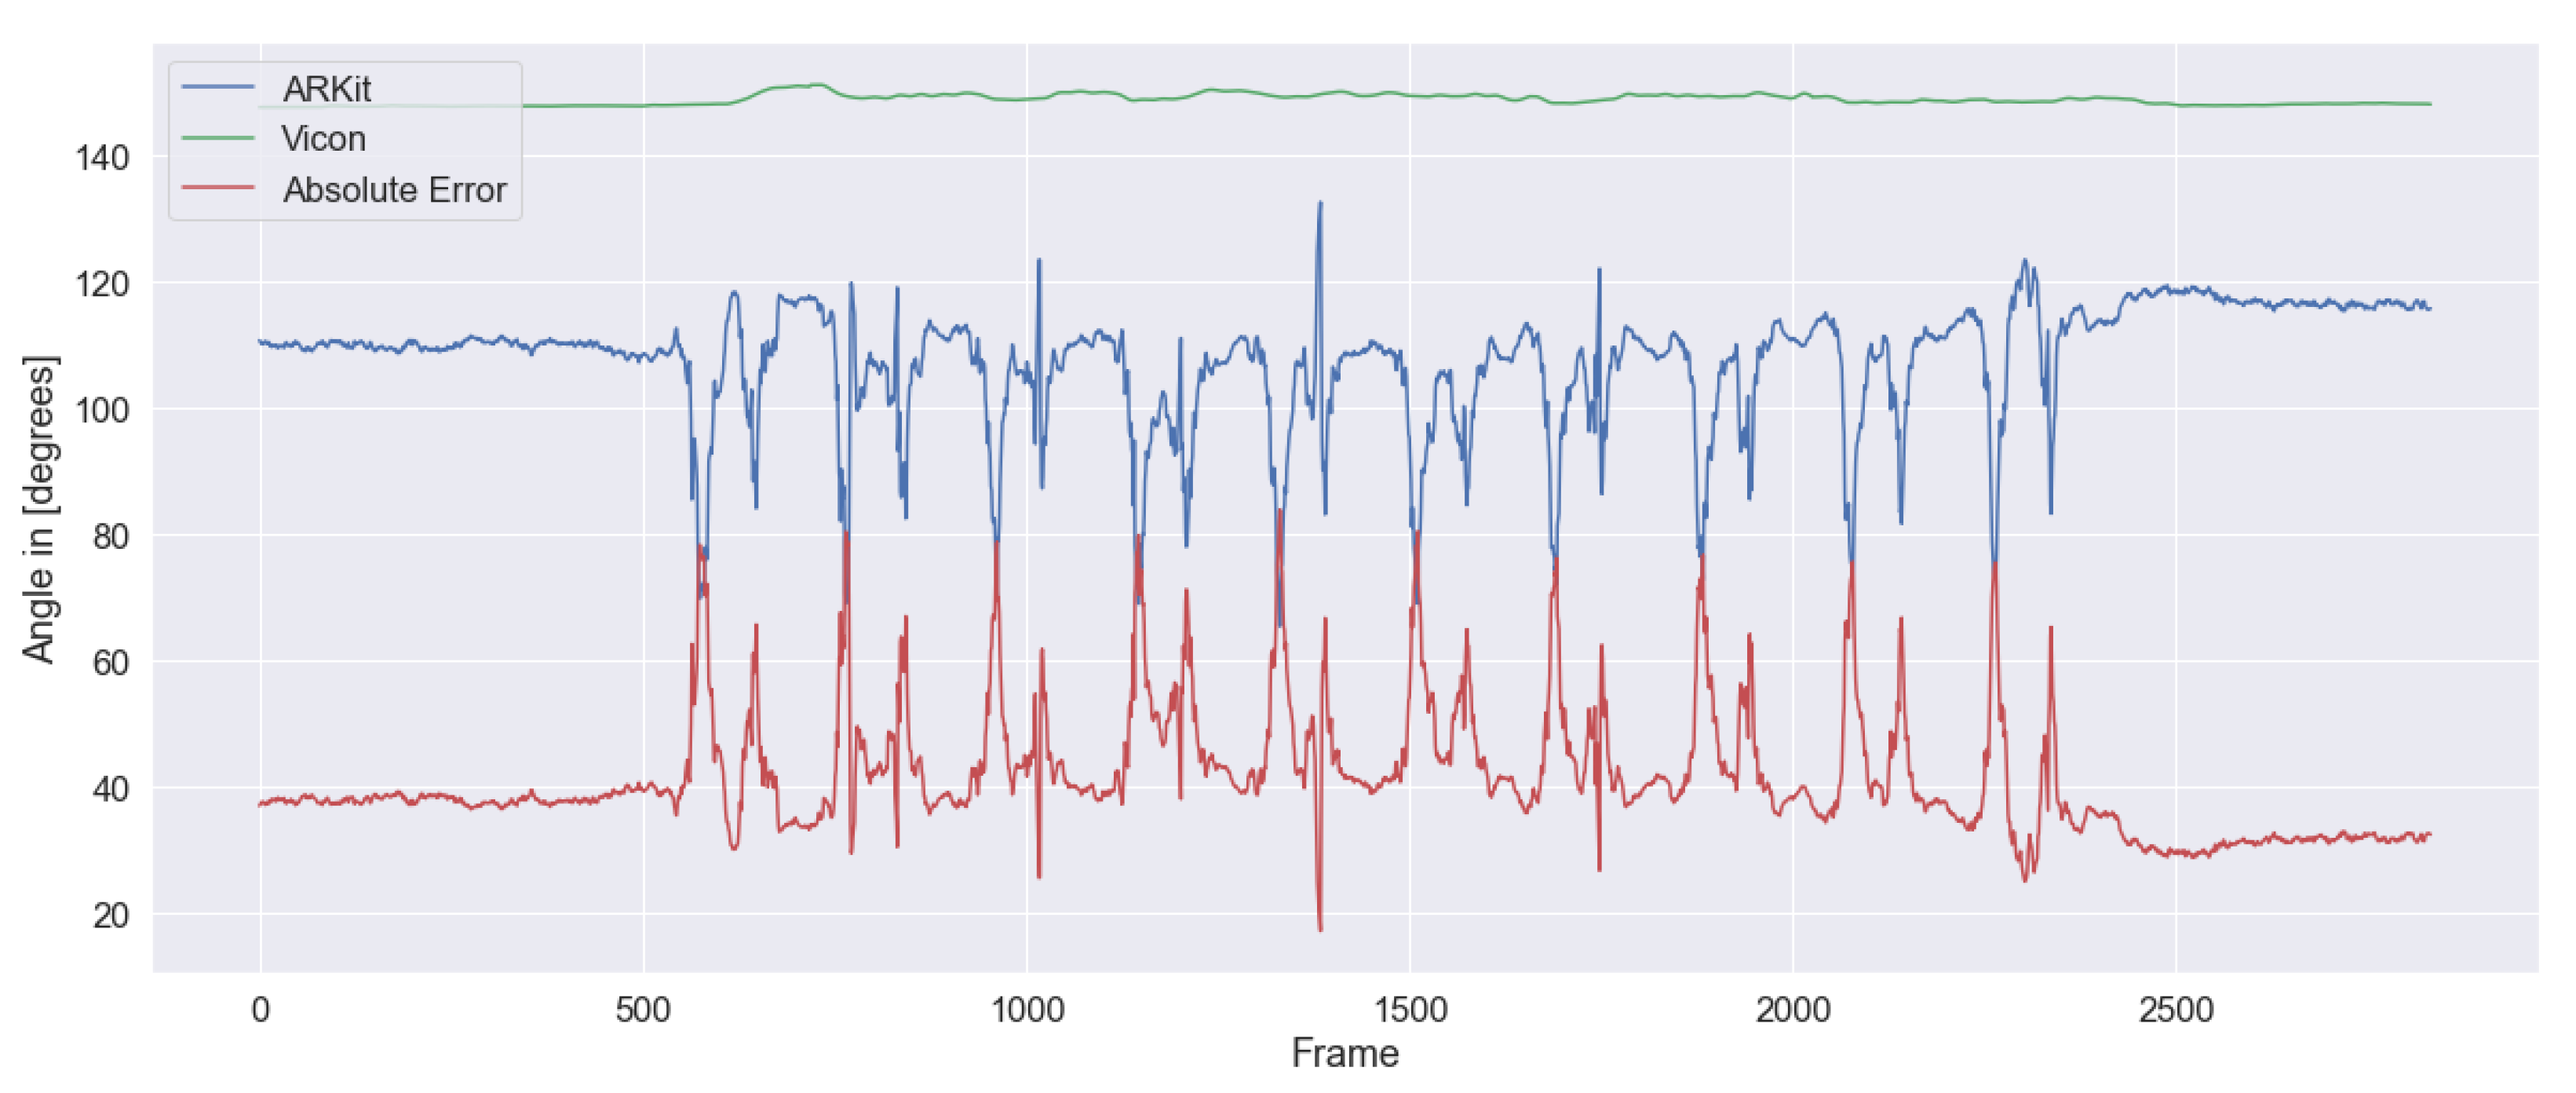
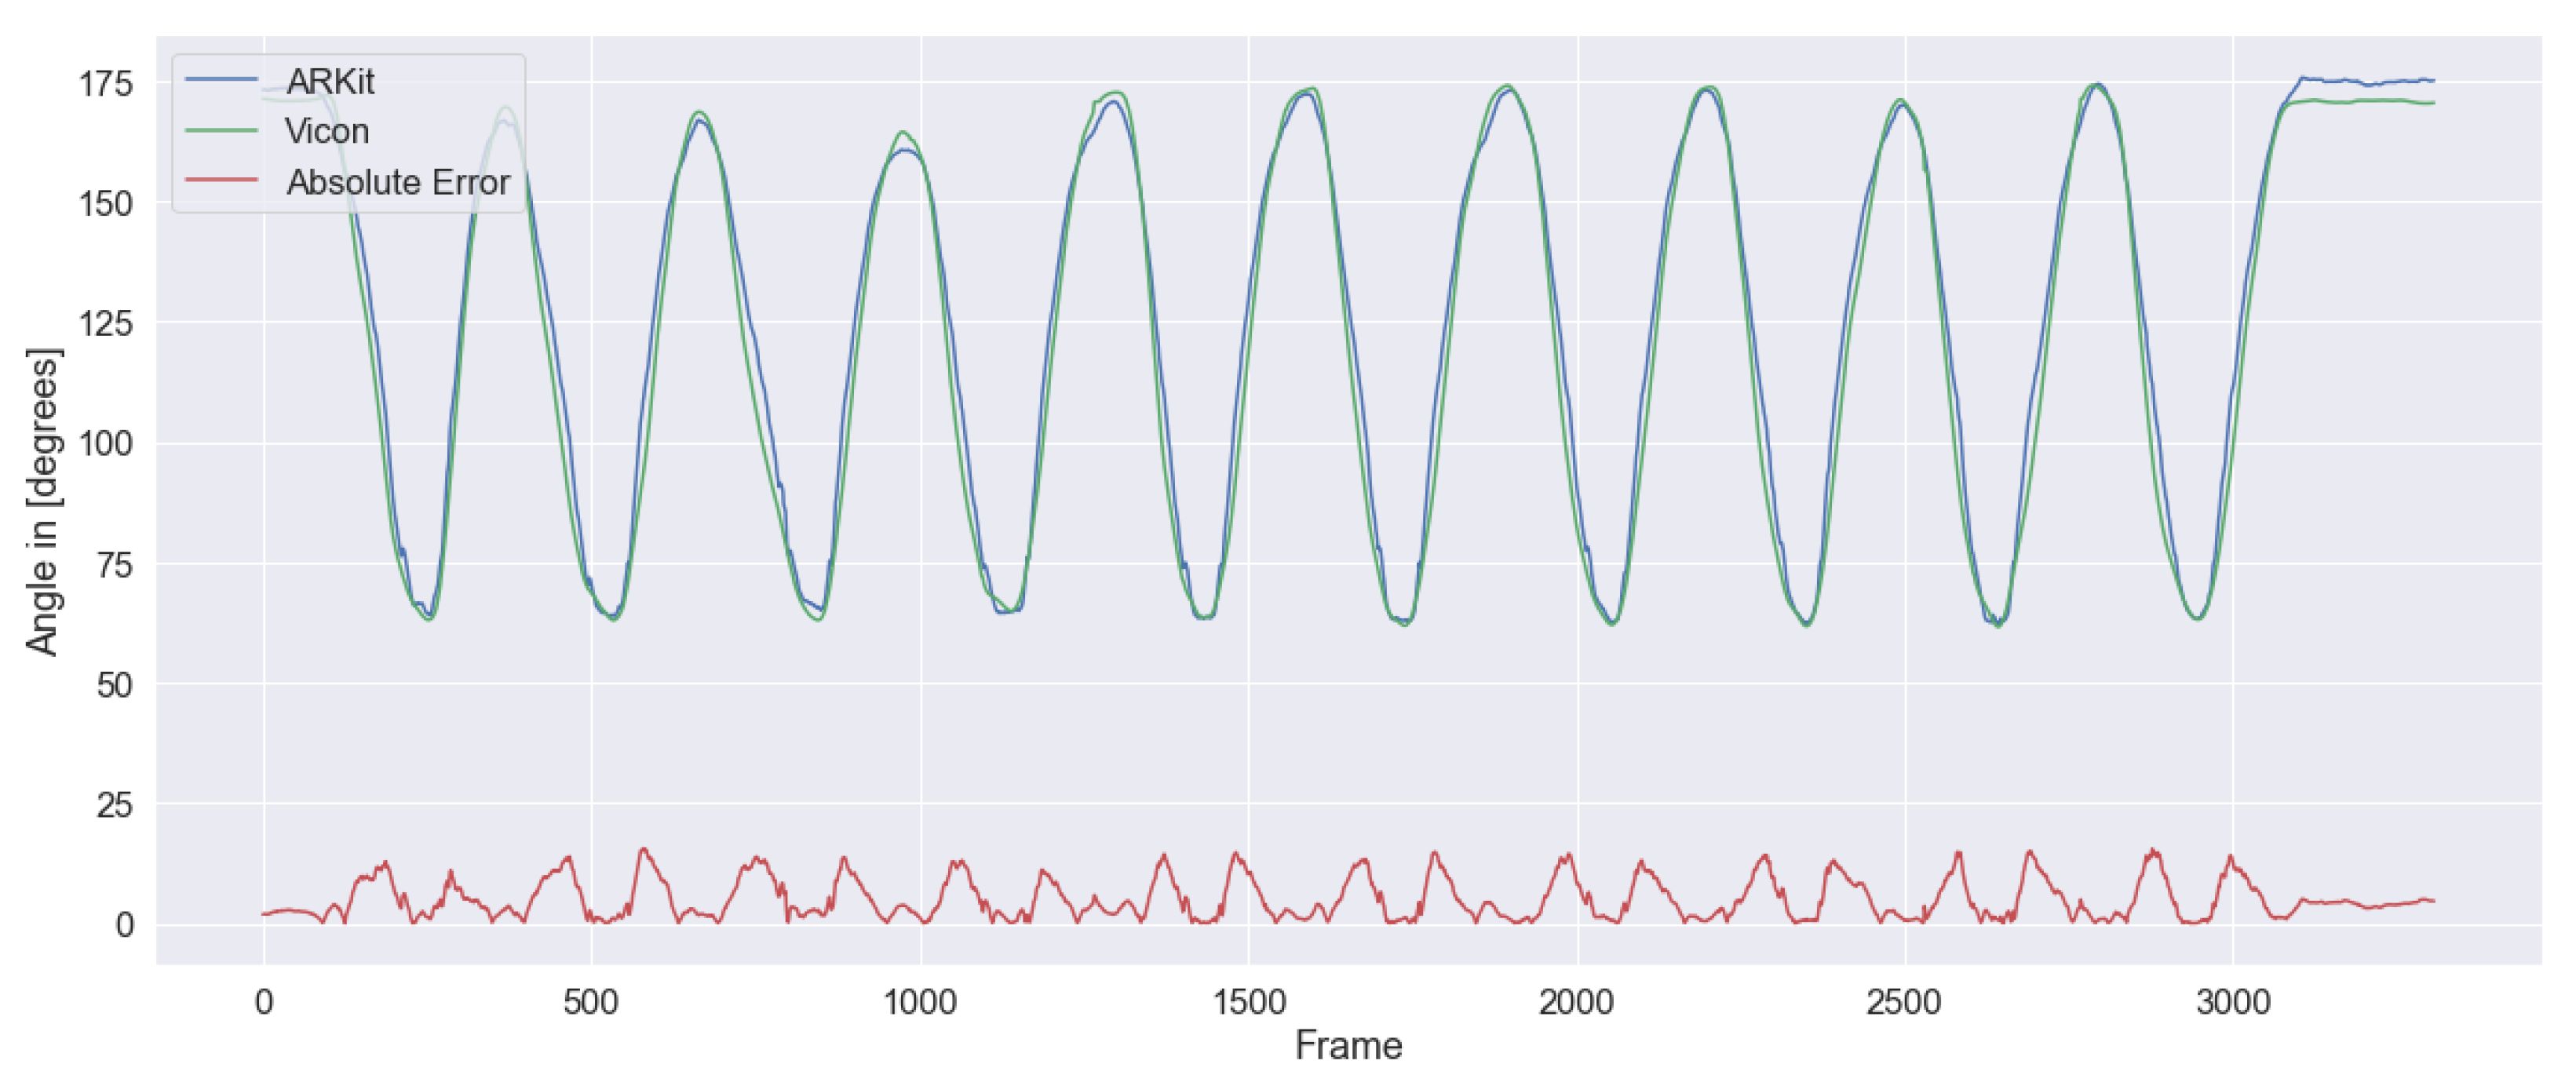
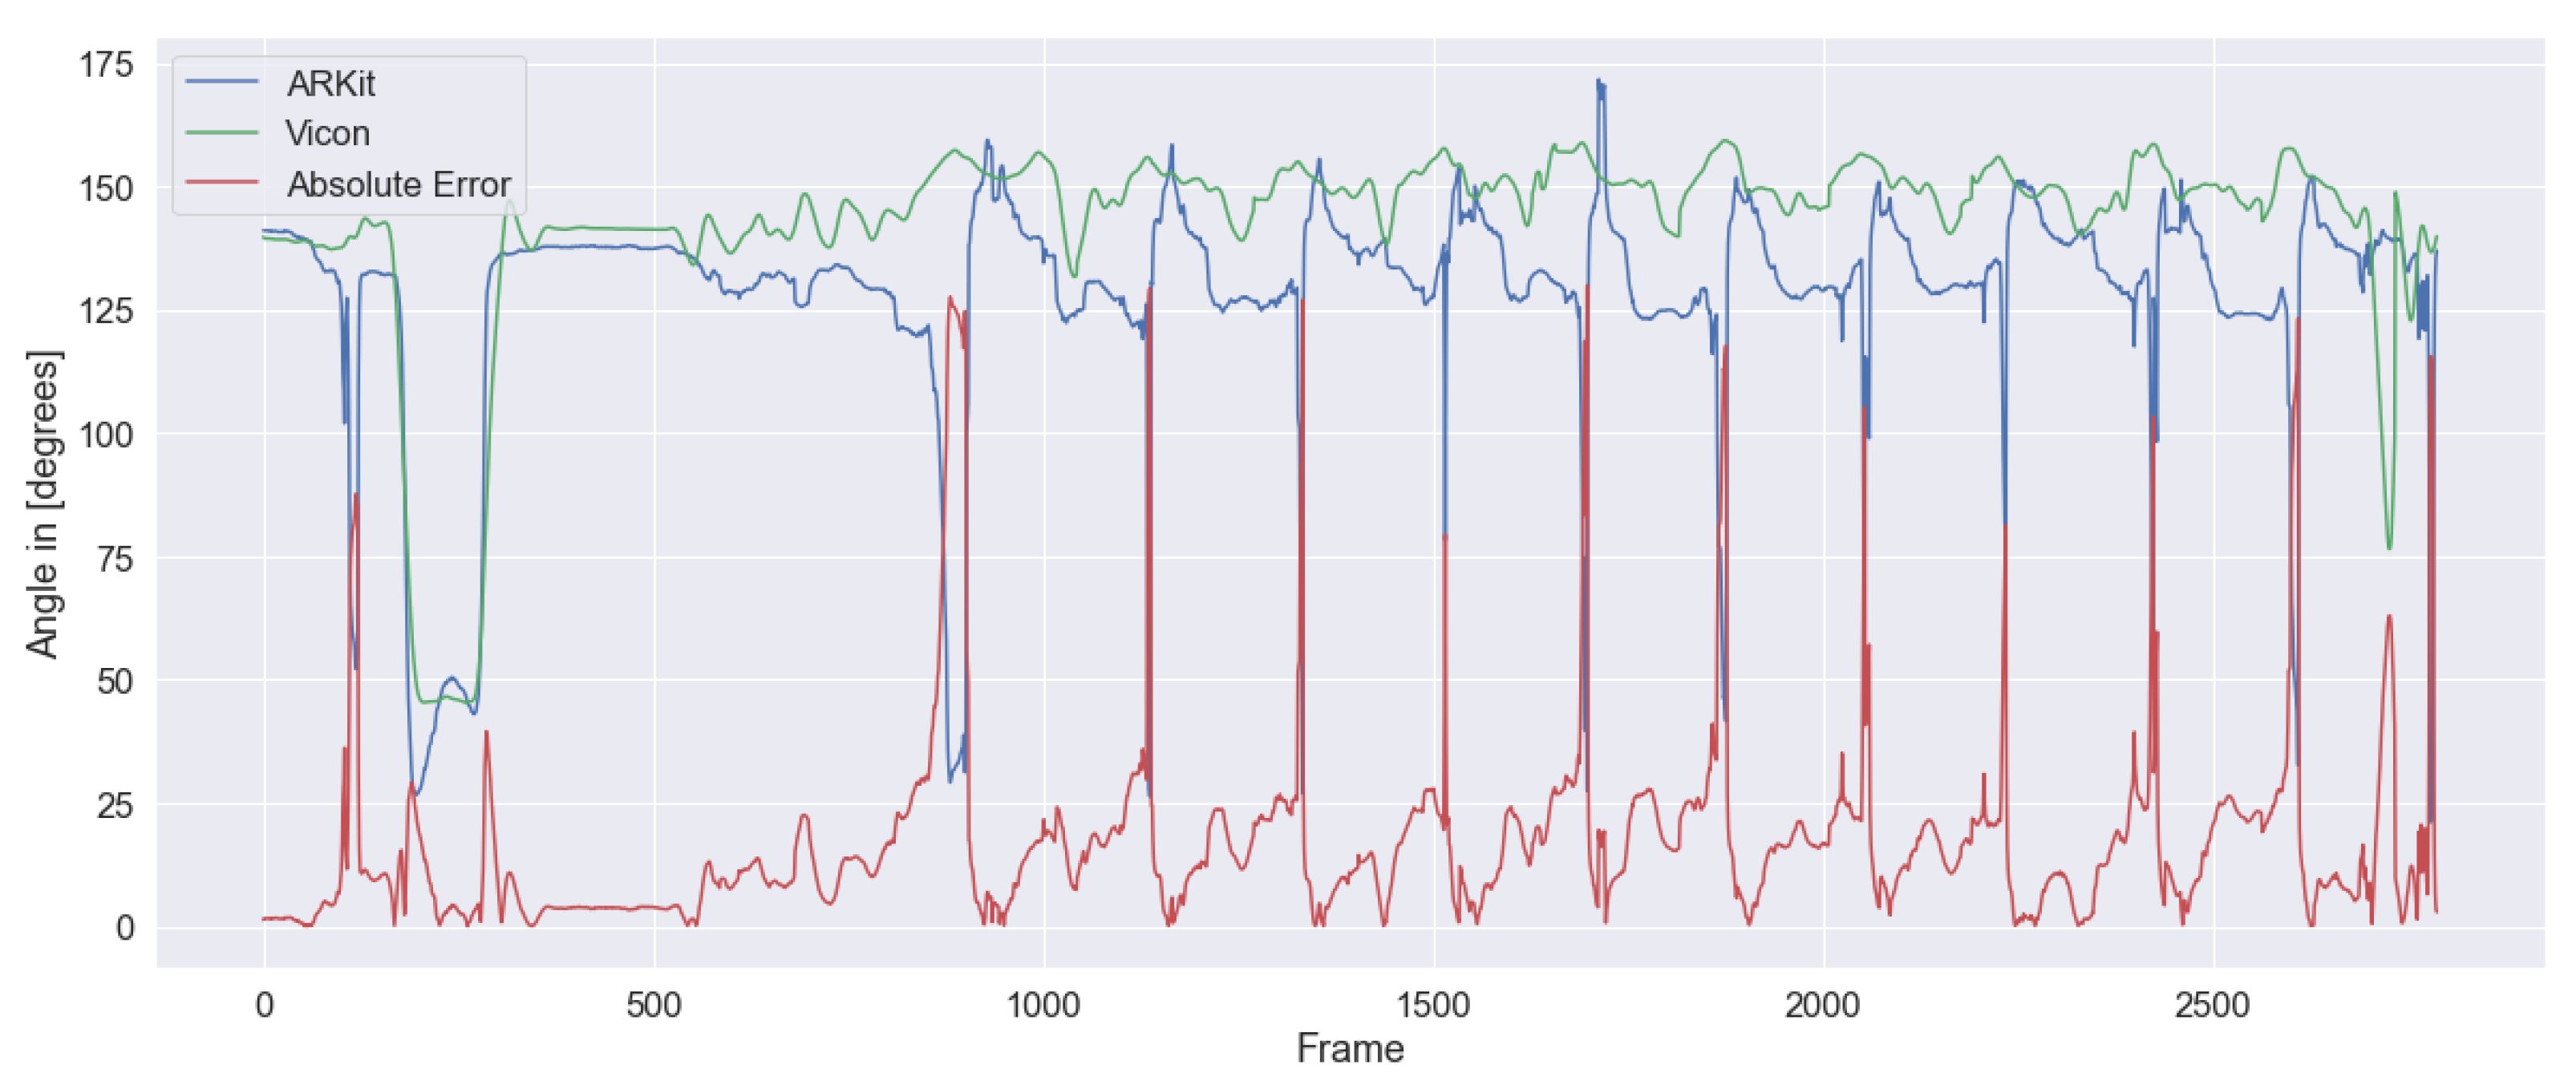
A commonly observed issue with the ARKit data were a reduced amplitude, and a baseline drift along the y-axis (see Figure 7), though the motion was tracked quite reliable. This issue was particularly the case for the lower body joints and led to a higher wMAE in those joints, but was also observed in other joints. In the screencasts of the recording, we often noticed that the detection of the hip joints was incorrect (Figure 13) and even varied during the execution of the exercise. Such shifts on the sagittal plane explain both the baseline drift and the amplitude reduction in the hip, knee, and shoulder angles, as all of them rely on the hip joints for their calculation. Especially from a side perspective, the hip joints allow for the most considerable deviations along the sagittal plane due to the amount or muscle and fat tissue around the pelvis. In the example of Figure 13, another issue aggravates the correct detection of the hip joints: the camera perspective was optimized for tracking the legs’ position, which in this case means that the right joint hides the left hip joint. This positioning implies that ARKit needs to rely on other body landmarks to estimate its position. Finding an optimal camera position in which all joints are completely visible might not be possible for all movements.

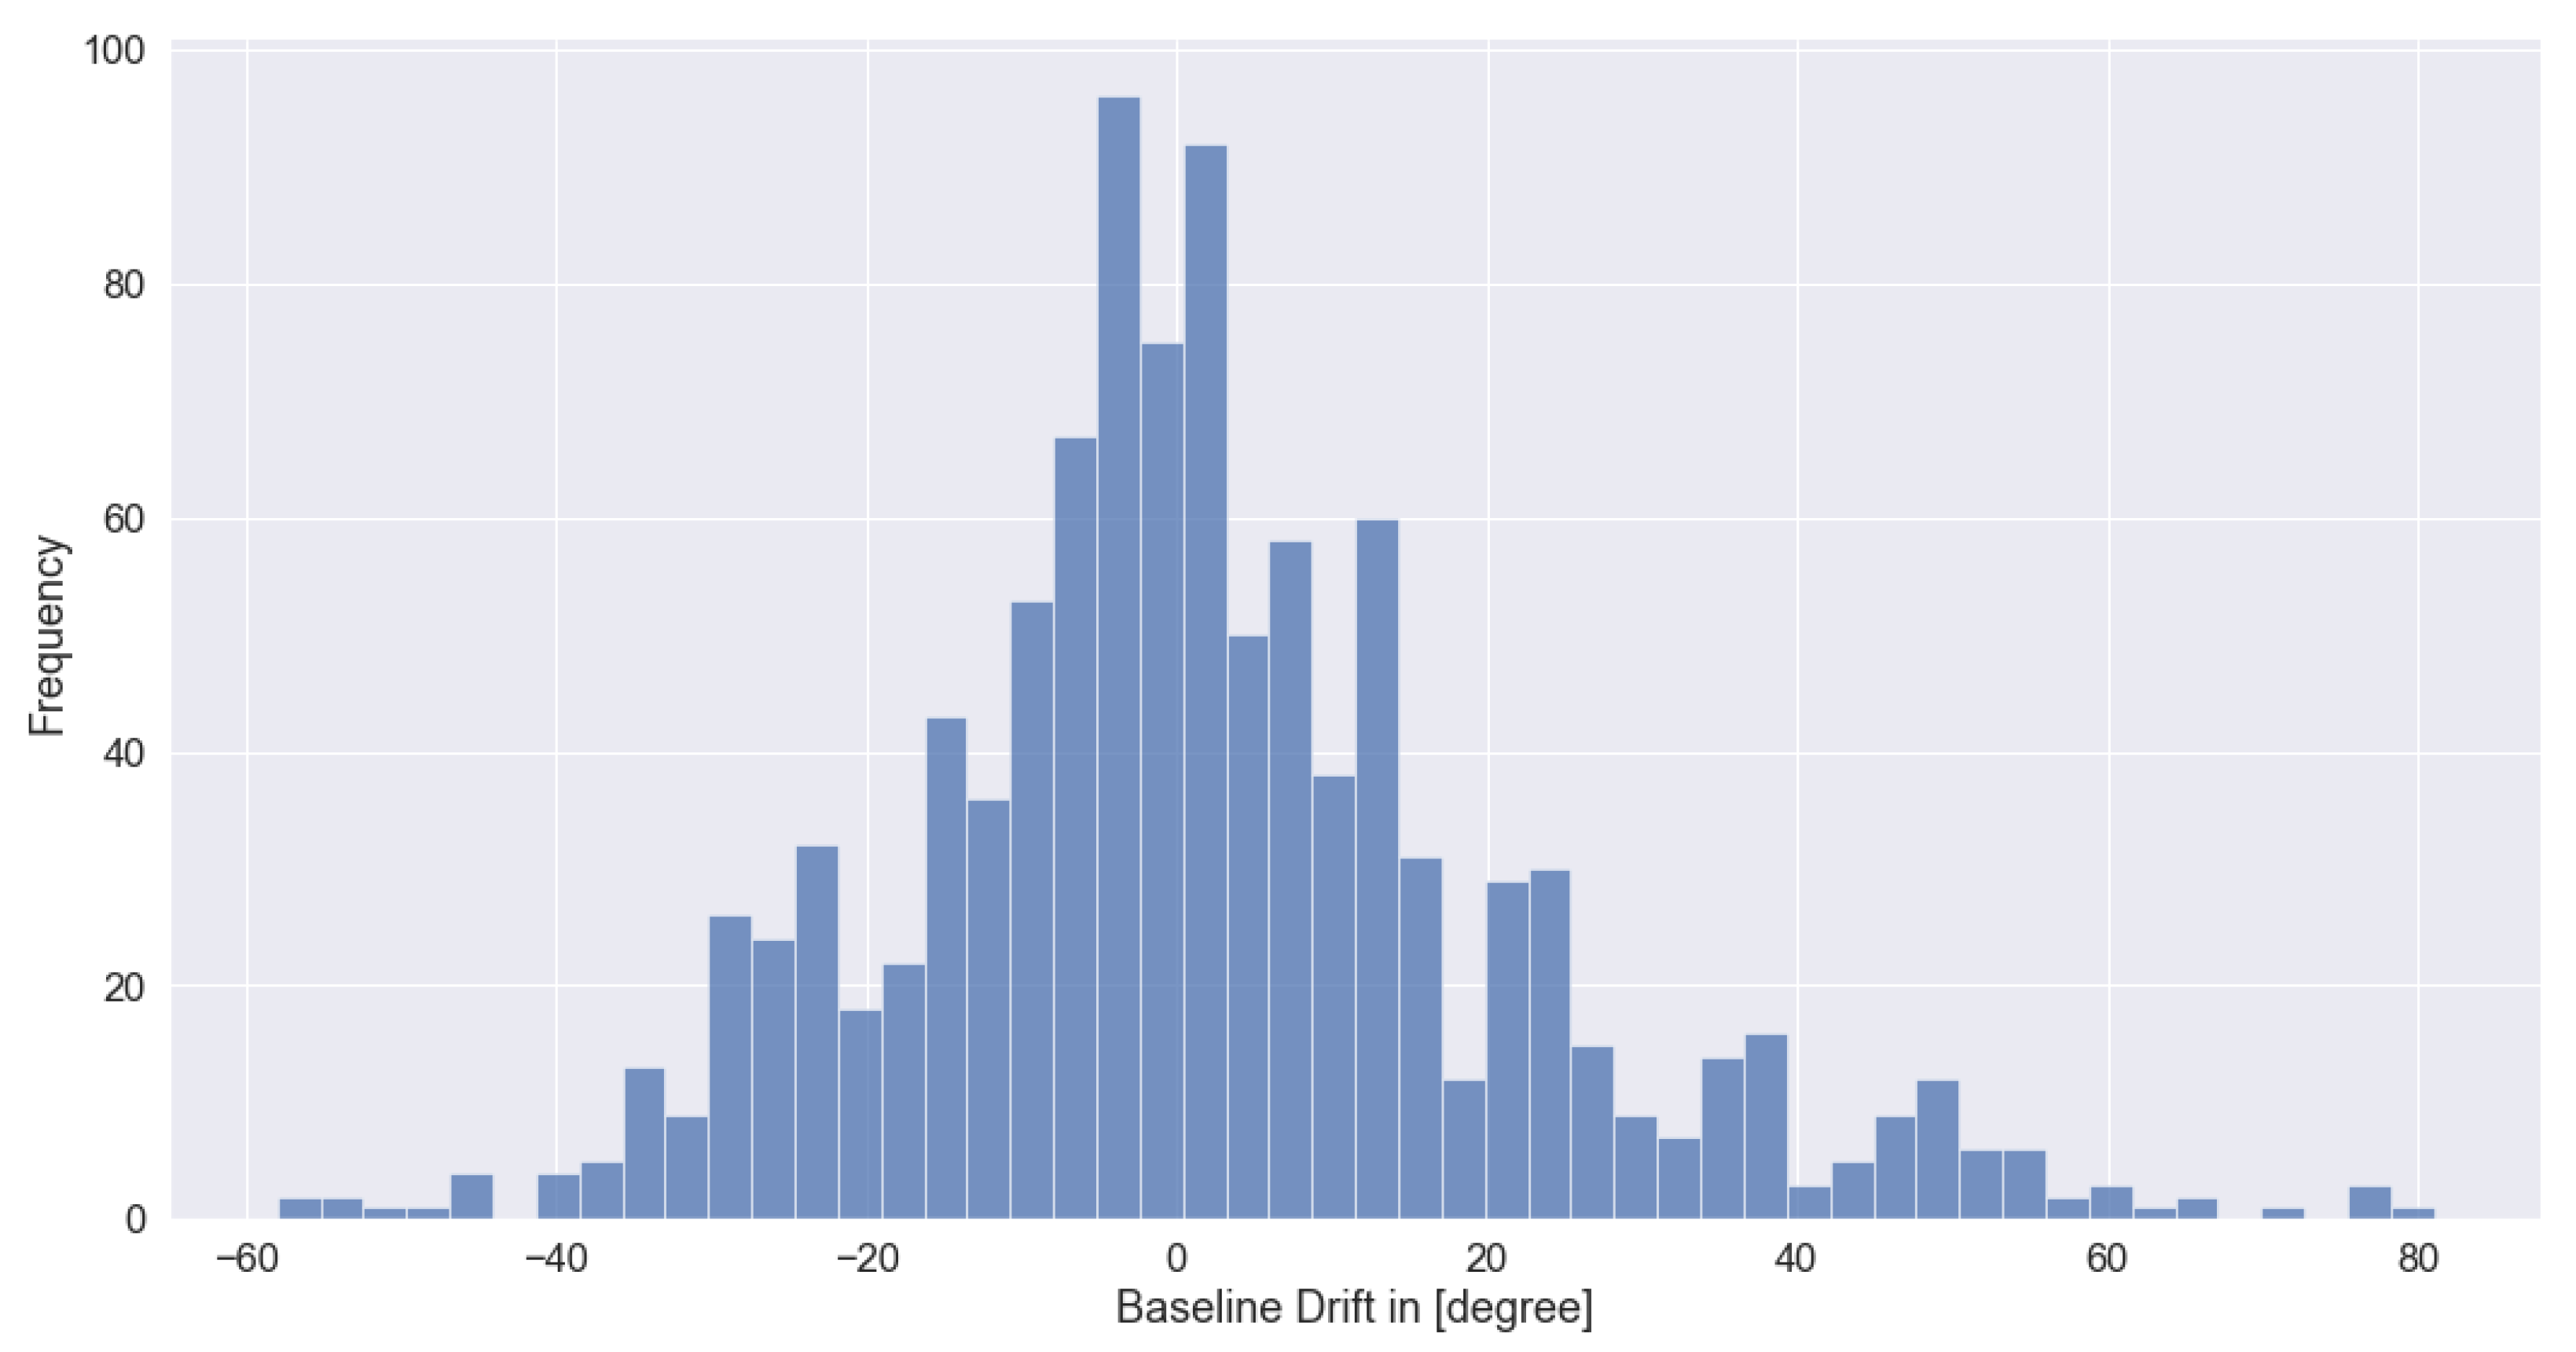
5.5. Improving the ARKit Data during Post-Processing

The good correlation results opened up the question of whether it is possible to improve the ARKit motion capture data through post-processing to approximate the Vicon data. A systematic error concerning detecting the hip joints in a position too far anterior is a possible explanation and is subject to further investigation. If this is the case, both the baseline shift and the amplitude reduction could be corrected by applying a scale factor and shifting the data on the y-axis. Compensating the baseline shift would reduce the wMAE results by 7.61 and lead to more reliable and accurate results. However, no systematic error could be found when shifting the ARKit data along the y-axis by vertically shifting the ARKit data (Figure 9). The observed shift instead seems to be caused by other factors such as the incorrect detection of joints.
During the data analysis, we used a sliding window approach to maximizing the cross-correlation between the ARKit and Vicon data to compensate for possible time lags, as no synchronization of the iPads and the Vicon system was possible during the experiment. Possible reasons for lags are different hardware clocks and the delay of the body detection algorithm of the ARKit framework. The sliding window was set to a maximum of 120 frames, which equals approximately 2 s, only to allow reasonable shifts within the exercises and compensate for the lag caused by technical limitations. The approach was chosen to maximize the comparability between the results of the two systems. However, as the sliding window approach was applied individually to each angle, exercise, subject, and view, each configuration was shifted to its optimal result within the given time window. This approach does not consider potential lags within ARKit’s motion capture, for example, a slower recognition of changes for some parts of the recognized body.

5.6. Comparing the Results of 2D and 3D Motion Capture Systems

As stated in the analysis of Sarafianos et al. [31], monocular video-based motion capture systems exhibit several limitations, which reduce their applicability to real-world scenarios. Among the most significant limitations are the ambiguities of the detected poses due to occlusion and distortion of the camera image caused by the camera’s viewing angle and position [31], which is a relevant limitation in both 2D and 3D motion capture systems. In this research, we were able to show that ARKit, as an example for 3D motion capture systems supported by different smartphone sensors, is robust against a variation of 30° regarding the positioning of the device. The factor analysis did not expose an influence of the device position. However, poor visibility of joints still led to significant decreases in the accuracy of the measured angles. Mobile 3D motion capture frameworks based on monocular video data such as ARKit improve some of the limitations of 2D motion capture systems but cannot overcome them completely.

5.7. Potential Use Cases for Mobile 3D Motion Capture-Based Applications

The findings of this research raise the question of possible application areas for human motion capture using mobile 3D motion capture frameworks such as Apple ARKit. Referring to the three categories defined by Moeslund et al. [2], such frameworks could be applied to use cases in categories (2) interacting with software or (3) motion analysis for medical examinations or performance analysis, as it focuses on tracking single bodies rather than observing crowds. The results suggest that ARKit can track a motion’s progression reliably but with relatively high error rates, depending on the joint of interest. Human motion capture using ARKit is further limited to a relatively small set of trackable joints. For example, the hand and toe joints are not actively tracked but calculated based on the angle and wrist joints, limiting the trackable joint angles to the shoulder, elbow, hip, and knee. However, mobile 3D motion capture frameworks are a promising technology for use cases that focus on tracking a specific motion of body parts rather than the exact joint position. Such use cases can be seen in category (2), such as interacting with software through gestures or other movements. Potential use cases in (3) include sports applications for amateurs or physiotherapy applications, which could focus on counting repetitions of a specific exercise. Depending on the motion and joint of interest, specific use cases relying on the exact joint position and angle data might be possible if the two main requirements for a good tracking presented at the beginning of this section can be met. For example, such use cases could include measuring the possible range of motion of a joint before and after a particular intervention and monitoring the progress in the medical field, or correcting the execution of a specific exercise in sports and physiotherapy applications. Using mobile 3D motion capture frameworks in these use cases would extend the usage of human motion capture technologies beyond professional settings and allow day-to-day usage at home, performed by consumers. ARKit and other mobile IPS systems enable new use cases, especially in mHealth, which were not possible with previous HMC systems. Our findings show how mobile 3D motion capture frameworks can be applied and how mHealth applications could leverage the software for future applications. However, the limitations of 3D motion capture frameworks and ARKit’s boundaries, in particular, need to be considered and should be evaluated before applying the technology to specific use cases.

5.8. Limitations

The design of this research includes several limitations. While the lab experiment produced a data set of over 1000 exercise executions, the data were collected from ten study participants only due to the restrictions caused by the ongoing COVID-19 pandemic. The limited number of participants might limit the external validity of this research. The participants’ traits further limit the external validity. While covering heights between 156 cm and 198 cm, their body mass index was in a normal range. In addition, all participants had a lighter skin tone. The experiment was conducted in a laboratory with controlled background and lighting conditions.
Even though the study setup aimed at reducing possible influences on the study’s internal validity which were not part of the observation, the impact of additional factors cannot be eliminated. Possible factors include the influence of the specific performance of the exercises by the subjects or the effect of the clothing worn. Furthermore, the subjects were recruited from the social surroundings of the researchers. They might not be representative of the whole population. The internal validity is further affected by the sliding window approach to compensate for the time lag due to missing clock synchronization and processing time. While the approach is limited to a maximum window of approximately two seconds, this shift could still have improved the results above the observable results. Additionally, the data set contained a reduced amount of exercise data for the upper body joints due to the export problems of the iPad on the side position. We applied the Welch ANOVA test to identify dependencies of the MAE instead of the ANOVA test, as the variance of the individual factors was not equally distributed. However, another prerequisite for (Welch) ANOVA and Welch t-test, normally distributed data, was only partially given for the MAE, even though the ANOVA analysis is said to be quite robust against this problem. We applied a logarithmic transformation to the data before performing the ANOVA and t-tests to overcome these limitations. Moreover, the observations used in (Welch) ANOVA should be independent of each other. In our experiment setup, the recording of angle motion happened simultaneously in all subjects and exercises. The observed angle deviations of the systems are expected to be independent. However, a poorly tracked angle might cause a higher risk to affect another angle’s accuracy in a real-world scenario. Thus, the assumption of independent observations is hard to verify. Moreover, ARKit is only one example of a mobile 3D motion capture framework. Other frameworks rely on different technologies and algorithms and could exhibit different results and limitations.

6. Conclusions

This research evaluated mobile 3D motion capture based on the example of ARKit, Apple’s framework for smartphone-based 3D motion capture. In contrast to existing monocular motion capture software, ARKit detects the human body in a 3-dimensional space instead of only two dimensions and augments its results by using smartphone sensor data such as IMU or depth data from the integrated LiDAR sensor. Our laboratory experiment, including ten participants, investigated ARKit’s accuracy and influencing factors in eight body-weight exercises and compared it to the Vicon system, a gold standard for human motion capture. Our results provide evidence that mobile 3D motion capture frameworks can track the motion’s progression with reasonable accuracy but with relatively high mean absolute error rates. The accuracy mainly depends on two factors: the visibility of the joints of interest and the observed motion. In contrast to 2D systems, the 3D motion capture framework exposed certain robustness against the positioning of the camera. However, similar limitations regarding the tracking of poorly visible joints remain.
Mobile 3D motion capture frameworks are promising and lightweight mobile technologies which could enable new use cases for human-computer interaction through motion or application in health and medical fields. Their limitations, especially regarding the relatively high error rates compared to the gold standard system, need to be considered for each use case.

Author Contributions

Conceptualization, L.M.R., M.K., T.F. and S.M.J.; methodology, L.M.R., M.K. and S.M.J.; software, L.M.R.; validation, L.M.R., M.K., T.F. and S.M.J.; formal analysis, M.K. and L.M.R.; investigation, L.M.R. and T.F.; resources, L.M.R. and S.M.J.; data curation, M.K.; writing—original draft preparation, L.M.R., M.K. and T.F.; writing—review and editing, L.M.R., M.K. and S.M.J.; visualization, L.M.R. and M.K.; supervision, L.M.R. and S.M.J.; project administration, L.M.R.; funding acquisition, L.M.R. All authors have read and agreed to the published version of the manuscript.

Funding

This work was supported by a grant from Software Campus through the German Federal Ministry of Education and Research, grant number 01IS17049.

Institutional Review Board Statement

The study was conducted according to the guidelines of the Declaration of Helsinki, and approved by the Ethics Committee of the Technical University of Munich (Proposal 515/21 S on 19 August 2021). All participants were informed about the aims of the study and gave their consent about the publication of the anonymized data.

Informed Consent Statement

Informed consent was obtained from all subjects involved in the study. Written informed consent has been obtained from the subjects to publish this paper.

Data Availability Statement

All data is available on Zenodo [49].

Acknowledgments

We want to thank Florian Kreuzpointner for his support during the planning and execution of the study as well as the participants of the study.

Conflicts of Interest

The authors declare no conflict of interest. The funders had no role in the design of the study; in the collection, analyses, or interpretation of data; in the writing of the manuscript, or in the decision to publish the results.

Abbreviations

The following abbreviations are used in this manuscript:
AOIAngles of Interest
EMSElectromagnetig Measurement Systems
FLFront Lunge
HMCHuman Motion Capture
IPSImage Processing Systems
IMUInertial Measurement Unit
JJJumping Jacks
LARLateral Arm Raise
LECLeg Extension Crunch
LELeft Elbow
LHLeft Hip
LKLeft Knee
LSLeft Shoulder
MAEMean Absolute Error
MEMean Error
OMSOptoelectronic Measurement Systems
PCCPearson Correlation Coefficient
RERight Elbow
RFReverse Fly
RHRight Hip
RKRight Knee
RSRight Shoulder
SSquat
SDKSoftware Development Kit
SSSide Squat
SLDSingle Leg Deadlift
ULSUltrasonic Localization Systems
wMAEWeighted Mean Absolute Error

Appendix A. Distributions of the Factors Used in the Welch ANOVA Analysis

Figure A1. Distributions of the individual factors of the MAE on the logarithmic scale used in the factor analysis. Due to the transformation on the logarithmic scale, all factors are sufficiently close to a normal distribution, so that a factor analysis using Welch ANOVA/t-tests should be possible.
Applsci 12 04806 g0a1
Figure A2. Distributions of the individual factors of the ME on the logarithmic scale used in the Welch ANOVA analysis. All of the factors show a distribution which is sufficiently close to a normal distribution so that an ANOVA analysis should be possible.
Applsci 12 04806 g0a2

Appendix B. Bias

Figure A3. Pivot Table of the average Mean Error (ME) distributed over the eight exercises and the eight tracked angles, each measured from the two iPad perspectives Frontal and Side. The dashed boxes indicate which joints were specifically targeted by the respective exercise. The heatmap visualizes the performance of the individual joints per exercise, with darker purple color hinting at underestimation and darker orange color hinting at overestimation. Values closer to zero either indicate good performance or error cancellation.
Applsci 12 04806 g0a3
Figure A4. Pivot Table of the ratio of the ME divided by the MAE distributed over the eight exercises and the eight tracked angles, each measured from the two iPad perspectives Frontal and Side. The dashed boxes indicate which joints were specifically targeted by the respective exercise. The heatmap visualizes the performance of the individual joints per exercise. Values close to zero indicate either good performance of the tracking or over- and underestimation canceling each other out. Values closer to −1 and 1 hint at systematic under- and overestimation in the specific configuration.
Applsci 12 04806 g0a4

Appendix C. ANOVA Post-Hoc Analysis

Appendix C.1. Mean Absolute Error

Table A1. The results of the ANOVA Post-hoc analysis of the MAE for the eight exercises Front Lunge (FL), Jumping Jacks (JJ), Lateral Arm Raise (LAR), Leg Extension Crunch (LEC), Reverse Fly (RF), Side Squat (SS), Single Leg Deadlift (SLD), and Squat (S).
ABMean(A)Mean(B)DiffseTdfp η 2
FLJJ2.782.250.530.069.69242.950.000.26
FLLAR2.782.040.740.0710.05240.850.000.28
FLLEC2.782.81−0.030.06−0.49254.871.000.00
FLRF2.782.610.170.072.53254.890.190.02
FLSS2.783.32−0.540.06−9.35257.600.000.25
FLSLD2.782.330.450.067.51253.760.000.18
FLS2.783.49−0.710.05−14.17204.840.000.43
JJLAR2.252.040.210.073.12204.180.040.04
JJLEC2.252.81−0.560.05−11.29258.380.000.33
JJRF2.252.61−0.360.06−5.85221.580.000.12
JJSS2.253.32−1.070.05−21.28255.860.000.63
JJSLD2.252.33−0.080.05−1.51238.680.800.01
JJS2.253.49−1.240.04−30.34241.510.000.78
LARLEC2.042.81−0.770.07−11.00219.240.000.31
LARRF2.042.61−0.570.08−7.24236.940.000.17
LARSS2.043.32−1.280.07−18.19224.120.000.56
LARSLD2.042.33−0.290.07−4.03230.320.000.06
LARS2.043.49−1.450.06−22.61173.710.000.66
LECRF2.812.610.200.063.13236.940.040.04
LECSS2.813.32−0.520.05−9.96261.640.000.26
LECSLD2.812.330.480.068.66249.270.000.23
LECS2.813.49−0.680.04−15.40226.490.000.47
RFSS2.613.32−0.710.06−11.10241.490.000.32
RFSLD2.612.330.280.074.22244.660.000.07
RFS2.613.49−0.880.06−15.39186.050.000.47
SSSLD3.322.330.990.0617.69251.450.000.55
SSS3.323.49−0.170.04−3.63221.600.010.05
SLDS2.333.49−1.160.05−24.28200.970.000.70

Appendix C.2. Mean Error

Table A2. The results of the ANOVA Post-hoc analysis of the ME for the eight angles left elbow (LE), left hip (LH), left knee (LK), left shoulder (LS), right elbow (RE), right hip (RH), right knee (RK), and right shoulder (RS).
ABMean(A)Mean(B)DiffseTdfp η 2
LELH4.104.55−0.450.06−7–73110.780.000.19
LELK4.104.40−0.290.06−5.03111.830.000.09
LELS4.104.22−0.110.06−1.78148.180.630.01
LERE4.104.25−0.150.07−2.14177.590.390.02
LERH4.104.60−0.500.06−8.54110.200.000.23
LERK4.104.44−0.340.06−5.74111.850.000.12
LERS4.104.27−0.170.06−2.69134.330.140.03
LHLK4.554.400.160.029.12315.230.000.21
LHLS4.554.220.340.0311.13138.850.000.33
LHRE4.554.250.300.047.63121.900.000.19
LHRH4.554.60−0.050.02−2.81313.630.100.02
LHRK4.554.440.120.026.71315.190.000.12
LHRS4.554.270.280.0311.03155.720.000.33
LKLS4.404.220.180.035.92143.190.000.12
LKRE4.404.250.150.043.68124.270.010.05
LKRH4.404.60−0.200.02−11.99313.810.000.31
LKRK4.404.44−0.040.02−2.34318.000.280.02
LKRS4.404.270.130.034.91161.840.000.09
LSRE4.224.25−0.030.05−0.72187.271.000.00
LSRH4.224.60−0.380.03−12.72136.430.000.39
LSRK4.224.44−0.220.03−7.26143.280.000.17
LSRS4.224.27−0.050.04−1.45196.840.830.01
RERH4.254.60−0.350.04−8.82120.580.000.24
RERK4.254.44−0.190.04−4.71124.320.000.08
RERS4.254.27−0.020.04−0.41167.961.000.00
RHRK4.604.440.160.029.54313.750.000.22
RHRS4.604.270.330.0312.90152.290.000.40
RKRS4.444.270.170.036.49161.970.000.14

References

  1. Moeslund, T.B.; Granum, E. A Survey of Computer Vision-Based Human Motion Capture. Comput. Vis. Image Underst. 2001, 81, 231–268. [Google Scholar] [CrossRef]
  2. Moeslund, T.B.; Hilton, A.; Krüger, V. A survey of advances in vision-based human motion capture and analysis. Comput. Vis. Image Underst. 2006, 104, 90–126. [Google Scholar] [CrossRef]
  3. Chiari, L.; Croce, U.D.; Leardini, A.; Cappozzo, A. Human movement analysis using stereophotogrammetry. Gait Posture 2005, 21, 197–211. [Google Scholar] [CrossRef] [PubMed]
  4. Elliott, B.; Alderson, J. Laboratory versus field testing in cricket bowling: A review of current and past practice in modelling techniques. Sports Biomech. 2007, 6, 99–108. [Google Scholar] [CrossRef] [PubMed]
  5. Carse, B.; Meadows, B.; Bowers, R.; Rowe, P. Affordable clinical gait analysis: An assessment of the marker tracking accuracy of a new low-cost optical 3D motion analysis system. Physiotherapy 2013, 99, 347–351. [Google Scholar] [CrossRef] [PubMed]
  6. McLean, S.G. Evaluation of a two dimensional analysis method as a screening and evaluation tool for anterior cruciate ligament injury. Br. J. Sports Med. 2005, 39, 355–362. [Google Scholar] [CrossRef] [Green Version]
  7. van der Kruk, E.; Reijne, M.M. Accuracy of human motion capture systems for sport applications; state-of-the-art review. Eur. J. Sport Sci. 2018, 18, 806–819. [Google Scholar] [CrossRef]
  8. Belyea, B.C.; Lewis, E.; Gabor, Z.; Jackson, J.; King, D.L. Validity and Intrarater Reliability of a 2-Dimensional Motion Analysis Using a Handheld Tablet Compared With Traditional 3-Dimensional Motion Analysis. J. Sport Rehabil. 2015, 24, 2014-0194. [Google Scholar] [CrossRef] [Green Version]
  9. Paul, S.S.; Lester, M.E.; Foreman, K.B.; Dibble, L.E. Validity and Reliability of Two-Dimensional Motion Analysis for Quantifying Postural Deficits in Adults With and Without Neurological Impairment. Anat. Rec. 2016, 299, 1165–1173. [Google Scholar] [CrossRef] [Green Version]
  10. Springer, S.; Seligmann, G.Y. Validity of the Kinect for Gait Assessment: A Focused Review. Sensors 2016, 16, 194. [Google Scholar] [CrossRef]
  11. Puh, U.; Hoehlein, B.; Deutsch, J.E. Validity and Reliability of the Kinect for Assessment of Standardized Transitional Movements and Balance. Phys. Med. Rehabil. Clin. N. Am. 2019, 30, 399–422. [Google Scholar] [CrossRef]
  12. Schärer, C.; Siebenthal, L.V.; Lomax, I.; Gross, M.; Taube, W.; Hübner, K. Simple Assessment of Height and Length of Flight in Complex Gymnastic Skills: Validity and Reliability of a Two-Dimensional Video Analysis Method. Appl. Sci. 2019, 9, 3975. [Google Scholar] [CrossRef] [Green Version]
  13. Alahmari, A.; Herrington, L.; Jones, R. Concurrent validity of two-dimensional video analysis of lower-extremity frontal plane of movement during multidirectional single-leg landing. Phys. Ther. Sport 2020, 42, 40–45. [Google Scholar] [CrossRef]
  14. Vicon Motion Capture Systems. Available online: https://www.vicon.com (accessed on 26 January 2022).
  15. Qualisys Motion Capture Systems. Available online: https://www.qualisys.com (accessed on 26 January 2022).
  16. Xsens Motion Capture Systems. Available online: https://www.xsens.com (accessed on 26 January 2022).
  17. Perception Neuron Motion Capture. Available online: https://neuronmocap.com/ (accessed on 26 January 2022).
  18. Stelzer, A.; Pourvoyeur, K.; Fischer, A. Concept and Application of LPM—A Novel 3-D Local Position Measurement System. IEEE Trans. Microw. Theory Tech. 2004, 52, 2664–2669. [Google Scholar] [CrossRef]
  19. OpenPose: Real-Time Multi-Person Keypoint Detection Library for Body, Face, Hands, and Foot Estimation. Available online: https://github.com/CMU-Perceptual-Computing-Lab/openpose (accessed on 26 January 2022).
  20. ARKit: Capturing Body Motion in 3D. Available online: https://developer.apple.com/documentation/arkit/content_anchors/capturing_body_motion_in_3d (accessed on 26 January 2022).
  21. Vision: Detecting Human Body Poses in Images. Available online: https://developer.apple.com/documentation/vision/detecting_human_body_poses_in_images (accessed on 26 January 2022).
  22. TensorFlow Pose Estimate. Available online: https://www.tensorflow.org/lite/examples/pose_estimation/overview (accessed on 26 January 2022).
  23. Cao, Z.; Hidalgo, G.; Simon, T.; Wei, S.E.; Sheikh, Y. OpenPose: Realtime Multi-Person 2D Pose Estimation Using Part Affinity Fields. IEEE Trans. Pattern Anal. Mach. Intell. 2021, 43, 172–186. [Google Scholar] [CrossRef] [PubMed] [Green Version]
  24. Whittle, M.W. Clinical gait analysis: A review. Hum. Mov. Sci. 1996, 15, 369–387. [Google Scholar] [CrossRef]
  25. Oyebode, O.; Ndulue, C.; Alhasani, M.; Orji, R. Persuasive Mobile Apps for Health and Wellness: A Comparative Systematic Review. In Lecture Notes in Computer Science; Springer International Publishing: Zurich, Switwerland, 2020; pp. 163–181. [Google Scholar] [CrossRef]
  26. Research2guidance. Number of Downloads of mHealth Apps Worldwide from 2013 to 2018 (in Billions) [Graph]. 2018. Available online: https://de-statista-com/statistik/daten/studie/695434/umfrage/nummer-der-weltweiten-downloads-von-mhealth-apps/ (accessed on 26 January 2022).
  27. Schoeppe, S.; Alley, S.; Lippevelde, W.V.; Bray, N.A.; Williams, S.L.; Duncan, M.J.; Vandelanotte, C. Efficacy of interventions that use apps to improve diet, physical activity and sedentary behaviour: A systematic review. Int. J. Behav. Nutr. Phys. Act. 2016, 13, 127. [Google Scholar] [CrossRef] [Green Version]
  28. Boulos, M.N.K.; Brewer, A.C.; Karimkhani, C.; Buller, D.B.; Dellavalle, R.P. Mobile medical and health apps: State of the art, concerns, regulatory control and certification. Online J. Public Health Inform. 2014, 5, 229. [Google Scholar] [CrossRef] [Green Version]
  29. Lopes, T.J.A.; Ferrari, D.; Ioannidis, J.; Simic, M.; Azevedo, F.M.D.; Pappas, E. Reliability and Validity of Frontal Plane Kinematics of the Trunk and Lower Extremity Measured with 2-Dimensional Cameras During Athletic Tasks: A Systematic Review with Meta-analysis. J. Orthop. Sports Phys. Ther. 2018, 48, 812–822. [Google Scholar] [CrossRef]
  30. Zago, M.; Luzzago, M.; Marangoni, T.; Cecco, M.D.; Tarabini, M.; Galli, M. 3D Tracking of Human Motion Using Visual Skeletonization and Stereoscopic Vision. Front. Bioeng. Biotechnol. 2020, 8, 181. [Google Scholar] [CrossRef]
  31. Sarafianos, N.; Boteanu, B.; Ionescu, B.; Kakadiaris, I.A. 3D Human pose estimation: A review of the literature and analysis of covariates. Comput. Vis. Image Underst. 2016, 152, 1–20. [Google Scholar] [CrossRef]
  32. Cao, Z.; Simon, T.; Wei, S.E.; Sheikh, Y. Realtime Multi-Person 2D Pose Estimation Using Part Affinity Fields; CVPR: Prague, Czech Republic, 2017. [Google Scholar]
  33. Simon, T.; Joo, H.; Matthews, I.; Sheikh, Y. Hand Keypoint Detection in Single Images Using Multiview Bootstrapping; CVPR: Prague, Czech Republic, 2017. [Google Scholar]
  34. Wei, S.E.; Ramakrishna, V.; Kanade, T.; Sheikh, Y. Convolutional Pose Machines; CVPR: Prague, Czech Republic, 2016. [Google Scholar] [CrossRef] [Green Version]
  35. D’Antonio, E.; Taborri, J.; Palermo, E.; Rossi, S.; Patane, F. A markerless system for gait analysis based on OpenPose library. In Proceedings of the 2020 IEEE International Instrumentation and Measurement Technology Conference (I2MTC), Dubrovnik, Croatia, 25–28 May 2020; IEEE: Dubrovnik, Croatia, 2020. [Google Scholar] [CrossRef]
  36. Ota, M.; Tateuchi, H.; Hashiguchi, T.; Kato, T.; Ogino, Y.; Yamagata, M.; Ichihashi, N. Verification of reliability and validity of motion analysis systems during bilateral squat using human pose tracking algorithm. Gait Posture 2020, 80, 62–67. [Google Scholar] [CrossRef] [PubMed]
  37. Nakano, N.; Sakura, T.; Ueda, K.; Omura, L.; Kimura, A.; Iino, Y.; Fukashiro, S.; Yoshioka, S. Evaluation of 3D Markerless Motion Capture Accuracy Using OpenPose With Multiple Video Cameras. Front. Sports Act. Living 2020, 2, 50. [Google Scholar] [CrossRef] [PubMed]
  38. MediaPipe Pose. Available online: https://google.github.io/mediapipe/solutions/pose.html (accessed on 18 March 2022).
  39. Bazarevsky, V.; Grishchenko, I.; Raveendran, K.; Zhu, T.; Zhang, F.; Grundmann, M. BlazePose: On-device Real-time Body Pose tracking. arXiv 2020, arXiv:2006.10204. [Google Scholar]
  40. Zhou, X.; Leonardos, S.; Hu, X.; Daniilidis, K. 3D shape estimation from 2D landmarks: A convex relaxation approach. In Proceedings of the 2015 IEEE Conference on Computer Vision and Pattern Recognition (CVPR), Boston, MA, USA, 7–15 June 2015; IEEE: Boston, MA, USA, 2015; pp. 4447–4455. [Google Scholar] [CrossRef] [Green Version]
  41. Zhou, X.; Zhu, M.; Leonardos, S.; Derpanis, K.G.; Daniilidis, K. Sparseness Meets Deepness: 3D Human Pose Estimation from Monocular Video. In Proceedings of the 2016 IEEE Conference on Computer Vision and Pattern Recognition (CVPR), Las Vegas, NV, USA, 27–30 June 2016; IEEE: Las Vegas, NV, USA, 2016; pp. 4966–4975. [Google Scholar] [CrossRef] [Green Version]
  42. Akhter, I.; Black, M.J. Pose-conditioned joint angle limits for 3D human pose reconstruction. In Proceedings of the 2015 IEEE Conference on Computer Vision and Pattern Recognition (CVPR), Boston, MA, USA, 7–15 June 2015; IEEE: Boston, MA, USA, 2015; pp. 1446–1455. [Google Scholar] [CrossRef]
  43. Ma, F.; Cavalheiro, G.V.; Karaman, S. Self-Supervised Sparse-to-Dense: Self-Supervised Depth Completion from LiDAR and Monocular Camera. In Proceedings of the 2019 International Conference on Robotics and Automation (ICRA), Montreal, QC, Canada, 20–24 May 2019; IEEE: Montreal, QC, Canada, 2019; pp. 3288–3295. [Google Scholar] [CrossRef] [Green Version]
  44. Reimer, L.M.; Weigel, S.; Ehrenstorfer, F.; Adikari, M.; Birkle, W.; Jonas, S. Mobile Motion Tracking for Disease Prevention and Rehabilitation Using Apple ARKit. In Studies in Health Technology and Informatics; Hayn, D., Schreier, G., Baumgartner, M., Eds.; IOS Press: Amsterdam, The Netherlands, 2021. [Google Scholar] [CrossRef]
  45. Basiratzadeh, S.; Lemaire, E.D.; Baddour, N. Augmented Reality Approach for Marker-based Posture Measurement on Smartphones. In Proceedings of the 2020 42nd Annual International Conference of the IEEE Engineering in Medicine & Biology Society (EMBC), Montreal, QC, Canada, 20–24 July 2020; IEEE: Montreal, QC, Canada, 2020; pp. 4612–4615. [Google Scholar] [CrossRef]
  46. Full Body Modeling with Plug-In Gait. Available online: https://docs.vicon.com/display/Nexus212/Full+body+modeling+with+Plug-in+Gait (accessed on 26 January 2022).
  47. Schmider, E.; Ziegler, M.; Danay, E.; Beyer, L.; Bühner, M. Is It Really Robust?: Reinvestigating the Robustness of ANOVA Against Violations of the Normal Distribution Assumption. Methodology 2010, 6, 147–151. [Google Scholar] [CrossRef]
  48. Games, P.A.; Howell, J.F. Pairwise multiple comparison procedures with unequal n’s and/or variances: A Monte Carlo study. J. Educ. Stat. 1976, 1, 113–125. [Google Scholar]
  49. Reimer, L.M.; Kapsecker, M.; Fukushima, T.; Jonas, S.M. A Dataset for Evaluating 3D Motion Captured Synchronously by ARKit and Vicon. ZENODO 2022. [Google Scholar] [CrossRef]
Figure 1. The execution of all eight exercises as seen from the frontally positioned iPad. The body orientation was chosen to maximize the visible parts of the body.
Applsci 12 04806 g001
Figure 2. The experiment setup, showing the positioning of the recording devices and the subject.
Applsci 12 04806 g002
Figure 3. Shift of the data.
Applsci 12 04806 g003
Figure 4. Pivot Table of the weighted Mean Absolute Error (wMAE) in degrees distributed over the eight exercises and the eight tracked angles, each measured from the two iPad perspectives Frontal and Side. The dashed boxes indicate which joints were specifically targeted by the respective exercise. The heatmap visualizes the performance of the individual joints per exercise, with darker green color referring to a lower error rate and darker orange color referring to higher error rates.
Applsci 12 04806 g004
Figure 5. Pivot Table of the average Spearman Rank Correlation Coefficients (SRCC) distributed over the eight exercises and the eight tracked angles, each measured from the two iPad perspectives Frontal and Side. The dashed boxes indicate which joints were specifically targeted by the respective exercise. The heatmap visualizes the performance of the individual joints per exercise, with darker green color referring to a higher positive correlation and darker orange color referring to a higher negative correlation.
Applsci 12 04806 g005
Figure 6. Left hip angle of one of the subjects in the Single Leg Deadlift exercise in degrees, which shows a nearly perfectly overlapping curves of the ARKit and Vicon data.
Applsci 12 04806 g006
Figure 7. Left hip angle of one of the subjects in the Side Squat exercise in degrees. The plot shows that while the motion pattern is visible in both recordings, ARKit exposes a reduced amplitude and a shift on the y-axis.
Applsci 12 04806 g007
Figure 8. Right elbow angle of one of the subjects in the Squat exercise in degrees, which shows bad tracking quality with a lot of noise compared to the Vicon data.
Applsci 12 04806 g008
Figure 9. Results of the baseline drift analysis of the ARKit data. This is computed by minimizing the MAE by shifting the ARKit data vertically. The results show a normal distribution around 0, thus indicating no systematic baseline drift of the ARKit results.
Applsci 12 04806 g009
Figure 10. Boxplots representing the MAE in degrees on the logarithmic scale across all performed exercises and the pelvic center moved variable in the experiments. Both boxplots show significant differences in the mean and variance across the variables.
Applsci 12 04806 g010
Figure 11. Left elbow angle of one of the subjects in the Single Leg Deadlift exercise, which shows several unexpected spikes during the execution. The spikes originate from ARKit incorrectly detecting the joint’s position, most probably because of bad visibility of the elbow joint during the exercise.
Applsci 12 04806 g011
Figure 12. Boxplots representing the ME and MAE in degrees across all tracked angles in the experiments. The boxplots for the ME show a significant difference in the means of the upper and lower body angles, which is not visible for the MAE.
Applsci 12 04806 g012
Figure 13. Exemplary screenshot of the frontal ARKit recording of one subject during the Single Leg Deadlift exercise, showing a bad detection of the hip joints and confusion of the knee joints.
Applsci 12 04806 g013
Table 1. The aggregated wMAE values for all joint angles.
AnglewMAE
leftElbow 24.0 ± 17.43
leftHip 16.91 ± 10.67
leftKnee 16.61 ± 7.47
leftShoulder 20.01 ± 14.89
rightElbow 20.0 ± 15.32
rightHip 20.17 ± 11.25
rightKnee 17.57 ± 7.25
rightShoulder 17.39 ± 12.18
Table 2. The wMAE values for all exercises when considering all angles and only the targeted angles per exercise.
All AnglesTargeted Angles
Front Lunge 18.19 ± 8.98 16.17 ± 5.48
Jumping Jacks 10.09 ± 3.81 10.09 ± 3.81
Lateral Arm Raise 9.56 ± 6.13 6.66 ± 2.41
Leg Extension Crunch 18.15 ± 8.21 15.14 ± 5.34
Reverse Fly 15.80 ± 8.5 10.67 ± 4.31
Side Squat 30.49 ± 12.73 24.56 ± 8.63
Single Leg Deadlift 11.35 ± 5.04 10.91 ± 4.41
Squat 33.79 ± 10.25 30.93 ± 6.19
Table 3. The aggregated SRCC values for all joint angles.
AngleSRCC
leftElbow0.36
leftHip0.82
leftKnee0.75
leftShoulder0.81
rightElbow0.42
rightHip0.84
rightKnee0.81
rightShoulder0.81
Table 4. The average SRCC values for all exercises when considering all angles and only the targeted angles per exercise.
SRCC All AnglesSRCC Targeted Angles Only
Front Lunge0.800.91
Jumping Jacks0.600.60
Lateral Arm Raise0.680.91
Leg Extension Crunch0.840.91
Reverse Fly0.670.69
Side Squat0.780.91
Single Leg Deadlift0.790.78
Squat0.780.89
Table 5. The results of the Random Effects ANOVA.
Random Effects
Groups Name Variance Std. Dev.
Subject(Intercept)0.0013120.03622
Residual 0.4583100.67699
Fixed Effects
EstimateStd. Errort value
(Intercept)2.708030.02389113.4
Table 6. The results of the Welch t-test Analysis.
TdofAlternativep-ValueCI95%Cohen-dBF10PowerResponseCategorical
−0.22966.81two-sided0.82[−0.09, 0.07]0.010.0730.06LogMAEView
−0.15725.74two-sided0.88[−0.1, 0.08]0.010.0720.05LogMAELowerBody
−13.201045.97two-sided0.00[−0.59, −0.44]0.823.266 × 10331.00LogMAECenterMoved
Table 7. The results of the logistic regression.
Variable β - coef stdzP > |z|[0.0250.975] Pseudo - R 2
View0.01410.0034.3290.0000.0080.020−0.019
Lower Body0.06840.00513.3740.0000.0580.0780.165
Center Moved0.00180.0030.5610.575−0.0040.0080.000
Table 8. The mean values of the ratio ME/MAE for the different joint angles.
AngleRatio ME/MAE
leftElbow−0.46
rightElbow−0.30
leftShoulder−0.47
rightShoulder−0.31
leftHip0.59
rightHip0.75
leftKnee−0.19
rightKnee0.01
Publisher’s Note: MDPI stays neutral with regard to jurisdictional claims in published maps and institutional affiliations.

