Article

Initiation and Fracture Characteristics of Different Width Cracks of Concretes under Compressional Loading

1
State Key Laboratory of Mountain Bridge and Tunnel Engineering, Chongqing Jiaotong University, Chongqing 400074, China
2
China Southwest Geotechnical Investigation & Design Institute Co., Ltd., Chengdu 610052, China
3
College of Environment and Civil Engineering, Chengdu University of Technology, Chengdu 610059, China
*
Authors to whom correspondence should be addressed.
Appl. Sci. 2022, 12(10), 4803; https://doi.org/10.3390/app12104803
Submission received: 1 April 2022 / Revised: 28 April 2022 / Accepted: 1 May 2022 / Published: 10 May 2022
(This article belongs to the Section Civil Engineering)

Abstract

:
A stress concentration at a crack tip may cause fracture initiation even under low-stress conditions. The maximum axial stress theory meets the challenges of explaining the fracture propagation of a non-closed fracture of cracked concretes under compressional loading. Uniaxial loading tests of single-crack concrete specimens were carried out and a numerical simulation of fracture propagation under uniaxial compression was performed. The radial shear stress criterion for a mode-II fracture is proposed to examine the stress intensity factor (SIF) of the pre-crack specimens under compressional loading. When the maximum radial shear stress at the crack tip is larger than the maximum axial tensile stress, and the maximum dimensionless SIFs can satisfy fmax/fθmax > 1 and fmax/fθmax > KIIC/KIC ( f θ max = K Ie / σ y π a and f r θ max = K II e / σ y π a are maximum dimensionless mode-I and mode-II SIFs, respectively), the crack will extend along the direction of the maximum radial shear stress. The influence of the single-crack angle and width on the mechanical properties of the specimens was examined. The experimental and numerical results indicate that the existence of cracks can considerably weaken the strength of the specimen. The distribution and width of the cracks had a significant effect on the specimen strength. The strength of the concrete specimen initially decreased and then increased with increasing fracture angle. The failure mechanism and rupture angle of pre-crack brittle material while considering crack width will be discovered.

1. Introduction

Brittle materials such as concrete or rock usually contain macroscopic cracks or defects that develop because of complex environmental conditions, which has a significant effect on the properties of brittle materials [1,2]. These defects destroy the material integrity, weaken the mechanical properties of the materials, and modify the stress distribution. Moreover, a stress concentration can be generated at the crack tip, which can influence the failure mode of brittle materials. Therefore, to study the deformation and failure characteristics of brittle materials, many theoretical and numerical studies show that internal cracks in concrete or rock play a significant role in determining the deformation pattern, the strength of the material, and the fracture mode, although crack initiations for pre-existing defects have a long history [3,4,5,6,7,8,9,10,11,12,13,14].
Many brittle materials including rock and concrete show high elastic modulus and strength. Brittle materials are considered to be linearly elastic. When studying cracks in brittle materials, the stress intensity factor (SIF) can be employed to describe the stress state at the crack tip using the fracture mechanics method [15,16,17,18,19]. Three important fracture initiation criteria are commonly employed to analyze the crack propagation mechanism of brittle materials: the maximum tangential stress, the maximum energy release rate, and the minimum energy density criterion [20,21,22,23,24]. The F-criterion, which is a modified version of the energy release rate criterion, may also be employed to study the fracture behavior of quasi-brittle materials [25,26]. These criteria are based on the assumption of a mode-I fracture. However, the fracture extension of compression shear cracks while considering mixed-mode I/II fracture has rarely been investigated [27].
Many experiments were carried out to examine the crack initiation, propagation path, and eventual coalescence of cracks in samples made of various materials, including artificial materials, under compressive loading [3,8,28,29,30,31,32,33,34,35,36,37,38,39,40,41]. In experimental studies, the brittle material is often made into specimens with embedded cracks in the laboratory and uniaxial compression tests are carried out on the rock or concrete samples [10,42,43]. Brazilian disk testing of rock and concrete samples is commonly used to analyze the tensile strength, fracture toughness, and mixed-mode fracture process in uncracked and pre-cracked samples under compressive loading [15,44,45,46,47,48,49,50,51,52,53,54,55].
A number of numerical approaches are used to examine fracture and crack propagation and crack growth in brittle materials; these include the finite element method (FEM), the boundary element method, and the discrete element method [6,24,33,40]. SIF, energy-release rate (G), crack propagation, fracturing time, static tensile, and normal-distributed stresses were computed to describe the fracture initiation and propagation in brittle material samples [16].
The objective of the study presented in this paper was to carry out uniaxial compression tests and numerical analyses of specimens containing a crack and to examine suitable fracture criteria to explain the initiation angle of cracked concretes. The crack growth and the stress and strain characteristics of the concrete specimen for different crack widths and crack angles were analyzed based on the maximum circumferential stress theory and radial shear stress criterion. The relationship between the stress threshold of crack propagation with pre-crack angle and width is discussed, the influence of the crack width on the fracture propagation mode and fracture initiation is examined, and the fracture propagation of the non-closed cracks is discussed. Based on the experimental results, the methods suitable for the concrete fracture propagation incorporating crack width will be discussed.

2. Materials and Methods

2.1. Specimen Preparation

The samples consisted of concrete material composed of cement, gypsum, quartz sand, water, a water-reducing agent, and a waterproofing agent, the details of which are listed in Table 1. The elastic modulus is 1.35 GPa and Poisson’s ratio is 0.21, which is obtained by uniaxial compression tests.
To replicate the crack in the sample, a thin steel sheet was embedded in the concrete material. Cuboid specimens with a central through-crack ( L × W × H = 50 × 50 × 100   mm ) were prepared for the compression-shear tests. In the study of the effect of crack angles on the strength and deformation, the fracture angle difference of the materials is generally set to 15° [40]. We applied various crack angles: 15°, 30°, 45°, 60°, and 75°, and a crack width of 0.5 or 3 mm (Figure 1). The thin steel sheet was first set in the sample mold, and then the concrete material was poured into the mold. The sample was vibrated to compact the material and left to set for 12 h at a temperature of 20 °C. Then, the sheet steel was removed from the mold. The smoothness of the samples and cracks were checked. Finally, to provide proper curing humidity, the samples were cured in water for 28 days at room temperature.

2.2. Compression Shear Fracture Test of Concrete Samples

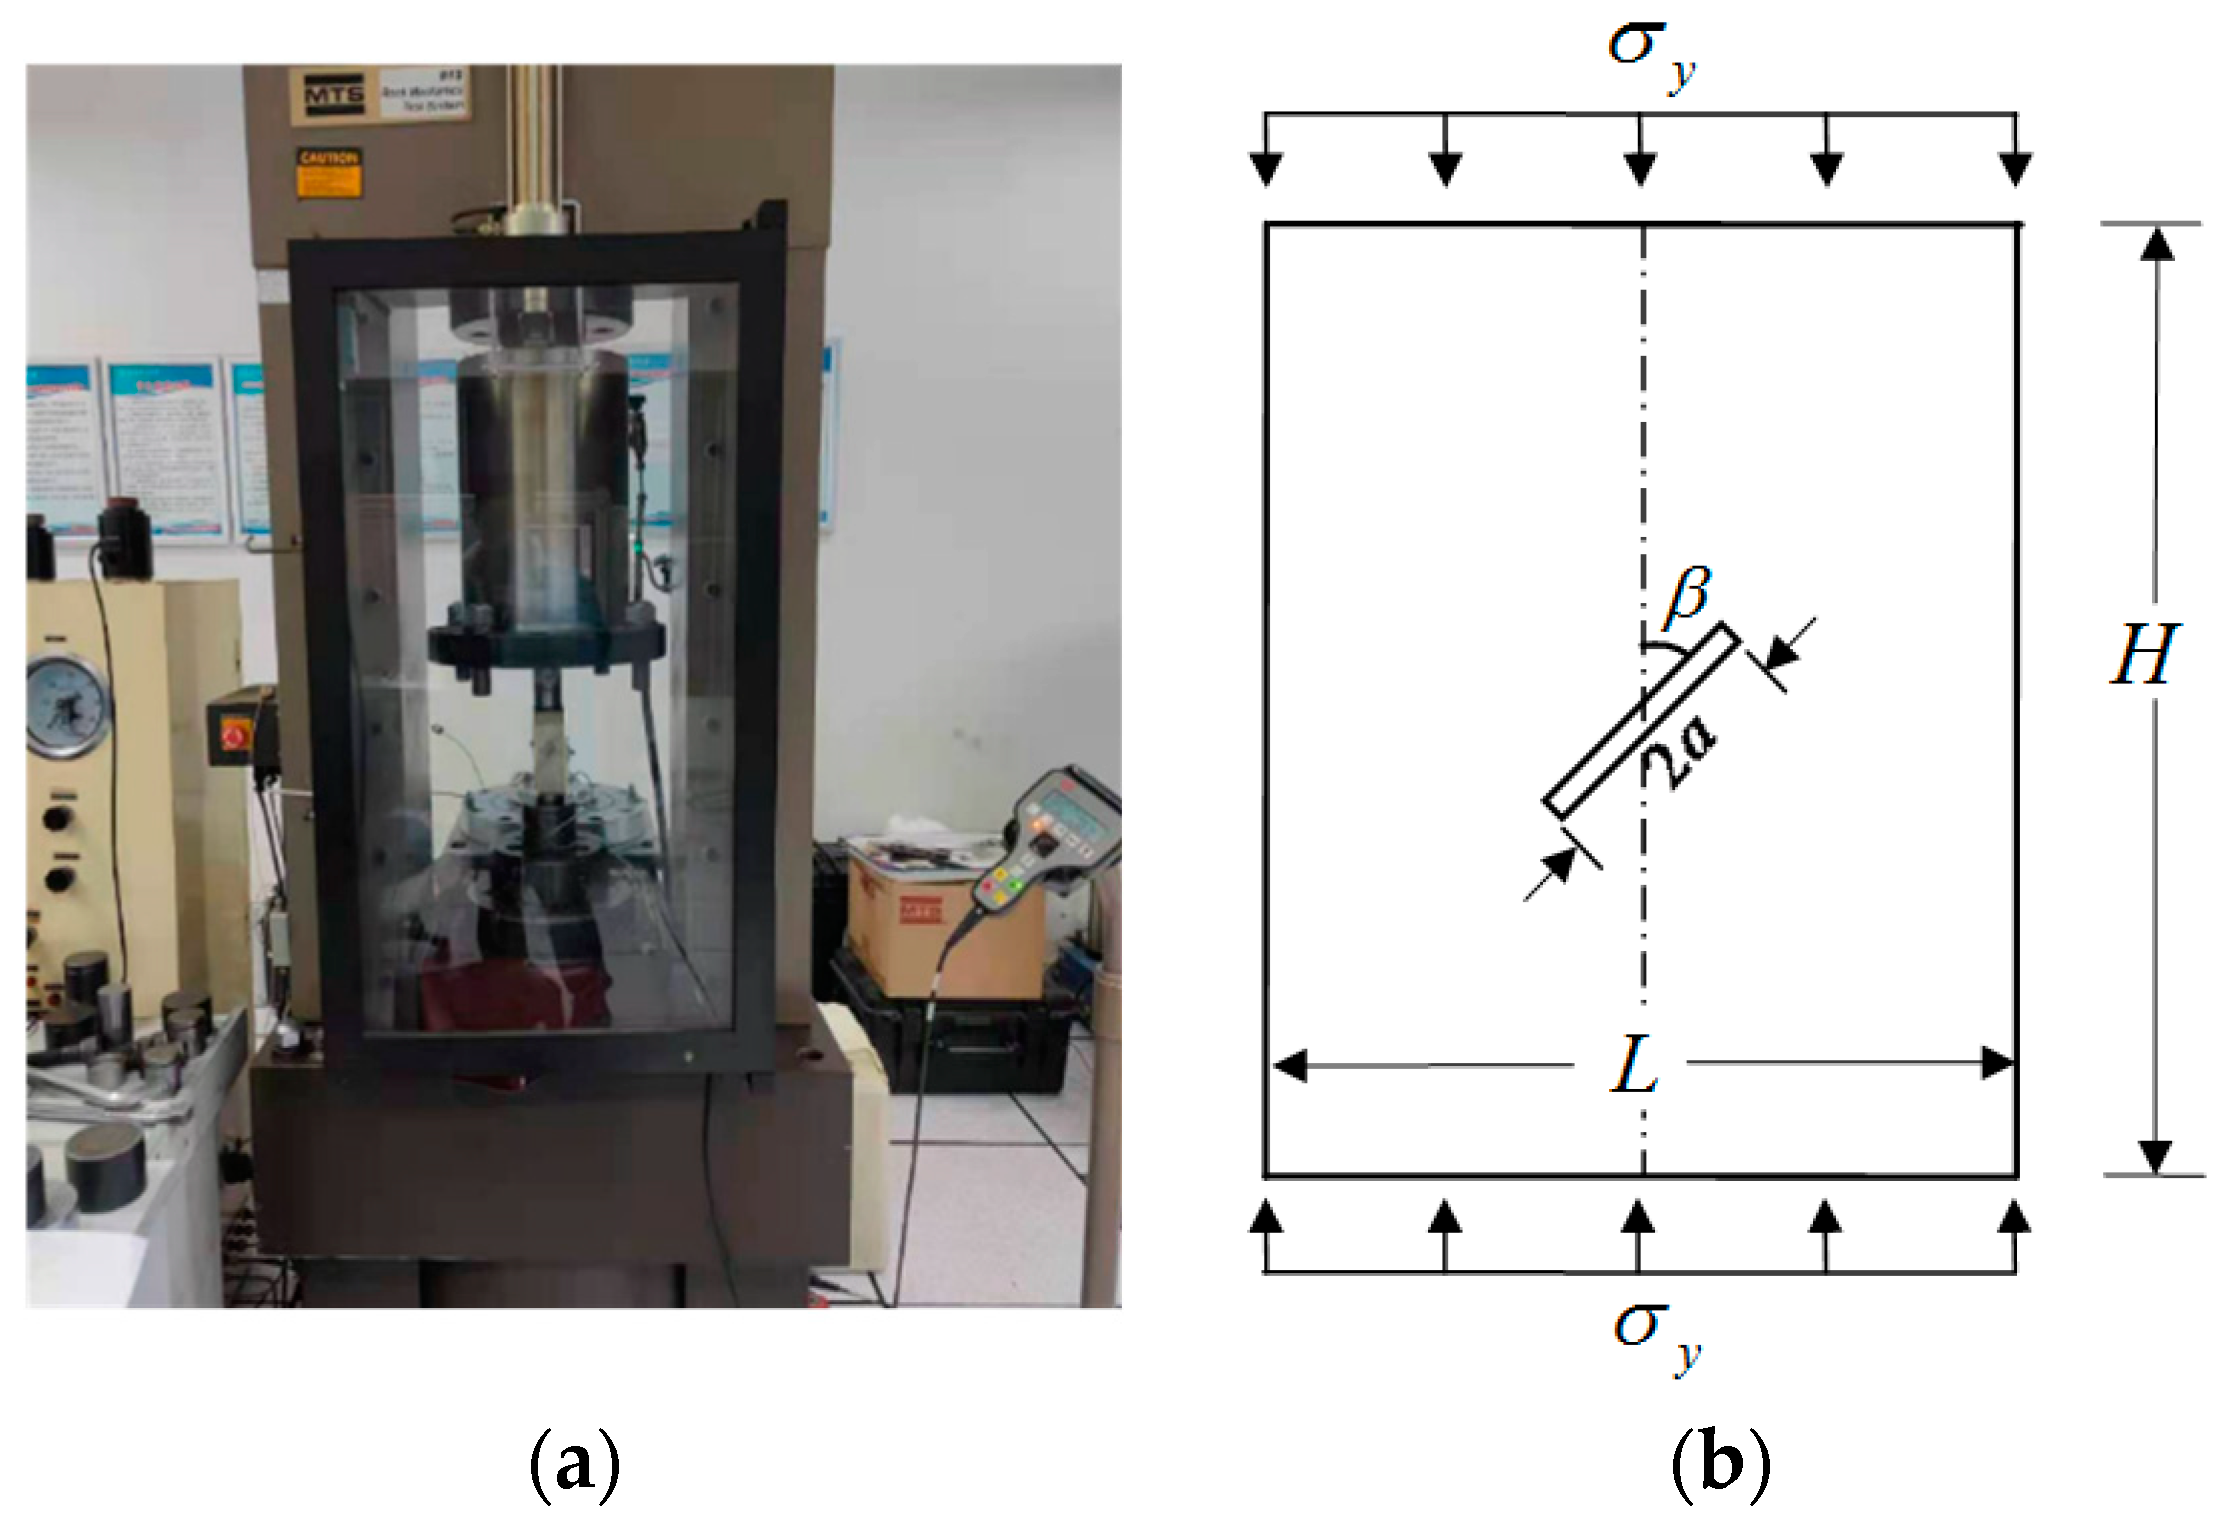
Each brittle concrete specimen was placed in the loading apparatus and loaded under uniaxial compression (Figure 2). The tests were carried out on the MTS 815 testing machine, which showed stable and reliable performance. The crack widths and angles of the specimens are listed in Table 2.
The width of the cracks for specimens 1–5 was 0.5 mm and 3 mm for specimens 6–10. A small steel sheet, 0.5 and 3 mm thick, was inserted into each sample to fill the crack (Figure 1b,c). The loading was controlled by changing the displacement, with a loading rate of 0.5 mm/min. The crack propagation of the specimen was captured by a high-resolution camera during the tests.

2.3. Analysis of the Experimental Results

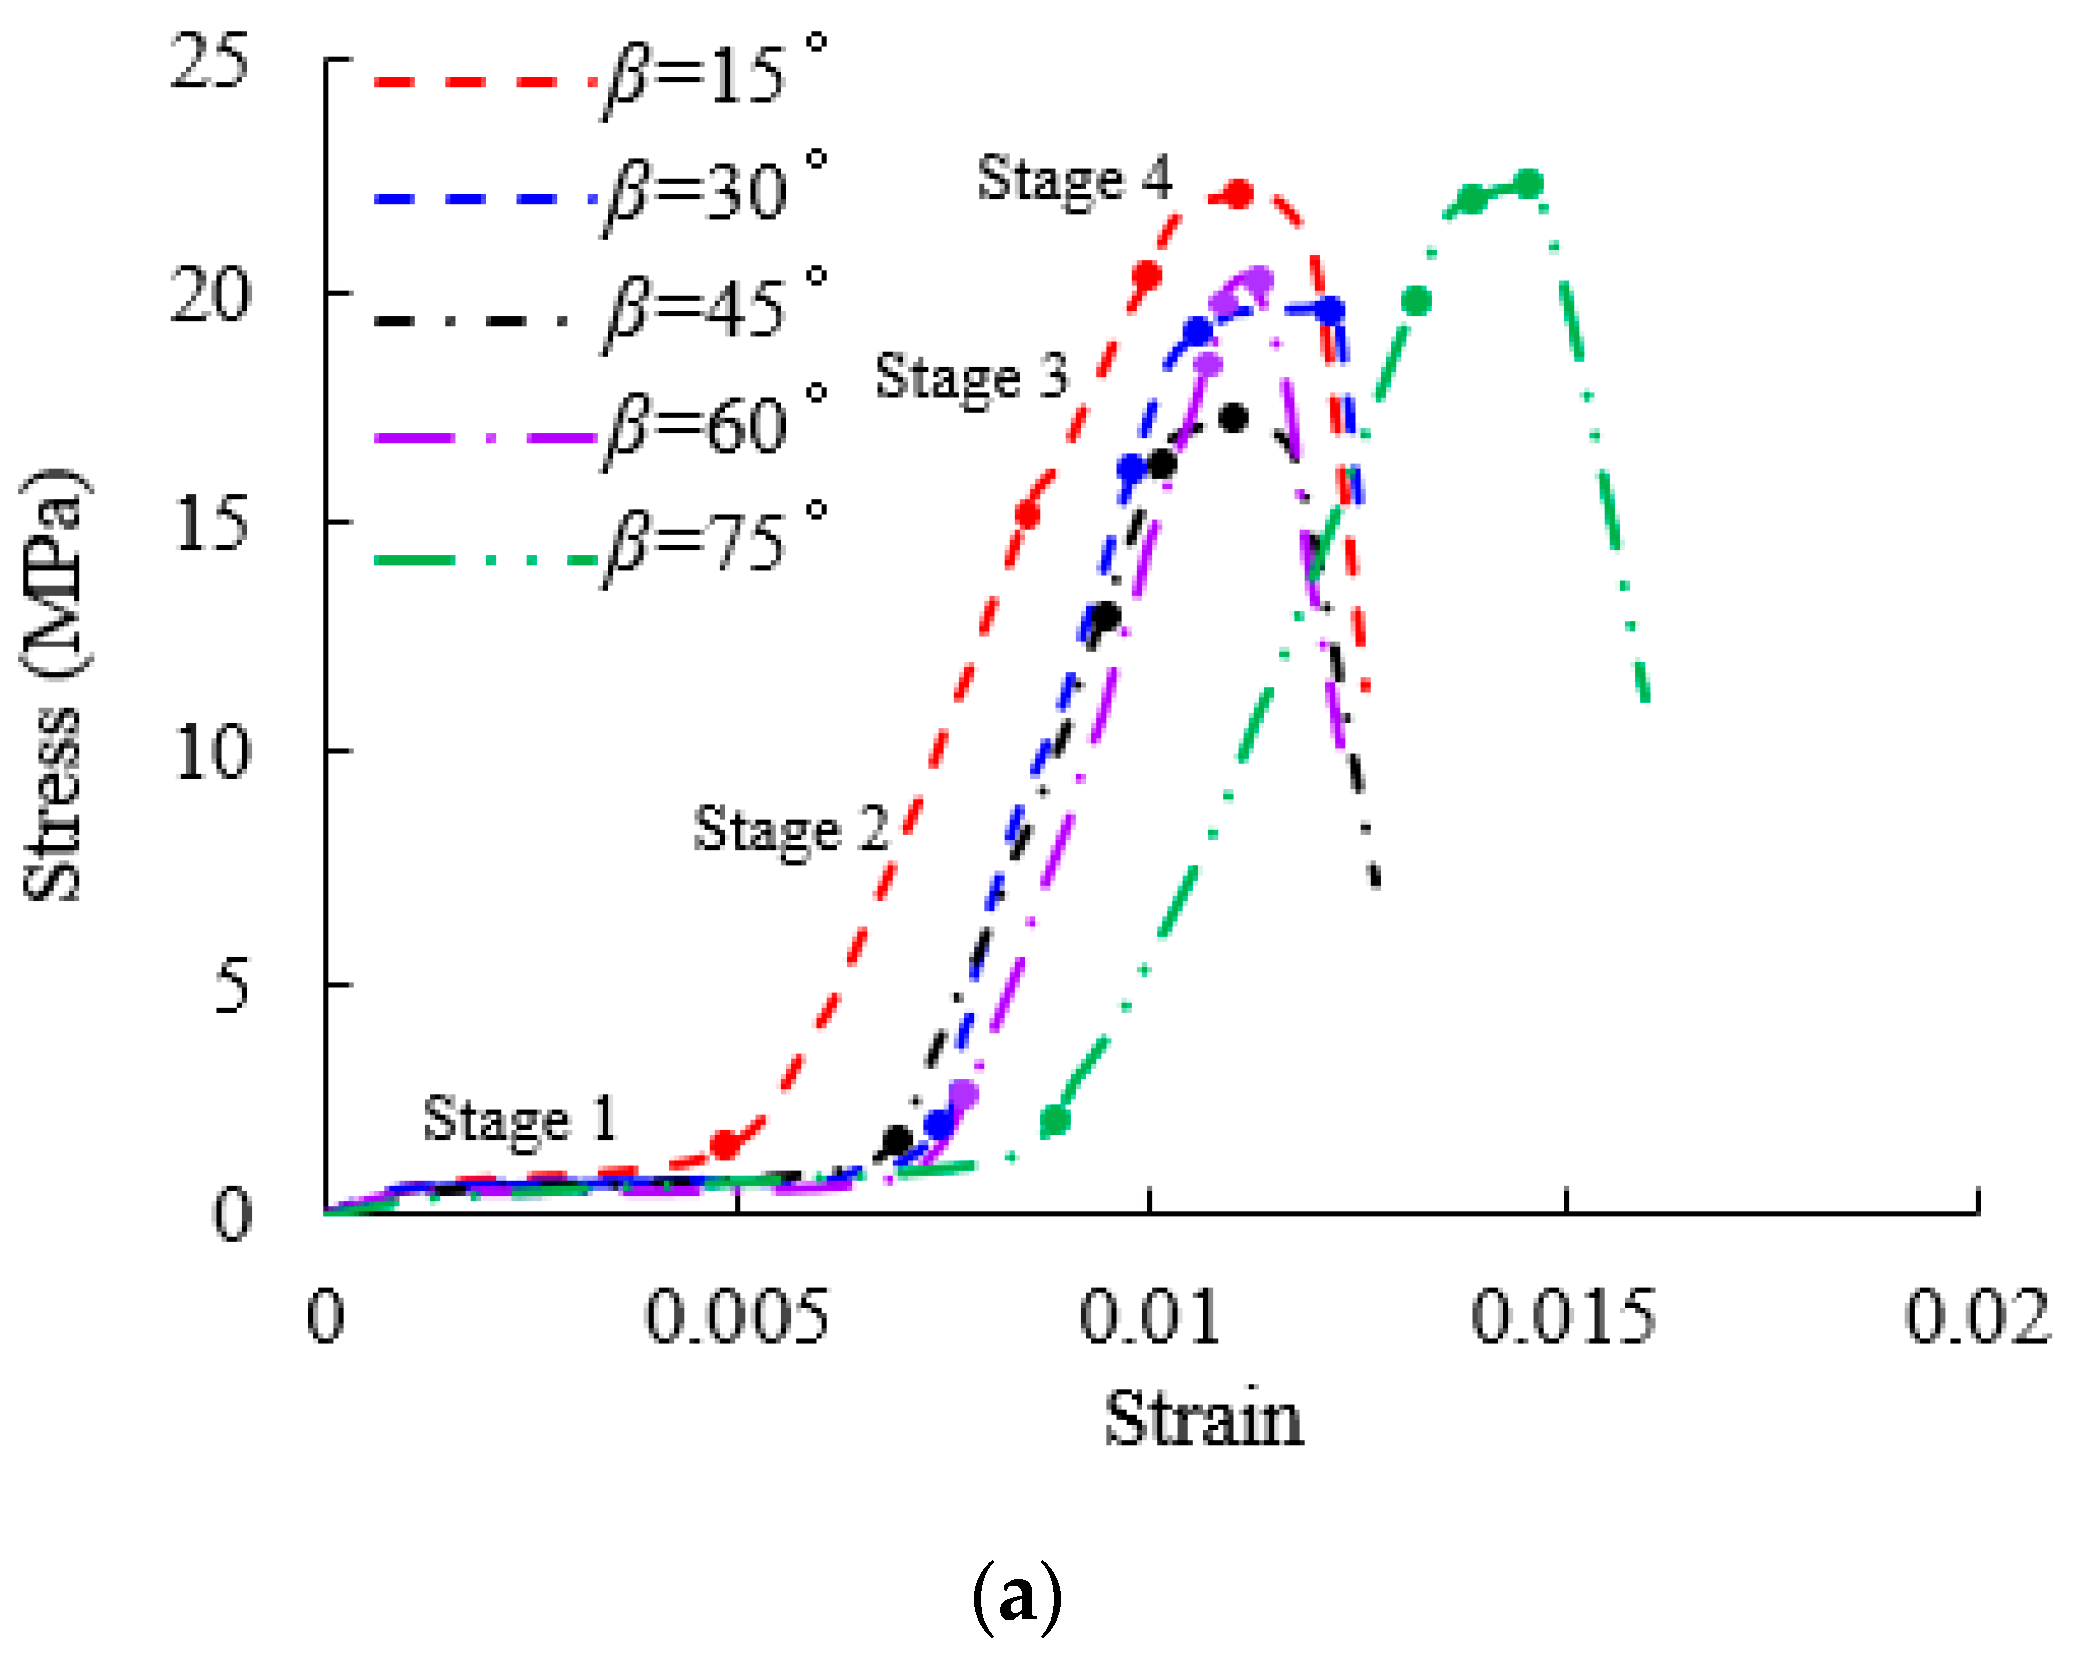
Figure 3 shows the stress–strain curves of the specimens under uniaxial loading. The uniaxial compression process of the single-crack concrete specimen can be divided into four stages: (1) The nonlinear compaction stage where mostly internal micro-cracks are present in the specimen. The strain is small, and the stress remains unchanged, resulting in a relatively smooth curve. (2) The linear elastic deformation stage, with no obvious crack development. (3) The stable crack expansion stage. The slope of the curve gradually decreases as wing cracks form and develop rapidly with increasing loading. When the slope of the curve is close to zero, secondary cracks often occur in the periphery of the wing cracks. (4) The unstable crack expansion stage. At this stage, the stress reaches its limit and the material loses its stability; the wing cracks expand rapidly, reaching the specimen surface, then the curve falls suddenly, indicating quasi-brittle failure.
It can be seen in Table 3 and Figure 3 that the stress–strain curves and the peak strength under uniaxial compression vary with the pre-load crack angle β. The presence of cracks weakens the peak strength of the samples from 10.19% (case 1) to 41.09% (case 7). The fracture angle and width play a significant role in the mechanical properties of the concrete samples. As the crack angle increases, the strength of the specimen first decreases and then increases. Under the same single fracture angle, the strength of the fracture specimens including 0.5 mm wide crack is higher than that of the specimens with 3.0 mm wide crack.
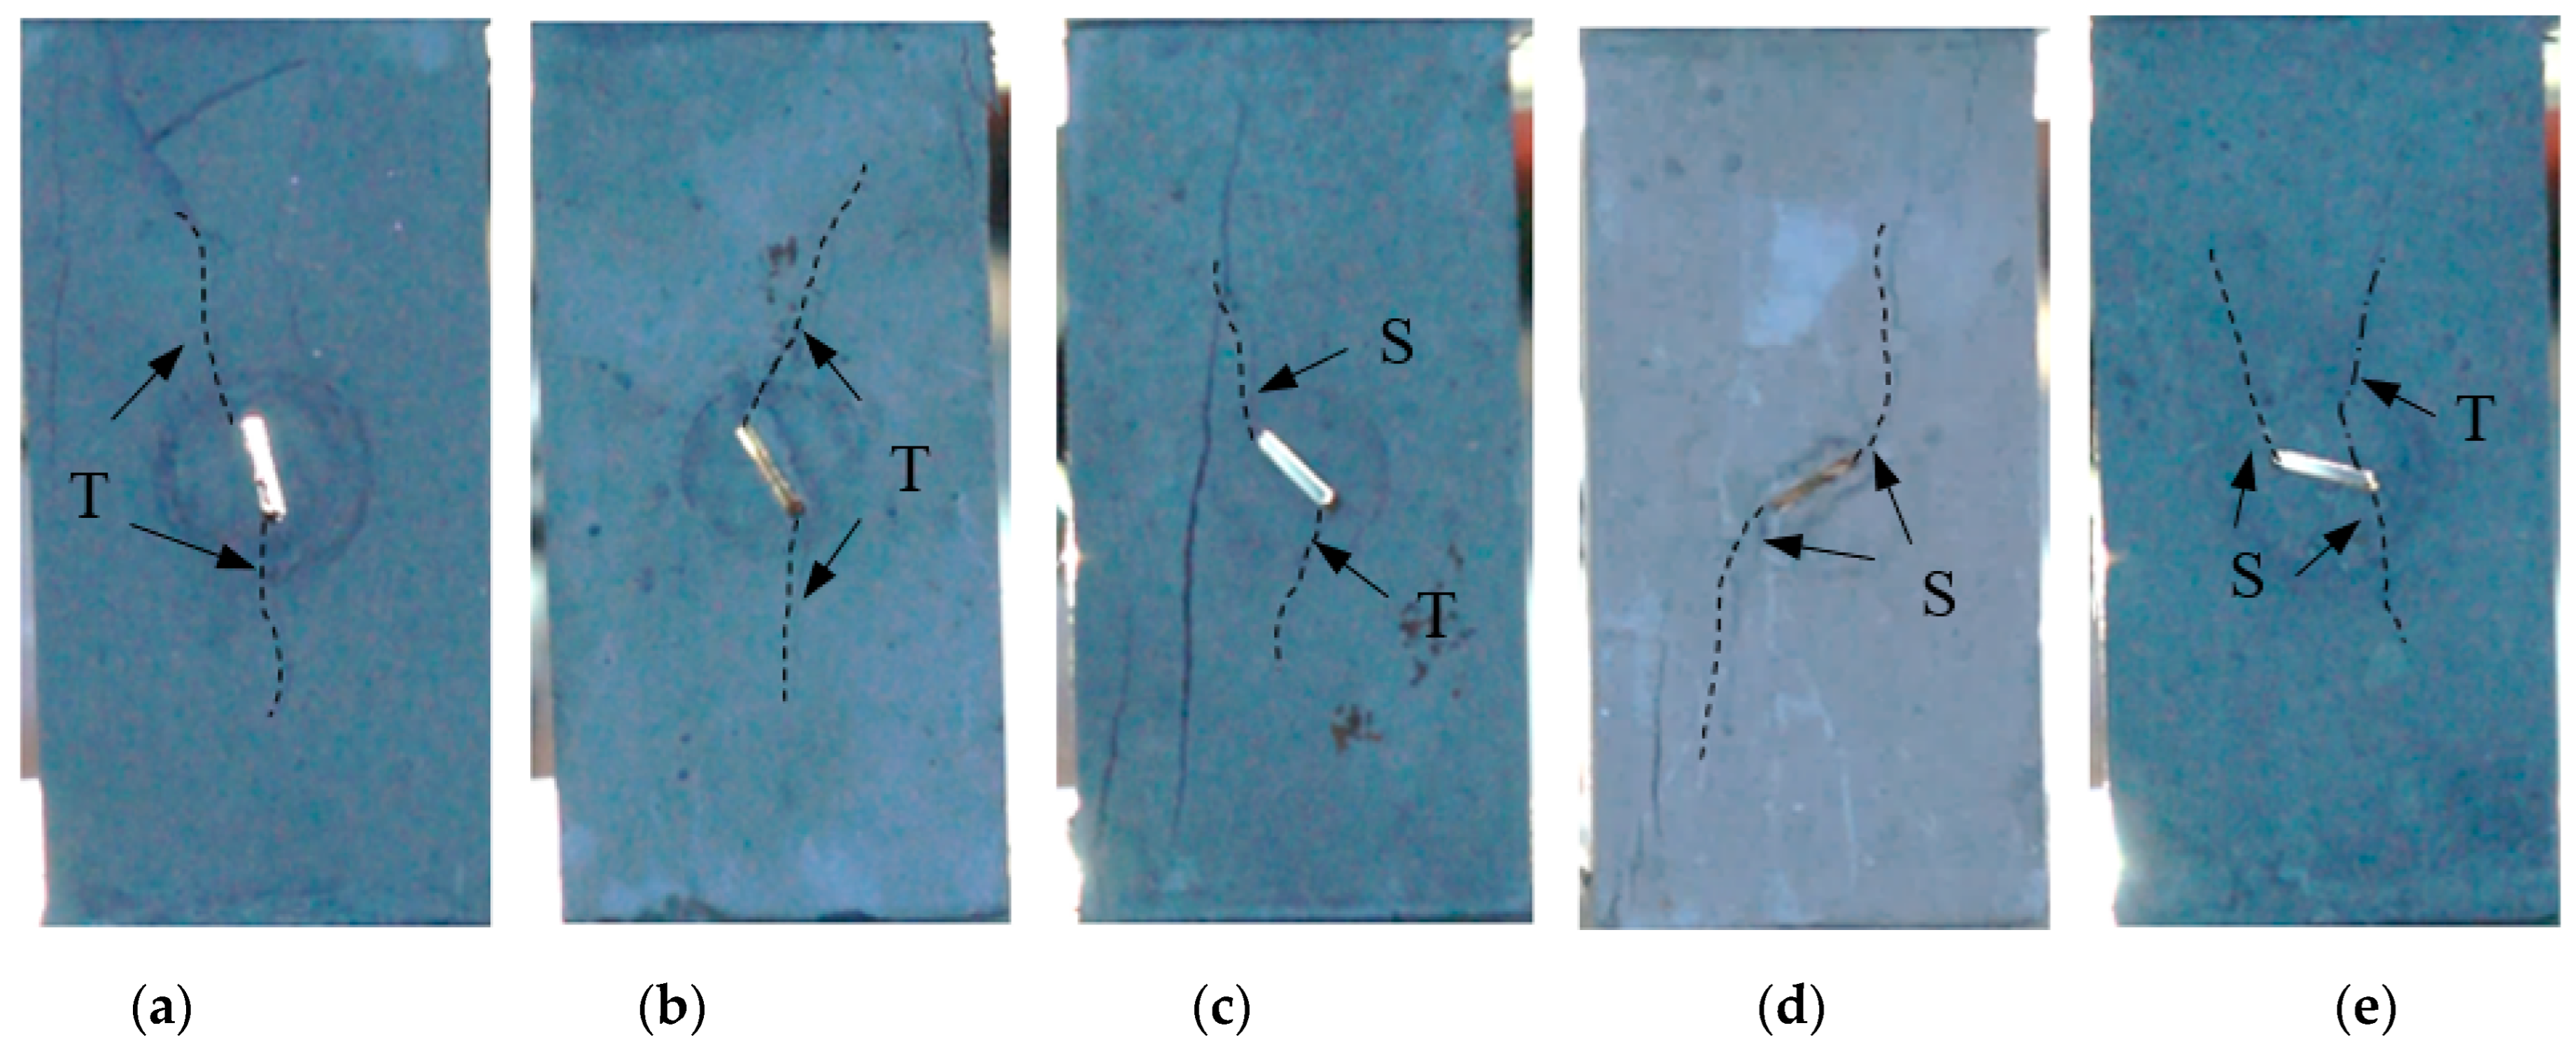
Figure 4 depicts the failure modes of the crack tip for the specimens with different pre-load crack angles. The fracture angle of the single non-closed crack for the specimens decreases and then increases gradually under normal conditions, for example, the rupture angle is smaller when β = 15° and 45°.

3. Fracture Criterion of Brittle Material

3.1. The Maximum Circumferential Stress Theory

There are stress components of mixed-mode I-II at the crack tip in the polar coordinates. According to the linear elastic theory, the stress components can be expressed as [56]:
σ r = 1 2 2 π r [ K cos θ 2 ( 3 cos θ ) + K sin θ 2 ( 3 cos θ 1 ) ] ,  
σ θ = 1 2 2 π r cos θ 2 [ K ( 1 + cos θ ) 3 K sin θ ] ,  
τ r θ = 1 2 2 π r cos θ 2 [ K sin θ + K ( 3 cos θ 1 ) ] ,  
where σrr, σθθ, and τ are the radial stress, circumferential tensile stress, and shear stress at the crack tip, respectively; r is the distance from the crack tip; θ is the angle that the surface deviates from the original crack tip direction (counterclockwise is positive). The expressions K I = σ π a and K II = τ π a are the mixed-mode I and mode II stress intensity factors of an infinite plate with a central crack; where a is half the length of crack; and σ, τ are the far-field tensile stress and the far-field shear stress, respectively.
The crack propagation direction at the crack tip is very close to that of the maximum circumferential stress [20]. According to the maximum circumferential stress theory, a mixed-mode I-II fracture can transform into an equivalent pure mode-I fracture, where the equivalent mode-I stress intensity factor (KIe) and initiation angle (θI0) are expressed as:
K e = 1 2 cos θ 0 2 [ K ( 1 + cos θ 0 ) 3 K sin θ 0 ] ,
θ 0 = 2 arctan 1 1 + 8 ( K / K ) 2 4 ( K / K )
when KIe reaches the mode-I fracture toughness (KIC), the crack begins to expand. For a closed crack, the mode I stress intensity factor is KI = 0. Thus, the initial propagation direction is θI0 = 70.5°, where KIe reaches its maximum value regardless of the crack angle.

3.2. The Radial Shear Stress Criterion

The absolute value of the maximum shear stress at the crack tip should satisfy the following equation [55]:
τ r θ θ = 0 ,   2 τ r θ θ 2 < 0   or   2 τ r θ θ 2 > 0 , | τ r θ ( θ = θ 0 ) | max ,
θII0 is given by:
θ 0 = 2 arctan 2 + A ( cos ( α 0 / 3 ) 3 sin ( α 0 / 3 ) ) 3 k 0 ,  
where A = 4 + 42(KII/KI)2, B = −4(KII/KI), k0 = 2(KII/KI), α0 = arccos(T), T = (−4A−3k0B)/(2 A 3 ), and (α0 (0, π), −1 < T < 1). These are the coefficients related to KII and KI.
When the crack expansion follows the mode-II fracture pattern, the fracturing depends on the mode-II fracture toughness (KIIC). Thus, we can transform this crack into an equivalent pure mode-II crack and the equivalent stress intensity factor can be expressed as:
K e = 1 2 cos θ 0 2 [ K sin θ 0 + K ( 3 cos θ 0 1 ) ] .

4. Numerical Analysis and Failure Mechanism of a Single-Crack Specimen

4.1. Numerical Model and Parameter Analysis

The stress field and stress intensity factor of a simulated single-crack concrete specimen were analyzed using the finite element program ABAQUS. The extended FEM was used to simulate the fracture propagation of a single-crack concrete sample.
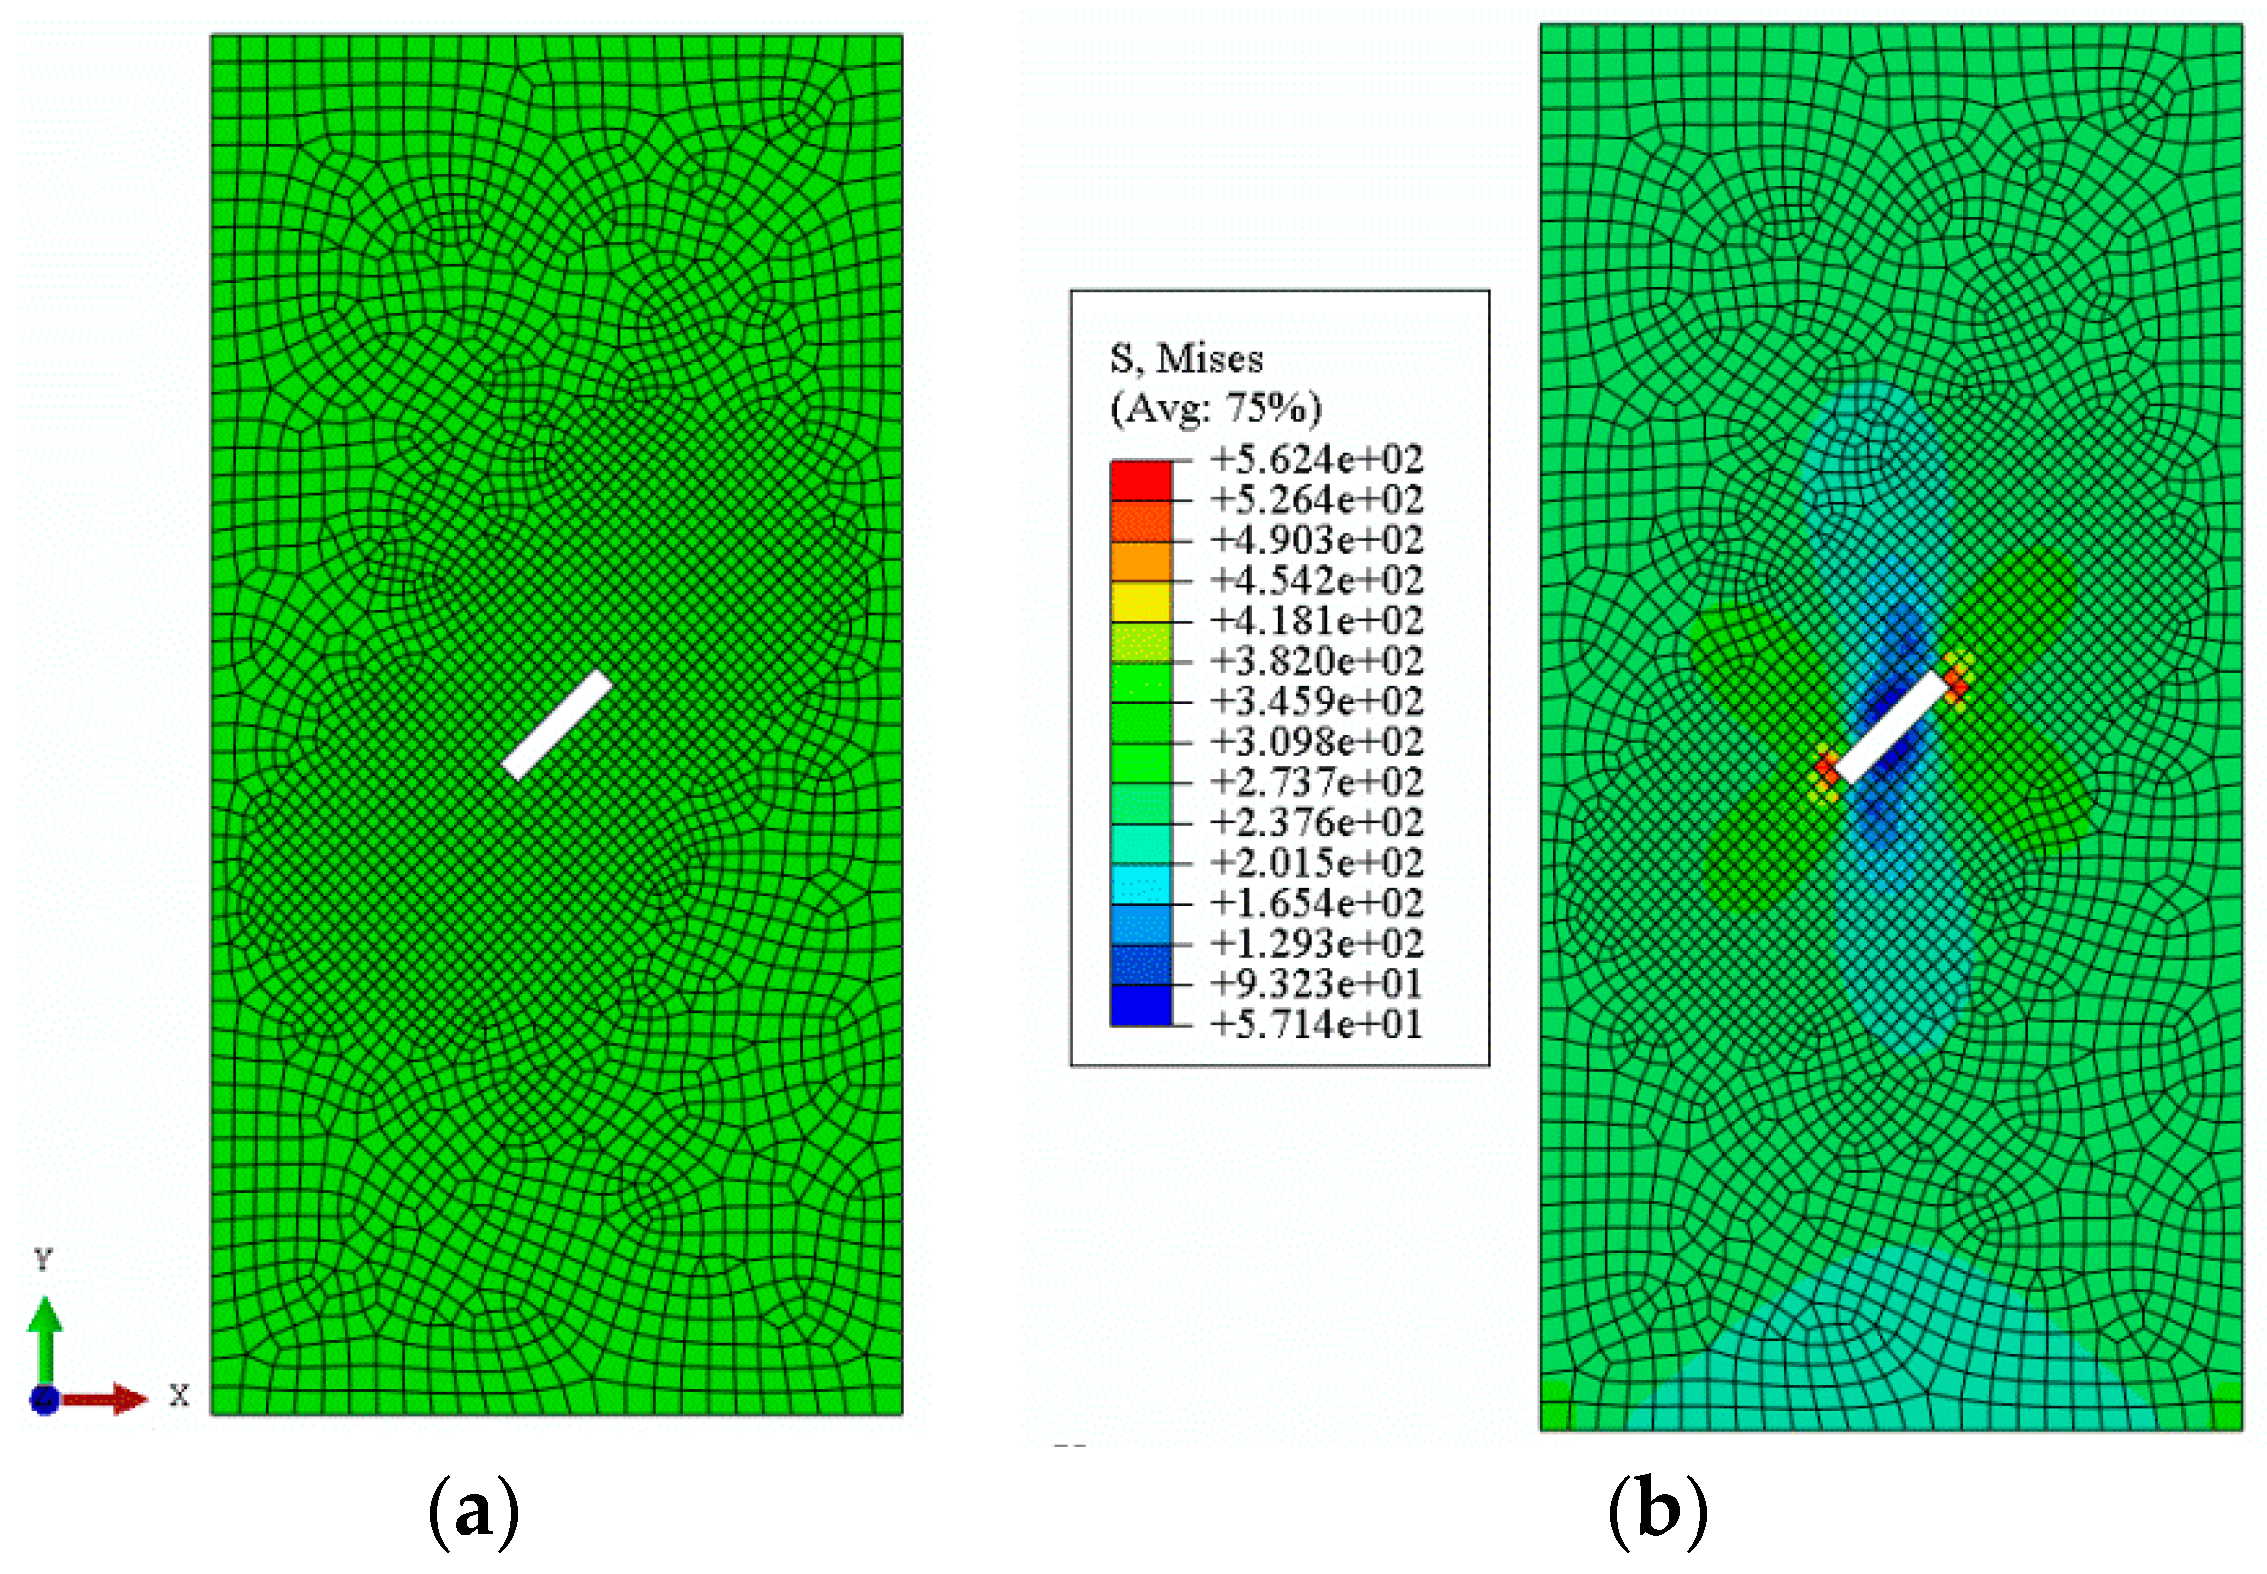
The two-dimensional computational model of the concrete sample (Figure 5) consists of 3040 grid elements. The mechanical parameters of the simulated material are listed in Table 4.
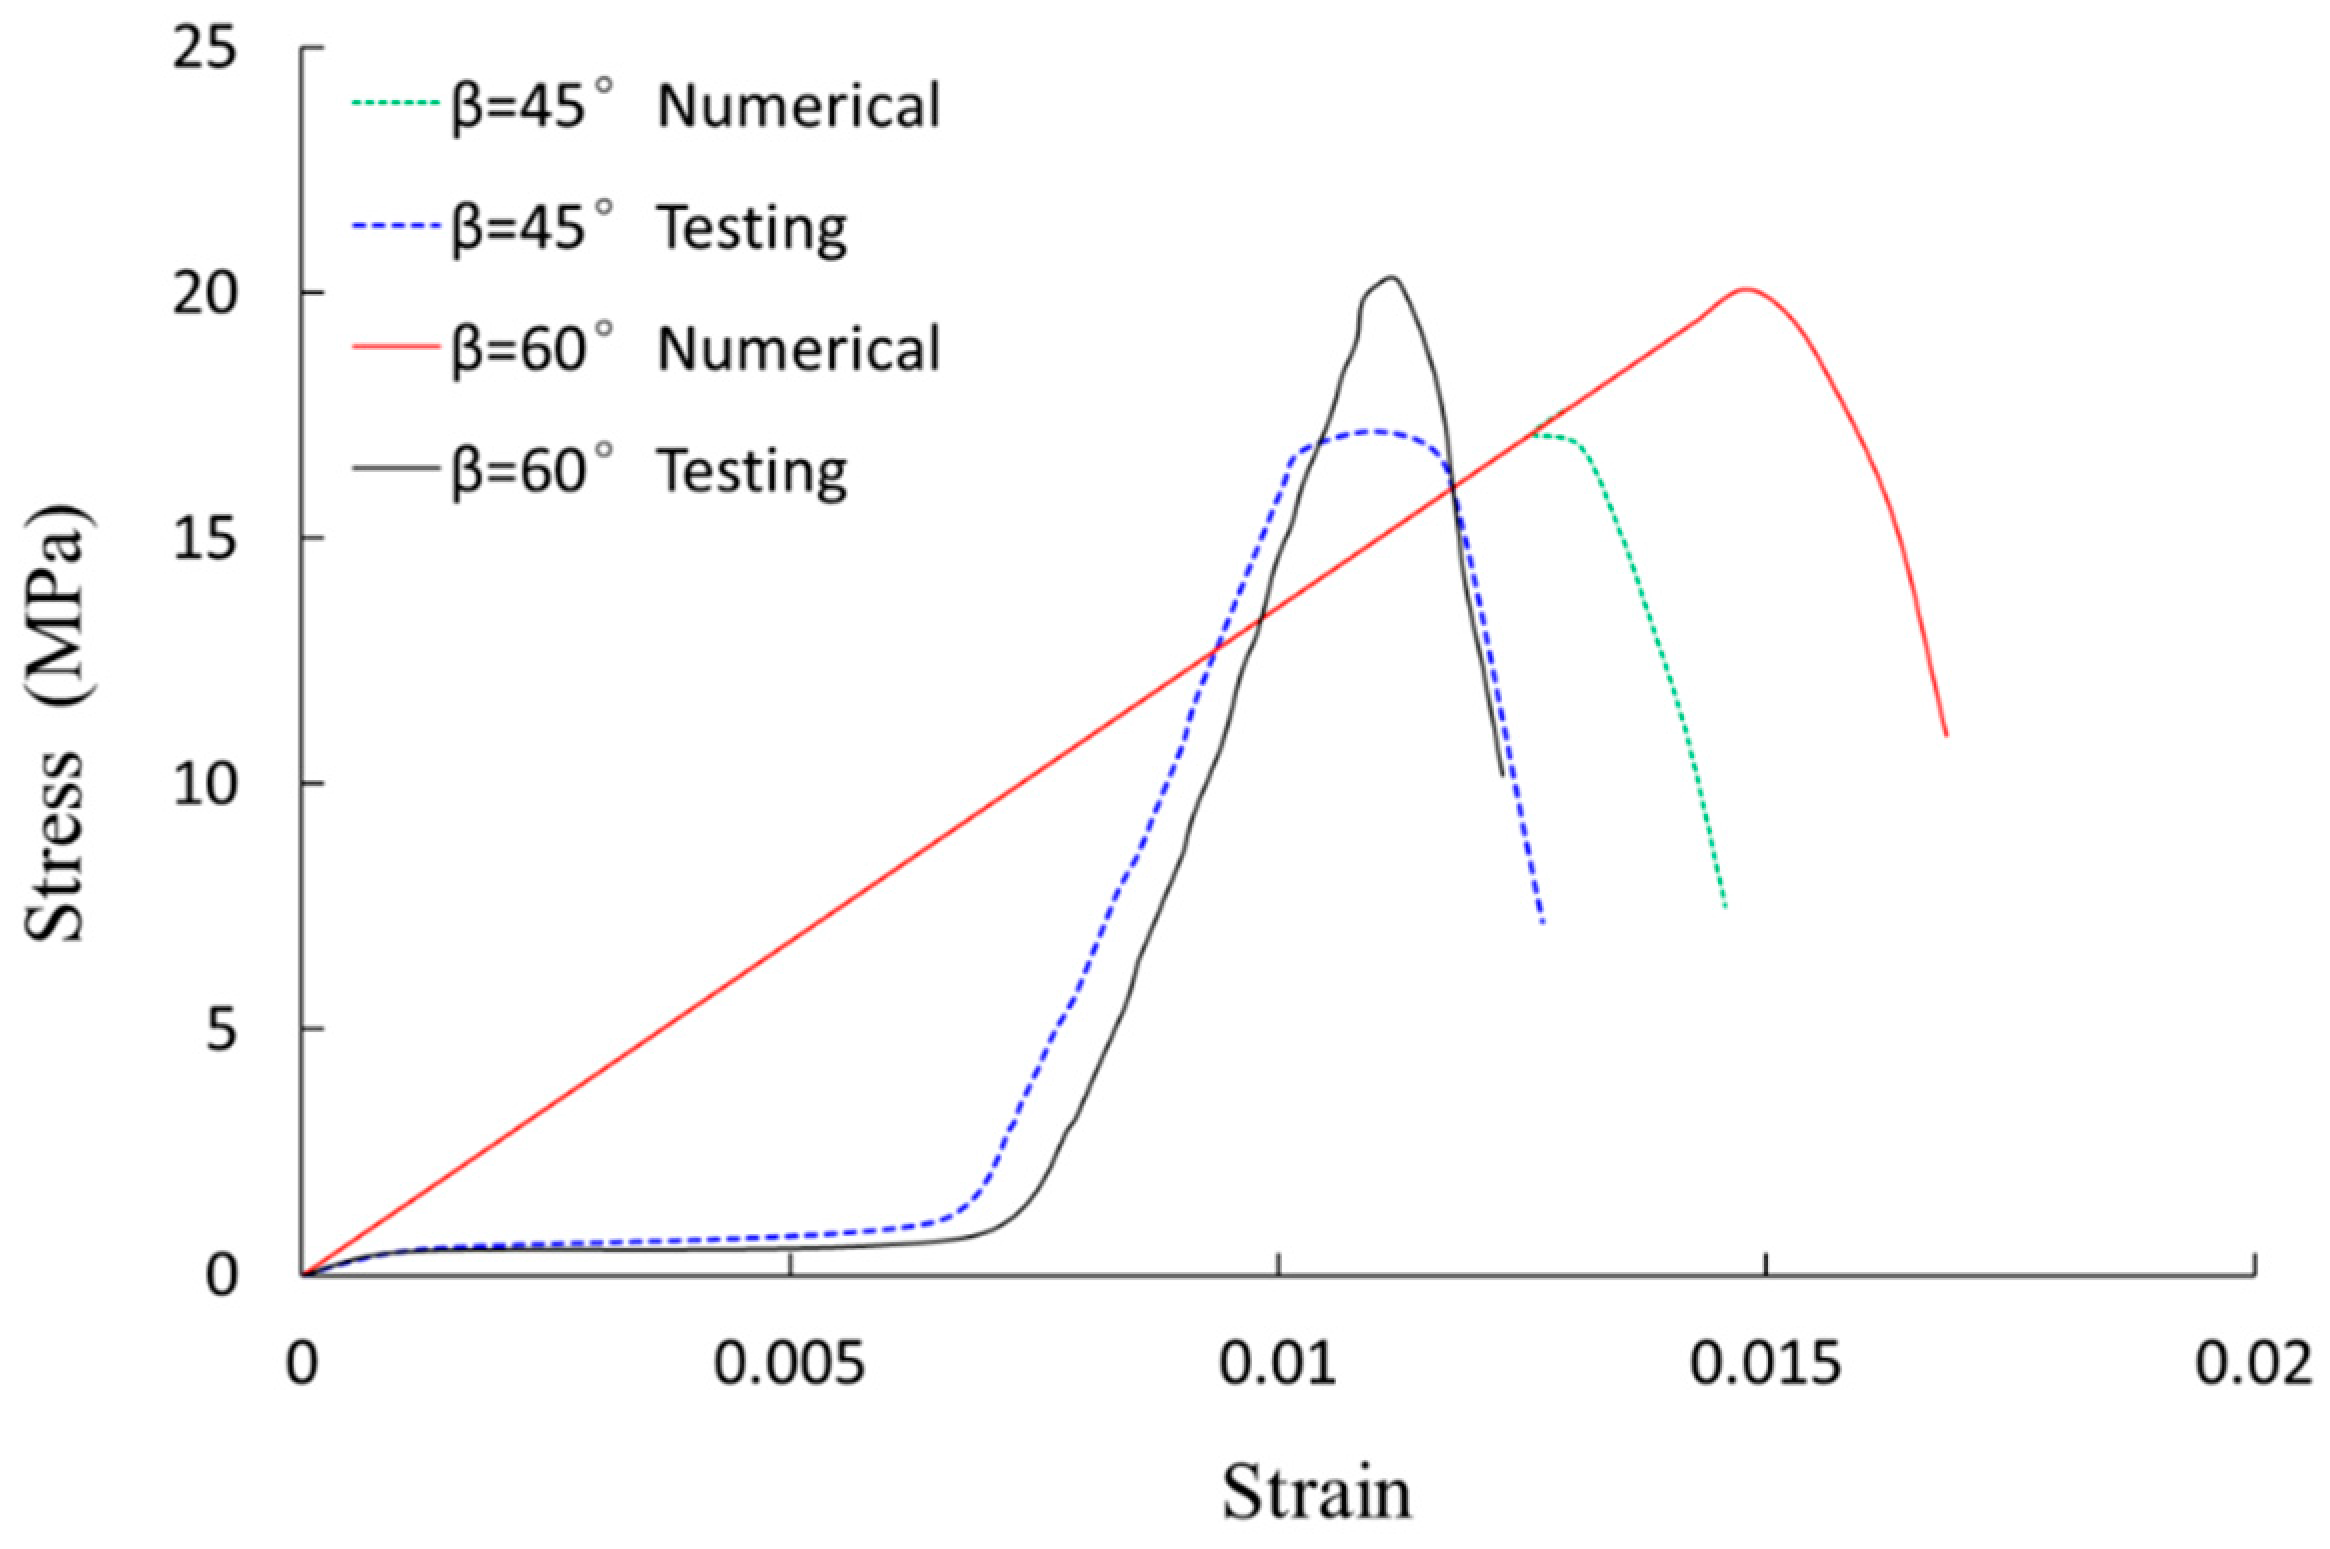
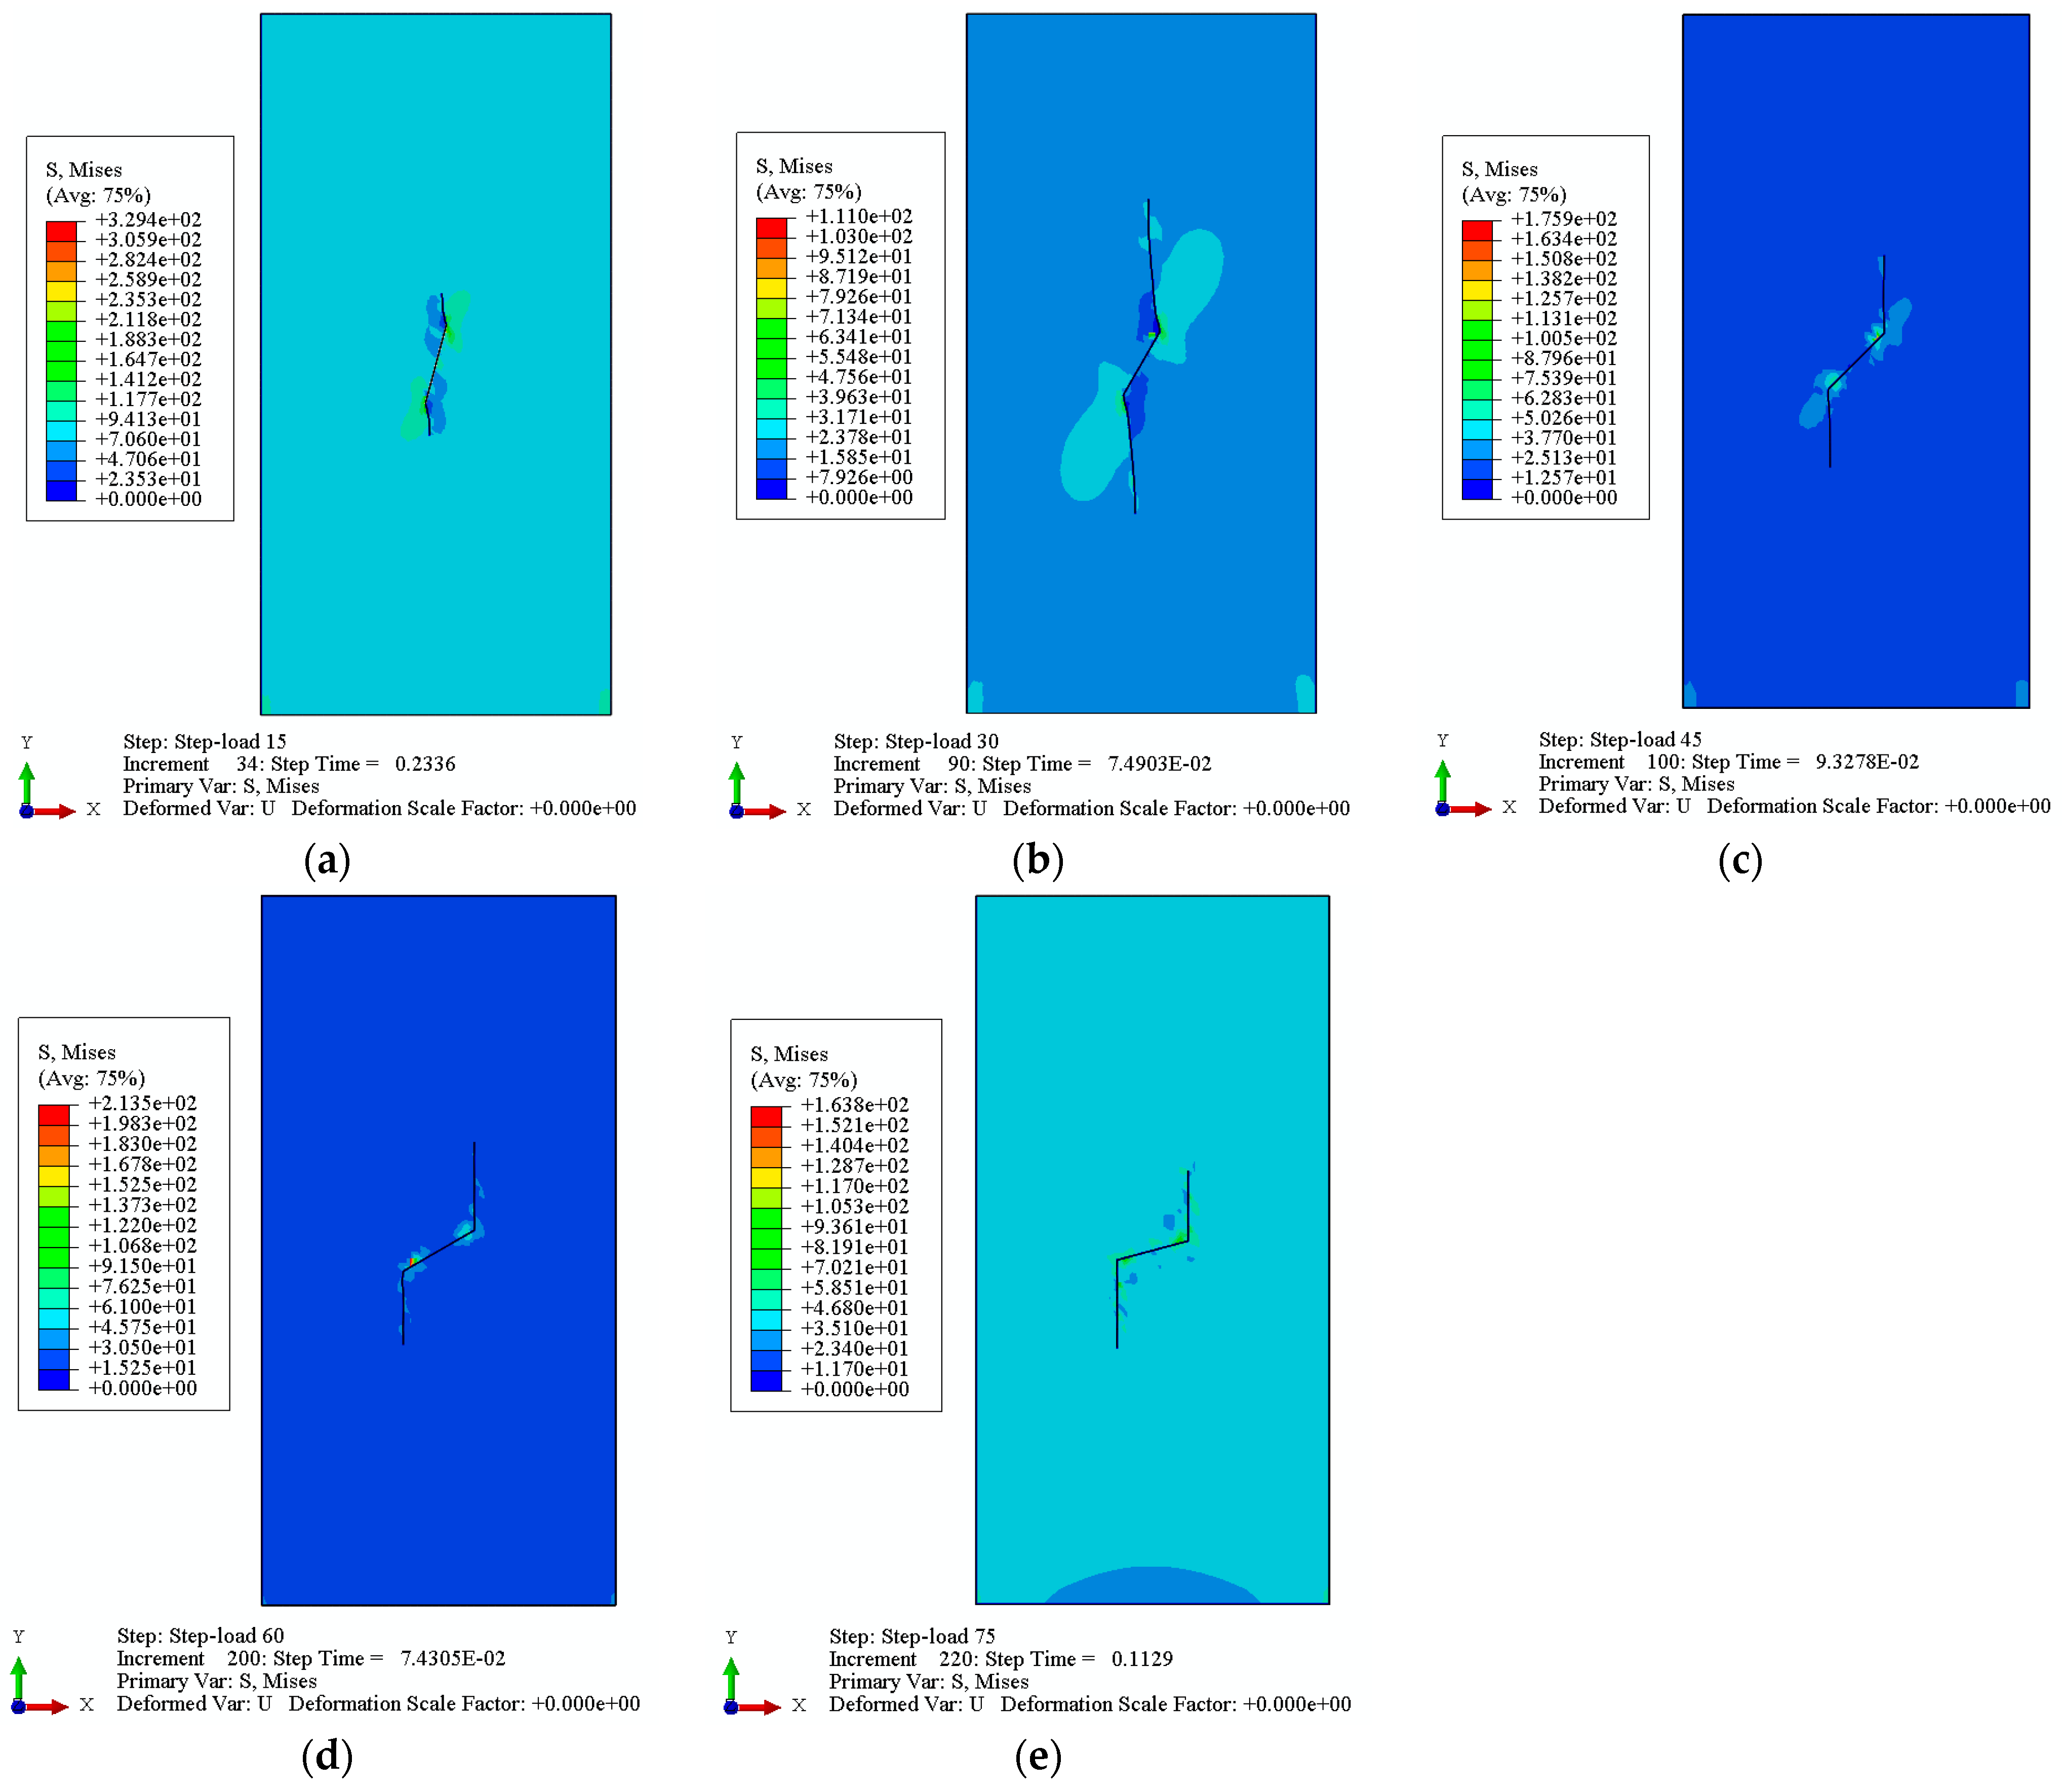
Figure 5 shows the stress nephogram of specimen No. 9 under normal conditions. Table 5 lists the changes in the maximum circumferential tensile stress and radial shear stress at the crack tip for the specimens. The initiation angles obtained in the experimental tests and numerical simulations are shown in Table 6. Figure 6 compares the stress–strain relationships between the numerical and experimental results. The numerical solution shows a linear relationship before the peak strength. However, the stress–strain from the experiments is nonlinear and experiences compaction at the early loading stage. The numerical method can simplify complex stress–strain relations of cracked concretes. Figure 7 shows the computational results of the fracture propagation of the single-crack concrete sample. The SIF at the crack tip changes the pre-crack angle. The SIF at the crack tip becomes high and then low with the pre-crack angle. The SIF arrives at the maximum value when the pre-crack angle is 45°.

4.2. Failure Mechanism of a Closed Pre-Crack Concrete Sample

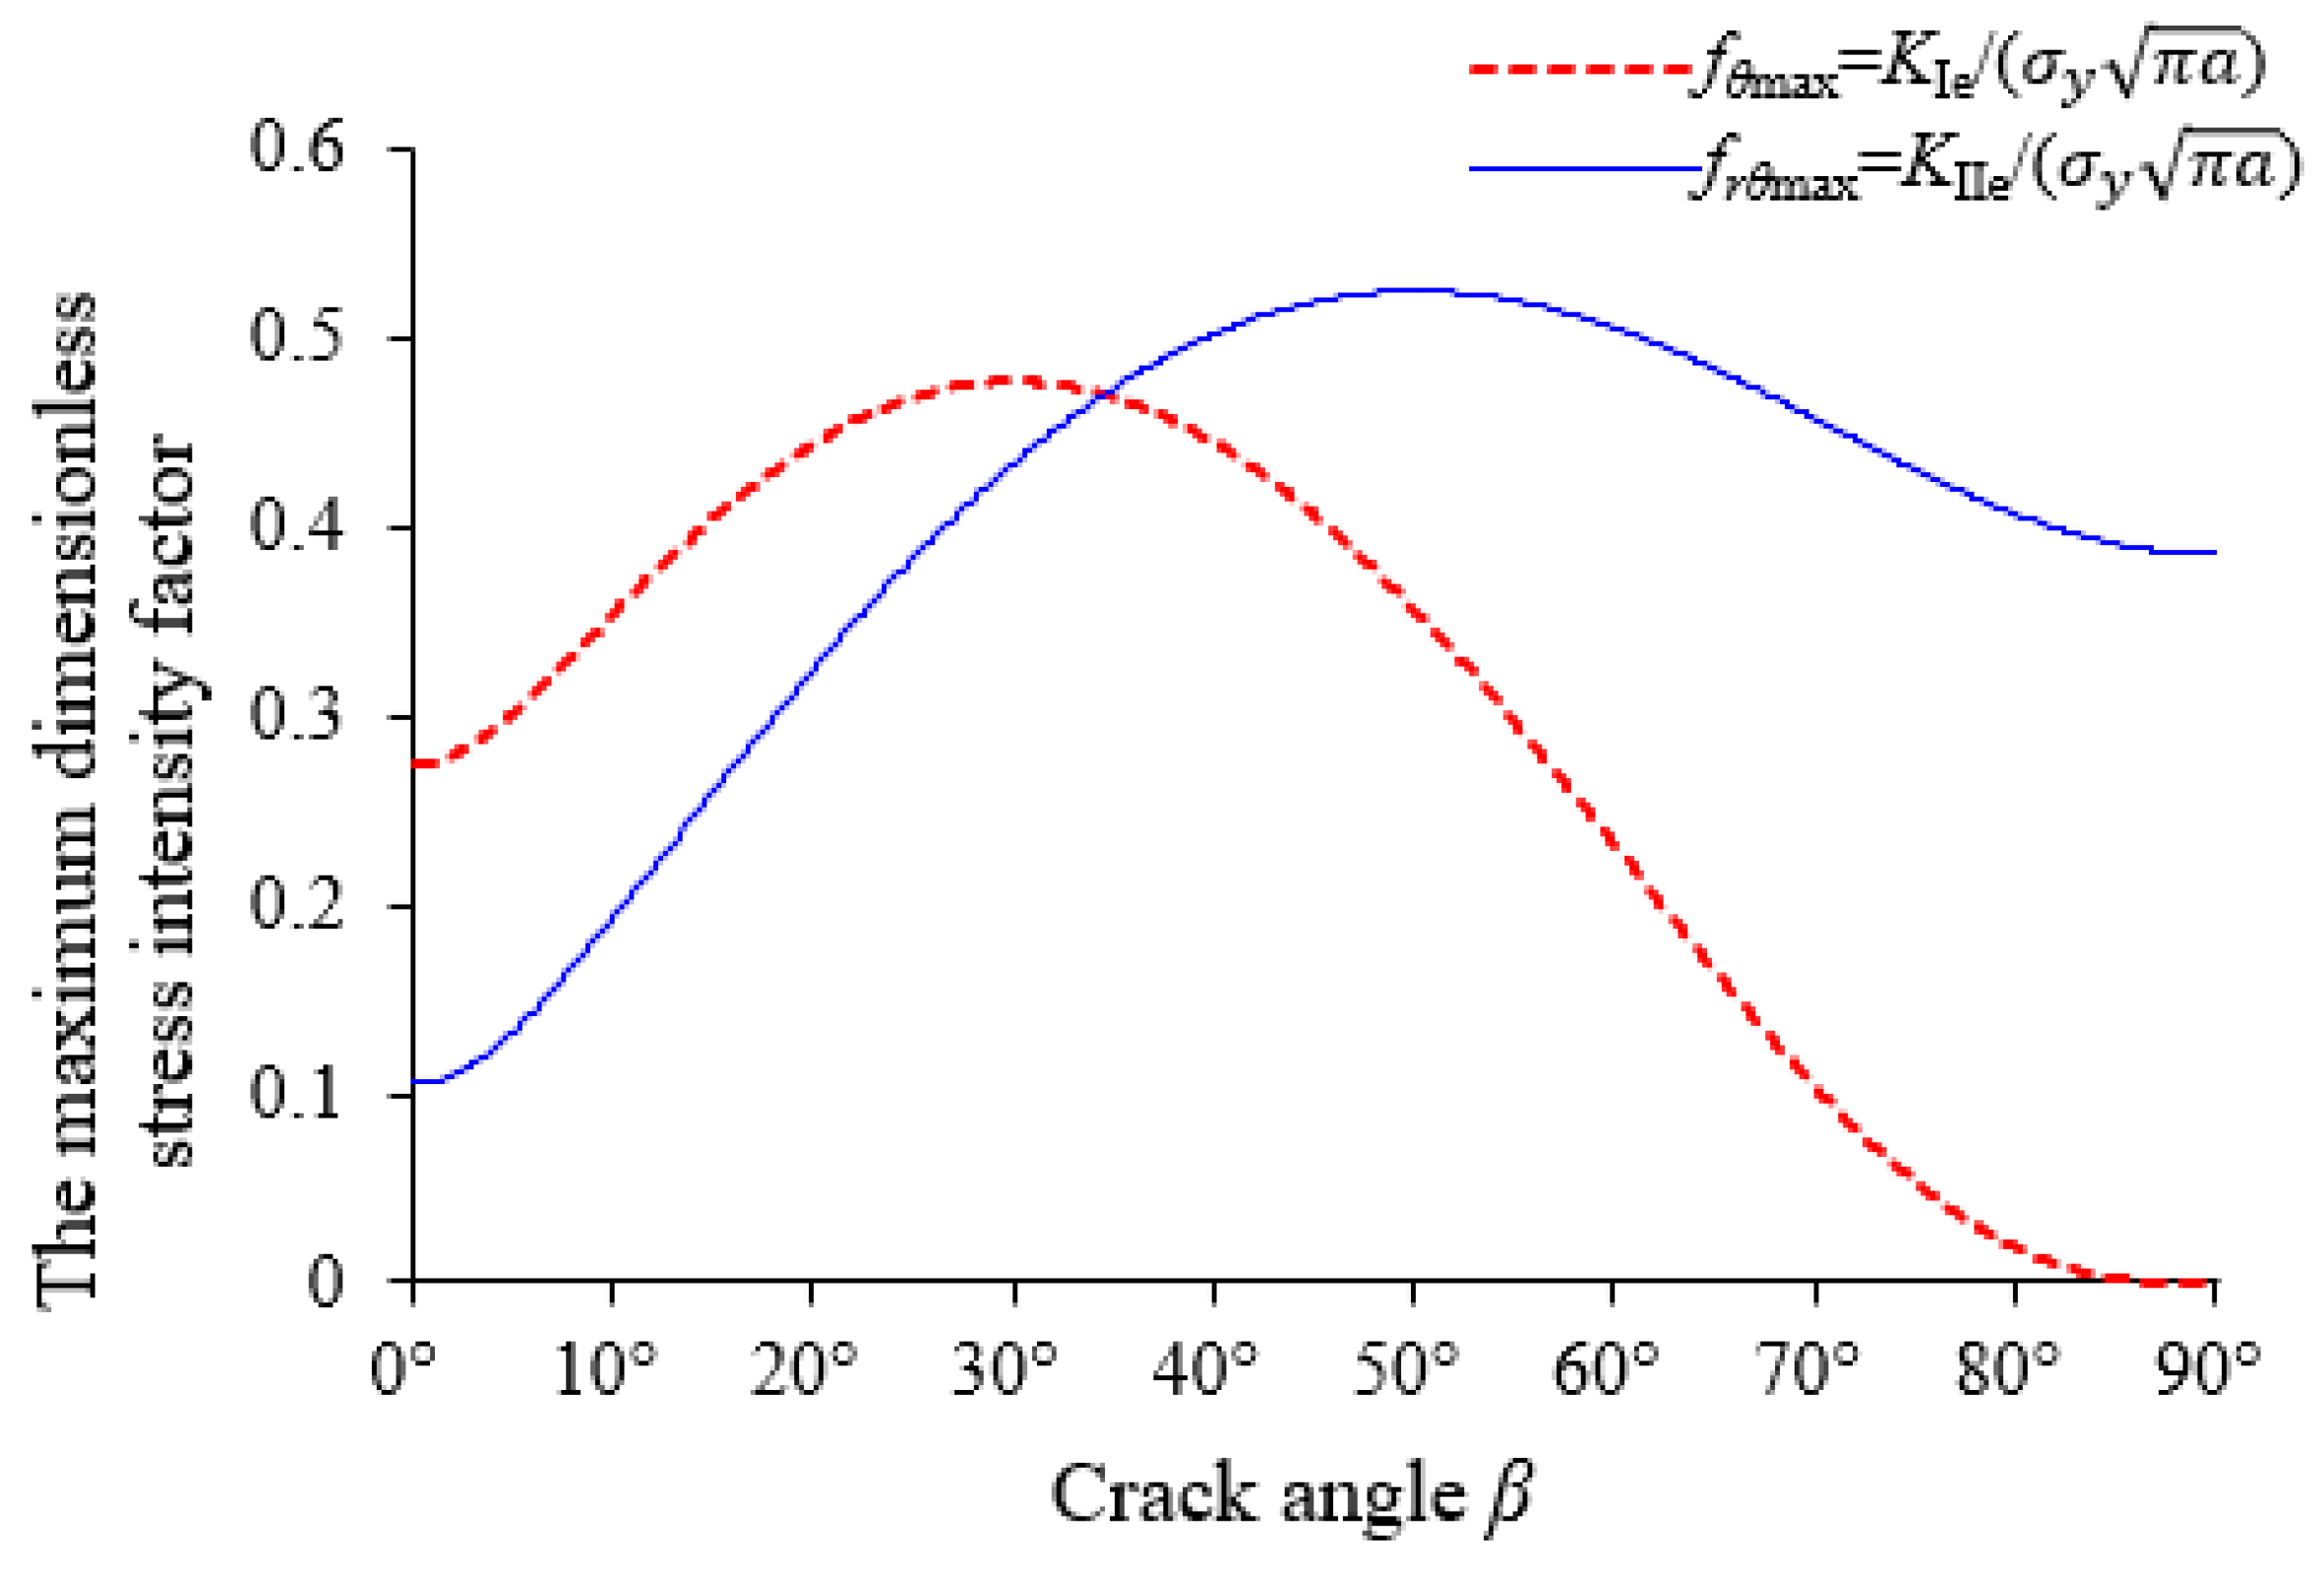
The mode-I fracture toughness of brittle material is lower than the mode-II fracture toughness. The maximum dimensionless mode-I and mode-II stress intensity factors are defined as f θ max = K Ie / σ y π a and f r θ max = K II e / σ y π a , respectively. When f r θ max / f θ max < 1 or f r θ max / f θ max < K C / K C , the crack will expand according to the mode-I fracture pattern. If f r θ max / f θ max > 1 and f r θ max / f θ max > K C / K C the fracture will follow a mode-II fracture pattern. For a 0.5 mm wide crack, KI = 0, the dimensionless stress intensity factor is shown in Figure 8, where f r θ max / f θ max < 1 . Thus, mode-I fracture occurred, and the angle of f θ max was 70.5° based on the maximum circumferential stress theory.
The maximum circumferential stress at the crack tip is greater than the maximum radial shear stress for specimens 1–5 (Table 5). The crack propagation angles for the specimens obtained from the numerical and experimental results are close to those obtained from the maximum circumferential stress (Table 6).

4.3. Failure Mechanism of a Non-Closed Single-Crack Concrete Sample

The mode-I stress intensity factor for the non-closed crack is negative when the crack is under compression. The dimensionless SIF at the crack tip achieved from maximum circumferential tensile stress will be less than that from the radial shearing stress when the pre-crack angle is small (Figure 9). Thus, mode-II fracture in a non-closed crack will occur only if f r θ max / f θ max > 1 and f r θ max / f θ max > K C / K C . Therefore, the mode domain can be divided into two regions—the mode-I and mode-II fracture regions—as shown in Figure 10.
A mode-I fracture will occur in a sample with a non-closed crack when the crack angle is less than 45° (Figure 11). Figure 11 and Table 3 (cases 6 and 7) indicate that the crack rupture angles of the specimens with small pre-crack angles do not agree with the initiation angles obtained by the maximum circumferential stress theory. However, as β approaches 45°, the experimental fracture initiation angles are closer to those obtained by the maximum circumferential stress theory. For crack angles greater than 30° (specimens 9–11), there are considerable differences between the rupture angles of the non-closed and closed cracks because the stress patterns are different for the two conditions. The initiation angles of the non-closed cracks are close to the results obtained by the radial shear stress criterion.
It can be seen in Table 5 that under the same crack width, as the crack angle increases, the maximum circumferential stress and the maximum radial shear stress at the crack tip first increase and then decrease. For closed cracks (crack width 0.5 mm), the maximum circumferential stress at the crack tip is greater than the radial shear stress at the same crack angle and the maximum of both stresses appears at 45° (case 3). In the case of non-closed cracks, the maximum radial shear stress is greater than the maximum circumferential tensile stress (cases 8, 9, and 10) after the crack angle is greater than 45°. When the crack angle is 75°, the maximum circumferential tensile stress is only 1.55 MPa. There is good agreement between the rupture angles derived from the numerical and experimental tests and those calculated by the maximum circumferential stress theory. However, for specimens 9–11, the maximum circumferential tensile stress is smaller than the maximum radial shear stress even though f r θ max / f θ max > 1 and f r θ max / f θ max > K C / K C . The rupture angles of the experimental results are close to those of the maximum radial stress for a mode-II fracture.
The results presented above indicate that the maximum circumferential stress theory has some limitations in interpreting the fracture propagation of the non-closed cracks under compressional loading. The initiation angles approach those of the radial shear stress criterion if f r θ max / f θ max > 1 and f r θ max / f θ max > K C / K C .

5. Conclusions

We performed uniaxial compression tests on concrete specimens containing cracks at various angles and widths. The results were compared with theoretical and numerical simulation results; based on the analysis of the results, we conclude the following.
(1)
The strength of the concrete sample decreases initially and then increases with increasing crack angle. For the same crack angle, the greater the crack width, the higher the strength of the non-closed crack sample. The crack width has a significant effect on the initiation angle.
(2)
With the maximum circumferential stress theory, it is difficult to depict the fracture propagation of non-closed cracks under compression. When KI < 0, a non-closed crack under uniaxial compression will have a mode-I stress intensity factor. The circumferential compressive stress created by the mode-I stress intensity factor will restrain the circumferential tensile stress caused by the mode-II stress intensity factor. If f r θ max / f θ max > 1 and f r θ max / f θ max > K C / K C , the rupture angle will be close to the direction of the maximum radial shear stress for a non-closed crack.

Author Contributions

Conceptualization, J.Z. and L.W.; methodology, L.W.; software, J.Z. and L.W.; validation, J.Z. and L.W.; formal analysis, J.Z., B.L. and L.W.; writing—original draft preparation, J.Z. and L.W.; writing—review and editing, J.Z. and L.W.; visualization, J.Y.; supervision, J.X. and H.Z.; funding acquisition, L.W. All authors have read and agreed to the published version of the manuscript.

Funding

This research was funded by the National Natural Science Foundation of China (No. U20A20314), the Chongqing Natural Science Foundation of China (cstc2019jcyj-cxttX0004, cstc2019jcyj-msxmX0556), and the Natural Science Fund for Distinguished Young Scholars of Chongqing (cstc2020jcyj-jqX0006).

Conflicts of Interest

The authors declare no conflict of interest.

References

  1. Farzampour, A. Compressive Behavior of Concrete under Environmental Effects; IntechOpen: London, UK, 2019; pp. 92–104. [Google Scholar]
  2. Malhotra, V.M.; Carino, N.J. The maturity method. In Handbook on Nondestructive Testing of Concrete; CRC Press: Boca, LA, USA; Raton, FL, USA, 2003; pp. 102–148. [Google Scholar]
  3. Bobet, A.; Einstein, H.H. Fracture coalescence in rock-type materials under uniaxial and biaxial compression. Int. J. Rock Mech. Min. Sci. 1998, 35, 863–888. [Google Scholar] [CrossRef]
  4. Bobet, A. The initiation of secondary cracks in compression. Int. J. Rock Mech. Min. Sci. 2000, 66, 187–219. [Google Scholar] [CrossRef]
  5. Vasarhelyi, B.; Bobet, A. Modeling of crack initiation, propagation and coalescence in niaxial compression. Rock Mech. Rock Eng. 2000, 33, 119–139. [Google Scholar]
  6. Tang, C.A.; Lin, P.; Wong, R.H.C.; Chau, K.T. Analysis of crack coalescence in rock-like materials containing three flaws—Part II: Numerical approach. Int. J. Rock Mech. Min. Sci. 2001, 38, 925–939. [Google Scholar] [CrossRef]
  7. Sagong, M.; Bobet, A. Coalescence of multiple flaws in a rock-model material in uniaxial compression. Int. J. Rock Mech. Min. Sci. 2002, 39, 229–241. [Google Scholar] [CrossRef]
  8. Park, C.H.; Bobet, A. Crack coalescence in specimens with open and closed flaws: A comparison. Int. J. Rock Mech. Min. Sci. 2009, 46, 819–829. [Google Scholar] [CrossRef]
  9. Tang, S.B.; Huang, R.Q.; Tang, C.A.; Lianga, Z.Z.; Heap, M.J. The failure processes analysis of rock slope using numerical modelling techniques. Eng. Fail. Anal. 2017, 79, 999–1016. [Google Scholar] [CrossRef]
  10. Wu, L.Z.; Li, B.; Huang, R.Q.; Sun, P. Experimental study and modeling of shear rheology in sandstone with non-persistent joints. Eng. Geol. 2017, 222, 201–211. [Google Scholar] [CrossRef]
  11. Peng, J.; Wong, L.N.Y.; Liu, G.; Teh, C.I. Influence of initial micro-crack damage on strength and micro-cracking behavior of an intrusive crystalline rock. Bull. Eng. Geol. Environ. 2019, 78, 2957–2971. [Google Scholar] [CrossRef]
  12. Lu, Y.N.; Qi, Y.; Tenardi, M.; Long, R. Mixed-mode fracture in a soft elastomer. Extrem. Mech. Lett. 2021, 48, 101380. [Google Scholar] [CrossRef]
  13. Wu, L.Z.; Zhou, J.T.; Luo, L.; Yang, L.P. Rock dynamic fracture of a novel semi-circular-disk specimen. Int. J. Rock Mech. Min. Sci. 2022, 152, 105047. [Google Scholar] [CrossRef]
  14. Xin, J.; Jiang, Y.; Zhou, J.; Zhou, J.; Peng, L.; Liu, S.; Tang, T. Bridge deformation prediction based on SHM data using improved VMD and conditional KDE. Eng. Struct. 2022, 261, 114285. [Google Scholar] [CrossRef]
  15. Wang, Q.Z.; Jia, X.M.; Wu, L.Z. Wide-range stress intensity factors for the ISRM suggested method using CCNBD specimens for rock fracture toughness tests. Int. J. Rock Mech. Min. Sci. 2004, 41, 709–716. [Google Scholar] [CrossRef]
  16. Al-Mukhtar, A.M.; Merkel, B. Simulation of the crack propagation in rocks using fracture mechanics approach. J. Fail. Anal. Prev. 2015, 15, 90–100. [Google Scholar] [CrossRef]
  17. Huang, R.Q.; Wu, L.Z.; He, Q.; Li, J.H. Stress intensity factor analysis and the stability of overhanging rock. Rock Mech. Rock Eng. 2017, 50, 2135–2142. [Google Scholar] [CrossRef]
  18. Huang, R.Q.; Wu, L.Z.; Li, B. Crack initiation criteria and fracture simulation for pre-cracked sandstones. Adv. Mater. Sci. Eng. 2019, 2019, 9359410. [Google Scholar] [CrossRef] [Green Version]
  19. Wu, L.Z.; Shao, G.Q.; Huang, R.Q.; He, Q. Overhanging Rock: Theoretical, Physical and Numerical Modeling. Rock Mech. Rock Eng. 2018, 51, 3585–3597. [Google Scholar] [CrossRef]
  20. Erdogan, F.; Sih, G.C. On the crack extension in plates under plane loading and transverse shear. J. Basic Eng. 1963, 85, 519–525. [Google Scholar] [CrossRef]
  21. Hussian, M.A.; Pu, E.L.; Underwood, J.H. Strain energy release rate for a crack under combined mode I and mode II. In Fracture Analysis; ASTM STP 560; ASTM International: West Conshohocken, PA, USA, 1974; pp. 2–28. [Google Scholar]
  22. Sih, G.C. Energy-density concept in fracture mechanics. Eng. Fract. Mech. 1973, 5, 1037–1040. [Google Scholar] [CrossRef]
  23. Nuismer, R.J. An energy release rate criterion for mixed mode fracture. Int. J. Rock Mech. Min. 1975, 11, 245–250. [Google Scholar] [CrossRef]
  24. Zhu, S.R.; Wu, L.Z.; Huang, J. Application of an improved P(m)-SOR iteration method for flow in partially saturated soils. Comput. Geosci. 2022, 26, 131–145. [Google Scholar] [CrossRef]
  25. Marji, M.F.; Dehghani, I. Kinked crack analysis by a hybridized boundary element/boundary collocation method. Int. J. Solids Struct. 2010, 47, 922–933. [Google Scholar] [CrossRef] [Green Version]
  26. Marji, M.F. On the use of power series solution method in the crack analysis of brittle materials by indirect boundary element method. Eng. Fract. Mech. 2013, 98, 365–382. [Google Scholar] [CrossRef]
  27. Sun, Z.Q. Is crack branching under shear loading caused by shear fracture—A critical review on maximum circumferential stress theory. Trans. Nonferrous Met. Soc. China 2001, 11, 287–292. [Google Scholar]
  28. Horii, H.; Nemat-Nasser, S. Compression-induced microcrack growth in brittle solids: Axial splitting and shear failure. J. Geophys. Res. 1985, 90, 3105–3125. [Google Scholar] [CrossRef]
  29. Huang, J.F.; Chen, G.L.; Zhao, Y.H.; Wang, R. An experimental study of the strain field development prior to failure of a marble plate under compression. Tectonophysics 1990, 175, 269–284. [Google Scholar]
  30. Shen, B.; Stephansson, O.; Einstein, H.H.; Ghahreman, B. Coalescence of fractures under shear stress experiments. J. Geophys. Res. 1995, 100, 5975–5990. [Google Scholar] [CrossRef]
  31. Wong, R.H.C.; Chau, K.T. Crack coalescence in a rock-like material containing two cracks. Int. J. Rock Mech. Min. Sci. 1998, 35, 147–164. [Google Scholar] [CrossRef]
  32. Sahouryeh, E.; Dyskin, A.V.; Germanovich, L.N. Crack growth under biaxial compression. Eng. Fract. Mech. 2002, 69, 2187–2198. [Google Scholar] [CrossRef]
  33. Li, Y.P.; Chen, L.Z.; Wang, Y.H. Experimental research on pre-cracked marble under compression. Int. J. Solids Struct. 2005, 42, 2505–2516. [Google Scholar] [CrossRef]
  34. Park, C.H.; Bobet, A. Crack initiation and propagation from frictional fractures. In Proceedings of the 1st Canada–US Rock Mechanics Symposium, Vancouver, BC, Canada, 27–31 May 2007; pp. 557–564. [Google Scholar]
  35. Park, C.H. Coalescence of Frictional Fractures in Rock Materials. Ph.D. Thesis, Purdue University, West Lafayette, IN, USA, 2008. [Google Scholar]
  36. Yang, S.Q.; Dai, Y.H.; Han, L.J.; Jin, Z.Q. Experimental study on mechanical behavior of brittle marble specimens containing different flaws under uniaxial compression. Eng. Fract. Mech. 2009, 76, 1833–1845. [Google Scholar] [CrossRef]
  37. Yang, S.Q. Crack coalescence behavior of brittle sandstone specimens containing two coplanar fissures in the process of deformation failure. Eng. Fract. Mech. 2011, 78, 3059–3081. [Google Scholar] [CrossRef]
  38. Park, C.H.; Bobet, A. Crack initiation, propagation and coalescence from frictional flaws in uniaxial compression. Eng. Fract. Mech. 2010, 77, 2727–2748. [Google Scholar] [CrossRef]
  39. Janeiro, R.P.; Einstein, H.H. Experimental study of the cracking behavior of specimens containing inclusions (under uniaxial compression). Int. J. Fract. 2010, 164, 83–102. [Google Scholar] [CrossRef] [Green Version]
  40. Lee, H.; Jeon, S. An experimental and numerical study of fracture coalescence in pre-cracked specimens under uniaxial compression. Int. J. Solids Struct. 2011, 48, 979–999. [Google Scholar] [CrossRef] [Green Version]
  41. Jia, L.C.; Chen, M.; Zhang, W.; Xu, T.; Zhou, Y.; Hou, B.; Jin, Y. Experimental study and numerical modeling of brittle fracture of carbonate rock under uniaxial compression. Mech. Res. Commun. 2013, 50, 58–62. [Google Scholar] [CrossRef]
  42. Zhao, Y.H. Crack pattern evolution and a fractal damage constitutive model for rock. Int. J. Rock Mech. Min. 1998, 35, 349–366. [Google Scholar] [CrossRef]
  43. Fujii, Y.; Ishijima, Y. Consideration of fracture growth from an inclined slit and inclined initial fracture at the surface of rock and mortar in compression. Int. J. Rock Mech. Min. Sci. 2004, 41, 1035–1041. [Google Scholar] [CrossRef]
  44. Awaji, H.; Sato, S. Combined mode fracture toughness measurement by the disk test. J. Eng. Mater. Technol. 1978, 100, 175–182. [Google Scholar] [CrossRef]
  45. Atkinson, C.; Smelser, R.E.; Sanchez, J. Combined mode fracture via the cracked Brazilian disk. Int. J. Fract. 1982, 18, 279–291. [Google Scholar] [CrossRef]
  46. Shetty, D.K.; Rosenfield, A.R.; Duckworth, W.H. Mixed mode fracture of ceramic in diametrical compression. J. Am. Ceram. Soc. 1986, 69, 437–443. [Google Scholar] [CrossRef]
  47. Fowell, R.J.; Xu, C. The use of the cracked Brazilian disk geometry for rock fracture investigations. Int. J. Rock Mech. Min. Sci. Geomech. Abstr. 1994, 31, 571–579. [Google Scholar] [CrossRef]
  48. Krishnan, G.R.; Zhao, X.L.; Zaman, M.; Rogiers, J.C. Fracture toughness of a soft sandstone. Int. J. Rock Mech. Min. Sci. 1998, 35, 195–218. [Google Scholar] [CrossRef]
  49. Khan, K.; Al-Shayea, N.A. Effects of specimen geometry and testing method on mixed-mode I–II fracture toughness of a limestone rock from Saudi Arabia. Rock Mech. Rock Eng. 2000, 33, 179–206. [Google Scholar] [CrossRef]
  50. Al-Shayea, N.A.; Khan, K.; Abduljauwad, S.N. Effects of confining pressure and temperature on mixed-mode (I–II) fracture toughness of a limestone rock formation. Int. J. Rock Mech. Rock Sci. 2000, 37, 629–643. [Google Scholar] [CrossRef]
  51. Al-Shayea, N.A. Crack propagation trajectories for rocks under mixed mode I–II fracture. Eng. Geol. 2005, 81, 84–97. [Google Scholar] [CrossRef]
  52. Ayatollahi, M.R.; Aliha, M.R.M. On the use of Brazilian disc specimen for calculating mixed mode I–II fracture toughness of rock materials. Eng. Fract. Mech. 2008, 75, 4631–4641. [Google Scholar] [CrossRef]
  53. Ayatollahi, M.R.; Sistaninia, M. Mode II fracture study of rocks using Brazilian disk specimens. Int. J. Rock Mech. Min. Sci. 2011, 48, 819–826. [Google Scholar] [CrossRef]
  54. Dai, F.; Xia, K.; Zheng, H.; Wang, Y.X. Determination of dynamic rock mode-I fracture parameters using cracked chevron notched semi-circular bend specimen. Eng. Fract. Mech. 2011, 78, 2633–2644. [Google Scholar] [CrossRef]
  55. Wu, L.Z.; Li, B.; Huang, R.Q.; Wang, Q.Z. Study on Mode I-II hybrid fracture criteria for the stability analysis of sliding overhanging rock. Eng. Geol. 2016, 209, 187–195. [Google Scholar] [CrossRef]
  56. Lawn, B.R.; Wilshaw, T.R. Fracture of Brittle Solids; Cambridge University Press: London, UK, 1975. [Google Scholar]
Figure 1. Concrete specimen with a single fracture. (a) Test sample with 0.5 mm width single crack (left), and the 0.5 mm thick steel sheet is inserted into the cracks to fill the cracks; (b) Test sample with 3.0 mm width single hollow crack; (c) samples with different crack angles.
Applsci 12 04803 g001
Figure 2. (a) Test machine; (b) Diagram of the loading of the concrete specimen with a single fracture. The applied compressive stress is represented by σ y ; β is the angle between the crack axis and the direction of loading; 2a is the crack length; L is the specimen width, and H is the specimen height.
Applsci 12 04803 g002
Figure 3. Stress–strain curves of concrete specimens with different crack angles. (a) Crack width = 0.5 mm; (b) Crack width = 3.0 mm.
Applsci 12 04803 g003aApplsci 12 04803 g003b
Figure 4. Failure mode of jointed concrete with a single crack (crack width = 3.0 mm). (a) β = 15°, (b) β = 30°, (c) β = 45°, (d) β = 60°, (e) β = 75° Note: T represents tensile crack and S represents shear crack.
Applsci 12 04803 g004
Figure 5. Numerical model of single-crack concrete sample with β = 45° and d = 3.0 mm. (a) Numerical model of single-crack sample; (b) Stress distribution of single-crack.
Applsci 12 04803 g005
Figure 6. Stress–strain curves under numerical and experimental results (crack width = 3.0 mm).
Applsci 12 04803 g006
Figure 7. Fracture propagation numerical simulation of single joint-fissured concrete sample where the single crack thickness is 0.5 mm. (a) β = 15°; (b) β = 30°; (c) β = 45°; (d) β = 60°; (e) β = 75°.
Applsci 12 04803 g007
Figure 8. Distribution curve of dimensionless intensity factor for a closed crack (f denotes dimensionless SIF).
Applsci 12 04803 g008
Figure 9. Relationship between the maximum mode-I and mode-II dimensionless stress intensity factors.
Applsci 12 04803 g009
Figure 10. Mode-I and mode-II fracture regions for hollow cracks.
Applsci 12 04803 g010
Figure 11. Comparison between theoretical and experimental initiation angles.
Applsci 12 04803 g011
Table 1. The ratio of concrete material.
CementGypsumQuartz SandWaterWater-Reducing AgentWater-Proofing Agent
0.60 mm0.30 mm0.15 mm≤0.075 mm
33.60%8.06%12.33%13.41%13.60%0.96%16.89%0.86%0.29%
Table 2. Crack parameters for specimens in uniaxial compression tests.
CasesCrack Width d (mm)Crack Length a (mm)Crack Angle β (°)
10.51015
20.51030
30.51045
40.51060
50.51075
631015
731030
831045
931060
1031075
Note: β is the angle between the crack and loading direction.
Table 3. Peak strength and crack initiation angle in uniaxial compression tests.
CasesCrack Width d (mm)Crack Angle β (°)Peak Strength (MPa)Initiation Angle (°)
10.51522.0310
20.53019.6054
30.54517.1855
40.56020.30-
50.57521.9767
73.01514.8011
83.03014.4539
93.04516.1741
103.06016.40-
113.07518.36-
Table 4. Mechanical parameters used in numerical modeling.
MaterialElastic Modulus
E (GPa)
Friction Coefficient uPoisson’s Ratio
v
Concrete1.3540.120.21
Table 5. Numerical results of stress near the crack tip.
CasesCrack Width (mm)Crack Angle β (°)Maximum Circumferential Stress at Crack Tip (MPa)The Direction of the Maximum Circumferential Stress (°)Maximum Radial Shear Stress at Crack Tip (MPa)The Direction of the Maximum Radial Shear Stress (°)
10.51510.2513.58.120
23013.046.510.440
34514.976111.980
46012.74669.440
57511.73729.440
63.01513.13148.53−10
73015.424614.672.5
84512.338117.757.5
9607.7410217.0712
10751.5512414.6841
Table 6. Initiation angles derived from experimental tests and numerical simulation.
CasesCrack Angle β (°)The Initiation Angles of Experimental Work (°)The Initiation Angles by Numerical Simulation (°)The Direction of the Maximum Circumferential Stress (°)The Direction of the Maximum Radial Shear Stress (°)
1151113130
2304747470
3456863630
4607366650
5756970730
Publisher’s Note: MDPI stays neutral with regard to jurisdictional claims in published maps and institutional affiliations.