Abstract
Imaging methods based on visible luminescence induced by ultraviolet (UV) radiation are well consolidated in the investigation of ancient works of art, to map varnishes, retouches, and possibly some pigments. As far as contemporary art is involved, the wide range of synthetic materials, especially pigments, introduced from 1850 onwards, makes the possible application of the technique particularly challenging. Among the colouring substances used by artists in the 19th and 20th centuries, only cadmium-based pigments received attention due to their typical near-infrared luminescence. Nevertheless, the fluorescence emission exhibited by several synthetic pigments upon visible excitation was recently demonstrated and confirmed using UV radiation in the present work. The subsequent possibility of individuating such materials in paintings by ultraviolet fluorescence (UVF) images was explored on mock-up painting samples of a wide series of pigments dispersed in oil or acrylic binder. Visible and infrared luminescence images obtained by irradiating with visible radiation (VIVF and VIL) were also collected. It was thus evidenced the possible advantage of the choice of a different excitation wavelength in discriminating between the contributions of pigment and binder. Finally, a recent oil painting on panel was also examined as case study.
1. Introduction
In art conservation, visible luminescence induced by UV radiation has been a well-known and widely exploited phenomenon since the 1930s [1,2,3,4,5,6,7]; long wave UV-A lamps (365 nm emission peak) are traditionally used to non-invasively map the distribution of varnishes, retouches, and in some case for the preliminary mapping of specific pigments. In the following years the technique was consolidated [8,9,10,11,12,13,14] and the newly introduced digital cameras allowed the acquisition of more detailed images with more information with a better ability in characterization of the painting outer layers. The traditional approach consists in using the 365 nm excitation band and recording the visible luminescence similarly to what is seen by the eyes in the direct examination. Thanks to the relatively short wavelength of the UV radiation with an intrinsic limited capacity in the penetration of lower painting layers, fluorescence is mainly used in the examination of external layers, constituted more often by varnishes than by binders and pigments.
The introduction of other bands of excitation was firstly aimed to the qualitative characterization of cadmium-based pigments [15,16] and for the Egyptian blue [17,18,19] using the visible luminescence in the infrared. An attempt to the standardization of the procedure was made by different authors [20,21,22,23,24] and with a UV reference standard proposal [25] since the methodology is highly dependent on the setup employed. In addition, the results obtained both from imaging and spectrophotometric analyses contain unavoidably the contributions of several materials, such as varnishes, binders, pigments, and their ageing products. Considering contemporary paintings, the introduction of synthetic materials both as binders and pigments added to the evaluation of fluorescence spectra and images a further complexity for the materials characterization. Nevertheless, the application of spectrofluorimetry with visible excitation was recently suggested [26] as a useful method for the identification of synthetic organic pigments, manufactured starting from the second half of the 19th century [27], and nowadays, the preponderant colouring substances used in artists paints. Indeed, several analytical techniques have been proposed for the investigation of this wide class of colouring materials, in particular Raman spectroscopy [28], X-ray diffraction [29], liquid chromatography [30], and different methods based on mass spectrometry, such as pyrolysis-gas chromatography–mass spectrometry [31], direct temperature-resolved mass spectrometry [32], laser desorption ionization mass spectrometry [33], and secondary ion mass spectrometry [34]. It is worth noting that, among the above cited techniques, only Raman spectroscopy is suitable for totally non-invasive analyses on paintings. Despite this, even this last technique may prove to be inapplicable when the aged binder (in particular in the case of the drying oil), or in some cases the pigment itself, gives rise to a significant emission of fluorescence which hides the Raman signals. For this reason, as reported above, other non-invasive techniques such as spectrofluorimetry can be of help in the identification of synthetic organic pigments in contemporary paintings and, besides point analyses, imaging methods can in principle give a comprehensive view of their distribution in the same paintings.
As for imaging techniques, the range of excitation is still often limited to the 365 nm wavelength. It is worth noting that such a limitation can be particularly troublesome in the case of painting materials, both ancient and modern, due to the high fluorescence of varnishes and binders that covers the contribution emitted by pigments.
In this research a multiband approach in the investigation of contemporary art materials is presented using different wavelengths of excitation, a set of mock-ups, and a contemporary art painting. Results were compared with those obtained by spectrofluorimetry to check the colour of the fluorescence emission, its dependence on binder/pigment ratio, and to verify the presence of other excitation bands, different to those traditionally used in imaging techniques to help scientist and conservators in the study and mapping of painting materials.
2. Materials and Methods
2.1. Mock-Ups and Contemporary Painting
Mock-up painting samples were prepared by spreading on canvas pure pigments mixed with linseed oil (clarified) or acrylic (Primal) binder in ratio 3:1, slightly adjusted according to the rheological properties of the obtained mixture. Pure powder pigments were partly purchased from Kremer (Aichstetten, Germany) and from a local paint shop (Colorificio Pecchio, Milano, Italy) and partly kindly donated by Maimeri (Milano, Italy). Linseed oil was purchased in a local paint shop, while Primal® AC35 was bought from Kremer (Aichstetten, Germany). For all the examined pigments, paints were prepared with both binders. Just for four of them, namely, PR3, PR108, PR112, and PY35, only mock-ups obtained with oil binder will be shown below. Two Maimeri commercial oil paints containing pigments in mixture were also examined.
The oil painting on panel “Addetta near Zoate”, examined in the present work, was realized by the Italian landscape painter Giuseppe Faraone and dates to 2011. It represents a view of a canal named Addetta that flows across the southern countryside of Milan.
2.2. Multiband Imaging Methods
Visible and multiband luminescence images were acquired with a digital single-lens reflex (DSLR) Nikon D810, modified to extend the sensitivity from 350 nm to 1000 nm and coupled with a Nikkor 50 mm f/1.8 D AF-S. Images were shot as 16-bit RAW files of 7360 × 4912 pixels. The lighting was chosen according to the different purposes and different filters were mounted on the lens to correctly acquire the images as described below and having specific transmittance characteristics as shown in Figure 1.
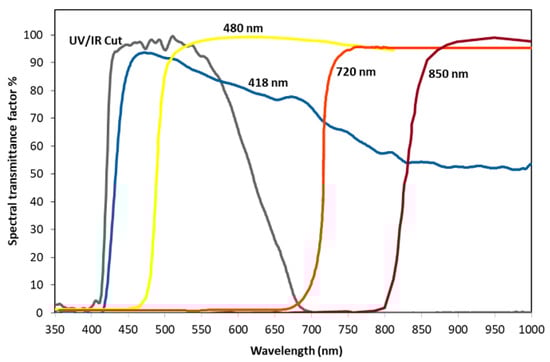
Figure 1.
Spectral transmittance factors of the optical filters used to remove the excitation wavelengths from the acquired images.
- Visible images (Vis): for the visible images were used two 35 W led light panels (Dörr Led DLP-600 Neu-Ulm, Germany), with diffused light and placed symmetrically at 45° to the painting surface. UV/IR cut filters were used to select radiation in the visible range.
- Visible fluorescence induced by UV radiation (UVF): mock-ups and painting were irradiated with two 365 nm (±10 nm) UV LED lamp, each of 3 W (Madatec Srl, Milan, Italy). A high-pass filter having a cut-on wavelength of 420 nm together with a UV/IR cut filter were used to reduce the contribution of the even small reflection by the painting of the blue component emitted by the UV sources.
- Visible fluorescence induced by visible radiation (VIVF): a 3 W LED light source with emitting wavelength of 400, 440, and 530 nm (±10 nm) W (Madatec Srl, Milan, Italy) used combined respectively with a 480 nm and 720 nm high-pass filters were used in order to exclude the reflected part of the excitation radiation.
- Infrared luminescence induced by visible radiation, mostly known as visible induced luminescence (VIL) [17]: a 35 W led light panels (380–780 nm, Dörr Led DLP-600 Neu-Ulm, Germany) and a 3 W 440 nm led light (Madatec Srl, Milan, Italy) were respectively used in combination with an 850 nm high-pass filter.
For the fluorescence images acquired it was necessary to set up a reasonable post-production process. Using long-pass-coloured filters (cut on wavelength = 420 nm and 480 nm), inevitably a chromatic alteration is added to the acquired image. Moreover, fluorescent colorimetrically-correct standards comparable to those commonly used for Vis are not available, except for what concern RGB values [25]; thus, the procedure of colour correction is challenging. An attempt to perform a colour correction was made using four non-fluorescent grey references. They are four Spectralon® (Labsphere, North Sutton, NH, USA) multi-step targets of 99, 50, 25, and 12% reflectance mounted side-by-side (Figure 2, bottom-right position of each mock-up). Since they are not fluorescent, we assume that for UVF and VIVF images, RGB channels should have same values in correspondence of grey targets. Post-processing was then performed by requiring same RGB values for RAW images in Adobe Camera Raw software. Additionally, an Xrite Colorcheker® (Grand Rapids, MI, USA) was used for the colour management of the Vis images (Figure 2).
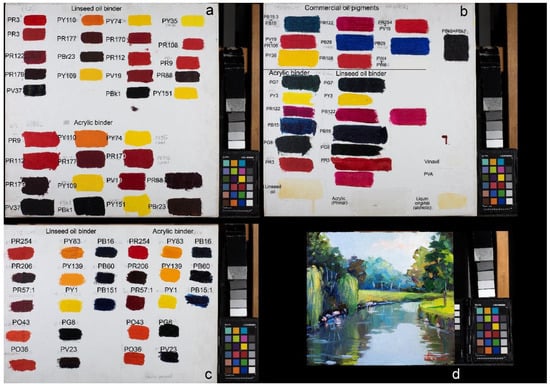
Figure 2.
Overview of all the mock-ups (a–c) with different combination of pigment and binders and a painting used in this work (d). For each panel, reference targets were positioned bottom-right consisting of: Spectralon® multi-step targets of 99, 50, 25, and 12% reflectance used as non-fluorescent materials to set the correct RGB and Xrite Colorcheker® for the colour management of the Vis images.
2.3. Spectrofluorimetric Analyses
Spectrofluorimetric analyses were performed using a custom-made portable microprobe. It was equipped with an Olympus 20× objective and connected by an optical fibre to a Lot Oriel MS125 spectrometer (grid 400 lines/mm) provided with an Andor CCD detector (1024 × 128 pixel) cooled by means of a Peltier device. The wavelength calibration of the spectrometer was performed using the emission spectrum of a neon lamp. For UV excitation, a LED source emitting at 365 nm with a power of 5.5 mW was used. The radiation from the source is sent on the measurement area with an incidence angle of 45° and the emitted radiation is collected through the objective of the above-described microprobe. The spectra were acquired as sum of 30 scans with an exposure time of 2 s and the analyses were preceded by the acquisition of a background spectrum in dark conditions.
3. Results and Discussion
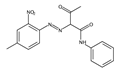
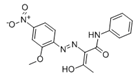
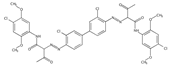
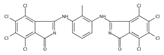
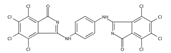
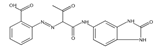
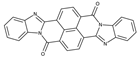
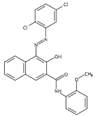
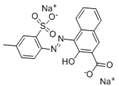
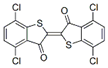
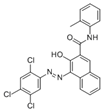
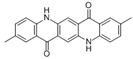
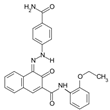
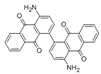
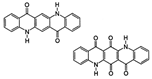
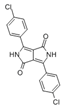
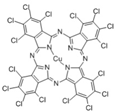
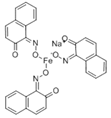
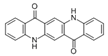
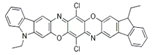
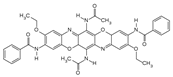
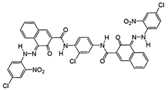
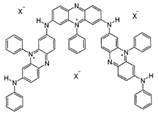
The synthetic organic pigments examined in the present work are listed in Table 1 with the corresponding chemical structures and experimental results of both spectrofluorimetric and imaging analyses, which will be discussed in detail below.

Table 1.
Chemical structures, wavelength of the emission maxima measured by spectrofluorimetry and the corresponding colour of emission observed in the RGB images for synthetic organic pigments examined in the present work when excited with 365 nm radiation.
3.1. The Effect of Chemical Structure of Organic Pigments
Figure 3a,c shows a series of synthetic organic pigments belonging to different chemical classes, spread on canvas in oil and acrylic binder. Figure 3b,d shows the images of the same mock-up painting samples irradiated with UV light at 365 nm. Pigments of different hues are considered and exhibit different behaviours in the imaging analysis, as detailed below.
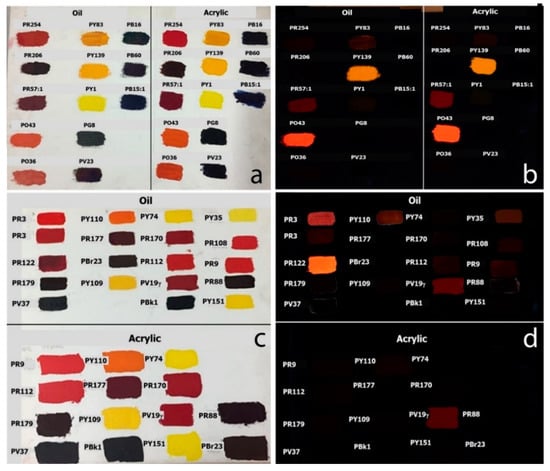
Figure 3.
(a,c) visible images of a series of mock-up painting samples on canvas of synthetic pigments in oil and acrylic binder; (b,d) UVF images. Note: the two mock-ups shown in (c) for PR3 contains a different concentration of the pigment, which is present in a higher amount in the mock-up on the second row.
It should be emphasized that differences among the concentrations of pigments in the mock-ups and the effect of the different binders must be considered. In fact, it is well known that the emission intensity of fluorescent compounds increases with increasing concentration of the emitter, but this tendency can be inverted for higher concentrations of the compound, due to self-absorption [35]. On the other hand, as discussed below, the contribution of the binder emission must also be taken into account, particularly for linseed oil. For this reason, only those pigments that give an evident fluorescence in the images, preferably both in painting layers with oil and acrylic binder, will be regarded as identifiable by the imaging technique.
- Blue and green pigments
The two phthalocyanine blue pigments PB15:1 and PB16, the indanthrone blue PB60 and the metal complex naphthalenolate green PG8 are not fluorescent in the visible region (Figure 3b). For PB15:1, PB60 and PG8 these observations agree with the results of the spectrofluorimetric analysis with UV excitation, where the three pigments did not show any emission. On the contrary, PB16, the other phthalocyanine blue pigment, gave a weak emission at about 870 nm, as already observed upon visible excitation for paint layers containing the same pigment [26].
- Red and orange pigments.
In the painting layers of the examined mock-ups, several organic pigments of this hue are present. In the corresponding images obtained at 365 nm, a remarkable UV- induced fluorescence was observed for the β-naphthol pigment PR57:1 (Figure 3b), for the perinone orange PO43 (Figure 3b), and, in particular, for the quinacridone magenta PR122 (Figure 3c). To a lesser extent, fluorescence was also detected in the UVF image for the β-naphthol red PR3 (Figure 3d). Interestingly, of the two mock-up paints containing this pigment and shown in Figure 3, the brighter image is obtained for the more diluted one, due to the contribution of the oil binder (see below). The remaining red/orange pigments were not observed in the UVF image. In fact, thioindigo PR88, naphthol AS PR170, anthraquinone PR177, perylene PR179, and quinacridone PR206 did not yield any emission spectrum upon excitation at 365 nm, as already observed for visible excitation [26]. Naphthol AS PR9 and PR112 and pyrrole red PR254 showed instead emission maxima between 630 and 638 nm (Figure 4 and Figure 5), but with an intensity apparently weaker in comparison with the emission of pigments that were brighter in the UVF image (see Figure 3b,d). A similar consideration can be made for the benzimidazolone orange pigment PO36 (data not shown), whose emission spectrum shows a maximum at about 618 nm, but with a significantly lower intensity in comparison with PO43.
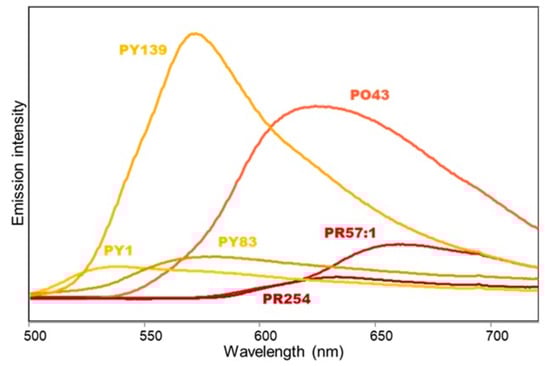
Figure 4.
Emission spectra (λλlexc 365 nm) of painting layers shown in Figure 3a and containing red, orange, and yellow synthetic organic pigments dispersed in linseed oil binder.
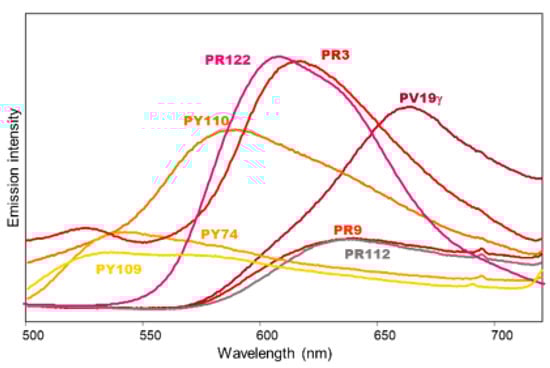
Figure 5.
Emission spectra (λexc 365 nm) of painting layers shown in Figure 3c and containing red, yellow, and violet synthetic organic pigments dispersed in linseed oil (PR3, PR122, PY109, PY110, and PV19) or acrylic binder (PY74, PR9, and PR112). For PR122 the band intensity was reduced by a factor of 10 for better comparison with the other pigments’ spectra. The highest intensity value reported in the figure is about 1/5 of the maximum value reported in Figure 4.
- Yellow pigments.
In the images obtained by excitation at 365 nm, a characteristic yellow UV-induced luminescence is observed for the isoindoline yellow PY139 (Figure 3b), in agreement with its strong fluorescence band at 572 nm (Figure 4). A weaker luminescence is detected for the isoindolinone pigment PY110 (Figure 3d) and even weaker for the diarylide pigment PY83 (Figure 3b), again in accordance with the relative intensity of the emission bands (Figure 4 and Figure 5). Finally, UV-induced luminescence cannot be observed for the acetoacetic arylide pigments PY1 and PY74, the isoindolinone PY109 and the benzimidazolone yellow PY151, as expected due to their weak (for PY1, PY74, and PY109) or completely absent (for PY151) fluorescence emission (Figure 4 and Figure 5).
- Violet pigments.
For the dioxazine violet pigments PV23 and PV37 no remarkable emission could be detected in the specrofluorimetric measurements upon UV excitation, differently from what reported for the same pigments upon visible excitation at 562 nm [26]. Accordingly, they do not give rise to an appreciable fluorescence in the two UV images (Figure 3b,d). On the contrary, the quinacridone violet PV19 in the γ form can be easily distinguished thanks to its red-coloured fluorescence, consistent with the emission maximum at 665 nm (Figure 5). Additionally, the β form of the same pigment, whose emission maximum is located at 615 nm, gives a characteristic purple-red fluorescence. Figure 6a shows, for example, two painting models obtained from commercial paints containing respectively a mixture of PV19 (βform) and PR206 and a mixture of the same PV19 and PR254. In both cases the emission due to quinacridone violet is observed (Figure 6b,c), as the other two components are not, or just weakly, fluorescent (see the discussion about red pigments).
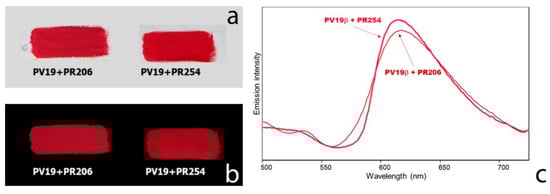
Figure 6.
(a) Visible image of two samples of commercial oil paints containing respectively a mixture of PV19 and PR206 and a mixture of PV19 and PR254; (b) UVF images; (c) emission spectra (λexc 365 nm) of painting layers shown in (a). The maximum intensity value reported in (c) is about 1/2 of the highest value in Figure 4.
3.2. The Multiwavelength Approach and the Effect of the Binder
It is well known from spectrofluorimetry that emission measurements are characterized by a significant selectivity, due to three main reasons: (1) the fact that not all compounds are fluorescent; (2) the possibility of choosing different excitation wavelengths; and (3) the fact that different compounds exhibit different emission maxima upon excitation at a given wavelength. Therefore, it is of interest to compare the result of the images acquired using different excitation bands and different acquisition ranges. As an example, Figure 7 shows the fluorescence images of several synthetic organic pigments with linseed oil binder. PR3 and PY110, on top left of the canvas, gradually loose intensity of fluorescence passing from UV to visible excitation, indicating a strong contribution due to the binder. Similarly, PR122 shows a weaker emission but a significant fluorescence can be acquired up to 720 nm. PY109 and PY151, that as reported above could not be observed in the image obtained upon 365 nm excitation, exhibit a visible fluorescence when excited al 530 nm. Finally, PY35 and PR108 show a significative fluorescence emission at wavelengths longer than 720 nm in the visible and in the near infrared, as will be detailed below.
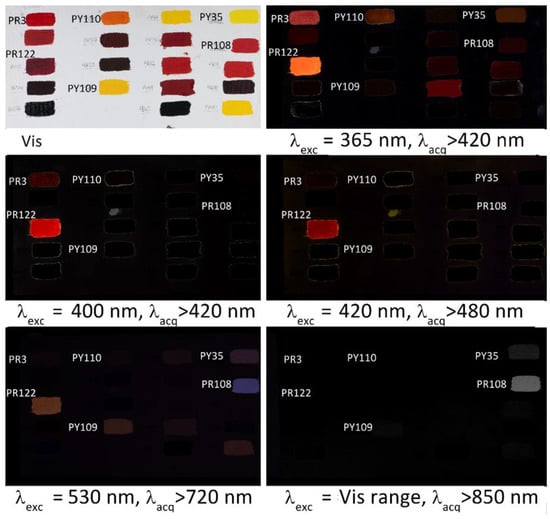
Figure 7.
Multiwavelength fluorescence images obtained using UV and Vis excitation, showing the differences in colour and intensity of the emissions of some mock-up paint samples on canvas obtained from synthetic organic pigments mixed with linseed oil.
To examine in more detail the effect of the two different binders, the emission spectra of linseed oil and acrylic medium were acquired upon excitation at 365 nm (Figure 8). Evidently, both binders exhibit a maximum of fluorescence emission around 500 nm, but it is much weaker for the synthetic binder.
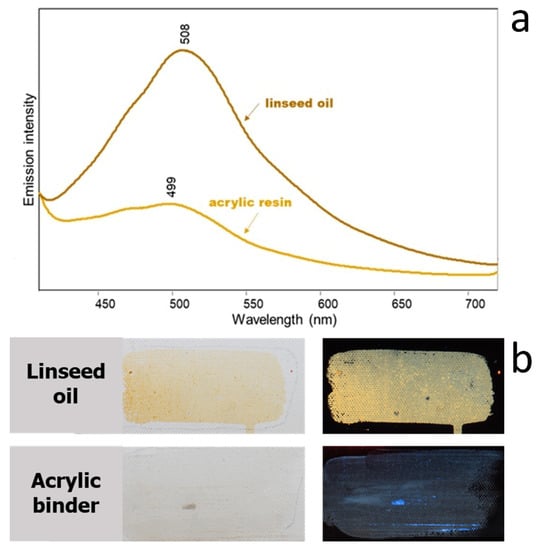
Figure 8.
(a) Emission spectra (λexc 365 nm) and (b) visible and UVF images of linseed oil and acrylic resin spread on canvas.
As anticipated above, of course such emission contributes to the fluorescence acquired in the UVF images, as shown in Figure 9 for painting samples containing the very fluorescent quinacridone magenta PR122.
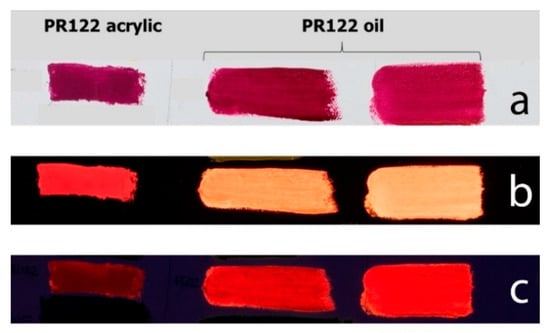
Figure 9.
(a) Visible image of painting layers on canvas containing quinacridone magenta PR122 in acrylic resin and in linseed oil. For the latter binder, two slightly different concentrations of the pigment were used, decreasing from left to right; (b) UVF image; (c) VIVF image.
In Figure 9b, the image obtained with the 365 nm UV light source shows a considerable contribution of the greenish emission of the oil binder, superimposed on the red one due to the pigment. The effect is much less evident for the painting samples with acrylic binder, coherently with the weaker emission shown by the latter, as discussed above. As already detailed above, the choice of a different excitation wavelength, namely, 440 nm, shows the fluorescence of the pigment in comparison with that of the binder, whose absorption is centred in the near UV (Figure 9c). Interestingly, for PR122 with oil binder, two painting layers are shown in Figure 9c, one of which is more diluted than the other and exhibits a brighter image not only upon UV excitation when the effect of the binder is more relevant, but also upon visible excitation. This fact suggests that, as already reminded above, the effect of self-absorption by the pigment must also be taken into account.
3.3. Cadmium-Based Pigments
Among inorganic pigments used in contemporary art, cadmium yellow, orange, and red ones have a relevant role. They are cadmium sulphides or sulphoselenides and their NIR luminescence has been documented, both with UV and visible excitation [6,16,26,36,37] This property can be observed for cadmium yellow PY35 and cadmium red PR108 in the VIVF image with excitation band at 530 nm (Figure 10b) but is even more evident in the image obtained with 440 nm illumination and filtering above 850 nm (Figure 10c).
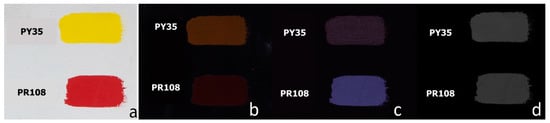
Figure 10.
(a) Visible image of painting layers on canvas containing cadmium yellow PY35 and cadmium red PR108 in linseed oil; (b) UVF image; (c) VIVF image with λexc 530 nm, λacq > 720 nm; (d) VIL image obtained by 440 nm excitation light.
3.4. Case Study: the Painting “Addetta Near Zoate” by Giuseppe Faraone (2011)
This oil painting on panel (Figure 11a) displays a wide chromatic range, suggesting the use of several different pigments possibly also in mixture.
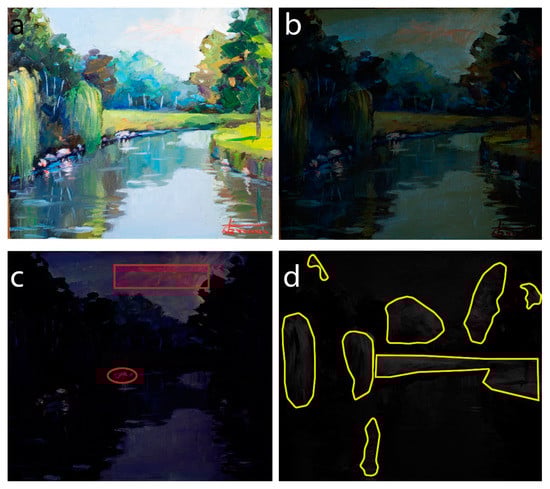
Figure 11.
(a) Visible image of the painting “Addetta near Zoate” (G. Faraone, 2011); (b) UVF image; (c) VIVF image (exc 440 nm); (d) VIL image (exc 440 nm).
In previous studies on the same painting, performed by Raman spectroscopy, visible reflectance, and visible-induced spectrofluorimetry [26,38], it was possible to identify: phthalocyanine PB15:1 and ultramarine PB29 as blue pigments; phthalocyanine PG7 and nitroso green PG8 in green areas, together with cadmium yellow PY35 in yellowish green details; dioxazine PV23 for violet flowers and in mixture with ultramarine in dark blue shadows; benzimidazolone orange PO60 for red flowers and for the artist’s signature; and, finally, perinone orange PO43 in pink details of the clouds.
In the present work, the spectrofluorimetric analysis upon UV excitation did not allow the observation of any emission for blue, green, and violet pigments, as expected (see above), while for the red details, the spectrum showed a maximum around 600 nm, similarly to what was observed with visible excitation [26]. A peculiar result was obtained for the pink details in clouds. As shown in Figure 12, the emission spectrum excited at 435 nm is dominated by an intense and broad band centred approximately around 615 nm, which could be assigned in the previous study to PO43, while the pattern obtained with 365 nm excitation is quite different. In fact, besides the emission at about 510 nm due to the oil binder (see Figure 8), a second band is observed around 565 nm, suggesting the presence also of a yellow pigment, possibly PY139 (see above). UV excitation seems therefore to favour the response of the isoindoline yellow in comparison with the perinone orange, whose fluorescence instead prevails with visible excitation. Quite interestingly, commercial artists paints based on a mixture of the two pigments are indeed available [39].
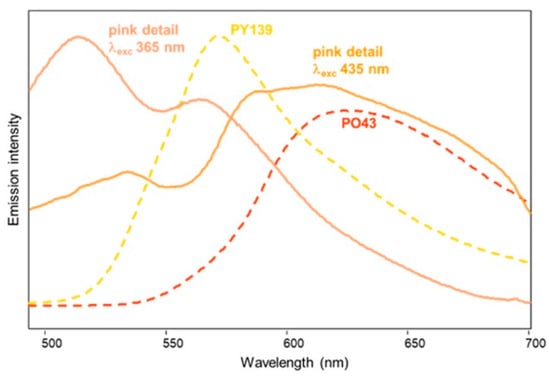
Figure 12.
Emission spectra of the pink hue of the clouds in the painting “Addetta near Zoate” by G. Faraone with excitation at 365 and 435 nm (solid lines), and of painting samples of PY139 and PO43 with linseed oil (dashed lines) shown for comparison.
The imaging analysis, when illuminating at 440 nm and filtering from 480 nm, showed a marked red fluorescence in the detail of the clouds (and also in the middle part of the canal bank) (Figure 11c, red sections), in agreement with the presence of PO43. Instead, the contribution of PY139 is more difficult to distinguish in the image obtained by illuminating at 365 nm, due to the significant emission of the oil binder (Figure 11b). Finally, in the image resulting from illumination at 440 nm and filtering above 850 nm, the presence of cadmium yellow PY35, confirmed by spectroscopic analyses [26], is well evident in the lighter areas of the lawn and the willows, as well in the shadow of the right willow on water (Figure 11d, yellow sections).
4. Conclusions
In the present work, the applicability of imaging methods, integrated or combined with the collection of UV-induced emission spectra, to materials of contemporary art, in particular synthetic organic pigments, was explored on mock-up painting samples. It could thus be demonstrated that some pigments, widespread in contemporary artists’ colours, are characterised by a particularly strong emission, allowing for their observation in the corresponding UVF images. This is the case of quinacridone magenta and violet PR122 and PV19, β-naphthol reds PR3 and PR57:1, perinone orange PO43, isoindole yellow pigments PY139 and PY110, and diarylide yellow PY83. On the contrary, within the series of colouring compounds here examined by imaging techniques, it was not possible to observe pigments belonging to the families of naphthol AS reds, benzimidazolone orange and yellow, and acetoacetic arylide yellows. Nevertheless, a direct relationship between the molecular structure of a pigment and the possibility of detecting it in a painting layer thanks to its luminescence emission can be established only cautiously, as it is well known that the packing effects can sometimes quench in the solid state the fluorescence exhibited in solution by molecules with similar structures [40]. A wider number of pigments representing each class should be investigated in perspective to verify such relationship. As regards blue and green pigments, most of them, in particular phthalocyanine ones, could not be detected in the images as expected due to their lack of fluorescence emission presumably associated, at least for copper phthalocyanines, to the quenching effect of the paramagnetic transition metal ion [35].
Moreover, the effects of the concentration of the pigments in the painting samples and of the contribution of binders were considered. The former involves that, because of the self-absorption phenomenon, the emission of luminescent pigments upon visible excitation tends to be stronger for more diluted layers, at least for painting samples where the concentration of the emitter is appreciable; on the other hand, upon UV excitation, the image of a more diluted layer can appear brighter also due to a higher proportion of the binder. Indeed, it was also evidenced that the binders, especially oil, exhibit their own fluorescence emission, which adds up to that of the colouring molecules. In this respect, the possible advantage of using VIVF images was also considered, resulting in a reduced contribution of the binder (especially in the case of oil) to the observed luminescence. The multi-wavelength approach proved to be powerful to highlight the luminescence due to the analyte in comparison with that of the binder. The usefulness of VIL (or VIL with a proper combination of filters) for the detection of cadmium-based pigments, among the most important inorganic colouring substances in contemporary art, was also confirmed. The investigation of a recent oil painting on panel by the landscape painter G. Faraone was proposed as proof of concept of the application of the imaging methods combined with spectrofluorimetric analyses, allowing in particular for the identification of perinone orange PO43 (in mixture with isoindoline yellow PY139) and of cadmium yellow PY35.
In this way, the effectiveness of the integrated approach based on imaging and spectrofluorimetry was evidenced. Indeed, imaging techniques are useful to select the areas of a painting to be examined by further point spectroscopic analyses. On the other hand, besides allowing a more specific interpretation of imaging results, spectrofluorimetric analyses integrate such results for those pigments that are only weakly fluorescent and are not detected by imaging due to the limited sensitivity of the technique. Therefore, the proposed approach can contribute to the identification of colouring materials in a contemporary painting, complementing other more specific, but not always applicable, spectroscopic techniques.
Author Contributions
Conceptualization, M.G. and S.B.; methodology, M.G. and S.B.; formal analysis, M.G., S.B. and M.L.; investigation, M.G., M.L. and A.B.; resources, M.G. and S.B.; data curation, M.G., M.L., A.B. and S.B.; writing—original draft preparation M.G., S.B. and M.L.; writing—review and editing, M.G., S.B. and M.L.; visualization, M.G., S.B. and M.L.; supervision, M.G. and S.B. All authors have read and agreed to the published version of the manuscript.
Funding
This research received no external funding.
Institutional Review Board Statement
Not applicable.
Informed Consent Statement
Not applicable.
Data Availability Statement
Not applicable.
Conflicts of Interest
The authors declare no conflict of interest.
References
- Rorimer, J.J. Ultra-Violet Rays and Their Use in the Examination of Works of Art; Metropolitan Museum of Art: New York, NY, USA, 1931. [Google Scholar]
- Lyon, R.A. Ultra-Violet Rays as Aids to Restorers, Technical Studies in the Fields of Fine Arts 2; William Hayes Fogg Art Museum: Cambridge, UK, 1934. [Google Scholar]
- Winefordner, J.D. Practical Fluorescence: Theory, Methods, and Techniques; Marcel Dekker: New York, NY, USA, 1974. [Google Scholar]
- Holliday, C. The Application of Ultra-Violet Light Photography to Prehistoric Rock Art. SAMAB 1961, 7, 179–184. [Google Scholar]
- Van Asperen de Boer, J.R.J. An Introduction to the Scientific Examination of Paintings. Ned. Kunsthist. Jaarb. Neth. Yearb. Hist. Art 1975, 26, 1–40. [Google Scholar] [CrossRef]
- De la Rie, E.R. Fluorescence of paint and varnish layers (part I). Stud. Conserv. 1982, 27, 1–7. [Google Scholar]
- Larson, L.J.; Shin, K.S.K.; Zink, J.I. Photoluminescence spectroscopy of natural resins and organic binding media of paintings. J. Am. Inst. Conserv. 1991, 30, 89–104. [Google Scholar] [CrossRef]
- Mairinger, F. The Ultraviolet and Fluorescence Study of Paintings and Manuscripts. In Radiation in Art and Archeometry; Elsevier: Amsterdam, The Netherlands, 2000; pp. 56–75. ISBN 978-0-444-50487-6. [Google Scholar]
- Pelagotti, A.; Pezzati, L.; Bevilacqua, N.; Vascotto, V.; Reillon, V.; Daffara, C. A Study of UV Fluorescence Emission of Painting Materials. In Proceedings of the Art 5–8th International Conference on Non-Destructive Investigations and Microanalysis for the Diagnostics and Conservation of the Cultural and Environmental Heritage, Lecce, Italy, 15–19 May 2005; p. 97. [Google Scholar]
- Verri, G.; Comelli, D.; Cather, S.; Saunders, D.; Piqué, F. Post-Capture Data Analysis as an Aid to the Interpretation of Ultraviolet-Induced Fluorescence Images; Stork, D.G., Coddington, J., Eds.; International Society for Optics and Photonics: San Jose, CA, USA, 2008; p. 681002. [Google Scholar]
- Comelli, D.; Artesani, A.; Nevin, A.; Mosca, S.; Gonzalez, V.; Eveno, M.; Valentini, G. Time-Resolved Photoluminescence Microscopy for the Analysis of Semiconductor-Based Paint Layers. J. Mater. 2017, 10, 1335. [Google Scholar] [CrossRef] [Green Version]
- Davies, A. Digital Ultraviolet and Infrared Photography, 1st ed.; Routledge: New York, NY, USA, 2017; ISBN 978-1-315-51509-0. [Google Scholar]
- Fuster López, L.; Stols-Witlox, M.; Picollo, M. UV-Vis Luminescence Imaging Techniques/Técnicas de Imagen de Luminiscencia UV-Vis; Editorial Universitat Politècnica de València: Valencia, Spain, 2019; ISBN 978-84-9048-828-7. [Google Scholar]
- Ludwig, N.; Orsilli, J.; Bonizzoni, L.; Gargano, M. UV-IR Image Enhancement for Mapping Restorations Applied on an Egyptian Coffin of the XXI Dynasty. Archaeol. Anthropol. Sci. 2019, 11, 6841–6850. [Google Scholar] [CrossRef]
- Bridgman, C.F.; Gibson, H.L. Infrared Luminescence in the Photographic Examination of Paintings and Other Art Objects. Stud. Conserv. 1963, 8, 77. [Google Scholar] [CrossRef]
- Thoury, M.; Delaney, J.K.; de la Rie, E.R.; Palmer, M.; Morales, K.; Krueger, J. Near-infrared luminescence of cadmium pigments: In situ identification and mapping in paintings. Appl. Spectrosc. 2011, 65, 939–951. [Google Scholar] [CrossRef]
- Verri, G. The Application of Visible-Induced Luminescence Imaging to the Examination of Museum Objects; Pezzati, L., Salinbeni, R., Eds.; SPIE: Munich, Germany, 2009; p. 739105. [Google Scholar]
- Verri, G. The spatially resolved characterisation of Egyptian blue, Han blue and Han purple by photo-induced luminescence digital imaging. Anal. Bioanal. Chem. 2009, 394, 1011–1021. [Google Scholar] [CrossRef]
- Kakoulli, I.; Radpour, R.; Lin, Y.; Svoboda, M.; Fischer, C. Application of forensic photography for the detection and mapping of Egyptian blue and madder lake in Hellenistic polychrome terracottas based on their photophysical properties. Dye. Pigment. 2017, 136, 104–115. [Google Scholar] [CrossRef]
- Dyer, J.; Verri, G.; Cupitt, J. Multispectral Imaging in Reflectance and Photo-induced Luminescence Modes: A User Manual; British Museum: London, UK, 2013. [Google Scholar]
- Dyer, J.; Sotiropoulou, S. A technical step forward in the integration of visible-induced luminescence imaging methods for the study of ancient polychromy. Herit. Sci. 2017, 5, 1–21. [Google Scholar] [CrossRef] [Green Version]
- Cosentino, A. Practical notes on ultraviolet technical photography for art examination. J. Conserv. Património 2015, 21, 53–62. [Google Scholar] [CrossRef] [Green Version]
- Dyer, A.G.; Muir, L.; Muntz, W. A Calibrated Gray Scale for Forensic Ultraviolet Photography. J. Forensic Sci. 2004, 49, JFS20034103. [Google Scholar] [CrossRef]
- Geffert, S.; Loike, A.; Ruiz-Molina, M.; Serotta, A. A Workflow for Color and Tone Calibrated Multiband Imaging. In Proceedings of the Presentation at the American Institute for Conservation 46th Annual Meeting, Material Matters, Houston, TX, USA, 29 May–2 June 2018. [Google Scholar]
- UV Innovations: Ultraviolet Photography Standards. Available online: http://www.uvinnovations.com/ (accessed on 2 December 2021).
- Longoni, M.; Freschi, A.; Cicala, N.; Bruni, S. Non-invasive identification of synthetic organic pigments in contemporary art paints by visible–excited spectrofluorimetry and visible reflectance spectroscopy. Spectrochim. Acta A 2020, 229, 117907. [Google Scholar] [CrossRef]
- Lomax, S.Q.; Learner, T. A Review of the Classes, Structures, and Methods of Analysis of Synthetic Organic Pigments. J. Am. Inst. Conserv. 2006, 45, 107–125. [Google Scholar] [CrossRef]
- Scherrer, N.C.; Zumbuehl, S.; Delavy, F.; Fritsch, A.; Kuehnen, R. Synthetic organic pigments of the 20th and 21st century relevant to artist’s paints: Raman spectra reference collection. J. Raman Spectrosc. 2009, 73, 505–524. [Google Scholar] [CrossRef]
- Brostoff, L.B.; Centeno, S.A.; Ropret, P.; Bythrow, P.; Pottier, F. Combined X-ray Diffraction and Raman Identification of Synthetic Organic Pigments in Works of Art: From Powder Samples to Artists Paints. Anal. Chem. 2009, 81, 6096–6106. [Google Scholar] [CrossRef]
- Sundberg, B.N.; Pause, R.; van der Werf, I.D.; Astefanei, A.; van den Berg, K.J.; van Bommel, M.R. Analytical approaches for the characterization of early synthetic organic pigments for artists’ paints. Microchem. J. 2021, 170, 106708. [Google Scholar] [CrossRef]
- Fardi, T.; Pintus, V.; Kampasakali, E.; Pavlidou, E.; Schreiner, M.; Kyriacou, G. Analytical characterization of artist’s paint systems based on emulsion polymers and synthetic organic pigments. J. Anal. Appl. Pyrol. 2018, 135, 231–241. [Google Scholar] [CrossRef]
- Menke, C.A.; Rivenc, R.; Learner, T. The use of direct temperature-resolved mass spectrometry (DTMS) in the detection of organic pigments found in acrylic paints used by Sam Francis. Int. J. Mass Spectrom. 2009, 284, 2–11. [Google Scholar] [CrossRef]
- Lomax, S.Q.; Lomax, J.F.; De Luca-Westrate, A. The use of Raman microscopy and laser desorption ionization mass spectrometry in the examination of synthetic organic pigments in modern works of art. J. Raman Spectrosc. 2014, 45, 448–455. [Google Scholar] [CrossRef]
- Krmpotić, M.; Jembrih-Simbürger, D.; Siketić, Z.; Marković, N.; Anghelone, M.; Tadić, T.; Plavcčić, D.; Malloy, M.; Bogdanović Radović, I. Identification of Synthetic Organic Pigments (SOPs) Used in Modern Artist’s Paints with Secondary Ion Mass Spectrometry with MeV Ions. Anal. Chem. 2020, 92, 9287–9294. [Google Scholar] [CrossRef]
- Skoog, D.A.; Holler, F.J.; Crouch, S.R. Principles of Instrumental Analysis, 7th ed.; Cengage: Boston, MA, USA, 2018; p. 369. [Google Scholar]
- Rosi, F.; Grazia, C.; Gabrieli, C.; Romani, A.; Paolantoni, M.; Vivani, R.; Brunetti, B.G.; Colomban, P.; Miliani, C. UV–Vis-NIR and micro-Raman spectroscopies for the nondestructive identification of Cd1−xZnxS solid solutions in cadmium yellow pigments. Microchem. J. 2016, 124, 856–867. [Google Scholar] [CrossRef]
- Gil, M.; Costa, M.; Cardoso, A.; Valadas, S.; Helvaci, Y.; Bhattacharya, S.; Moita, P.; Candeias, A. On the Two Working Palettes of Almada Negreiros at DN Building in Lisbon (1939–1940): First Analytical Approach and Insight on the Use of Cd Based Pigments. Heritage 2021, 4, 4578–4595. [Google Scholar] [CrossRef]
- Bruni, S.; Guglielmi, V. Raman Spectroscopy for the Identification of Materials in Contemporary Painting. In Raman Spectroscopy in Archaeology and Art History; Vandenabeele, P., Edwards, H., Eds.; The Royal Society of Chemistry: London, UK, 2019; pp. 167–170. [Google Scholar]
- Oil—classico 106—Naples Yellow Reddish. Available online: https://www.maimeri.it/en/products/oil/classico/naples-yellow-reddish-0324106.html (accessed on 3 December 2021).
- Langhals, H.; Potrawa, T.; Noth, H.; Linti, G. The Influence of Packing Effects on the Solid-state Fluorescence of Diketopyrrolopyrroles. Angew. Chem. Int. Ed. Engl. 1989, 28, 478–480. [Google Scholar] [CrossRef]


Publisher’s Note: MDPI stays neutral with regard to jurisdictional claims in published maps and institutional affiliations. |
© 2021 by the authors. Licensee MDPI, Basel, Switzerland. This article is an open access article distributed under the terms and conditions of the Creative Commons Attribution (CC BY) license (https://creativecommons.org/licenses/by/4.0/).