Article

Liquid CO2 Phase-Transition Rock Fracturing: A Novel Technology for Safe Rock Excavation

1
Key Laboratory of Transport Industry of Road Structure and Material, Research Institute of Highway Ministry of Transport, Beijing 100088, China
2
Key Laboratory of Shale Gas and Geoengineering, Institute of Geology and Geophysics, Chinese Academy of Sciences, Beijing 100029, China
3
Institutions of Earth Science, Chinese Academy of Sciences, Beijing 100029, China
4
College of Earth and Planetary Sciences, University of Chinese Academy of Sciences, Beijing 100049, China
5
Land and Resources Exploration Center, Hebei Bureau of Geology and Mineral Resources Exploration, Shijiazhuang 050081, China
*
Author to whom correspondence should be addressed.
Appl. Sci. 2022, 12(1), 68; https://doi.org/10.3390/app12010068
Submission received: 15 October 2021 / Revised: 13 December 2021 / Accepted: 15 December 2021 / Published: 22 December 2021

Abstract

:
In order to determine the applicability of liquid CO2 phase-transition fracturing technology in rock mass excavations, the principles of CO2 phase-transition fracturing were analyzed, and field tests of liquid CO2 phase-transition fracturing were performed. An “Unmanned Aerial Vehicle (UAV) camera shooting + Microstructure Image Processing System (MIPS) analyzing” method was used to acquire the rock mass characteristics. Further, the Hilbert–Huang Transform (HHT) energy analysis principle was adopted to analyze the characteristics of fracturing vibration waves. The experimental results showed that during the process of fracturing, there were both dynamic actions of rock breakage due to excitation stress wave impacts, and quasi-static actions of rock breakage caused by gasification expansion wedges. In semi-infinite spaces, rock-breakage zones can mainly be divided into crushing zones, fracture zones, and vibration zones. At the same time, under ideal fracturing effects and large volumes, the fracturing granularity will be in accordance with the fractal laws. For example, the larger the fractal dimensions, the higher the proportion of small fragments, and vice versa. Moreover, the vibration waves of the liquid CO2 phase-transition fracturing have short durations, fast attenuation, and fewer high-frequency components. The dominant frequency band of energy will range between 0 and 20 Hz. The liquid CO2 phase-transition fracturing technology has been observed to overcome the shortcomings of traditional explosive blasting methods and can be applied to a variety of rock types. It is a safe and efficient method for rock-breaking excavations; therefore, the above technology effectively provides a new method for the follow-up of similar engineering practices.

1. Introduction

At the present time, the excavations of rock masses under general conditions are still mainly dependent on explosive blasting methods; however, due to the high safety risks and severe environmental impacts of explosive blasting, the management, and control of such explosives have become much stricter [1]. This has resulted in the reduced application feasibility of explosive blasting methods. Particularly, in many special environments, such as the implementation of excavations in densely populated areas or buildings, vibration-sensitive areas, and so on, conventional blasting methods cannot be safely applied [2]. As a result, safe and reliable non-blasting excavation methods have attracted increasing attention and have begun to be applied in rock excavation projects. Since the 1970s, researchers have carried out many relevant studies regarding non-blasting excavation methods [3,4]. These methods can be mainly divided into three categories: Mechanical excavations, physical and chemical rock-breaking processes, and rock-breaking processes using electrical equipment [4]. The most commonly used mechanical excavation methods involve hydraulic breakers and road-headers, which have the advantages of high safety performance results, strong environmental protection, and simple operations; therefore, mechanical excavation methods are considered to be suitable for the excavations of some types of soft rock masses; however, mechanical wear and tear are unavoidable [5,6]. Further, it has been found that the above equipment cannot be applied in a large-scale project due to low work efficiency and slow construction progress. When electrical equipment excavation methods are used, it has been observed that there is less rock breakage; however, the effects of electrical equipment methods are only significant for hard rock masses, and the economic costs are high [5,6,7]. Physical and chemical work methods often utilize static cracking agents or metal burning agents [8,9]. The use of such agents involves both physical and chemical reactions and presents certain potential environmental and safety hazards. Liquid CO2 phase-transition fracturing technology is a new type of “physical and chemical” technology for rock mass excavations which falls into the category of physical blasting technology. This newly introduced technology has been found to have the ability to overcome the shortcomings of non-blasting excavation methods and traditional explosive blasting methods, and it has been observed that the energy utilization rates tend to be noticeably improved [10]. Moreover, the method’s applications require no open fires, and are characterized by high safety, small vibrations, and low dust [11]; therefore, the potential of damages occurring to surrounding buildings, rock masses, and environments is greatly reduced. Due to these positive features of liquid CO2 phase-transition fracturing technology, it can be widely used in rock mass excavations.
Liquid CO2 phase-transition fracturing technology was first proposed by Cardox Co. (United Kingdom) [12,13]. It was first mainly used in the fracturing, permeability enhancement, and mining of low-permeability and high-gas coal seams, in order to reduce the risks of coal dust and gas explosions [1,14]. With the development of liquid CO2 fracturing technology and its proven enhancements of energy release processes, the applications of the technology were extended to ore mining and concrete cracking projects [15]. At the present time, researchers generally believe that CO2 fracturing is a process of physical change. The energy that is released by the expansion of gases during physical explosions is mainly related to the gas pressure levels, container volumes, and the physical properties of the medium within the containers [16]. Singh SP, Zhou Xihua et al. [17,18] conducted studies of the fracturing mechanism of CO2 fracturing in coal seams. The results showed that the PCF (Penetrating Cone Fracture) principle could be used to analyze the high-pressure CO2 fracturing performances. In other words, it was found that tension stress fields were formed when high pressure was applied at the bottom of boreholes. Meanwhile, annular fractures were formed due to the stress concentrations in rock masses, which had then tended to develop toward the free surfaces. Finally, conical fractures had formed in the rock, which had achieved the purpose of fracturing the rock masses [14,17,19,20].
In recent years, the technology has been gradually popularized in developed countries, and is now widely used in cement, electric power, and other industries, such as pipeline blockage removal, caking removal, ice breaking, and so on [17,21]; however, there are still a series of problems: 1, Its engineering practices and scientific research have mainly focused on gas-type coal mining; 2, there are few application studies in surface rock excavation; 3, research on the impact of cracking effect is lack; 4, there is little research on the impact of adjacent buildings.
Therefore, in the current study, based on the analysis of the principle of liquid CO2 phase-transition fracturing, field tests and vibration monitoring were carried out in a foundation pit excavation project located in Fangshan District, Beijing, China. The fracturing effects, granular distributions, particle velocities, and vibration energy levels following fracturing excavations were scientifically analyzed. The feasibility of liquid CO2 phase-transition fracturing technology in the foundation pit excavations had been successfully demonstrated in this study, which will potentially facilitate its popularization and future applications.

2. Liquid CO2 Phase-Transition Rock Fracturing

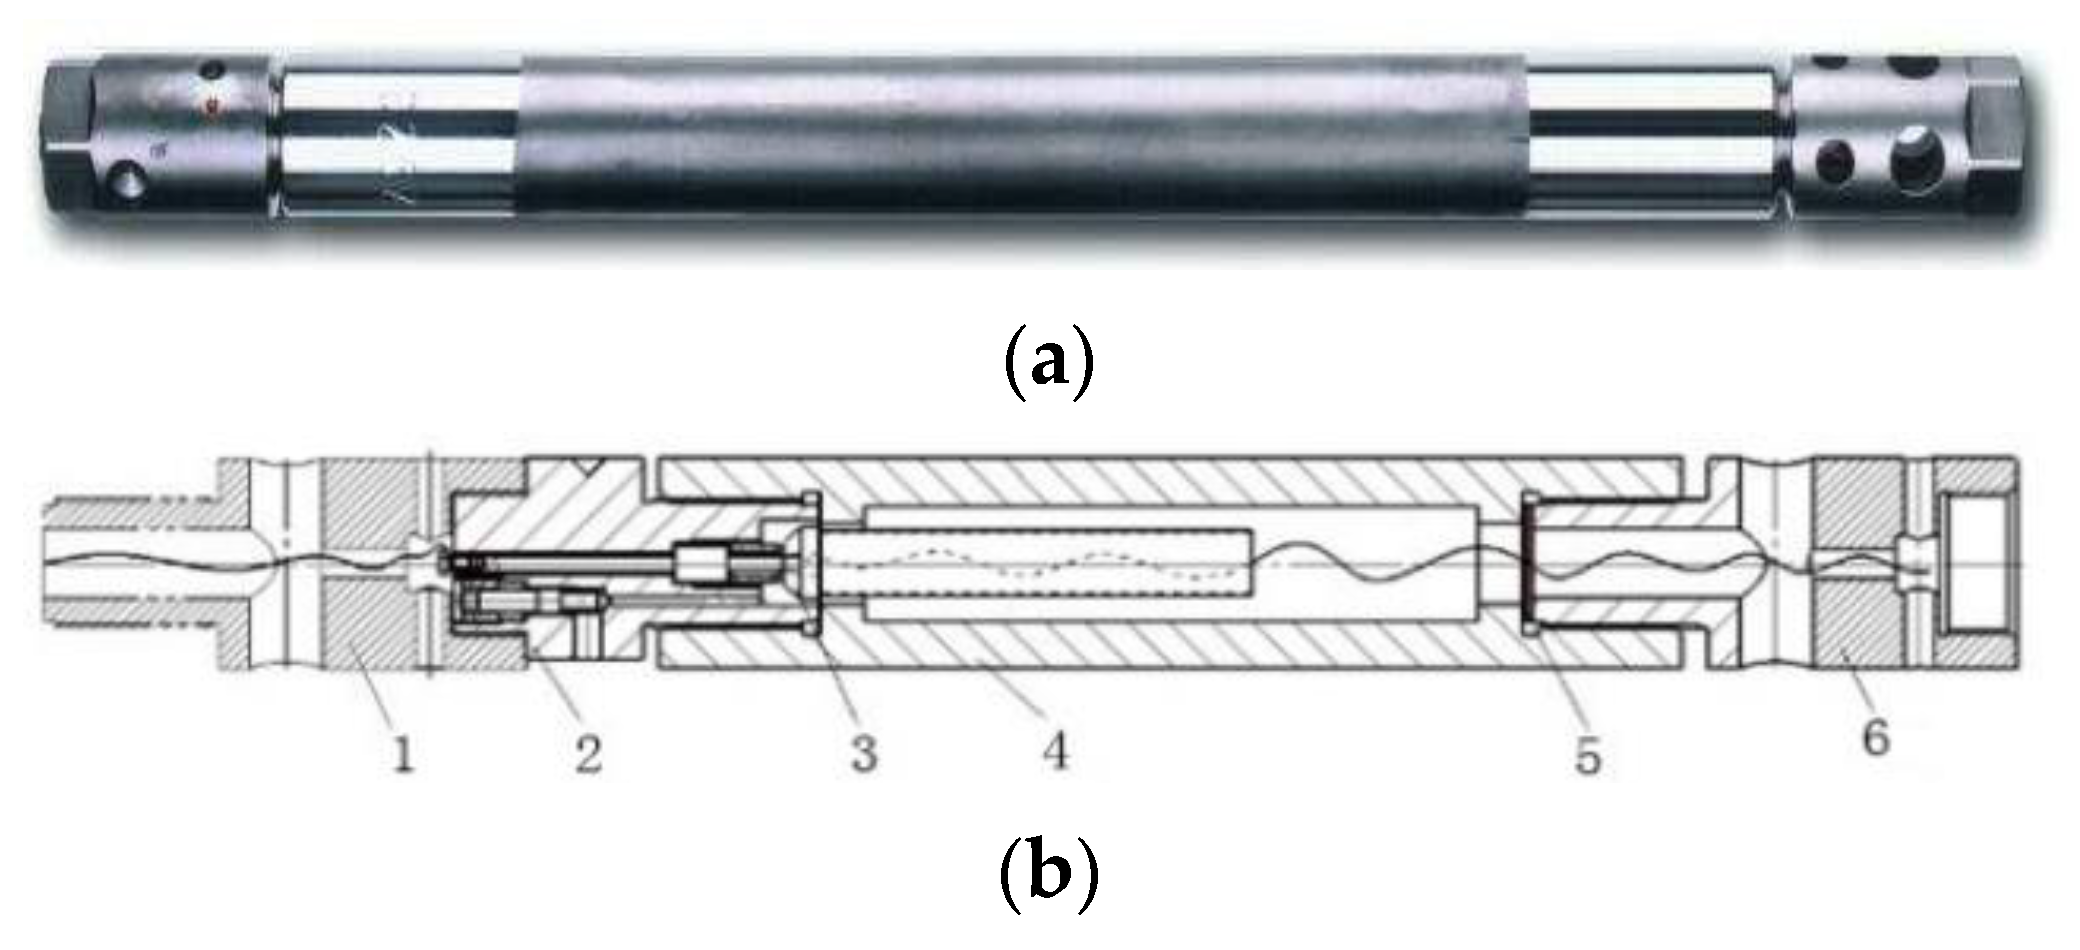
2.1. CO2 Phase-Transition Fracturing Device

In the present study, the CO2 fracturing device was mainly composed of a riser, firing head, heater, fracturing tube, constant pressure shear sheet, and energy releaser [22]. The physical structure is shown in Figure 1. The riser is used for putting the fracturing pipe into the borehole. The firing head serves as a valve for filling and sealing liquid CO2 in the tube. The fracturing tube is used for filling liquid carbon dioxide (CO2) of 0.5–2 kg depending on the application purpose. Further, the heater is sealed in the tube for heating, which is turning liquid CO2 into supercritical carbon dioxide (SC-CO2) rapidly. The constant pressure shear sheet has controlled the fracturing pressure varying from 60 to 270 Mpa depending on rock mass mechanical properties. The energy releaser on the end of the tube blows out high-pressure SC-CO2 breaking the rock mass.

2.2. Principle of the CO2 Phase-Transition Fracturing

The core of CO2 phase-transition fracturing technology is the liquid–gas conversion of CO2. It is essentially a typical physical blasting technology. During the fracturing operations, liquid CO2 is injected into the tube using special filling equipment, and the gas pressure is maintained at between 8 and 10 MPa. The heater has been made to generate large amounts of heat, and the liquid CO2 in the tubes enters a supercritical state. Supercritical CO2 is a special phase state. Its molecular diffusion coefficient is large and close to a gas and has a high density, which is close to the fluid density. When the pressure is higher than 7.38 MPa, and the temperature is higher than 31.4 °C, the CO2 will be transformed into a supercritical state [24]. The phase transition process of the CO2 is shown in Figure 2. At that time, the pressure levels in the pipes will rise sharply. When the pressure reaches the ultimate strength of the constant pressure shear sheets, the SC-CO2 will break through the constant pressure shear sheets and be released from the energy releasers (Figure 3). High-pressure jets act on the rock masses and generate stress waves with energy levels far greater than the dynamic compressive strength of the rock mass. As a result, crushed areas of compressive damages will be produced around the boreholes, and the rock mass in the far areas will produce radial fracturing and tangential tension cracks. At the same time, the pressure will gradually decrease, and the outer boundaries of SC-CO2 jets will become gasified. The volume will rapidly expand by 500 to 600 times. Then, under the effects of the gas wedges, the cracks will continue to expand until the stress intensity factors at the crack tips become less than the fracture toughness of the rock. During the entire fracturing process, the stress wave action times will be very short. Meanwhile, the gas CO2 action times will be longer and reach up to 10 to 30 ms, which will result in the cracks becoming fully expanded, extended, and penetrated within the rock masses [14,16,25,26].
Generally speaking, the entire liquid CO2 phase-transition fracturing process mainly includes two stages: the dynamic actions of the stress waves, and the quasi-static actions of the gas expansion. The stress wave actions mainly form the micro-cracks in the crushed zone, and the gas expansion actions are the main driving forces for the radial and circumferential cracks in the fracture zones. The results of this study’s experiments are shown in Figure 4. It is not difficult to conclude from the figure that the CO2 rock-breaking processes were a combination of tensile failures and compressive failures.

2.3. Advantages of CO2 Phase-Transition Fracturing

At the present time and under general conditions, rock excavations are still mainly dependent on controlled blasting methods, which have the clear advantages of high efficiency, good rock breakage effects, and low cost; however, explosive blasting methods also have high safety risks and strict control requirements. Blasting excavations are strictly prohibited in many special environments, such as areas with dense populations or buildings, vibration-sensitive areas, and so on. The conventionally used non-explosive rock-breaking methods, such as mechanical rock-drilling, hydraulic splitting, and static breaking agents, have been found to have low excavation efficiency and difficulties meeting the needs of the low cost and time limitations in engineering projects. However, it has been found that liquid CO2 phase-transition fracturing excavation methods have overcome the defects of explosive blasting methods, and have displayed the following major advantages:
(1)
High safety and reliable operations
The fracturing pipes which are used in liquid CO2 phase-transition fracturing excavation methods are made of high-strength heat-resistant steel alloy, which can withstand high-pressure conditions without plastic deformations. Furthermore, since CO2 is a non-explosive gas, accidental explosions and combustion can be inhibited. The process of CO2 fracturing and blasting is a physical process that does not involve sparks or open flames. Further, there is less risk from dust and flying stones, and no destructive vibrations or harmful gases are produced.
(2)
Controllable fracturing energy
When liquid CO2 phase-transition fracturing excavation methods are used, the sizes and directions of the fracturing energy release actions can be controlled by shearing sheets and energy release heads. Medium-deep hole fracturing can be realized by a series of connections, and combined fracturing can be realized simultaneously by parallel connections.
(3)
Reusable main parts
After a CO2 fracturing device is put into operations, other parts can be reused thousands of times, with the exception of the heating devices, constant pressure shear pieces, and sealing gaskets. The sources of liquid CO2 are widespread, and the prices are considered to be low; therefore, the overall economic benefits are considerable.
(4)
Relatively low safety control levels
At the present time, there are no special regulations for the management and regulation of liquid CO2 phase-transition fracturing excavation methods, and the control requirements only refer to the fireworks safety approval and safety standards for trial implementation.

3. Field Test Study on Liquid CO2 Phase-Transition Rock Fracturing

3.1. Study Area

This study’s field test relied on a foundation pit excavation project of a resettlement house in the Fangshan District of Beijing in China (Figure 5). The terrain of the study area was relatively flat with exposed bedrock. Further, the formation lithology was relatively single, and had mainly included Ordovician Majiagou Formation limestone, dolomitic limestone, and so on. The stratum had inclined southward with a dip angle of approximately 30°. The study area had displayed either no or slight weathering, and the rock mass was observed to be relatively complete with a Grade III rock quality rating.
The study area was located in a scenic sports and residential area. In order to protect the natural landscape and ensure the safety of the existing houses and roads, explosives were not permitted to be used in the excavation of foundation pits; therefore, as a supplementary and local alternative method, liquid CO2 phase-transition fracturing technology, with its known high safety, good fracturing effects, and excavation efficiency, was the first choice for the excavations under the study area’s complex working and special environmental conditions.

3.2. Test Program

Different types (Types 95 and 108) and different numbers of fracturing tubes (equipment parameters and hole arrangement parameters are shown in Table 1 and Table 2) were used in this study’s fracturing tests. At the same time, a “UAV camera shooting + MIPS image processing” method was used to acquire the characteristics of the fractured rock blocks, and a Blast-UM type blasting vibrometer was utilized to monitor the vibrations caused by fracturing.
Throughout the entire field-testing process, the first step was to drill a blast-hole. Then, the fracturing device was assembled and filled with the liquid CO2. The installed cleaver was placed into the borehole. At the same time, a blasting vibrometer was connected in order to test the seismic waves during the blasting process. The UAV began to acquire images of the pre-cracking in the rock mass. Then, after the aforementioned preparation work was completed, the detonation switch was turned for the purpose of performing the blasting. Following the completion of the blasting, the UAV was again used to document the post-blasting cracking images. Further, the before and after images were compared and analyzed in order to comprehensively evaluate the cracking effects. Finally, the split tube was recovered. During the testing processes, special attention was paid to the filling operation after the blast-holes were drilled. The drill cuttings and dry fine stone powder were generally used as the filling materials in order to prevent “flying pipe” actions.

3.3. Fracturing Effects

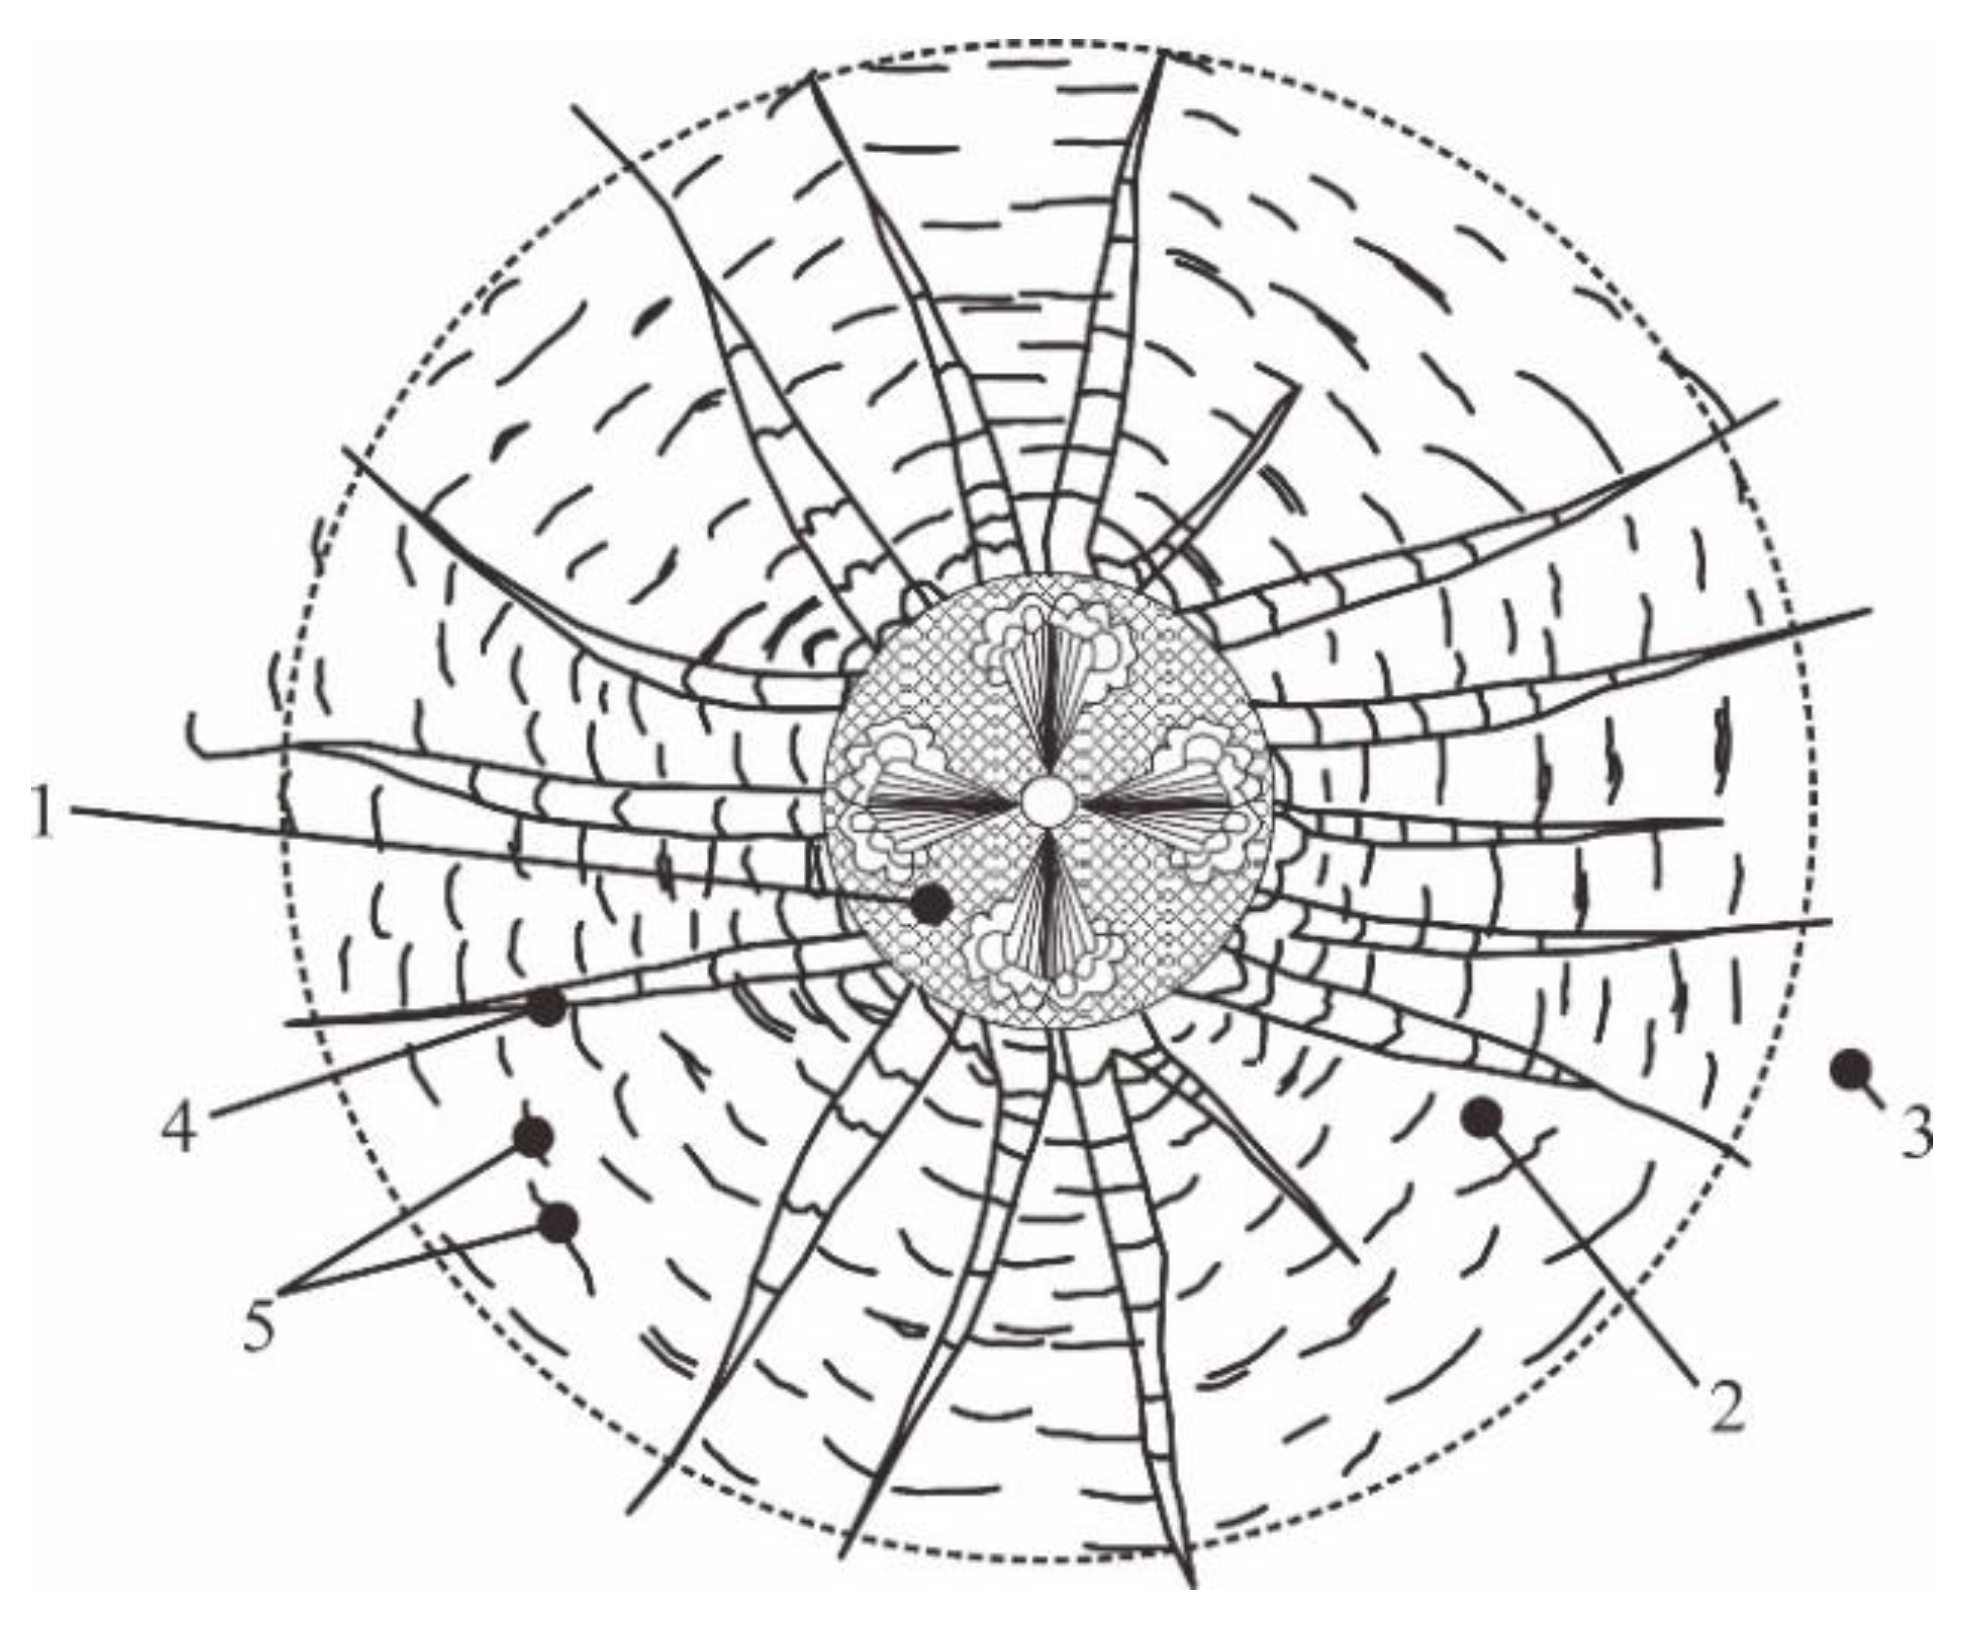
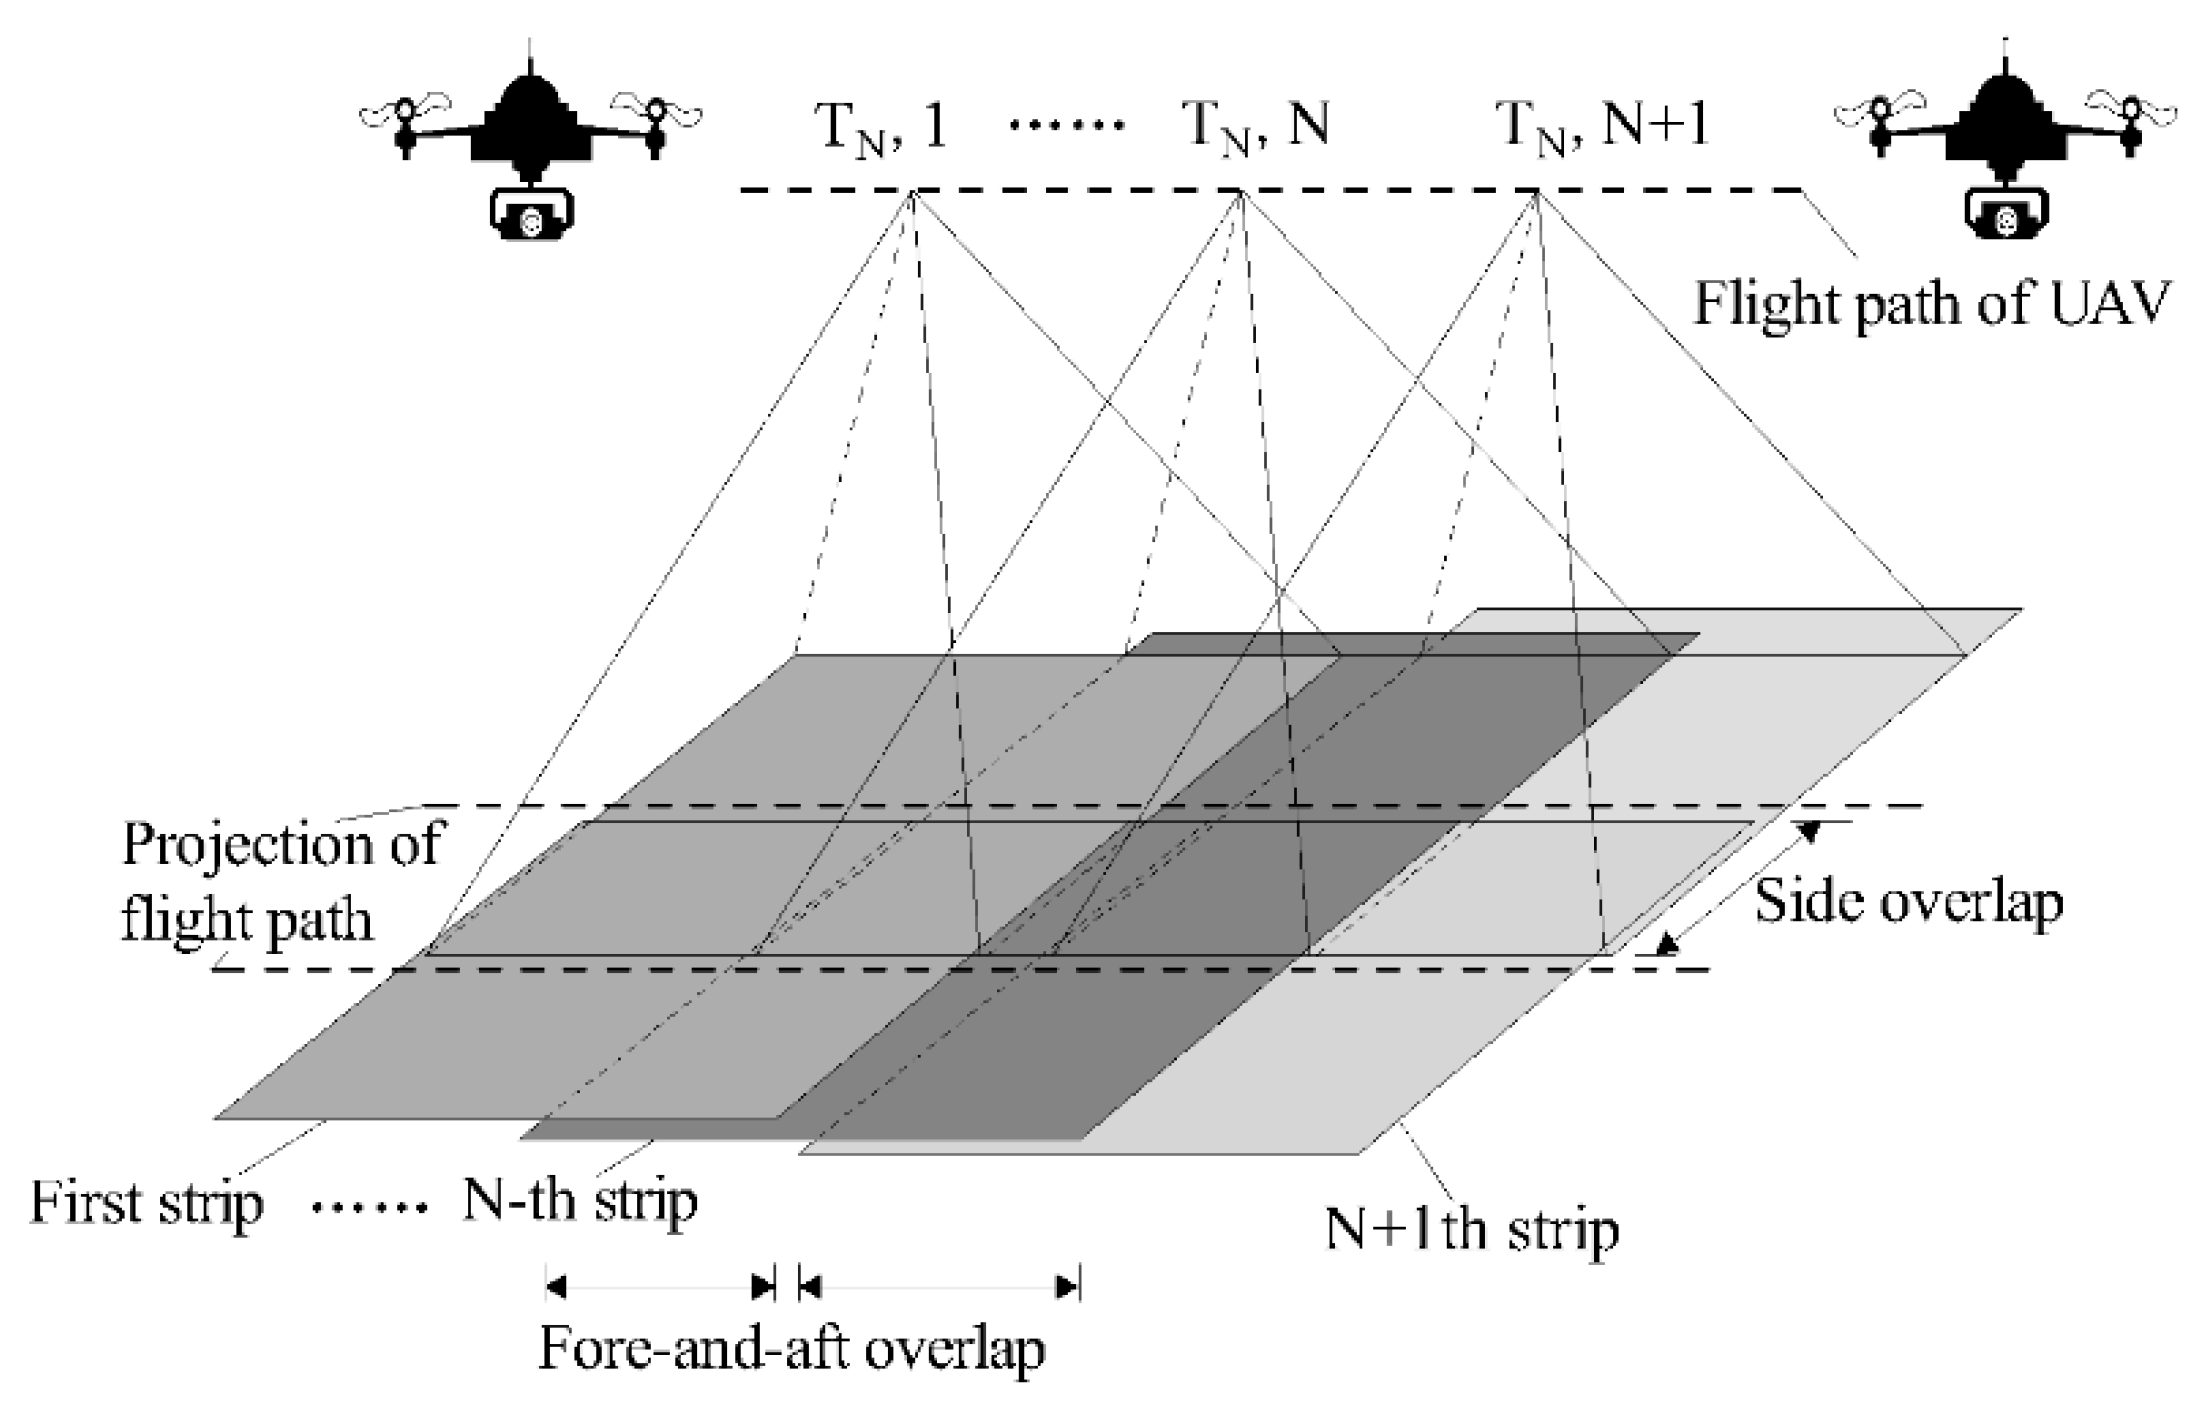
3.3.1. Acquisition of the Feature Information of the Rock Masses after Fracturing

In this research, a “UAV camera shooting+image processing” method was used for the fast acquisition of the granular information. The small UAV cameras were flexible and visually controllable, could be combined with self-developed image processing software to acquire the granular information more accurately and comprehensively. The small UAV, which was used in this experiment was “DJI Phantom 4”. The main technical parameters of the UAV used in this experiment were as follows: A one-inch 20-megapixel camera sensor; 4K/60 fps video; 14 static pictures per second; 5-way environmental sensing; mechanical shutter; double coding; 30-min endurance; 7 km flight distance. While the image acquisition, the overlap rates of the course and side directions were not less than 80% and 60%, respectively. The UAV height was 3 m, and an automatic shooting mode was adopted. The flight speed was 0.3 m/s and the automatic shooting interval was 0.3 m/s. The shooting path diagram is shown in Figure 6.
A self-developed digital image processing software system was used to process the UAV images. First, the pre-processing of the images was accomplished using a mean filtering method. The filtering window was 3 × 3. Mean filtering is a type of linear spatial filtering, with a simple algorithm and fast calculation speed. The second step was image binarization. The brightness of each pixel in the pre-processed images was expressed by 256 gray levels between 0 and 255. The threshold was selected by an OSTU algorithm. Each of the images was divided into two categories according to the gray characteristics of the images, and the optimal threshold occurred when the separation degree between the within-class variance and the between-class variance was the largest. After the binary images were obtained, manual processing was carried out for the parts with larger interference factors. Then, the images were cut and eliminated in order to improve the accuracy. A processed image is shown in Figure 7 (taking a 108-type several-hole test as an example). Finally, the pixel information is transformed into the actual block feature information using scale transformation.

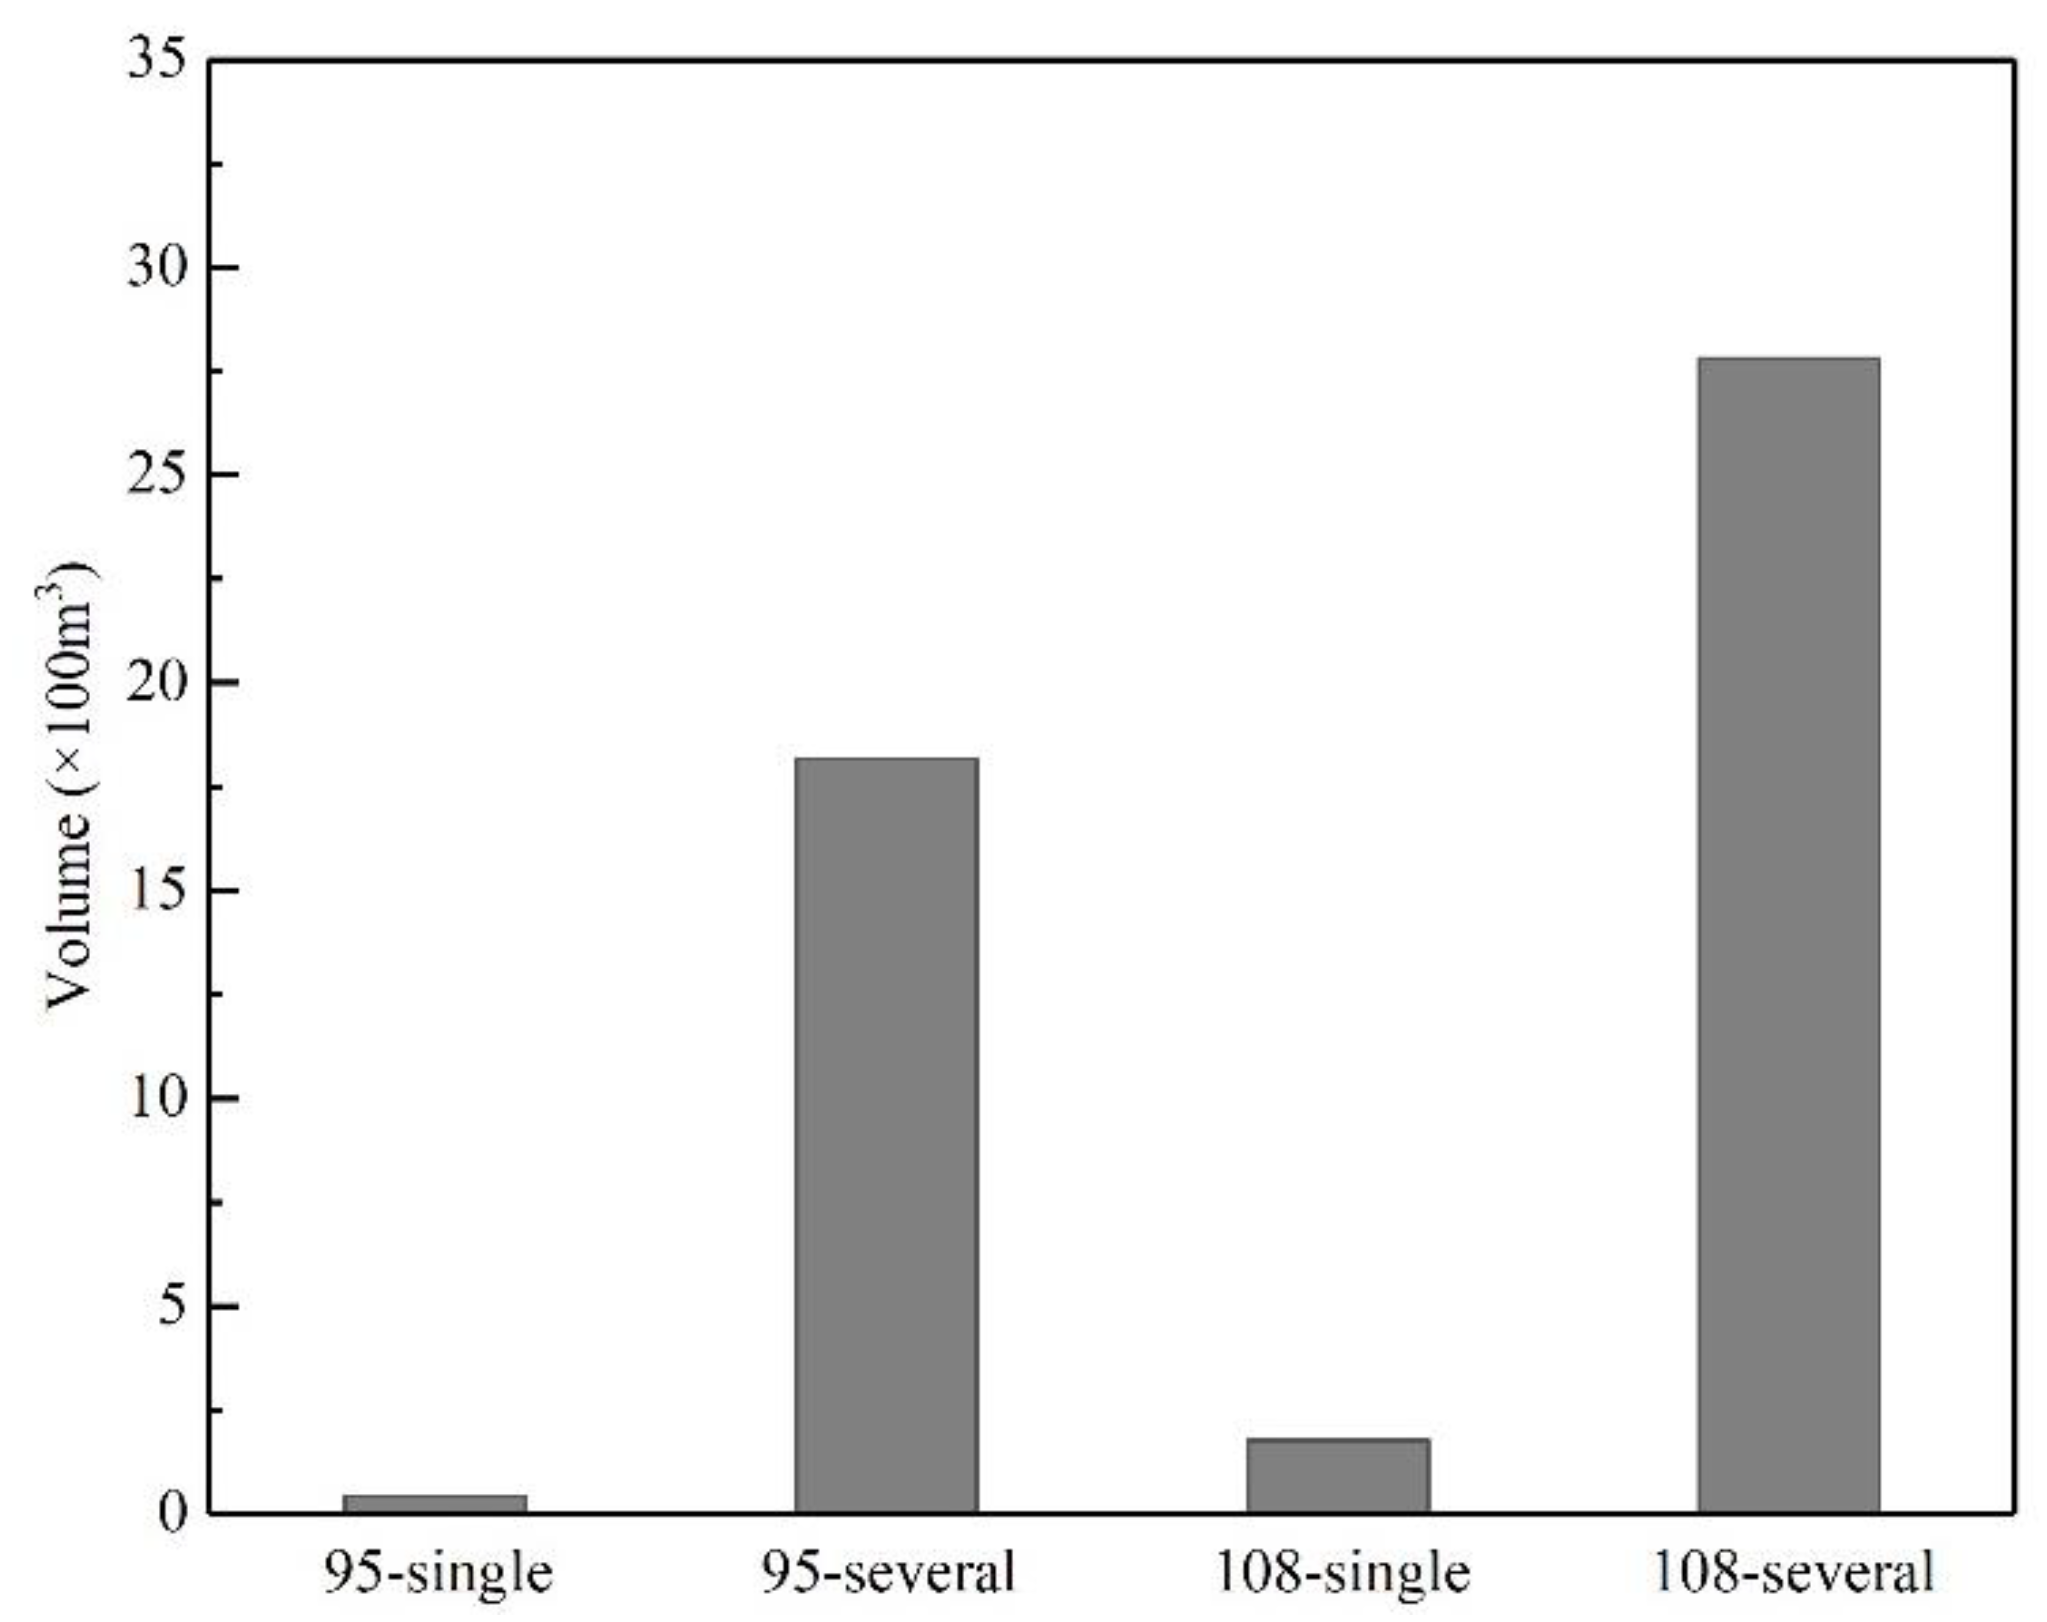
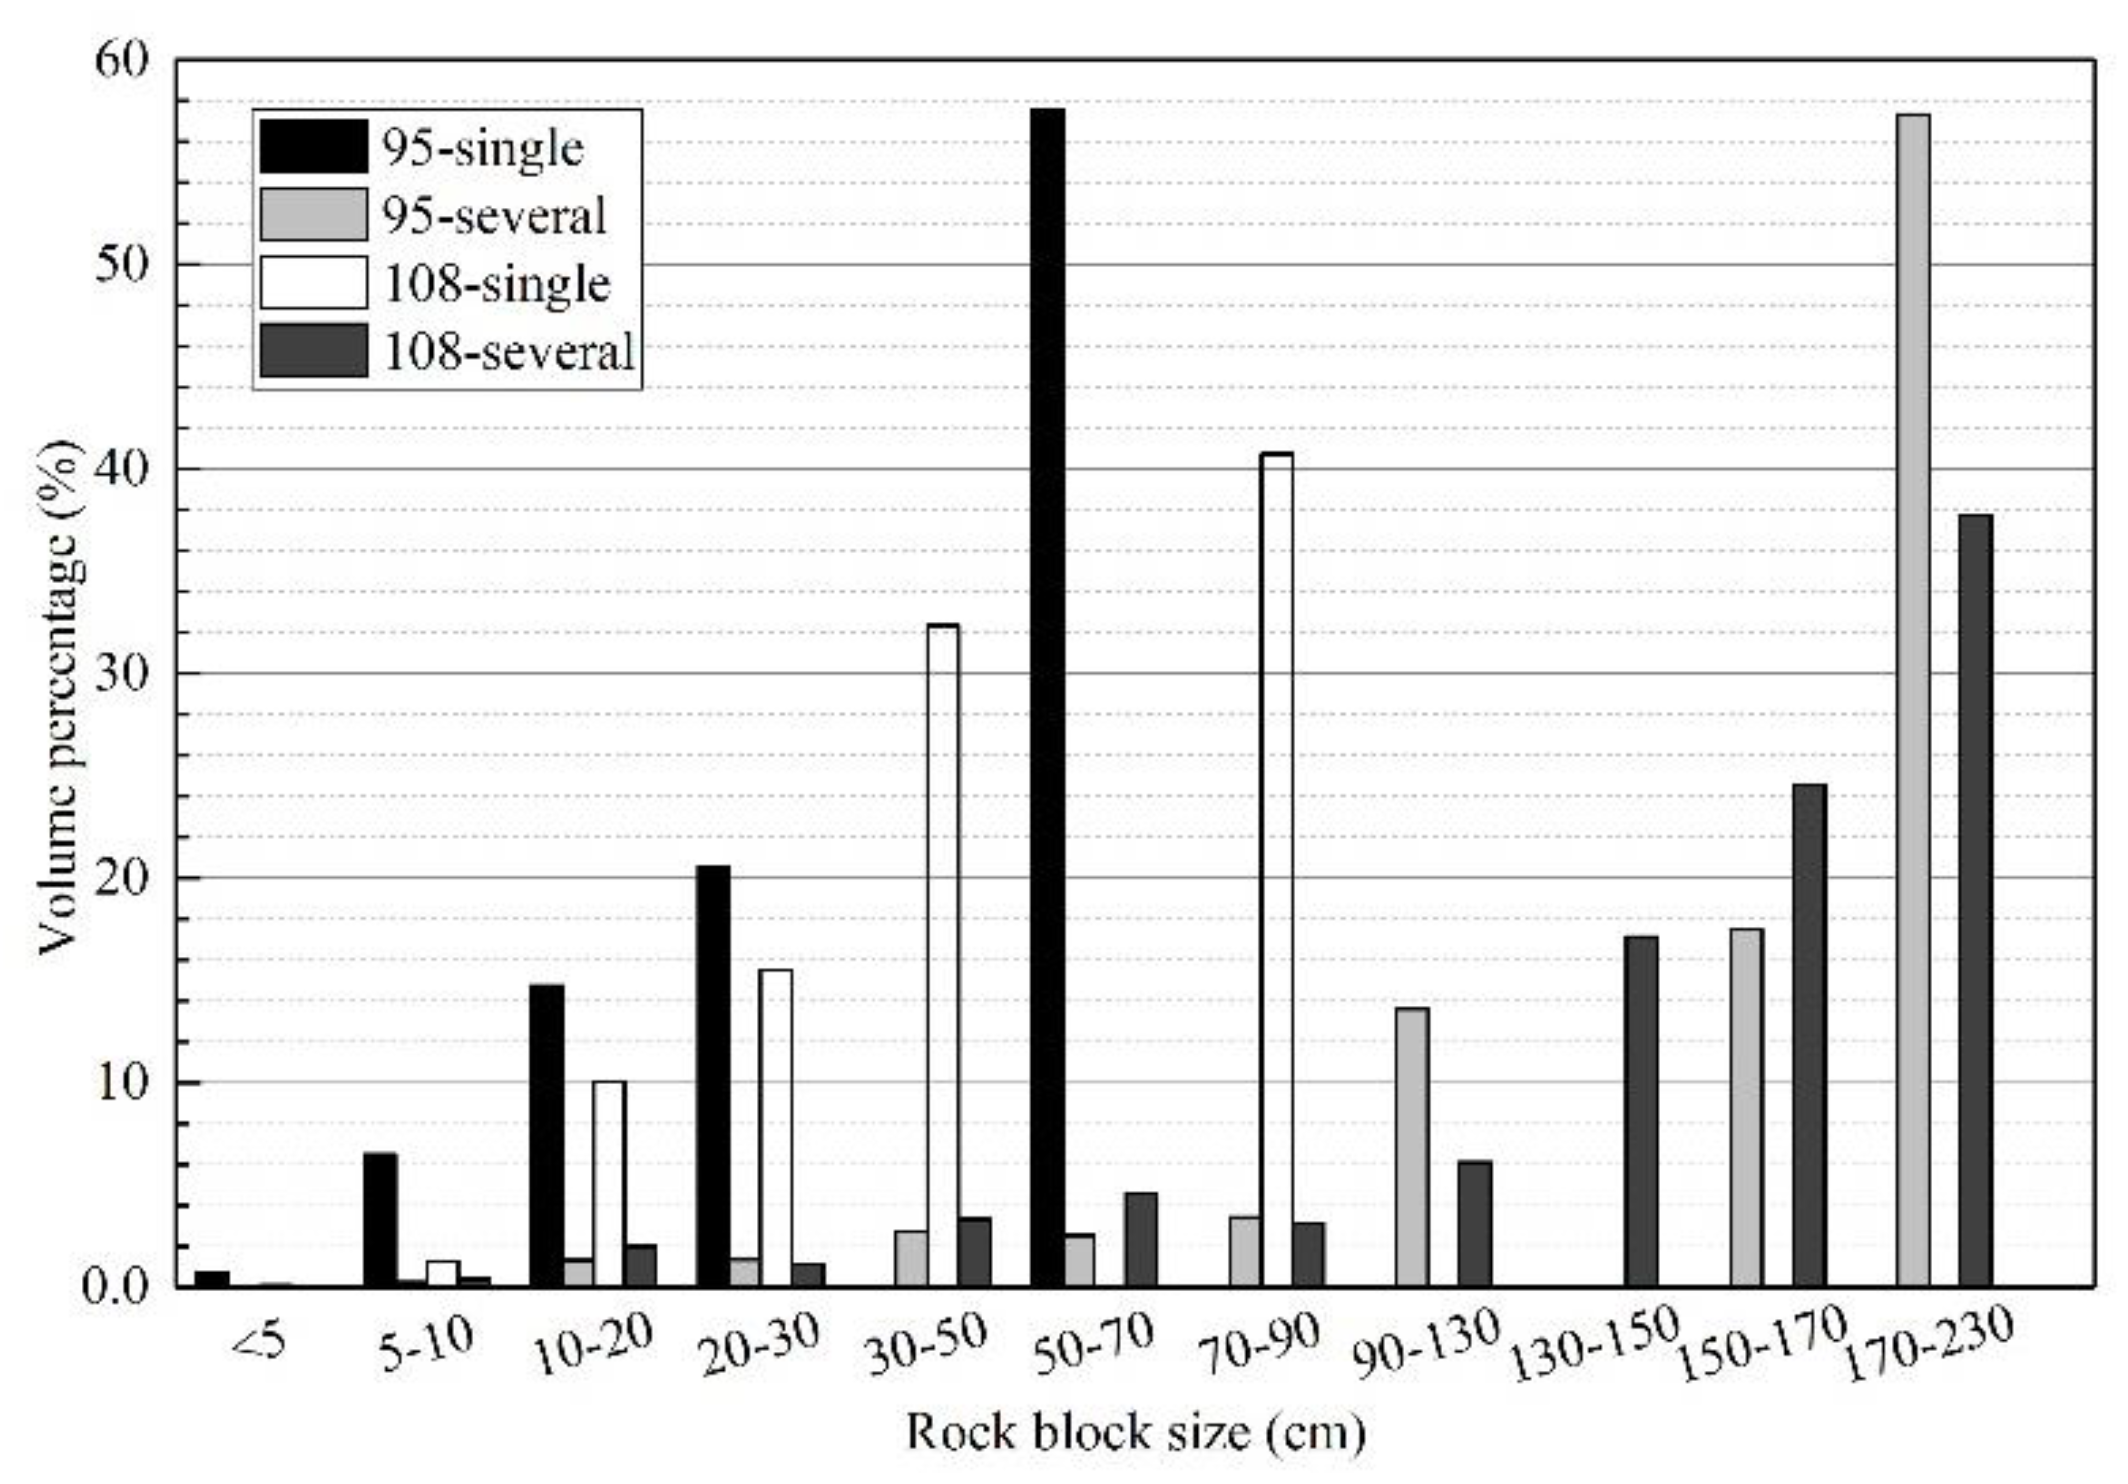
3.3.2. Distribution Characteristics of the Granularity of the Rock after Fracturing

In the current study, since only the projected areas of the fractured rock blocks could be obtained using the above-mentioned “UAV camera shooting + MIPS image processing” method, when the number of rock blocks in each grain size was large enough, the plane projection sizes (such as the areas or perimeters) of the rock fragments were used as the geometric characteristic quantities in order to detect the granularity after fracturing. It was determined that the plane projection sizes had accurately reflected the actual fracturing effects. There was observed to be a certain quantitative relationship between the planar sizes and the volumes of the rock blocks. At the present time, the following formulas are commonly used [28]:
{ a = P π + P 2 π 2 4 S π 2 b = P π P 2 π 2 4 S π 2 D = 1 . 16 b 1 . 35 b a V = D   ×   S
where S represents the area of the rock mass; P is the perimeter of the rock mass; D indicates the screen size of the rock mass; a is the maximum radius of the optimal ellipse; b represents the minimum radius of the optimal ellipse;   V   denotes the volume of the rock mass.
In the current study, Formula (1) was used for the volume conversion. Figure 8 shows a comparison of the fracturing volumes of the different schemes of liquid CO2 phase-transition fracturing. The total volume of the several fractured granules was obviously larger than that of the single-hole fracturing. This was mainly due to the different CO2 storage in the fracturing pipe, and major changes in the released energy. Further, the fracturing volume of the 108-type fracturing test was found to be larger than that of the 95-type fracturing test. Figure 9 shows the granule composition after four tests. According to the comparison of the two several-hole tests, the granularity distribution of the 108-type several-hole test was more uniform, and the boulder content was smaller than that in the 95-type test. At the same time, the fracturing volume of the 108-type several-hole test was observed to be larger than that of the 95-type several-hole test. In summary, the fracturing effects of the 108-type several-hole test were found to be superior to those of the 95-type several-hole test. Further, according to this study’s comparison of the two single-hole test results, the 95-type single-hole boulders were found to have a smaller content and better fracturing effects. The reasons for these results were that the rock weathering at the test site of the 95-type single-hole fracturing test was more serious and the rock mass itself was looser. This had reduced the transmission of the energy force and resulted in less effective fracturing.
It has been observed that fractured rock blocks have statistical self-similarity in both geometric shape and fractal distribution. The fractal description of the rock mass fracturing process is as follows: A rock mass will be initially broken into a finite number of blocks with similar shapes; some of those blocks will become separately broken into sub-blocks of similar shapes as the original rock mass under load conditions; some of the sub-blocks will become further broken into smaller sized rock blocks with similar shapes; each repetition of the process will produce smaller blocks [29,30]; therefore, in the present study, the distributions of the fractured rock, which were the result of the liquid CO2 transition were analyzed from a fractal point of view. The fractal dimensions were used to reflect the distributions of rock granularity, and to quantitatively evaluate the fracturing effects.
It was determined that if a rock sample contained zero-grade fragments and each grade of the fragment was broken into n fragments at a failure probability of P, with the similarity ratio of the adjacent fragments set as 1/r, then the total number of grade i fragments would be as follows [29]:
N i = ( 1     P ) n   [ 1 + n P +   ( n P ) 2 + + ( n P ) i 1 ]
Then, it can be known from the basic fractal definition that:
N i + 1 N i = ( 1 r ) D
Further, since i >> 1, and by assuming that nP > 1, the following can be obtained:
D = l o g ( n P ) / l o g ( 1 r )
Then, by assuming that the total volume of the rock mass granularity model will remain unchanged during the fracturing process, the original block can be divided into the next grade of the block with a failure probability P and similarity ratio r. This process can be infinitely repeated. As shown in Figure 10, a series of fragments with similar shapes and different sizes were generated during this experimental study.
The volume of the secondary rock blocks in the fracturing process was:
N = n P = ( 1 r ) 3 P
Therefore,
D = l o g N l o g ( 1 / r ) = 3     l o g P l o g r
It was assumed that the rock mass was initially composed of the M largest blocks with line size of x, and the volume of each rock block was V = C v x 3 (Cv represents the volume shape coefficient). Then, the line sizes of the kth block produced by all of the source blocks after three fractal structuring processes were as follows [32]:
x k = r k x   ( k = 0 , 1 , 2 )
The number of such blocks was:
N k = [ ( 1 r ) 3 P ] k ( 1 P ) M
The volume vk of the kth grade of the rock block was obtained from the formula as follows:
v k = C v x k 3 N k   = C v x 3 P k ( 1 P ) M
The total volume Vi of the rock blocks with line sizes smaller than or equivalent to xi was as follows:
V i = l i m j k = i j v i = C v x 3 P i M
Therefore, the proportion of the volume of the rock blocks with line sizes smaller than or equivalent to xi in the total volume was as follows:
y i = V i V k = P i
where i = l o g ( x i / x m ) / l o g r   was be obtained from the formula, and when combined, the following formula was obtained:
y i = ( x i x m ) 3 D
Therefore, the relationship between the fractal dimension and cumulant under the sieves of the fracturing granule sizes was determined, and a fractal model of the granular distribution of the fractured rock (in which xm is the largest size of the rock blocks) was obtained. The advantage of a fractal model is that the granular distribution can be understood by calculating the fractal dimension D from the fractured rock without considering the occurrence state, geological structure conditions, or fracture parameters of the original rock. As a result, the concept of the fractal dimensions was made clearer, and its applicability was found to be wider.
In accordance with the above-mentioned theoretical analysis results, Table 3 and Figure 11 illustrate the screening percentages and fractal values of the four groups of liquid CO2 transient fracturing tests.
The results shown in Table 3 illustrate that the fractured rock mass still had a good fractal structure, even though the parameters of the four tests were different. Then, through a comparison of two single-hole tests and two several-hole tests, it was not difficult to see that the higher the proportion of small fragments after fracturing was, the larger the fractal dimensions would be. In contrast, it was observed that the lower the proportion of small fragments after fracturing were, the smaller the fractal dimensions would be. The fractal dimension of the 108-type single-hole test was determined to be 0.183. Meanwhile, the fractal dimension of the 95-type single-hole test was 0.970, which was abnormal. The reason for these results was determined to be that the 95-type single-hole test boreholes had a high content of clay, which was a soil-rock accumulation layer and strong weathering layer with poor rock properties. This had led to increases in the fractal dimensions.
The fracturing effects of rock mass excavations using liquid CO2 phase transition methods are better than those obtained using conventional non-blasting excavation methods. The fracturing volumes have been found to be more ideal. Further, the fractal dimension D can be used to characterize the granular distributions, which provides favorable conditions for the subsequent optimization of the fracturing modes.

3.4. Vibration Monitoring

In this study’s field tests, a Blast-UM blasting vibrometer was used to record the vibration signals, and vibration monitoring was carried out for the liquid CO2 phase-transition fracturing tests. The 108-type several-hole fracturing test was taken as an example for analysis and research purposes, and its distribution pattern is shown in Figure 12.

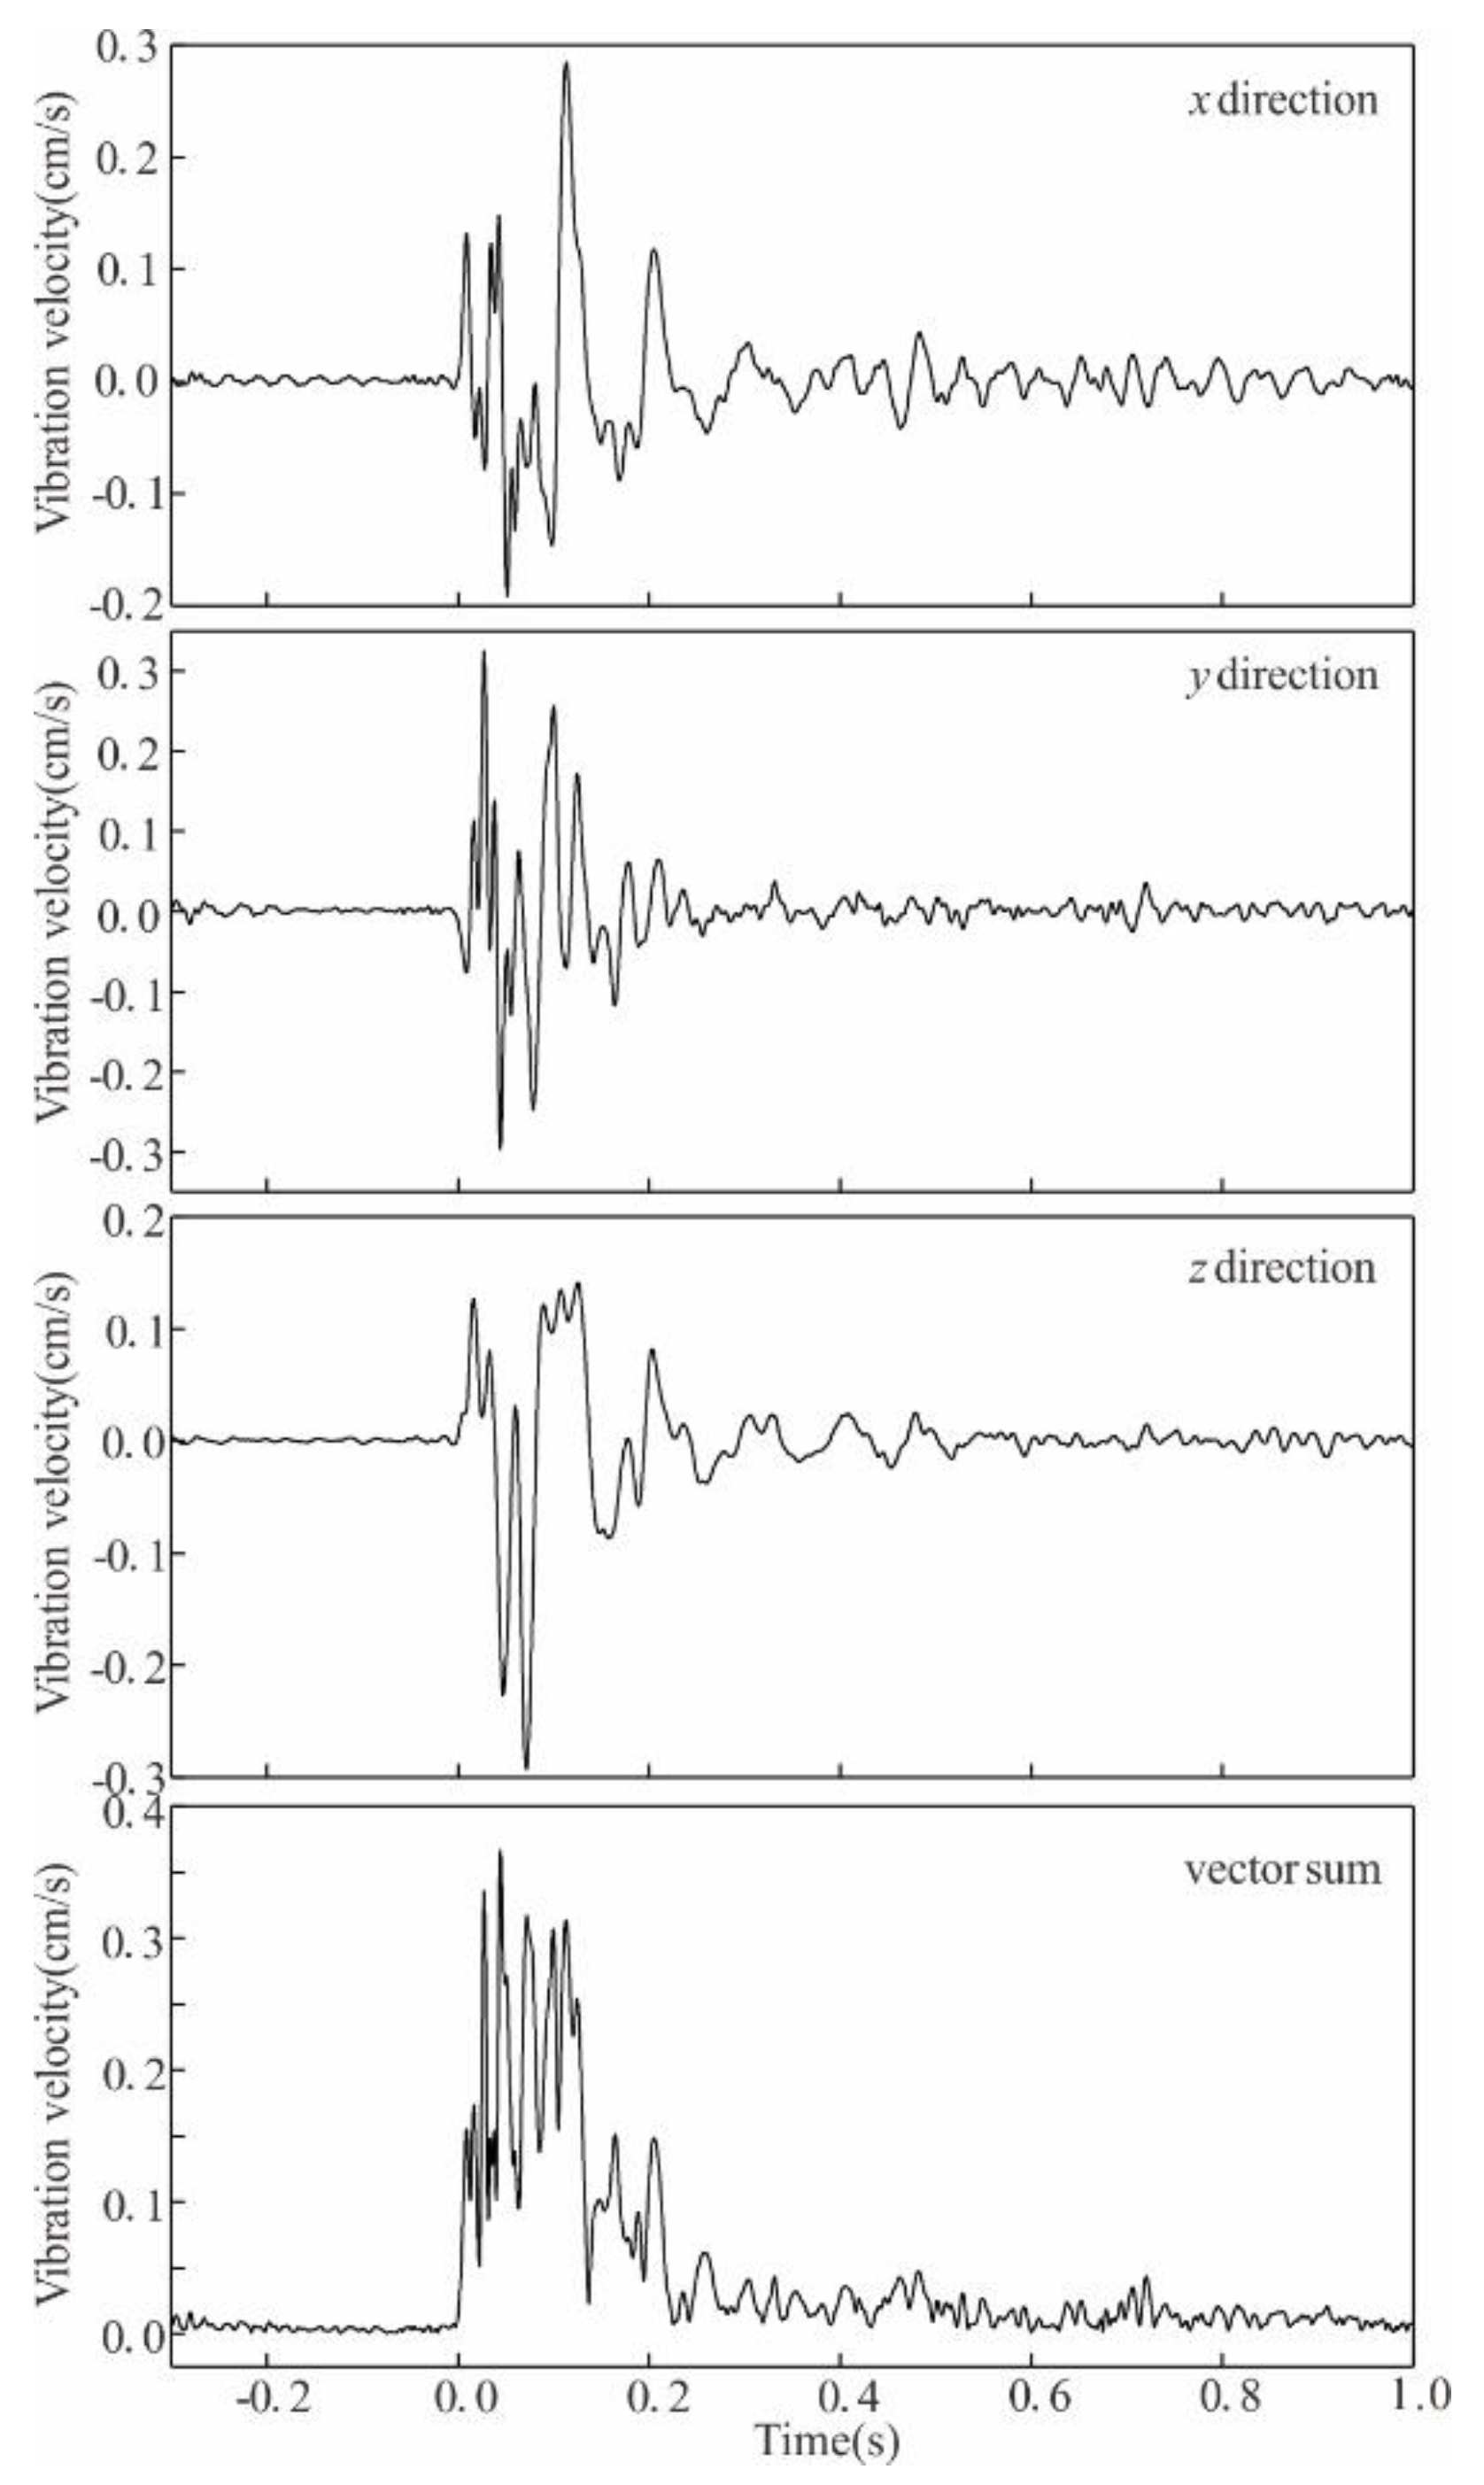
3.4.1. Velocity Analysis

The vibration velocities and vectors in the three directions of the vibrometer are shown in Figure 13. The fast Fourier transform of the velocity signal f (t) was made using MATLAB software, and the time domain signals were transformed into frequency domain signals F( ω ), as shown in Figure 14. This study’s three charts reveal the following: At a position 10 m away from the fracturing point, the particle vibration duration was short (approximately 0.1 s), and the peak vibration velocity was 0.3667 cm/s. Moreover, the attenuation speed was fast, and the high-frequency component was observed to be small. The energy was mainly concentrated in the low-frequency parts. The main frequency band of each sub-velocity was generally below 100 Hz, and the main frequency had ranged between 10 and 20 Hz, which successfully met the vibration safety standards for general civil buildings in China.

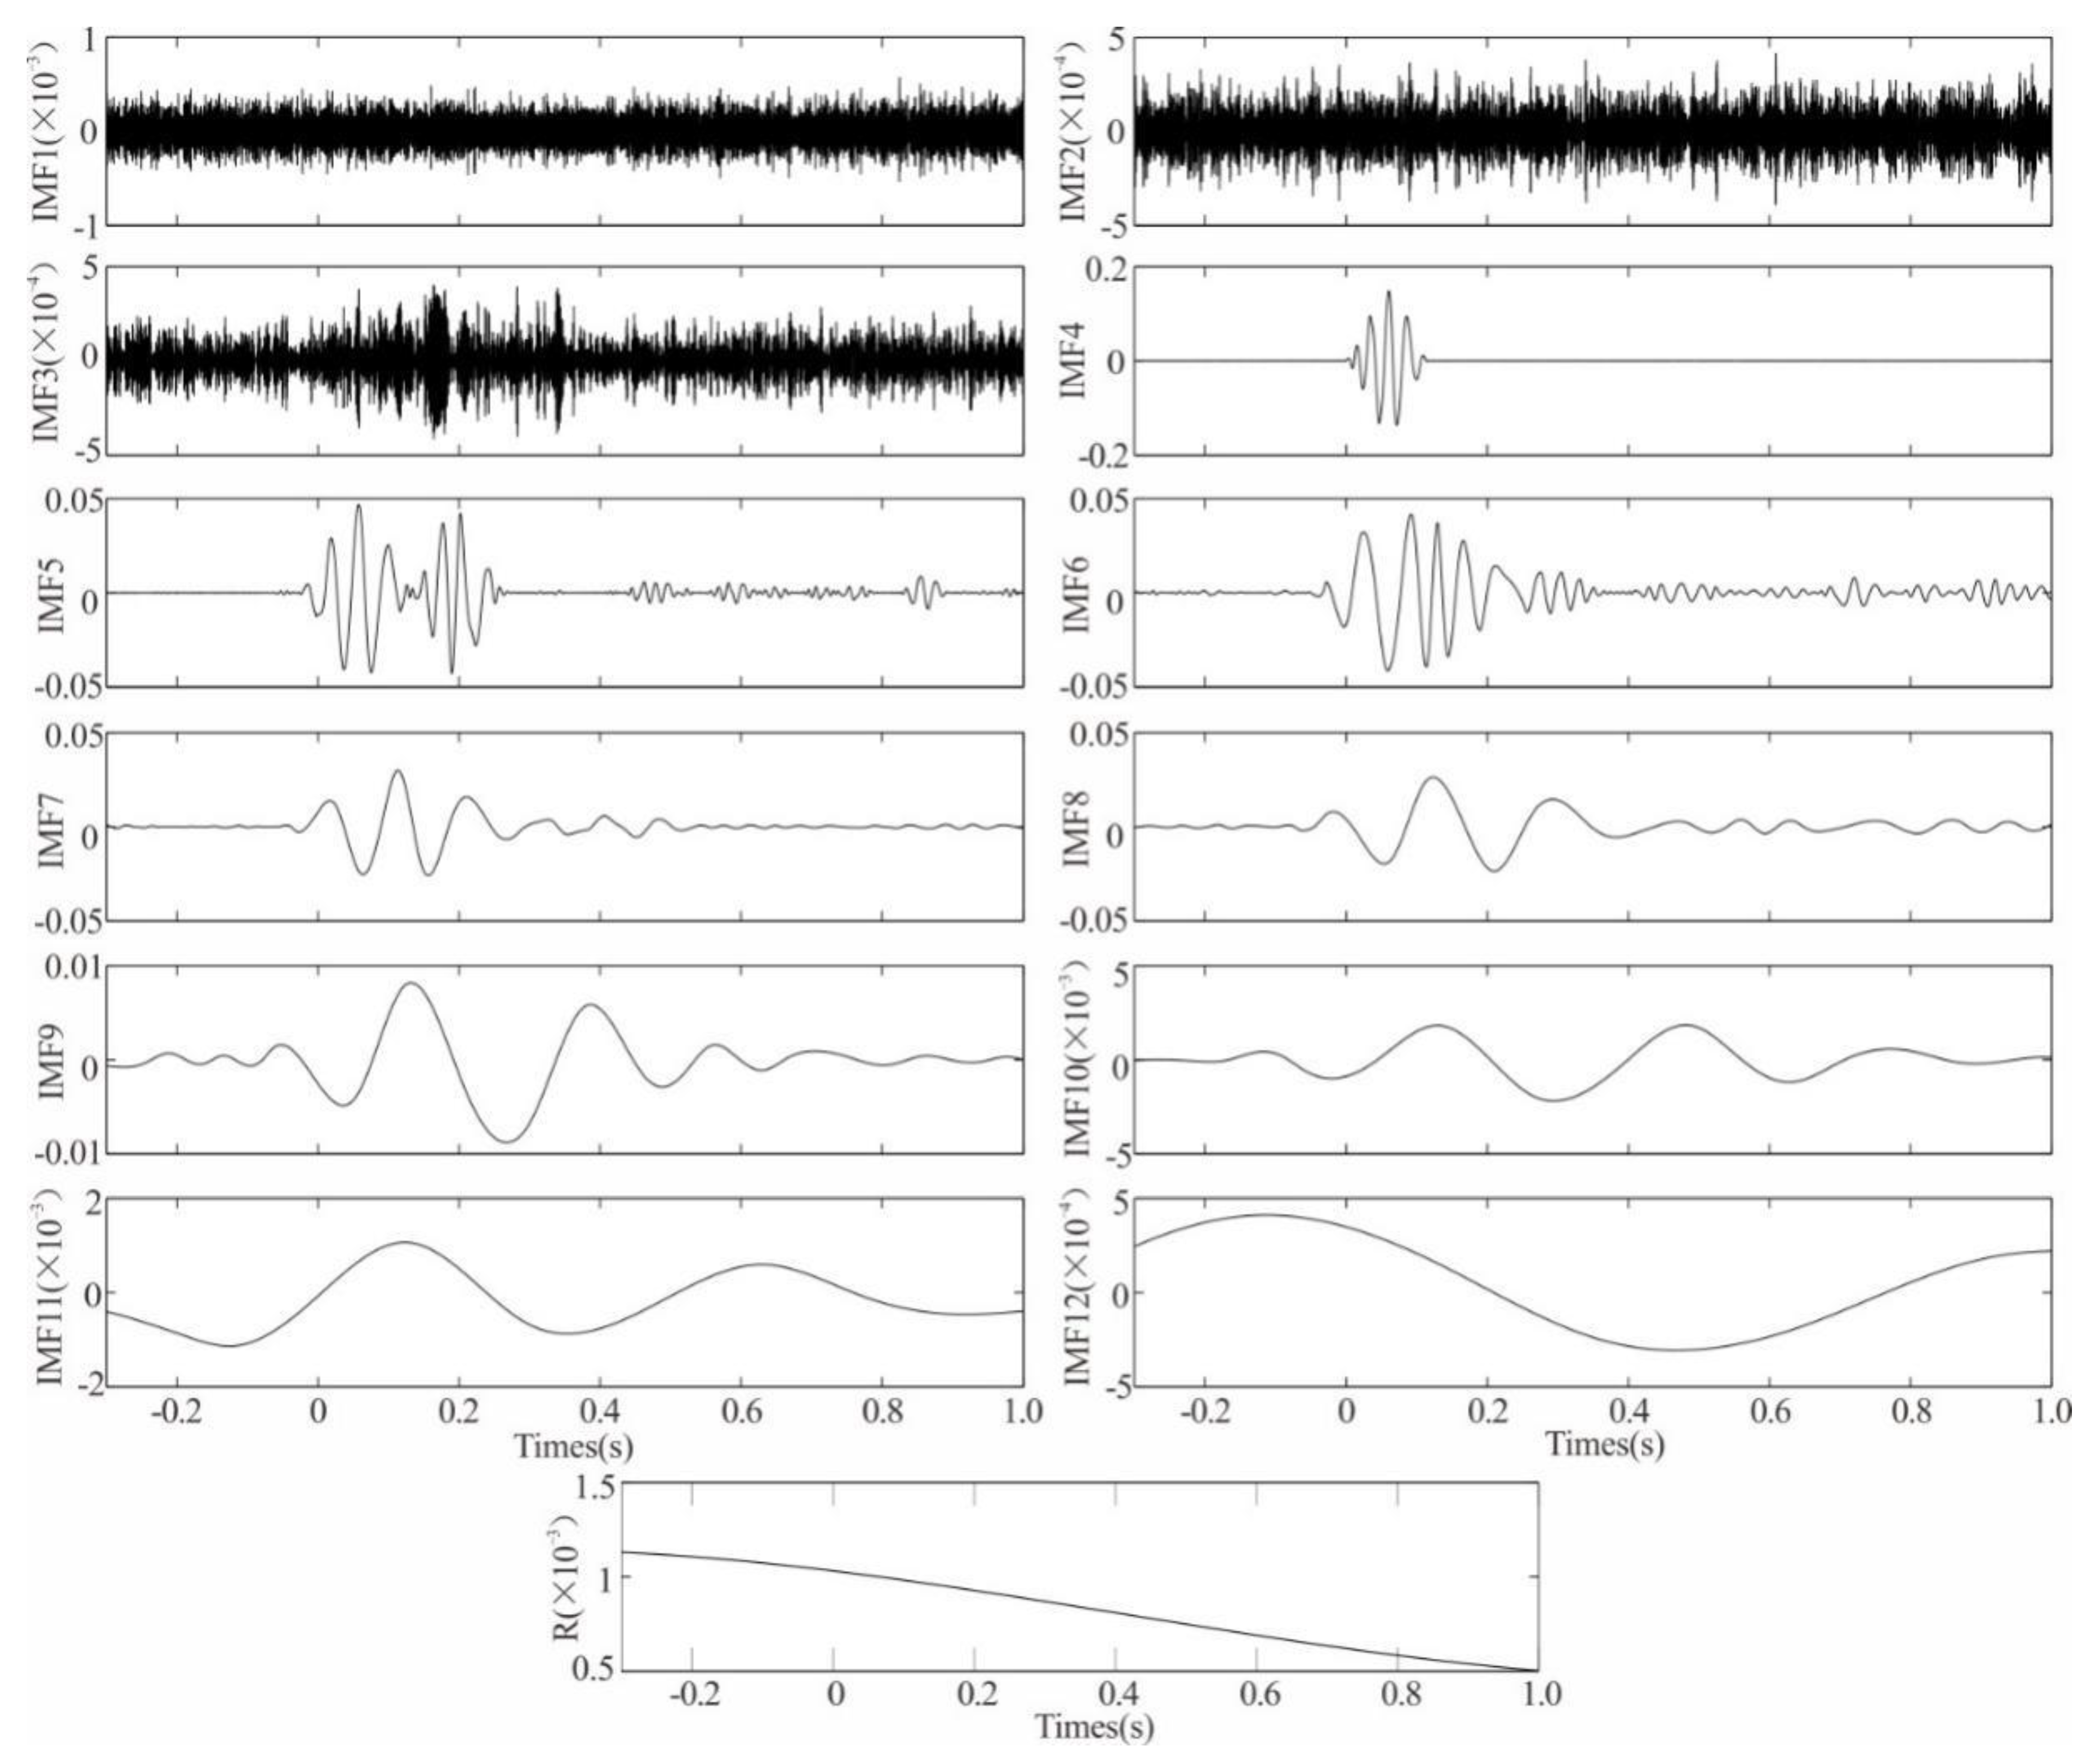
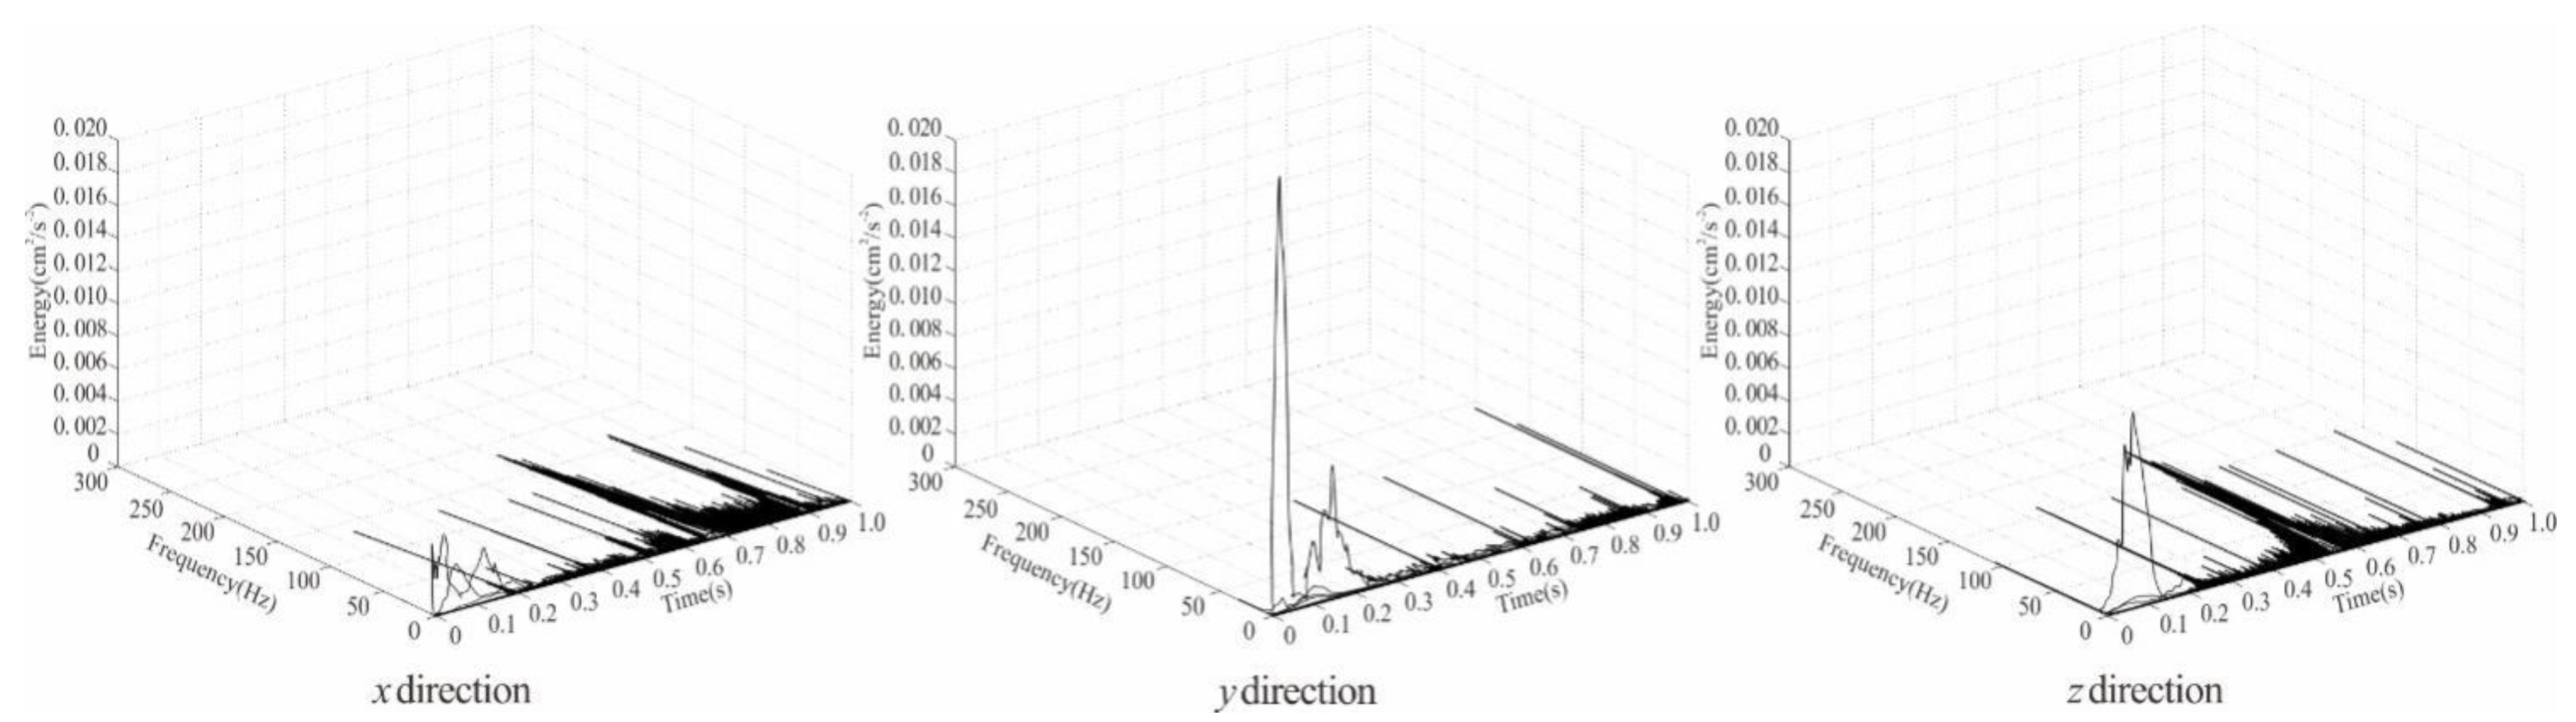
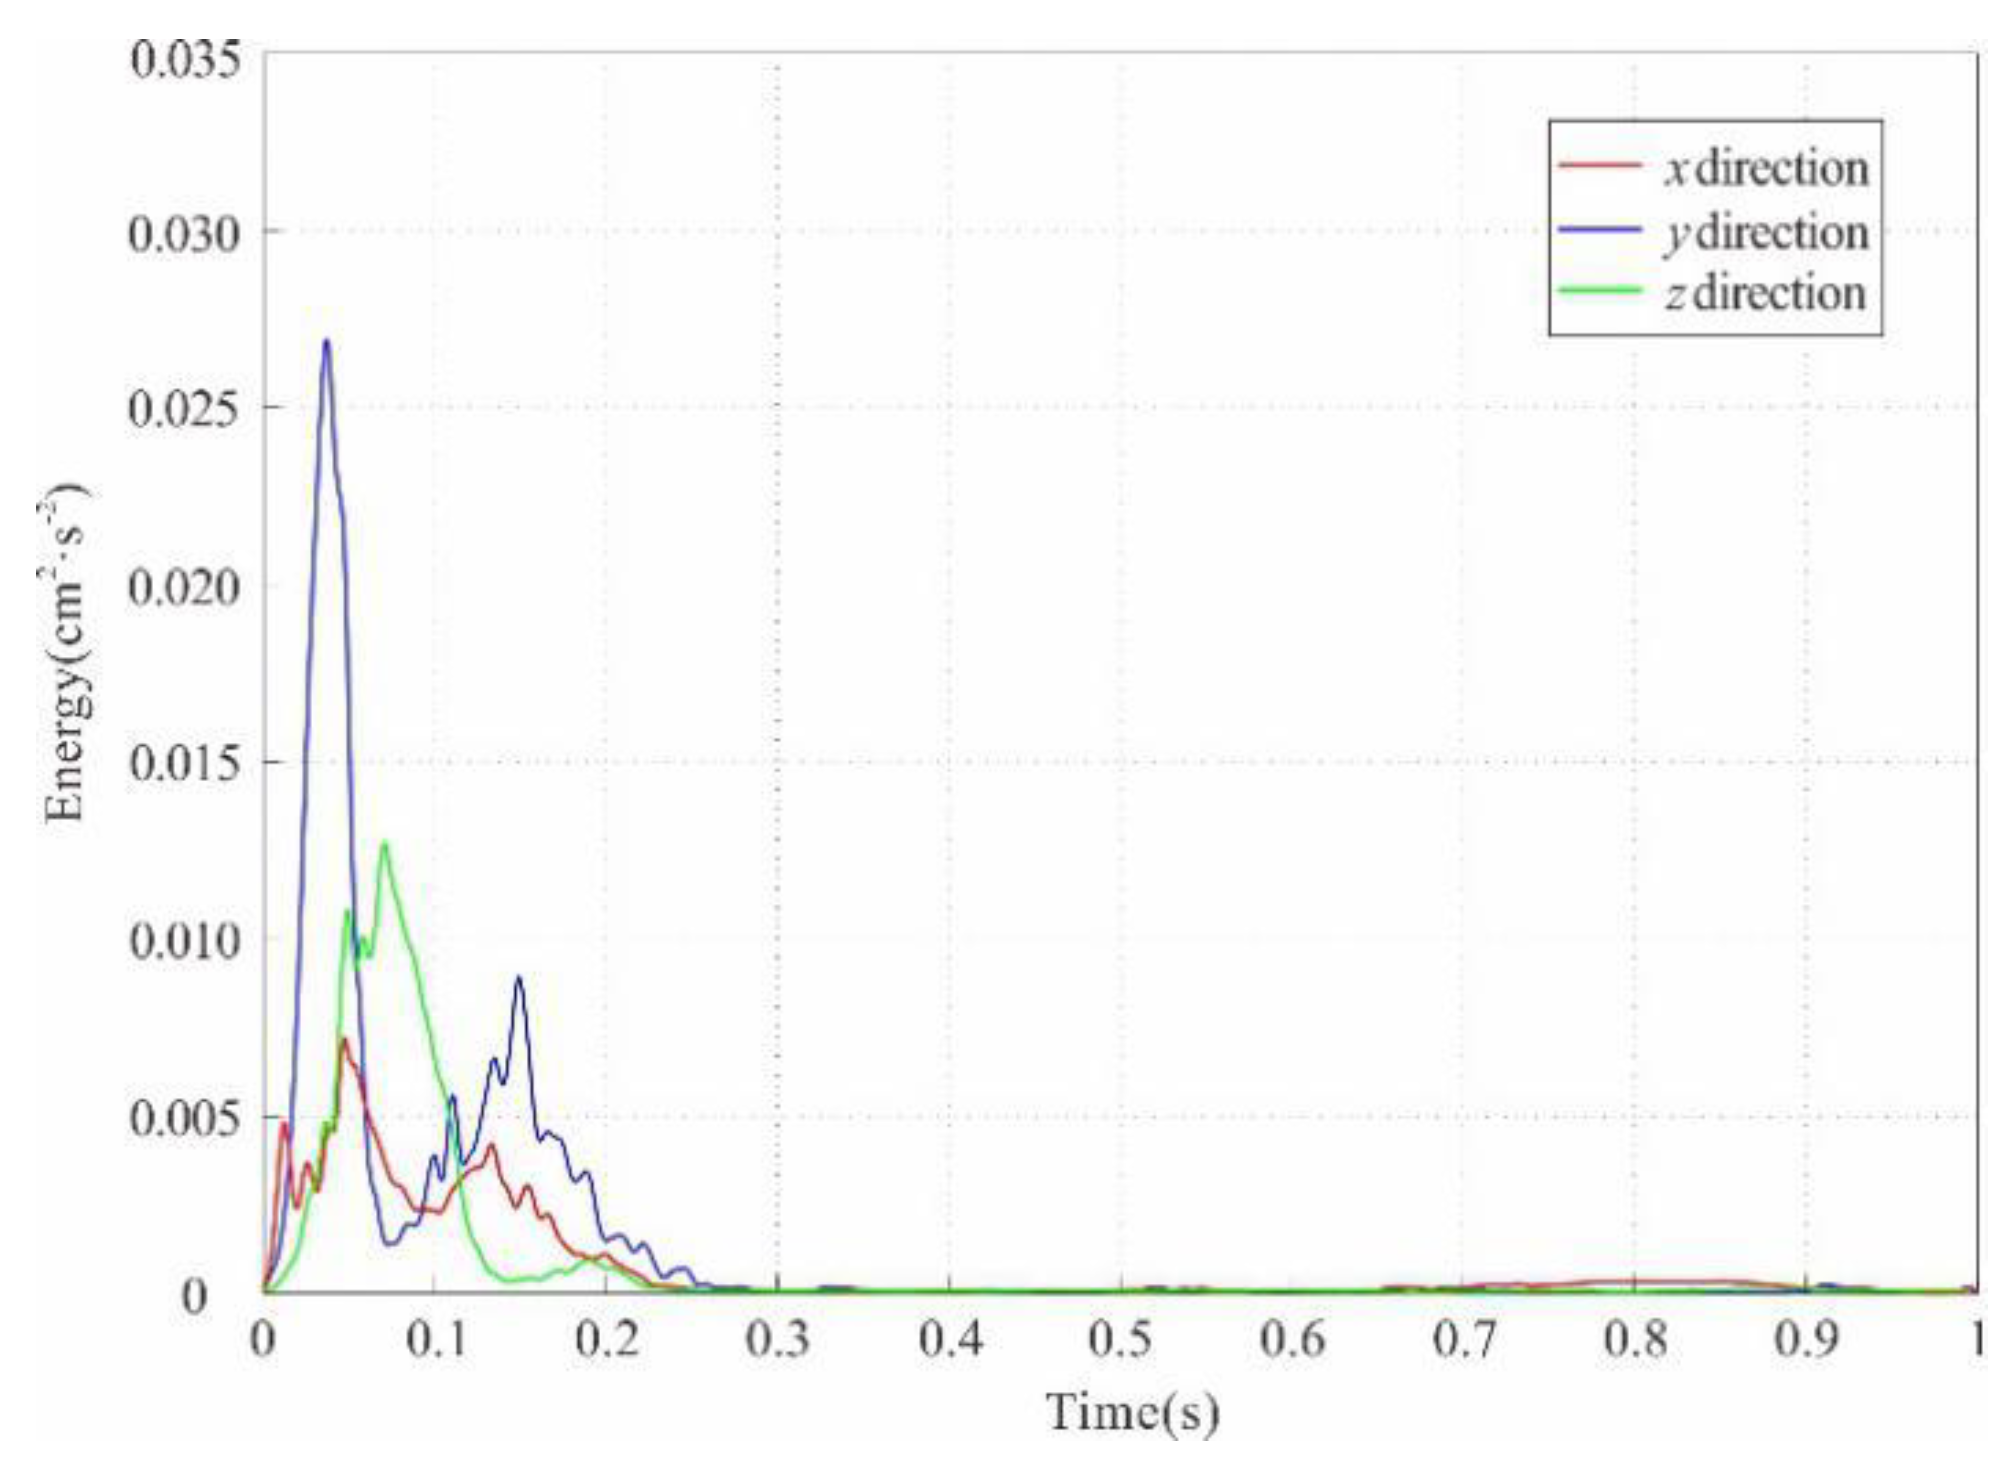
3.4.2. Energy Analysis

As can be seen in Figure 12 and Figure 13, the vibration signals produced by the liquid CO2 phase-transition fracturing technology method were non-stationary random signals, which were similar to the blasting seismic waves. The Fourier transform could not accurately analyze the vibration signals. Therefore, in the current study, an HHT (Hilbert–Huang Transform) energy analysis principle was adopted to reflect the spectral characteristics and energy distribution concerns of the vibration signals from the perspective of the vibration signal energy [33,34], for the purpose of evaluating the safety of the liquid CO2 phase-transition fracturing technology method.
It has been determined that HHT methods are suitable for analyzing non-stationary and non-linear signals. The methods consist of two steps: (1) The empirical mode decomposition of the vibration signals in order to obtain a series of intrinsic mode functions representing the time scale of the signal characteristics; (2) Hilbert transforms for each IMF (intrinsic mode function) component. The EMD (empirical mode decomposition) uses the mean of the upper and lower envelopes of the time series to determine the “instantaneous equilibrium position”, and then extracts the IMF. An IMF is one of the oscillating modes of data recorded at a given time. The Hilbert spectrum can be obtained by the Hilbert transform of a signal as follows [33]:
H ( ω , t ) = Re i = 1 n a i ( t ) e ω i ( t ) d t
The Hilbert marginal spectrum can be obtained by the time integration of the Hilbert spectrum.
h ( ω ) = 0 T H ( ω , t ) d t
The marginal spectrum is the integral of the amplitude of each frequency component in time. The instantaneous energy spectrum of a signal can be obtained by the frequency integration of the square of the Hilbert spectrum.
I E ( t ) = ω H 2 ( ω , t ) d ω
Therefore, it can be used to accurately describe the process of signal energy changing with time.
In the current study, the above-mentioned method and MATLAB programming were adopted, and EMD decomposition was carried out by taking the vibration signal in the Z direction as an example. A total of 12 IMF components with different frequencies, and one monotonous residual component, were obtained, as shown in Figure 15. It was found that the frequencies of the IMF components had ranged from large to small from top to bottom. The frequencies of the IMF1, IMF2, and IMF3 components were found to be too high, and had not been in accordance with the characteristics of the vibration waves; therefore, those components were considered to be noise and were eliminated in subsequent analyses. The IMF4 to IMF7 components were considered to be the main components of the measured wave due to their high vibration intensities. The IMF10 to IMF12 components were found to have low intensities and low frequencies, which indicated that the measured waveform was mainly concentrated within a narrow frequency band.
The EMD decomposition of the vibration signals in the X and Y directions was carried out using the same method described previously. The IMF components were obtained and brought into a Hilbert transform, which was obtained using the Hilbert energy spectrum. Figure 16 displays the Hilbert energy spectrum of the signals in the different vibration directions, which accurately shows the energy distribution of the IMF components. Then, by comparing the different Hilbert diagrams, it was found that the overall form of the Hilbert spectrum was basically the same in the three directions. The duration of the low frequency was longer, and the low-frequency components in the three directions had lasted until the end of the vibration wave. Meanwhile, the vibration energy in the three directions had displayed the largest energy in the first 0.2 s. Among those, the high frequency in the x-direction was the highest, followed by the z-direction, while the y axis was observed to be the lowest. Further, there was larger vibration energy observed in the y-direction within the frequency range of 0 to 20 Hz. The main reason for this phenomenon was that the vibration signal in the y-direction had been generated by the superposition of a luff wave and Rayleigh wave, and the components were relatively complex.
Figure 17 shows the instantaneous energy spectrum of the signal. It can be seen in the figure that the vibration waves produced by the liquid CO2 phase-transition fracturing had displayed typical transient responses and the motion characteristics of shock loading at the beginning. There were few differences observed in the times when the energy peaks had appeared in the three directions. In the beginning, the Y-direction was the largest, and then the energy in the Z-direction had exceeded that of the Y-direction. The main reasons for this were that the Z-direction had contained more high-frequency components, and the energy attenuation was faster. Meanwhile, the Y-direction contained more low-frequency components, and the energy attenuation was slower. Further, the energy in the X-direction was determined to be the lowest.
When vibration energy acts on a building, its energy component will be magnified when it is close to the natural frequency of the structure. Since the natural frequencies of structures are generally low, although the energy distribution of the liquid CO2 phase-transition fracturing tended to be in a low-frequency band, the vibration energy values were small, and the durations were short; therefore, there was not enough released energy to cause damage to buildings, which met the building safety standards; however, according to the Hilbert energy spectrum, there were many low-frequency components in the Y-direction of the three vibration directions; therefore, attention should be paid to monitoring this in subsequent applications of liquid CO2 phase-transition fracturing technology.

4. Conclusions

The following is a summary of this study’s findings:
  • During the process of the liquid CO2 phase-transition fracturing, there were both dynamic actions of rock breakages by excitation stress wave impacts, and quasi-static actions of rock breakage by gasification expansion wedges. It was confirmed in this study that liquid CO2 phase-transition fracturing technology could be applied in surface rock excavation and will provide a new idea for the follow-up activities of similar engineering construction projects.
  • It was determined from these results that the liquid CO2 phase-transition fracturing technology method had displayed ideal effects. Further, the granular distributions of fractured rock blocks had conformed to the fractal law. It could be seen that the higher the proportion of small fragments was, the greater the fractal dimensions would be. This study’s quantitative evaluation of the fracturing granularity will potentially provide important technical support for the subsequent optimization of drill-hole arrangements to improve fracturing effects.
  • The duration of the CO2 fracturing vibration waves was short (approximately 0.2 s), with fast attenuation and a small number of high-frequency components. The duration of the main vibration phases was approximately 0.1 s, and the distributions of the frequency bands were observed to be different. Overall, the energy dominant frequency bands of the CO2 fracturing vibration waves were determined to range between 0 and 20 Hz.

Author Contributions

Conceptualization, T.S. and H.S.; methodology, H.S.; validation, H.S. and Y.C.; formal analysis, H.S.; investigation, K.Y. and Y.C.; data curation, H.S.; writing—original draft preparation, H.S.; writing—review and editing, R.H.; visualization, K.Y.; supervision, R.H.; project administration, R.H.; funding acquisition, T.S. All authors have read and agreed to the published version of the manuscript.

Funding

This research was funded by National Natural Science Foundation of China, grant number 41330643.

Institutional Review Board Statement

Not applicable.

Informed Consent Statement

Not applicable.

Conflicts of Interest

The authors declare no conflict of interest.

References

  1. Caldwell, T. A Comparison of Non-Explosive Rock Breaking Techniques. Bachelor’s Thesis, School of Engineering, The University of Queensland, Brisbane, Australia, 2004. [Google Scholar]
  2. Peng, H.D.; Liu, D.W.; Chu, F.J.; Jian, Y.H. Test on high pressure gas expansion rock fragmentation in hard rock tunnel. Rock Soil Mech. 2018, 39, 242–248. [Google Scholar]
  3. Ghose, A.K.; Res, J.; Kotwica, K. Non-explosive rock excavation—A critique. J. Mines Met. Fuels 1999, 03, 67–74. [Google Scholar]
  4. Roy, P.P.; Ghose, A.K. Rock excavation without explosives—The global scenario. J. Mines Met. Fuels 2003, 322, 364–369. [Google Scholar]
  5. Wang, S.D. Application of non-blasting rock breaking technology in foreign countries. Nonferrous Met. Des. 2000, 57, 40–44. [Google Scholar]
  6. Yin, C.F.; Yang, Y.; Shen, R.G.; Yang, Y.M.; Jiang, H.L. Review of non-explosive rock breaking. China Sci. Technol. Inf. 2015, 21, 93–94. [Google Scholar]
  7. Xie, X.H.; Zhang, X.K. Review of the study of non-explosive rock breaking. Coal Mine Blasting 2017, 6, 19–23. [Google Scholar]
  8. Peng, K.W. The direction control of cut-plane during digging building stone with non-explosive demolishing angent. Rock Soil Mech. 1990, 2, 79–84. [Google Scholar]
  9. Zhang, K.Z. Application of Static Fragmentation Technique in Excavation of Hard Rocks. Blasting 2003, 4, 96–97. [Google Scholar]
  10. Lu, T.; Wang, Z.; Yang, H.; Yuan, P.; Han, Y.; Sun, X. Improvement of coal seam gas drainage by under-panel cross-strata stimulation using highly pressurized gas. Int. J. Rock Mech. Min. Sci. 2015, 77, 300–312. [Google Scholar] [CrossRef]
  11. Zhou, K.P.; Ke, B.; Li, J.L.; Zhang, Y.N.; Cheng, L. Pressure dynamic response and explosion energy of liquid carbon dioxide blasting system. Blasting 2017, 34, 7–13. [Google Scholar]
  12. Schooler, D.R. The Use of Carbon Dioxide for Dislodging Coal in Mines. 1944. Available online: https://scholarsmine.mst.edu/professional_theses/224/ (accessed on 15 October 2021).
  13. Holmberg, R.; White, T. Cardox system brings benefits in the mining of large coal. Coal Int. 1995, 243, 31–33. [Google Scholar]
  14. Goodarzi, M.; Mohammadi, S.; Jafari, A. Numerical analysis of rock fracturing by gas pressure using the extended finite element method. Pet. Sci. 2015, 12, 304–315. [Google Scholar] [CrossRef] [Green Version]
  15. Zhu, W.C.; Gai, D.; Wei, C.H.; Li, S.G. High-pressure air blasting experiments on concrete and implications for enhanced coal gas drainage. J. Nat. Gas Sci. Eng. 2016, 36, 1253–1263. [Google Scholar] [CrossRef] [Green Version]
  16. Donzé, F.V.; Bouchez, J.; Magnier, S.A. Modeling fractures in rock blasting. Int. J. Rock Mech. Min. Sci. 1997, 34, 1153–1163. [Google Scholar] [CrossRef]
  17. Singh, S.P. Non-explosive applications of the PCF concept for underground excavation. Tunn. Undergr. Space Technol. 1998, 13, 305–311. [Google Scholar] [CrossRef]
  18. Zhou, X.H.; Men, J.L.; Song, D.P.; Li, C.Y. Research on optimal borehole parameters of antireflection in coal seam by liquid CO2 blasting. Chin. J. Rock Mech. Eng. 2016, 35, 524–529. [Google Scholar]
  19. Cho, S.H.; Nakamura, Y.; Kaneko, K. Dynamic fracture process analysis of rock subjected to a stress wave and gas pressurization. Int. J. Rock Mech. Min. Sci. 2004, 41, 439. [Google Scholar] [CrossRef]
  20. An, F.H.; Cheng, Y.P.; Liang, W.; Wei, L. A numerical model for outburst including the effect of adsorbed gas on coal deformation and mechanical properties. Comput. Geotech. 2013, 54, 222–231. [Google Scholar] [CrossRef]
  21. Akcin, N.A. Optimun conditions and results form the application of the air blasting excavation system. Miner. Resour. Eng. 2000, 9, 323–334. [Google Scholar] [CrossRef]
  22. Cao, Y.; Zhang, J.; Hong, Z.; Fu, G.; Lin, T.; Liu, S. CO2 gas fracturing: A novel reservoir stimulation technology in low permeability gassy coal seams. Fuel 2017, 203, 197–207. [Google Scholar] [CrossRef]
  23. Guo, Z.X. Liquid carbon dioxide blasting tube and field test blasting. Blasting 1994, 03, 72–74. [Google Scholar]
  24. Xie, X.F.; Li, X.B.; Li, Q.Y.; Ma, H.P.; Liu, X.X. Liquid CO2 phase-transforming rock fracturing technology in pile-well excavation. J. Cent. South Univ. (Sci. Technol.) 2018, 49, 2031–2038. [Google Scholar]
  25. Mohammadi, S.; Pooladi, A. A two-mesh coupled gas flow–solid interaction model for 2D blast analysis in fractured media. Finite Elem. Anal. Des. 2012, 50, 48–69. [Google Scholar] [CrossRef]
  26. Plata, M.J.; Castillo, R.D.; Mendoza, S.A. High Energy Gas Fracturing: A Technique of Hydraulic Prefracturing To Reduce the Pressure Losses by Friction in the Near Wellbore—A Colombian Field Application. In Proceedings of the SPE Latin America and Caribbean Petroleum Engineering Conference, Mexico City, Mexico, 16–18 April 2012. [Google Scholar]
  27. Pang, Z.N.; Zhao, X.; Zou, D.J. The research of rectifying image deviation for UAV. Electron. Prod. Reliab. Environ. Test. 2009, 27, 14–16. [Google Scholar]
  28. Ouchterlony, F. Influence of blasting on the size of distribution of muckpile fragments. Can. J. Earth Sci. 2011, 28, 1285–1300. [Google Scholar]
  29. Gao, F.; Xie, H.P.; Zhao, P. Fractal properties of size-frequency distribution of rock fragments and the influence of meso-structure. Chin. J. Rock Mech. Eng. 1994, 3, 240–246. [Google Scholar]
  30. Xie, X.P.; Xie, Y. Application of fractional method for forecasting rock blasting fragmentation. Eng. Blasting 1995, 01, 26–32. [Google Scholar]
  31. Ding, T. The Study of Fractional Model of Blasting Rock Fragmentation Distribution. Master’s Thesis, Liaoning Technical University, Fuxin, China, 2000. [Google Scholar]
  32. Zhao, M. Study on Ore Rock Pile Distribution Based on Fractal Theory. Master’s Thesis, Inner Mongolia University of Science&Technology, Baotou, China, 2015. [Google Scholar]
  33. Huang, N.E.; Wu, Z. A review on Hilbert-Huang transform: Method and its applications to geophysical studies. Rev. Geophys. 2008, 46, RG2006. [Google Scholar] [CrossRef] [Green Version]
  34. Zhang, R.R.; Asce, M.; Ma, S.; Safak, E.; Hartzell, S. Hilbert-Huang Transform Analysis of Dynamic and Earthquake Motion Recordings. J. Eng. Mech. 2003, 129, 861–875. [Google Scholar] [CrossRef]
Figure 1. (1) Riser; (2) firing head; (3) heater; (4) fracturing tube; (5) constant pressure shear sheet; (6) energy releaser. The structure of CO2 blasting device [1,13,23]. (a) Photograph of CO2-Frac. (b) Sketch of CO2-Frac system.
Applsci 12 00068 g001
Figure 2. Phase transformation diagram of CO2.
Applsci 12 00068 g002
Figure 3. Working principal diagram of liquid CO2 phase-transition rock fracturing: (1) riser; (2) heater; (3) CO2-Frac; (4) constant pressure shear sheet; (5) energy releaser; (6) gaseous CO2.
Applsci 12 00068 g003
Figure 4. Schematic diagram of liquid CO2 phase-transition rock fracturing: (1) crushed zone; (2) crack area; (3) vibration area; (4) radical crack; (5) circumferential crack.
Applsci 12 00068 g004
Figure 5. Excavation location and photos.
Applsci 12 00068 g005
Figure 6. Schematic diagram of the aerial photography [27].
Applsci 12 00068 g006
Figure 7. Original image and processed image.
Applsci 12 00068 g007
Figure 8. The total volume of fragmentation caused by liquid CO2 phase-transition rock fracturing.
Applsci 12 00068 g008
Figure 9. Composition of fragmentation caused by liquid CO2 phase-transition rock fracturing.
Applsci 12 00068 g009
Figure 10. Fractal theory diagram [31].
Applsci 12 00068 g010
Figure 11. The fractal results of liquid CO2 phase-transition rock fracturing.
Applsci 12 00068 g011
Figure 12. Boreholes distribution of liquid CO2 phase-transition rock fracturing field test.
Applsci 12 00068 g012
Figure 13. Time-history curves of vibration velocity.
Applsci 12 00068 g013
Figure 14. FFT amplitude spectrum curves of vibration velocity.
Applsci 12 00068 g014
Figure 15. EMD decomposition.
Applsci 12 00068 g015
Figure 16. Hilbert spectrum of the signals.
Applsci 12 00068 g016
Figure 17. Instantaneous energy spectrum.
Applsci 12 00068 g017
Table 1. Parameters of CO2 phase-transition fracturing device.
ItemType 95Type 108
Outer diameter of CO2 phase-transition fracturing device (mm)95108
Length of CO2 phase-transition fracturing device (mm)13002000
Weight of single CO2 phase-transition fracturing device (kg)44100
Drill size (mm)120140
Number of single cracked holesSeveralSingle
Filling volume of liquid CO22.57
Table 2. The pore network parameters of CO2 phase-transition fracturing device.
Item95-Single95-Several108-Single108-Several
Diameter of drilling hole (mm)120120140140
Depth of drilling hole (m)4444
Number of single cracked holes2211
Number of drilling hole113113
Distance of drilling hole (Average m)01.501.5
Row spacing of drilling hole (Average m)01.501.5
Regional height facing vacancy (m)5555
Minimum distance of resistance line (Average m)0.30.30.30.3
Table 3. The cumulative percentage under the rock sieve and fractal results of liquid CO2 phase-transition rock fracturing.
Test ProjectCumulative Percentage of Volume under the Rock Sieve/%bFractal Dimension
(D)
Correlation Coefficient
<5<10<20<30<50<70<90<130<150<190<230
95-type single-hole0.717.1921.9242.4542.4599.99 2.0300.9700.982
95-type several-hole 0.010.261.562.905.598.1011.5225.1425.1442.64100.002.0730.9270.978
108-type single-hole0.081.3611.3926.8959.26100.00 2.8170.1830.988
108-type several-hole0.020.402.383.496.7911.3614.4520.5337.6799.99 1.9591.0410.978
Publisher’s Note: MDPI stays neutral with regard to jurisdictional claims in published maps and institutional affiliations.

