Article

Experimental Evaluation of the Blackbody Radiation Shift in the Cesium Atomic Fountain Clock

1
National Time Service Center, Chinese Academy of Sciences, Xi’an 710600, China
2
University of Chinese Academy of Sciences, Beijing 100049, China
3
Key Laboratory of Time and Frequency Primary Standards, Chinese Academy of Sciences, Xi’an 710600, China
*
Author to whom correspondence should be addressed.
Appl. Sci. 2022, 12(1), 510; https://doi.org/10.3390/app12010510
Submission received: 12 October 2021 / Revised: 30 December 2021 / Accepted: 4 January 2022 / Published: 5 January 2022
(This article belongs to the Special Issue Applications of Atomic Physics and Atomic Interferometry)

Abstract

:
The cesium atomic fountain clock is the world’s most accurate microwave atomic clock. The uncertainty of blackbody radiation (BBR) shift accounts for an increasingly large percentage of the uncertainty associated with fountain clocks and has become a key factor in the performance of fountain clocks. The uncertainty of BBR shift can be reduced by improving the system environment temperature. This study examined the mechanism by which the BBR shift of the transition frequency between the two hyperfine energy levels of the 133Cs ground state is generated and the calculation method for the BBR shift in the atomic fountain. Methods used to reduce the uncertainty of BBR shift were also examined. A fountain system structure with uniform temperature and good heat preservation was designed, and related technologies, such as that for measuring the temperature of the cesium fountain system, were studied. The results of 20 days of measurements, in combination with computer simulation results, showed that the temperature uncertainty of the atomic action zone is 0.12 °C and that the resulting uncertainty of BBR shift is 2.4 × 10⁻¹⁷.

1. Introduction

The cesium atomic fountain clock is the most advanced microwave frequency standard in the world and is used for many purposes, such as frequency measurement, international atomic time calibration [1], high-precision spectroscopy [2], testing basic physical theories [3], and measuring basic physical constants [4]. With the development of fountain clocks and the continuous improvement of uncertainty evaluation technology, it is very important to evaluate the frequency shifts and related uncertainties of cesium atomic fountain clocks. When the frequency uncertainty of a fountain clock reaches an order of magnitude of 10−16, the influence of the blackbody radiation (BBR) shift on the uncertainty of the fountain clock becomes a key factor in the further improvement of the clock performance [5,6].
According to performance analyses of fountain clocks at research institutes in various countries, the uncertainty of BBR shift accounts for a large part of the total frequency uncertainty of fountain clocks. Laboratories have adopted a variety of design schemes to reduce the influence of the uncertainty of BBR shift on the performance of fountain clocks. There are two ways to reduce this uncertainty. One is to control the temperature fluctuations in the atomic flight zone. The Physikalisch-Technische Bundesanstalt (PTB) designed a copper vacuum pipeline for the atomic flight zone in its cesium fountain clock CSF2 to ensure the good temperature uniformity of the atomic flight path, and placed four PT100 temperature sensors along the vertical length of the outer wall of the copper pipeline to obtain accurate temperature measurements. The uncertainty of BBR shift determined for the cesium fountain clock was 6.3 × 10⁻¹⁷ [7,8]. In the cesium fountain clock FCs2 designed by the National Research Institute of Canada (NRC), the vacuum pipeline of the atomic flight zone uses a double-walled aluminum structure to act as a water jacket. The water from the temperature-controlled water chilling unit is circulated through the water jacket to stabilize the temperature of the free flight zone and the microwave resonant cavity, and a copper flight tube is set above the resonant cavity to ensure a uniform temperature in the atomic flight area. Three T-type thermocouples are placed along the length of the water cooling jacket to monitor the temperature, and the resulting uncertainty of the BBR shift in the cesium fountain clock is 7.0 × 10⁻¹⁷ [9].
Another method is to lower the temperature of the atomic flight zone. In attempting to reduce the uncertainty of BBR shift, the US National Institute of Standards and Technology (NIST) and the Italian National Institute of Metrology (INRIM) have begun to develop cryogenic fountain clocks that create a continuous and stable cryogenic environment for the resonant cavity and fountain tube by cooling with liquid nitrogen, thereby reducing the ambient temperature and reducing the sensitivity coefficient of the BBR shift [10,11]. However, it is difficult to develop a cryogenic liquid nitrogen fountain clock, which needs high funding support [10]. In a comprehensive comparison, the room-temperature fountain clock was found to have significant advantages.
In this study, we conduct a theoretical analysis of the mechanism of the BBR shift, and briefly describe the theoretical calculation of the uncertainty of BBR shift in the cesium fountain clock and our analysis of the methods used to reduce this uncertainty. With the cesium fountain clock in a room temperature environment as its focus, a fountain system structure with uniform temperature and good heat preservation was obtained through design of the physical structure, and related technologies, such as measurement of the temperature of the cesium fountain clock system, were studied. Over the course of 20 days of experimental measurements, the changes in the temperature distribution of the vacuum pipe in the atomic flight zone of the fountain clock with time were determined. To better explain the temperature distribution and changes in the atomic flight zone, computer simulations were conducted using the measurement results. The results showed that the temperature uncertainty of the atomic flight zone was less than 0.12 °C, and the resulting uncertainty of BBR shift was 2.4 × 10⁻¹⁷, which corresponds to the international advanced level [7,8,9,12].

2. Theoretical Research on the Blackbody Radiation (BBR) Shift

BBR refers to the phenomenon by which objects at certain temperatures radiate electromagnetic waves. This radiation field has a broad frequency spectrum and can cause changes in the atomic energy levels. In the atomic free flight zone of the cesium fountain clock, cold atoms interact with an equilibrium thermal radiation field of approximately 300 K, and the movement of the hyperfine energy level causes a frequency shift of the cesium fountain clock [13].
The thermal radiation emitted by a blackbody heated to a given temperature T has a spectrum given by Planck’s law [12,14]:
ρ ν = 8 π h ν 3 c 3 1 e h ν / k B T 1
where h is Planck’s constant, c is the speed of light, and k B is the Boltzmann constant. ρ ν is the energy density of the BBR field, in J/Hz/m3. BBR exhibits a very broad spectrum at room temperature [15]. 
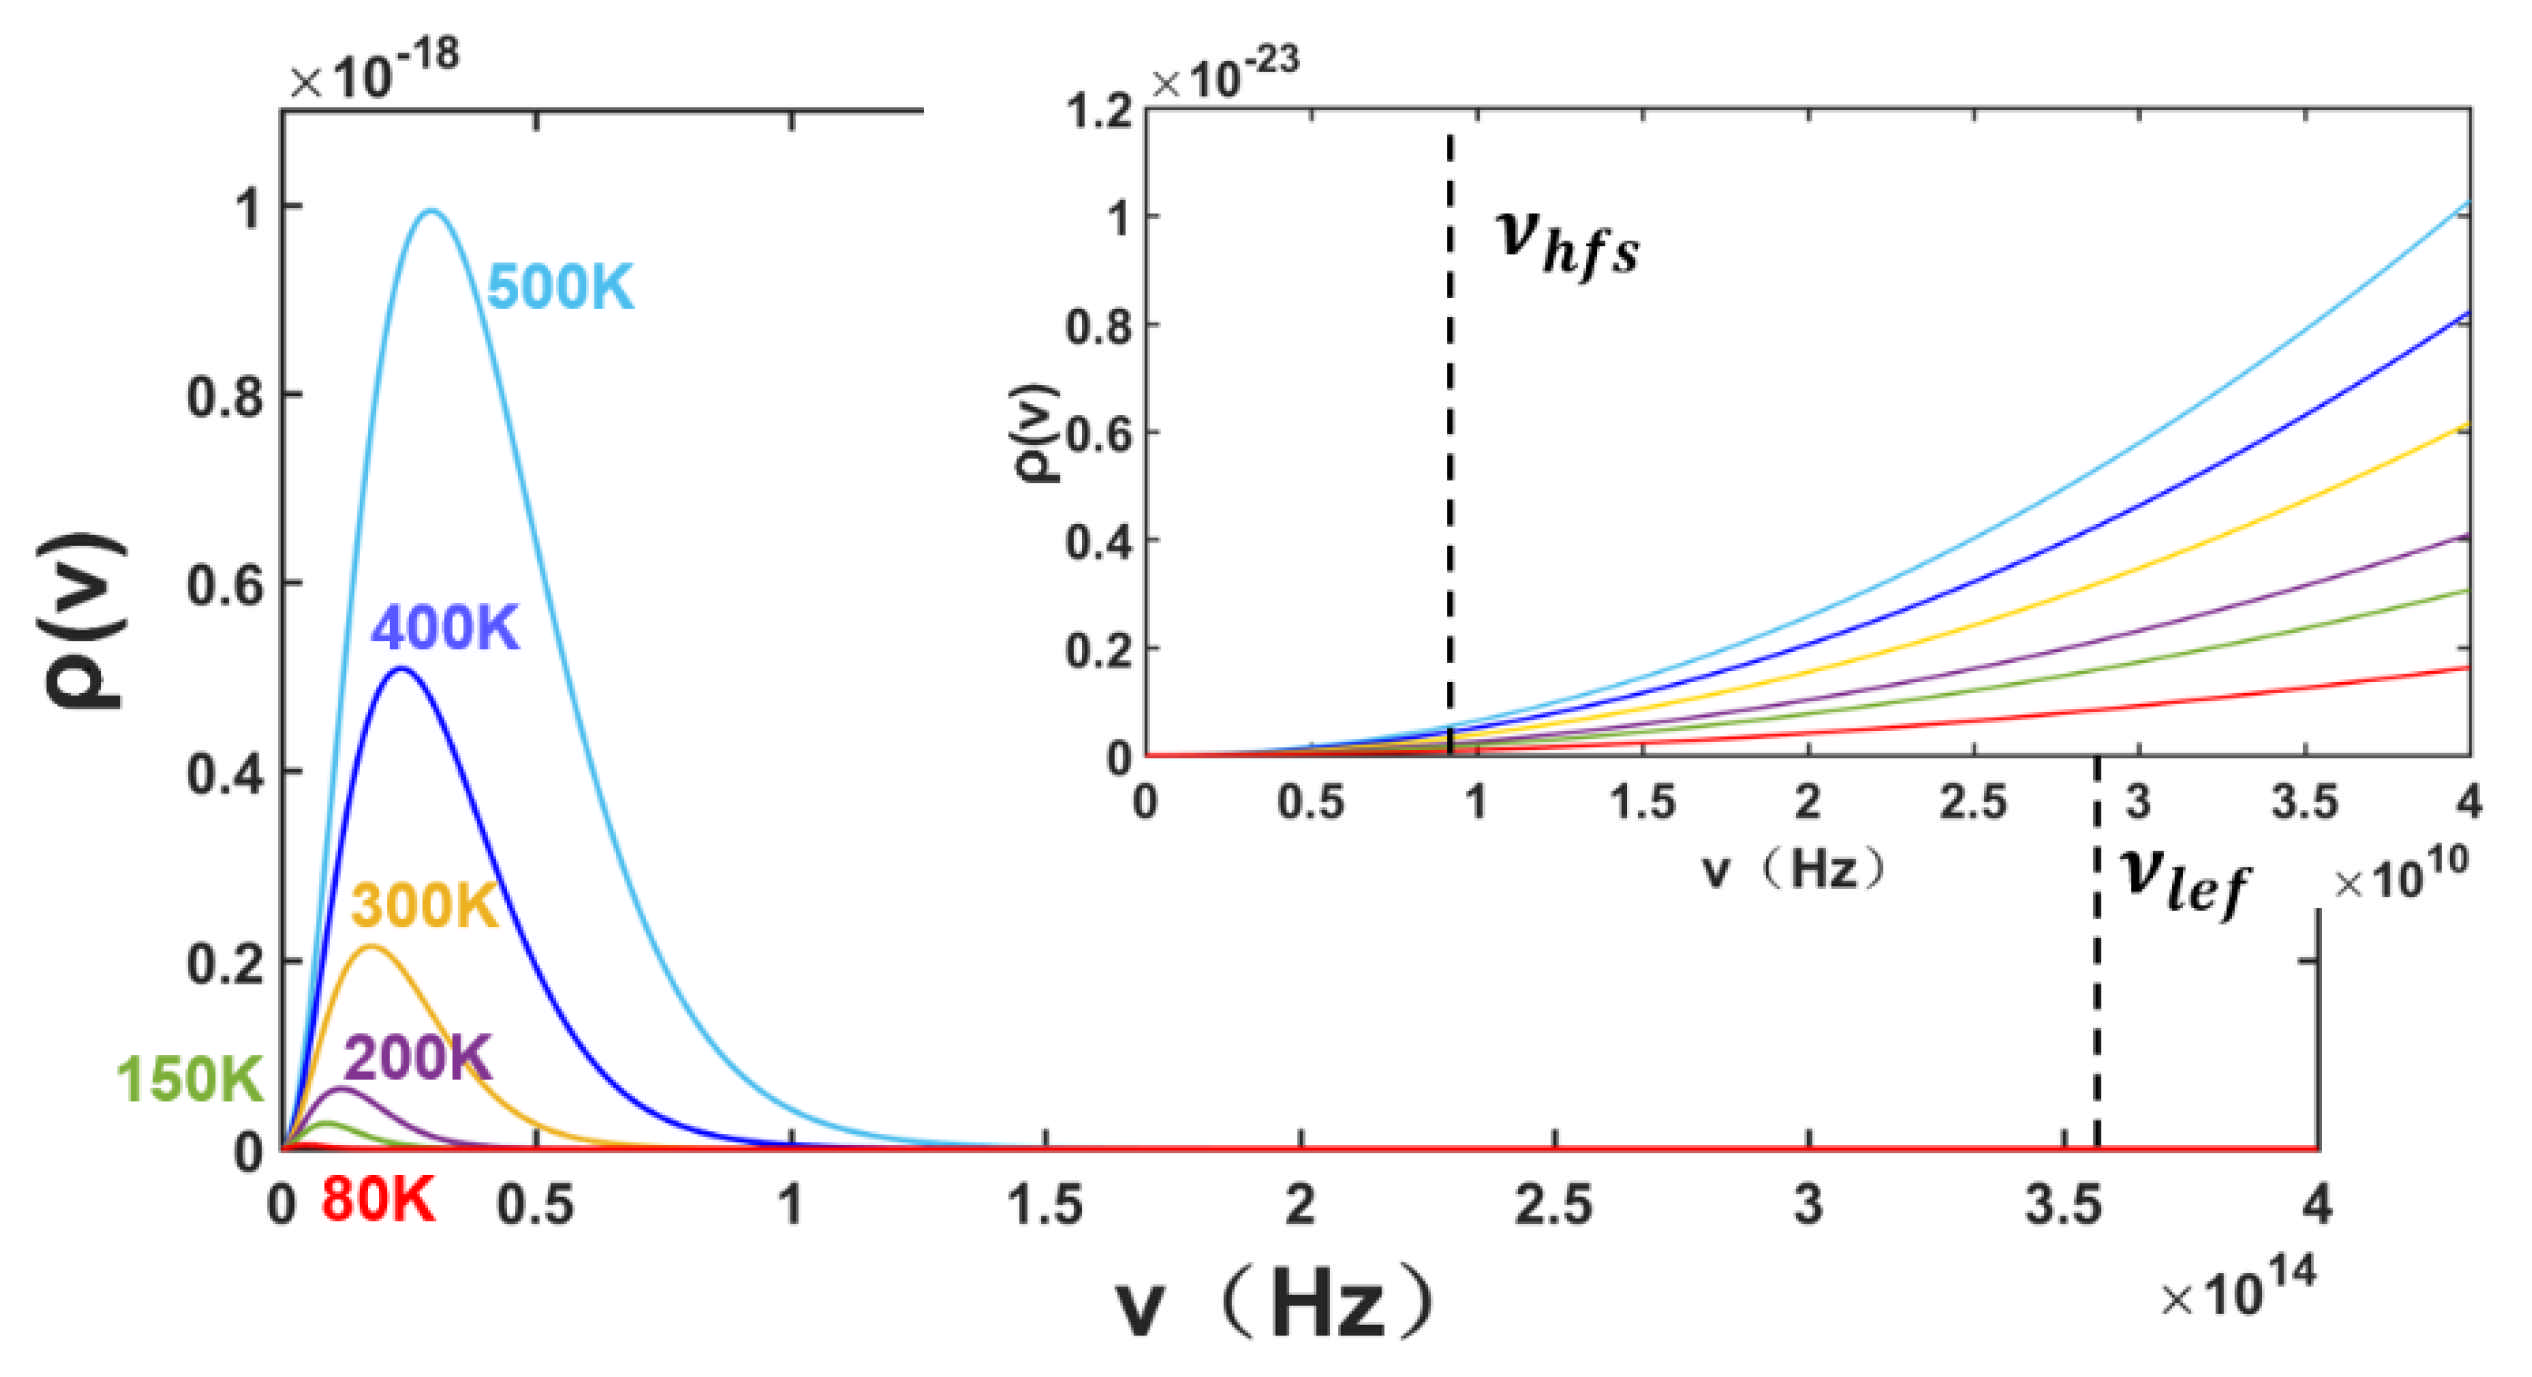
Figure 1 shows the relationship between the spectral density of a BBR field ρ ν and the frequency for several temperatures of the blackbody. The inset shown in Figure 1 is a partial enlargement with frequency in the range of 0 to 4 × 10¹⁰. ν h f s denotes the hyperfine splitting frequency in the ground state, and ν l e f denotes the lowest allowed electric dipole transition frequency.
The superfine energy level of cesium atoms interacts with the BBR field, and the energy level shift is affected by the adjacent energy level. The magnetic dipole transition in the microwave frequency band and line D2 of the electrical dipole transition in the optical frequency band have the greatest impact on the energy level shift.
The perturbation of the magnetic dipole transition on the ground-state energy level is mainly the second-order Zeeman effect of the BBR field on the transition 6 2 S 1 / 2 , F = 4 , m F = 0 6 2 S 1 / 2 , F = 3 , m F = 0 [16]. Assuming there is a pure two-level quantum system subject to random perturbations, for a temperature of approximately 300 K the influence of the BBR field near the resonance part can be ignored because the contributions to the first-order transition by the two sides of the resonance point offset each other. The energy of the BBR field is mainly concentrated in the frequency ν ν h f s , where only the component of the random magnetic field in the direction of the C-field (the C-field is a static magnetic field produced by a long coil and used to provide aquantization axis) has an effect on the clock transition 4 , 0 3 , 0 . Therefore, one third of the isotropic magnetic field induction energy contributes to the AC Zeeman frequency shift:
ν h f s ν h f s = g j + g i 2 μ B 2 3 h 2 ν ν h f s 1 2 B ν 2 ν h f s 2 ν 2 d ν μ 0 g j + g i 2 μ B 2 3 h 2 0 ρ ν ν 2 d ν = 4 9 π 3 μ 0 g j + g i 2 μ B 2 k T 2 c h 3 = 1.304 × 10 17 T 300 2
where B ν is the amplitude of the magnetic induction component that oscillates at the frequency ν, and g j and g i are the electron g-factor and nuclear g-factor, respectively. It can be observed that at room temperature, the frequency shift caused by the AC Zeeman effect owing to the BBR magnetic field is of the order of 10−17, which is negligible compared to the other perturbations considered here.
It can be observed from Figure 1 that the energy of the BBR spectrum is concentrated around 20 THz, which is much smaller than the electronic dipole transition frequencies of 335 THz for line D1 and 352 THz for line D2. This means that the BBR electric field can be approximated as a weak, slowly changing, non-resonant AC electric field [17]. The influence of the BBR field can be approximated as a second-order Stark effect produced by the electrostatic field, which depends on the root mean square value of the electric field strength, and can be solved by perturbation theory. Since the induced electric dipole moment is directional, the tensor form of the polarizability must be used here. For the electric field acting on a single-electron atom, the energy change can be expressed as follows:
E S t a r k = i , j K i , j E i E j i , j x , y , z
where Ki,j is a 3 × 3 matrix. Taking the direction of the C-field as the z axis, owing to the rotational symmetry between the x and y directions, Kx,x = Ky,y = K1 and Kz,z = K2 can be set, and the Stark shift caused by the electric field can be expressed as follows:
E S t a r k = K 1 E x 2 + K 1 E y 2 + K 2 E z 2 = E 2 K 1 + K 2 K 1 cos 2 θ
where the first part is the scalar polarizability independent of the direction of the magnetic field, and the second part is the direction-dependent tensor polarizability. The tensor part is zero when we average over all directions. Using spherical tensor analysis, the frequency shift of the transition sub-level of a cesium fountain clock caused by the DC Stark effect in the BBR field is calculated, and the frequency shift of the clock transition can thus be obtained [18]:
ν S t a r k = 1 h E F = 4 , m F = 0 E F = 3 , m F = 0 = 1 2 E 2 16 7 α 10 h + 1 7 α 12 h  
In this formula, the contributions of contact and spin dipole–dipole interaction correspond to the scalar polarizability α 10 and the tensor polarizability α 12 , respectively. The average contribution of the tensor polarization rate to the frequency shift is zero. The scalar polarizability α 10 can be obtained by theoretical calculation and experimental measurement [19]. The DC Stark frequency shift caused by the BBR field is determined from the root mean square of the electric field intensity. After substituting this into Equation (3), the theoretical value of the impact of the BBR shift on the clock transition at temperature T can be obtained as follows:
ν B B R = 8 7 α 10 h E 2 ν   = 8 α 10 7 h 831.9 V / m 2 T 300 4
A more accurate analysis of the BBR shift needs to consider the quantum characteristics of the BBR field. In 1981, Itano et al. proposed an approximate method [20]. Taking into account the frequency spectrum distribution of the electronic dipole lines D1 and D2, the corrective term about T6 was obtained, which accounts for the BBR spectrum with respect to the DC Stark shift of the Cs clock transition, and the expression for the total BBR shift is obtained as follows [15]:
ν B B R ν 0 = β T T 0 4 1 + ε T T 0 2
where T0 = 300 K and ε = 1.4 × 10⁻² [19], β can be obtained by theoretical calculation or experimental measurement; here, we take the direct measurement value in [21], β = (−1.43 ± 0.09) × 10−14.
The uncertainty of BBR shift describes the sensitivity of the BBR shift to temperature fluctuations. The following expression of the uncertainty of BBR shift can be derived:
ν BBR ν 0 = 6 β ε T T 0 5 + 4 β T T 0 3 T T 0
where ΔT denotes the change of temperature. According to this formula, we can see that the uncertainty of BBR shift can be reduced by two methods. The first method is lowering the working environment temperature T. Lowering the temperature can reduce the sensitivity coefficient of the uncertainty of BBR shift, thereby greatly reducing the uncertainty of BBR shift in a fountain clock. The cryogenic cesium fountain clock is based on this principle. The second method is reducing the uncertainty of the temperature, because the uncertainty of BBR shift is proportional to the uncertainty of the temperature. For every 0.1 °C decrease in the temperature uncertainty at T = 300 K, the uncertainty of BBR shift decreases by 2.0 × 10⁻¹⁷ approximately. For room-temperature fountain clocks, reducing the uncertainty of the system temperature is the most commonly used method to reduce the uncertainty of BBR shift.

3. System Design and Temperature Measurement Research on Atomic Flight Zone of the Cesium Fountain Clock

The cesium atomic fountain clock NTSC-F2 is described in [22]. To evaluate the BBR shift of the fountain clock system during stable operation, the temperature distribution for the atomic flight trajectory of the cesium fountain clock must be determined. The method adopted was to place temperature sensors near the atomic flight area to conduct real-time monitoring of the system temperature. To reduce the uncertainty of BBR shift of the cesium fountain clock, cesium atoms need to travel in an environment with a uniform temperature. The temperature uniformity of the atomic flight zone has two components: the uniformity of the spatial temperature distribution and the stability of the temperature over time. For this reason, it was necessary to conduct system design and temperature measurement research on the atomic flight zone of the cesium fountain clock in this study.

3.1. Constant Temperature Structure Design of Fountain System

As shown in Figure 2, the temperature of the laboratory where the fountain clock locates is controlled by a two-stage water-cooled air conditioning system, which has a good temperature stability. During the continuous measurements, the temperature fluctuation range is within ±0.5 °C. When the fountain clock physical system was placed directly in the laboratory environment, the temperature of the overall system fluctuated as the laboratory temperature fluctuated, which does not meet the temperature requirements of the system. Overall temperature control is performed on the physical system of the fountain clock, and an insulation layer is installed on the outer wall of the system for temperature control, thereby reducing the temperature fluctuation of the entire physical system.
Figure 3 illustrates the physical system temperatures before and after the installation of the insulation layer outside the fountain clock system. Measurements were performed for 20 days for each of the two conditions. Before the insulation layer was added, the temperature fluctuation of the system was 1 °C. After the insulation layer was added, the temperature fluctuation range was limited to within 0.3 °C, indicating greatly improved temperature stability performance of the system.
According to the requirements for the physical system for a temperature and magnetic field environment, a 5 mm-thick aluminum C-field cylinder layer and four layers of 2 mm-thick inter-phase permalloy magnetic shielding cylinder were installed outside the vacuum pipeline of the atomic flight zone. With the insulation protection provided by these five metal layers, the temperature of the vacuum pipeline in the atomic flight zone would become more stable compared with the temperature measured in Figure 3. In addition, the vacuum pipeline of the atomic flight zone of the cesium fountain clock is made of titanium alloy and the resonant cavity is made of oxygen-free copper, both of which are metals that have good thermal conductivity and can make the temperature distribution more uniform. In order to make the temperature distribution of the resonant cavity and the vacuum cavity of the atomic flight zone consistent, the resonant cavity bracket was also made of oxygen-free copper.
In practical applications, if the temperature sensors and wires are arranged inside the vacuum chamber, the temperature inside the vacuum chamber can be accurately obtained; however, the vacuum degree of the system will be affected. Therefore, in the design of the physical vacuum system, after many measurements and improvements, three Pt100 platinum resistance temperature sensors were installed on the outer wall of the vacuum chamber pipe in the atomic flight zone to obtain the temperature distribution of the outer wall of the vacuum chamber without affecting the vacuum of the system. The specific installation locations are shown in Figure 4.

3.2. Temperature Measurement Research of Atomic Flight Zone

To improve the spatial uniformity of the temperature in the atomic flight zone, it was necessary not only to design the system to make the temperature distribution of the resonant cavity and the free flight zone as stable and uniform as possible but also to accurately measure the temperature at each point. According to Formula (8), the uncertainty of BBR shift is strongly correlated to the uncertainty of the temperature measurement. A platinum resistance temperature sensor was used to measure the temperature at each point in real time. Heat conduction is a problem that needs to be addressed in temperature measurement. Among the current methods for dealing with the thermal conductivity of temperature sensors is the use of glue or a screw to attach the temperature sensor to the surface of the device in question. However, since the side wall of the vacuum metal cavity is a curved structure, there will be a gap if the sensor is attached directly to the wall. Because the thermal conductivity of air is only 0.024 W/(m·K), it is a poor conductor of heat, which increases the contact thermal resistance and significantly hinders the conduction of heat; this makes the temperature measurement inaccurate. In this study, we chose to use indium metal, which has a lower hardness and higher thermal conductivity, as the thermally conductive material in the experiment.
The specific solution for temperature measurement was the following: a temperature-measuring platinum resistor was arranged between two indium sheets, which were fixed to the outer wall of the vacuum chamber using an oxygen-free copper band. The indium sheet had a low hardness at room temperature and was able to achieve close contact with the temperature-measuring resistor and the metal cylinder. The heat-conducting property was greatly improved as a result. In addition, a copper band was used to fix the indium sheet. The copper band had good thermal conductivity, was not easily deformable, and prevented the generation of a magnetic field in the system environment.
The thermometer was a FLUKE-1529 series four-channel thermometer, the sensors were PT100 platinum resistors, a four-wire connection method was adopted, and the influence of cable resistance fluctuation on the temperature measurement was eliminated. We matched and connected the four-channel thermometer with the sensors and carried out a calibration. The calibration results are shown in Table 1. The deviation between the displayed measured value and the actual standard temperature value can be deducted in the calculation; thereafter, we obtain the accurate temperature distribution result.

4. Temperature Simulation and Analysis

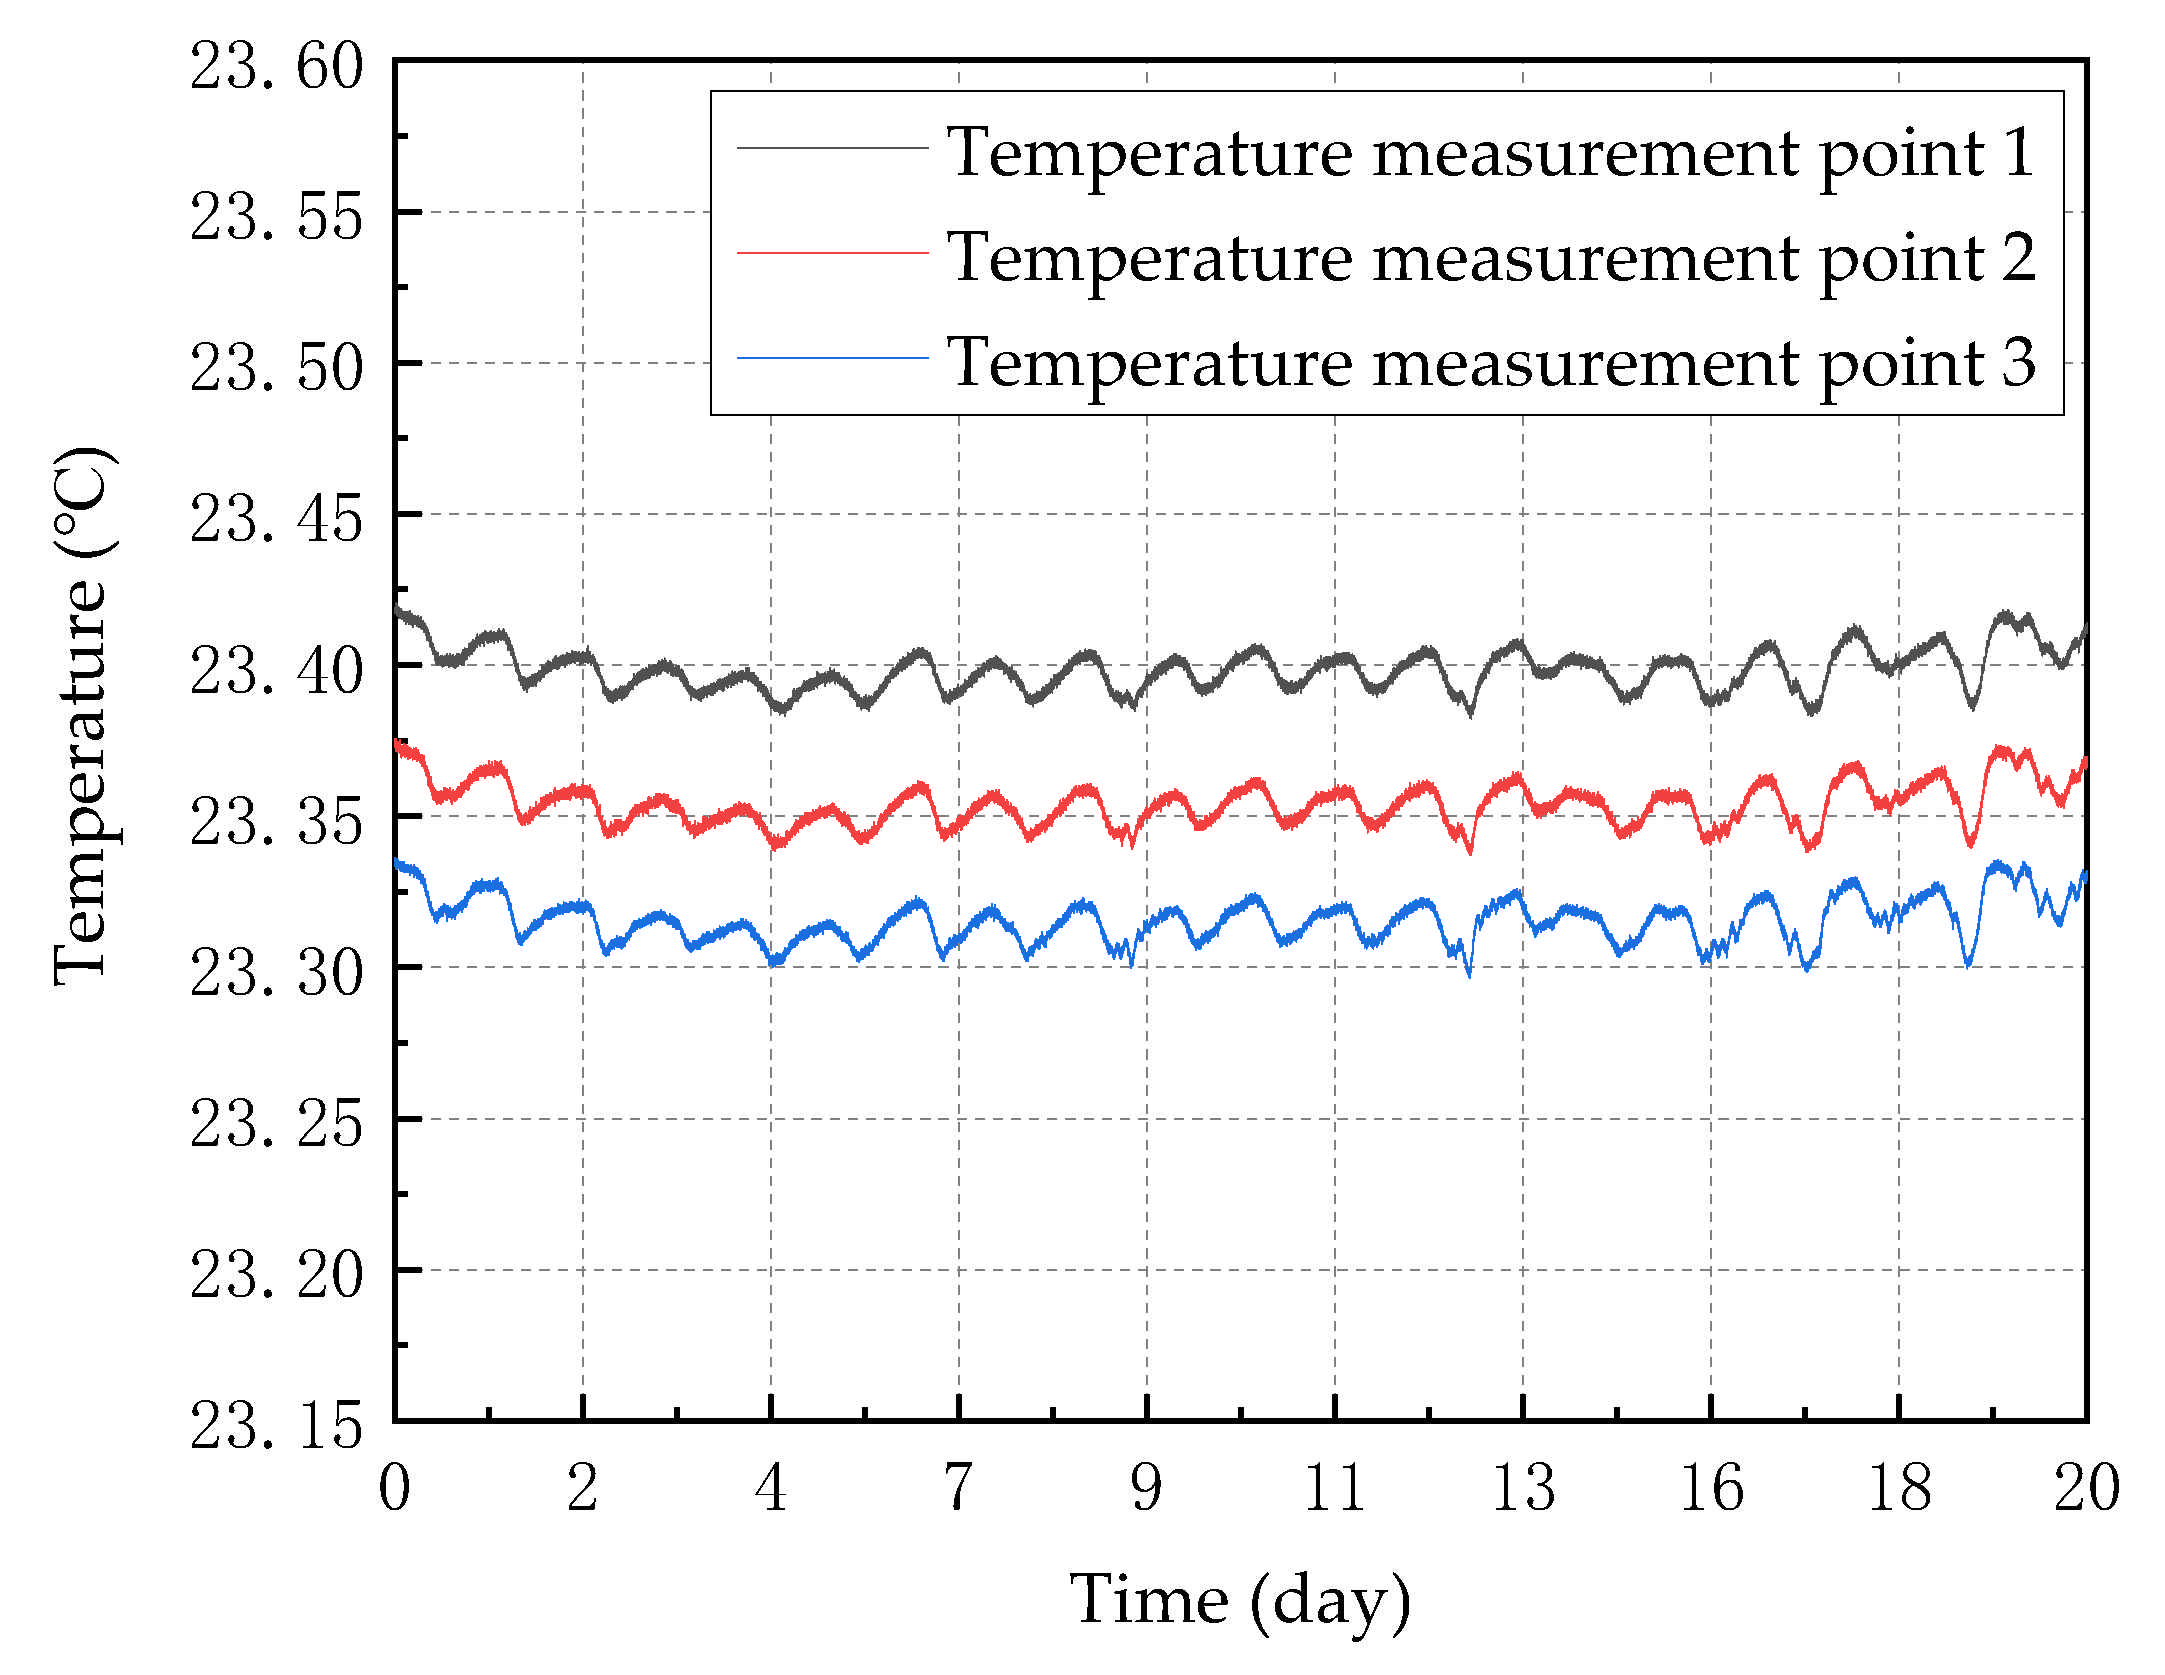
After the temperature system had been improved, when the cesium fountain clock was operating normally and the system temperature had reached equilibrium, we monitored the temperature at the positions of the three Pt100 temperature sensors installed on the outer wall of the vacuum chamber for a long period of time, and obtained the curve of the change in temperature at each measurement point under normal operation (Figure 5 shows the temperature values after deduction of the calibrated deviation).
The temperature measurement results shown in Figure 5 represent the temperature distribution at the temperature measurement point on the outer wall of the vacuum pipe in the atomic flight zone, which theoretically cannot fully represent the atomic flight trajectory temperature of the fountain clock. In order to more accurately represent the spatial distribution of the temperature in the atomic flight zone and its variation over time, the finite element method was used to simulate the temperature distribution of the vacuum cavity and its interior, so as to obtain the temperature distribution of the resonant cavity and the atomic flight zone. We constructed a physical mechanical model, including the corresponding vacuum cavity, resonant cavity, resonant cavity bracket, and vacuum partial filler, and then defined the material properties of the model. The material of the vacuum cavity was TC4 titanium alloy (Ti-6Al-4V), and the material of the resonant cavity and its bracket were oxygen-free copper. The properties of the materials related to the temperature analysis, including the thermal conductivity, heat capacity, density, and other temperature-related parameters, were established. The vacuum part of the cavity was modelled as a substance, and its thermal conductivity, specific heat, density, and emissivity were set to approximate a vacuum environment.
According to the results of the long-term monitoring of the temperature measurement points on the outer wall of the vacuum chamber shown in 
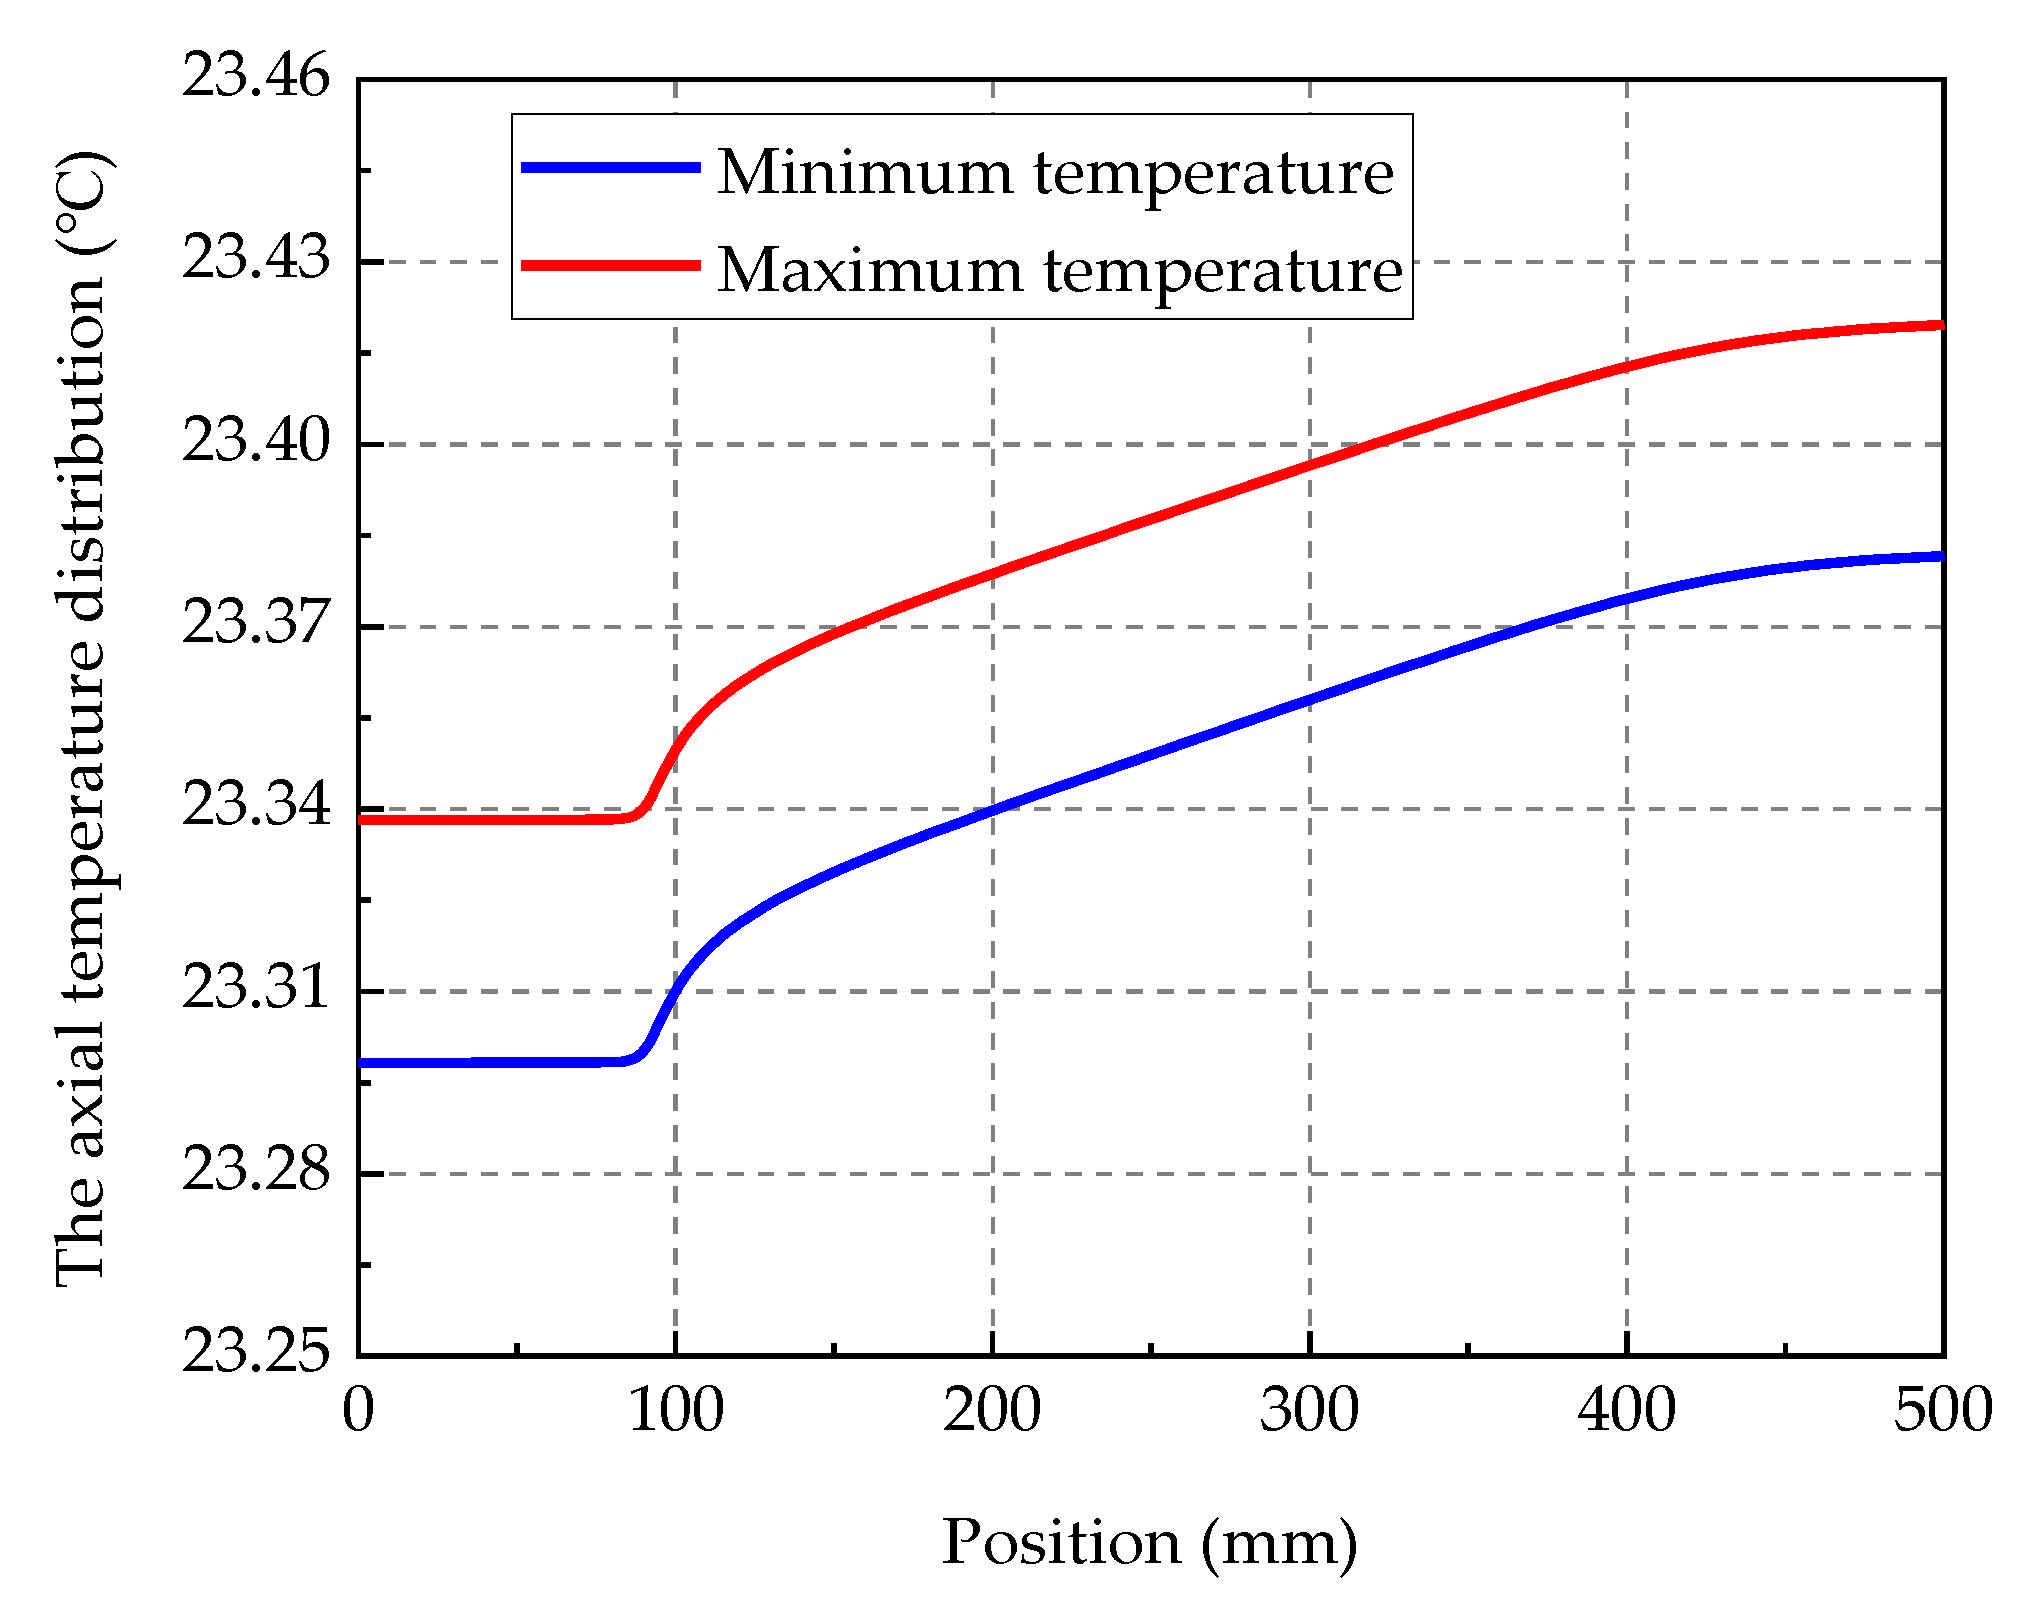
Figure 5, the temperature distribution of the vacuum chamber gradually increases from bottom to top, and the temperature change trends of the three temperature measurement points are completely consistent. Therefore, we performed only a thermal steady-state analysis of the two conditions of the lowest temperature and the highest temperature on the measurement curve to obtain the temperature distribution range of the resonant cavity and the atomic flight zone. We fixed the temperature for two cases. In the first case, the temperatures of the circumferential surface of the narrow-band vacuum chamber corresponding to temperature measurement points 1, 2, and 3 were set to the lowest temperatures of the temperature curve at the corresponding points, namely, 23.382 °C, 23.337 °C, and 23.296 °C, and a thermal steady-state simulation was performed. In the second case, the temperatures of the circumferential surface of the narrow-band vacuum chamber corresponding to the temperature measurement points 1, 2, and 3 were set to the highest temperatures of the temperature curve at the corresponding points, namely, 23.420 °C, 23.376 °C, and 23.336 °C, and a thermal steady-state simulation was performed. The temperature distribution curve of the central axis of the atomic flight zone in the two cases is shown in Figure 6.
It can be seen from the measurement and simulation results that after the system reaches equilibrium, the spatial temperature fluctuation of the central axis of the atomic free flight zone is less than 0.1 °C, and the temporal temperature fluctuation is less than 0.05 °C. The temperature uncertainty caused by the sensors and the thermometer measurement is less than 0.02 °C, and the total temperature uncertainty caused by the three factors is less than 0.12 °C. The uncertainty of BBR shift, according to Formula (8), was 2.4 × 10⁻¹⁷.

5. Conclusions

Reducing the uncertainty of BBR shift in the cesium fountain clock plays a vital role in improving its performance. The uncertainty of BBR shift in the room-temperature fountain clock is mainly affected by the temperature fluctuations in the atomic flight zone. In this study, through theoretical analysis and experimental testing, a fountain system structure with uniform temperature and good heat preservation was designed, and new methods of measurement of the temperature of the fountain clock system were researched. The temperature of the outer wall of the vacuum pipe in the atomic flight zone was accurately measured experimentally, and the temperature distribution and changes in the resonant cavity and the atomic flight zone were obtained from the results of finite element analysis. The total temperature uncertainty was less than 0.12 °C, and the resulting uncertainty of BBR shift was 2.4 × 10⁻¹⁷, which corresponds to the international advanced level. In view of the current problem of the large uncertainty of the BBR shift in the cesium fountain clock at room temperature, we will carry out further research on the cryogenic cesium fountain clock in the future, with the goal of greatly reducing the sensitivity coefficient of this uncertainty using the liquid nitrogen cooling method, thereby reducing the uncertainty of the frequency shift in the fountain clock and improving its performance.

Author Contributions

Conceptualization, F.Y. and X.W.; methodology, F.Y. and X.W.; software, D.L.; validation, J.R. and Q.H.; formal analysis, Y.G.; investigation, J.S.; resources, J.R.; data curation, S.F. and H.Z.; writing—original draft preparation, F.Y.; writing—review and editing, F.Y.; visualization, Y.B.; supervision, S.Z.; project administration, J.R.; funding acquisition, J.R. All authors have read and agreed to the published version of the manuscript.

Funding

This research was funded by Chinese Academy of Sciences for Western Young Scholars, grant number XAB2018A06, XAB2018B16, and XAB2019A07; Large Research Infrastructures Improvement Funds of Chines Academy of Sciences, grant number DSS-WXGZ-2020-0005; and National Natural Science Foundation of China, grant number 12173044.

Institutional Review Board Statement

Not applicable.

Informed Consent Statement

Not applicable.

Data Availability Statement

Data are contained within the article.

Conflicts of Interest

The authors declare no conflict of interest.

References

  1. Bauch, A. Caesium atomic clocks: Function, performance and applications. Meas. Sci. Technol. 2003, 14, 1159–1173. [Google Scholar] [CrossRef]
  2. Niering, M.; Holzwarth, R.; Reichert, J.; Pokasov, P.; Udem, T.; Weitz, M.; Hänsch, T.W.; Lemonde, P.; Santarelli, G.; Abgrall, M.; et al. Measurement of the hydrogen 1S- 2S transition frequency by phase coherent comparison with a microwave cesium fountain clock. Phys. Rev. Lett. 2000, 84, 5496–5499. [Google Scholar] [CrossRef] [PubMed]
  3. Guena, J.; Abgrall, M.; Rovera, D.; Rosenbusch, P.; Tobar, M.E.; Laurent, P.; Clairon, A.; Bize, S. Improved tests of Local Position Invariance using 87Rb and 133Cs fountains. Phys. Rev. Lett. 2012, 109, 080801. [Google Scholar] [CrossRef] [PubMed] [Green Version]
  4. Landau, S.J.; Vucetich, H. Testing theories that predict time variation of fundamental constants. Astrophys. J. 2002, 570, 463–469. [Google Scholar] [CrossRef] [Green Version]
  5. Heavner, T.P.; Parker, T.E.; Shirley, J.H.; Donley, L.; Jefferts, S.R.; Levi, F.; Calonico, D.; Calosso, C.; Costanzo, G.; Mongino, B. Comparing room temperature and cryogenic cesium fountains. In Proceedings of the 2011 Joint Conference of the IEEE International Frequency Control and the European Frequency and Time Forum (FCS) Proceedings, San Francisco, CA, USA, 2–5 May 2011. [Google Scholar]
  6. Rosenbusch, P.; Zhang, S.; Clairon, A. Blackbody radiation shift in primary frequency standards. In Proceedings of the 2007 IEEE International Frequency Control Symposium Joint with the 21st European Frequency and Time Forum, Geneva, Switzerland, 29 May–1 June 2007. [Google Scholar]
  7. Gerginov, V.; Nemitz, N.; Weyers, S.; Schroder, R.; Griebsch, D.; Wynands, R. Uncertainty evaluation of the caesium fountain clock PTB-CSF2. Metrologia 2010, 47, 65–79. [Google Scholar] [CrossRef]
  8. Weyers, S.; Gerginov, V.; Kazda, M.; Rahm, J.; Lipphardt, B.; Dobrev, G.; Gibble, K. Advances in the accuracy, stability, and reliability of the PTB primary fountain clocks. Metrologia 2018, 55, 789–805. [Google Scholar] [CrossRef] [Green Version]
  9. Beattie, S.; Jian, B.; Alcock, J.; Gertsvolf, M.; Hendricks, R.; Szymaniec, K.; Gibble, K. First accuracy evaluation of the NRC-FCs2 primary frequency standard. Metrologia 2020, 57, 035010. [Google Scholar] [CrossRef]
  10. Heavner, T.P.; Donley, E.A.; Levi, F.; Costanzo, G.; Parker, T.E.; Shirley, J.H.; Ashby, N.; Barlow, S.; Jefferts, S.R. First accuracy evaluation of NIST-F2. Metrologia 2014, 51, 174–182. [Google Scholar] [CrossRef]
  11. Calonico, D.; Levi, F.; Godone, A.; Costanzo, G.A.; Micalizio, S.; Calosso, C.E. Accuracy evaluation of ITCsF2: A nitrogen cooled caesium fountain. Metrologia 2014, 51, 270–284. [Google Scholar]
  12. Safronova, M.S.; Jiang, D.; Arora, B.; Clark, C.W.; Kozlov, M.G.; Safronova, U.I.; Johnson, W.R. Black-body radiation shifts and theoretical contributions to atomic clock research. IEEE Trans. Ultrason. Ferroelectr. Freq. Control 2009, 57, 94–105. [Google Scholar] [CrossRef] [PubMed] [Green Version]
  13. Beloy, K.; Safronova, U.I.; Derevianko, A. High-accuracy calculation of black-body radiation shift in 133Cs primary frequency standard. Phys. Rev. Lett. 2006, 97, 040801. [Google Scholar] [CrossRef] [PubMed] [Green Version]
  14. Angstmann, E.J.; Dzuba, V.A.; Flambaum, V.V. Frequency shift of hyperfine transitions due to blackbody radiation. Phys. Rev. A 2006, 74, 23405. [Google Scholar] [CrossRef] [Green Version]
  15. Zhang, S. Déplacement de Fréquence dû au Rayonnement du Corps Noir dans une Fontaine Atomique à Césium et Amélioration des Performances de l’Horloge. Ph.D. Dissertation, Université Pierre et Marie Curie, Paris, France, 2004. [Google Scholar]
  16. Vanier, J.; Audoin, C. The Quantum Physics of Atomic Frequency Standards; IOP Publishing: Bristol, UK, 1989; pp. 7–40. [Google Scholar]
  17. Farley, J.W.; Wing, W.H. Accurate calculation of dynamic stark shifts and depopulation rates of Rydberg energy levels induced by black-body radiation. Hydrogen, helium, and alkali-metal atoms. Phys. Rev. A 1981, 23, 2397. [Google Scholar] [CrossRef]
  18. Simon, E.; Laurent, P.; Clairon, A. Measurement of the Stark shift of the Cs hyperfine splitting in an atomic fountain. Phys. Rev. A 1998, 57, 436–439. [Google Scholar] [CrossRef]
  19. Micalizio, S.; Godone, A.; Calonico, D.; Levi, F.; Lorini, L. Black Body Radiation Shift of the 133Cs Hyperfine Transition Frequency. Phys. Rev. A 2004, 69, 053401. [Google Scholar] [CrossRef] [Green Version]
  20. Itano, W.M.; Lewis, L.L.; Wineland, D.J. Shift of 2S1/2 hyperfine splittings due to blackbody radiation. Phys. Rev. A 1982, 25, 1233–1235. [Google Scholar] [CrossRef]
  21. Levi, F.; Calonico, D.; Lorini, L.; Micalizio, S.; Godone, A. Measurement of the blackbody radiation shift of the 133Cs hyperfine transition in an atomic fountain. Phys. Rev. A 2004, 70, 423–433. [Google Scholar] [CrossRef] [Green Version]
  22. Shi, J.; Wang, X.; Bai, Y.; Yang, F.; Zhang, S. Evaluation of second-order Zeeman frequency shift in NTSC-F2. Chin. Phys. B 2021, 30, 070601. [Google Scholar] [CrossRef]
Figure 1. Spectral density of blackbody radiation (BBR) for six temperatures.
Applsci 12 00510 g001
Figure 2. Temperature annunciator.
Applsci 12 00510 g002
Figure 3. Physical system temperature measurement: (a) before adding the insulation layer; (b) after adding the insulation layer.
Applsci 12 00510 g003
Figure 4. Distribution of temperature measurement points of the system.
Applsci 12 00510 g004
Figure 5. Temperature measurement results.
Applsci 12 00510 g005
Figure 6. Temperature distribution on the central axis of the atomic flight zone.
Applsci 12 00510 g006
Table 1. Thermometer calibration results.
Nominal Temperature (°C) 18222630
Standard Values (°C) 17.99521.99225.99730.023
Channel NumberDisplayed Value (°C)
Ch118.008122.011726.018430.0461
Ch218.070722.074326.078030.1074
Ch317.989021.993126.000130.0247
Ch418.015322.020526.027230.0565
Publisher’s Note: MDPI stays neutral with regard to jurisdictional claims in published maps and institutional affiliations.

