1. Introduction
With the rapid development of high-rise buildings, concrete-filled steel tube (CFST) columns have received extensive attention and investigation due to their high strength and performance. Concrete-filled steel tube (CFST) columns have higher bearing capacity and ductility than normal steel reinforced concrete (RC) columns [
1,
2]. However, their bearing capacity degrades rapidly after fire exposure, so a series of research studies have been performed on the fire performance of CFST column structures [
3,
4,
5,
6,
7,
8,
9,
10,
11,
12,
13,
14,
15,
16,
17,
18,
19]. Tao et al. [
5] analyzed the post-fire bond between the steel tube and concrete in 37 CFST columns. Moliner et al. [
6] carried out 16 fire tests of high strength CFST columns. Hu et al. [
7] reported a numerical study on the temperature distribution of high-strength concrete-filled steel tube subjected to a fire. Generally, it was found that the outer steel tube is easily damaged, especially when subjected to high temperature without protection [
4,
8]. Espinos et al. [
9,
10,
11] investigated the post-fire performance of concrete-filled circular hollow section columns and concrete-filled elliptical hollow section columns. It was found that the post-fire performance of circular columns was better than that of square columns, while the eccentricity of columns had a significant effect on their fire performance. Lu et al. [
12] investigated the fire performance of high strength self-consolidating concrete-filled steel tubular stub columns. Song et al. [
13] and Huo et al. [
15] revealed the behavior of CFST joints subjected to standard fire loading. Ding and Wang [
17] and Han et al. [
18] observed the fire resistance of CFST frames. A number of research studies have been performed on the fire resistance of columns under non-uniform fire [
19]. To sum up, previous studies revealed that the residual strength of CFST columns after fire exposure is less than that of columns at ambient temperature because the outer concrete is brittle and easily damaged.
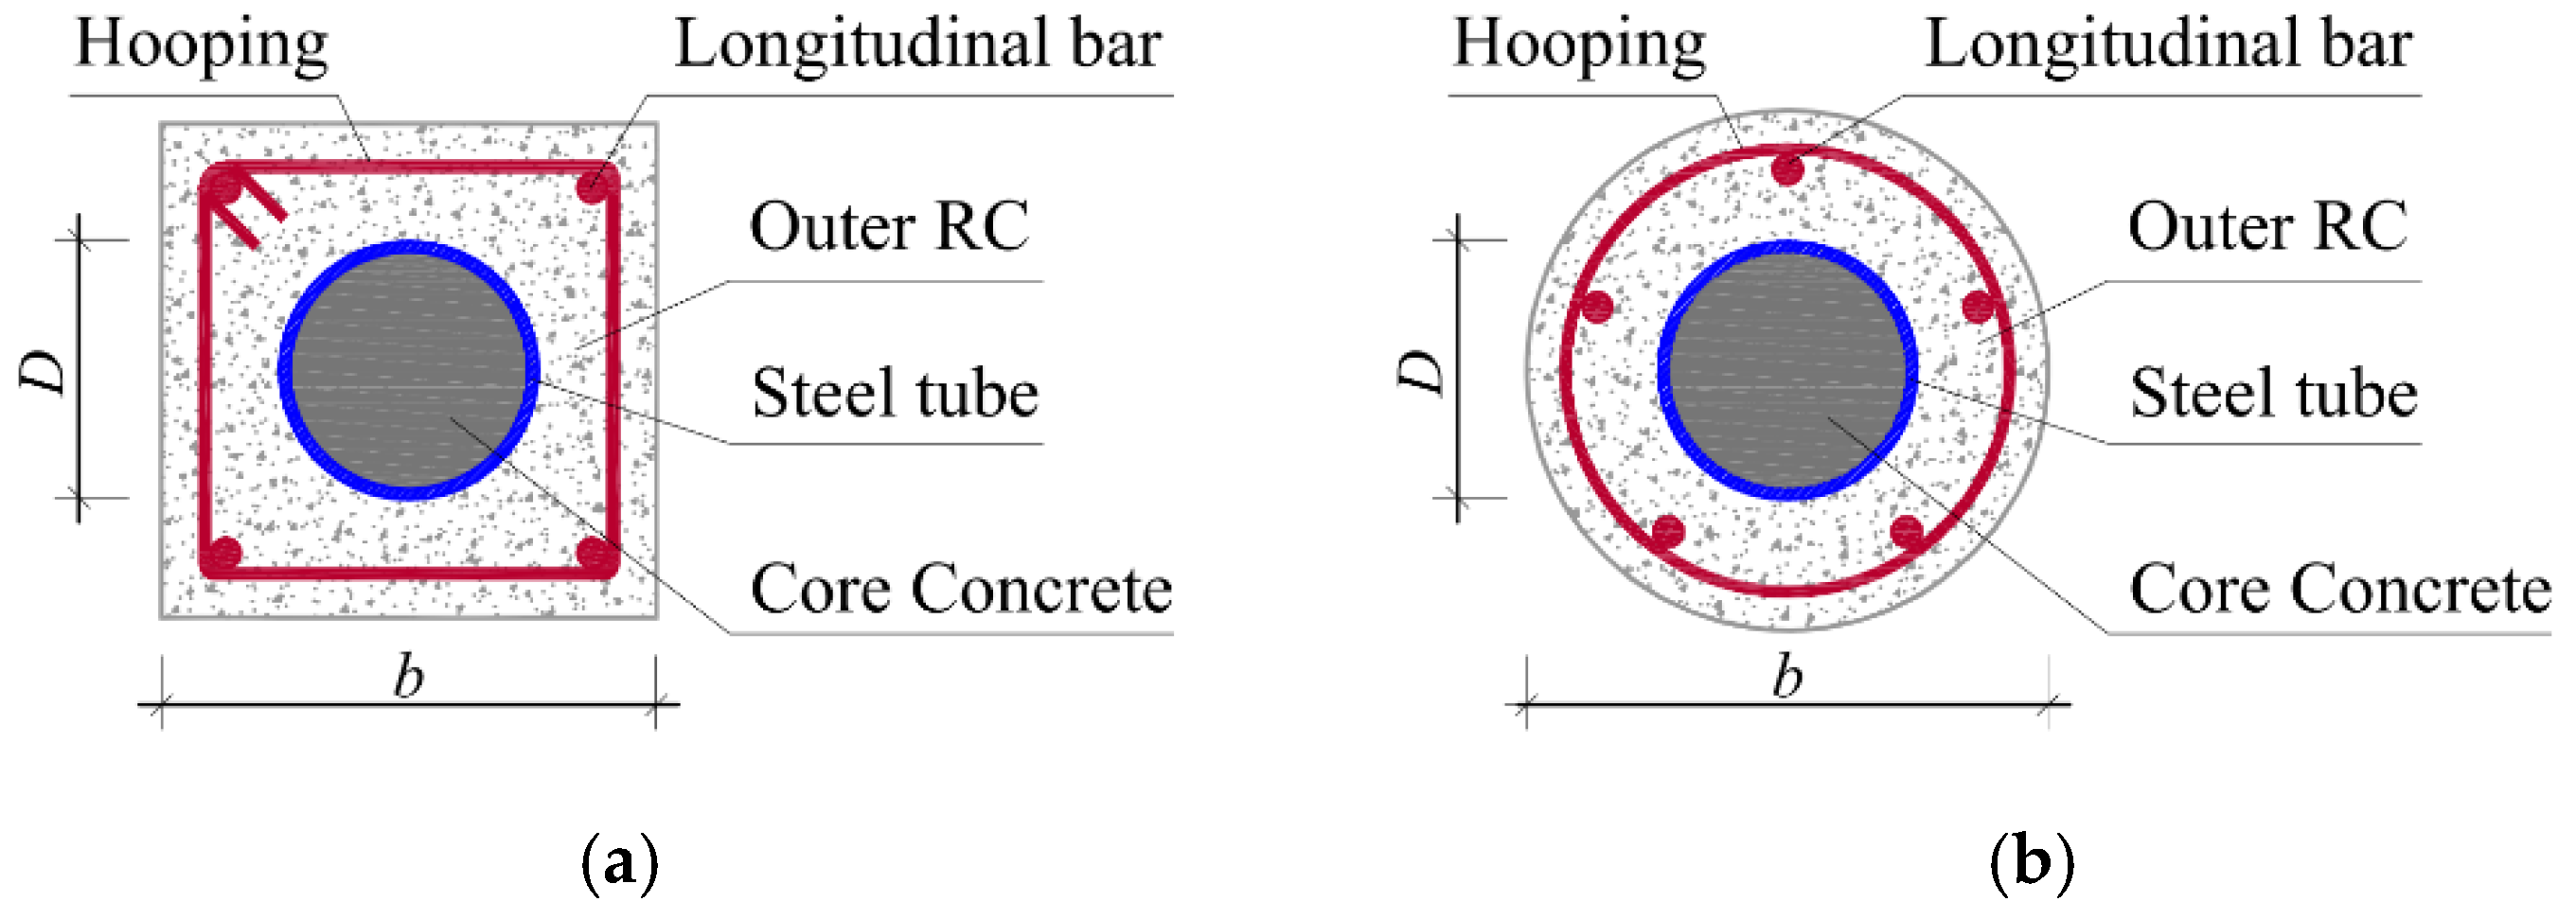
To improve the mechanical properties of CFST columns, a new type of composite of CFST columns wrapped in reinforced concrete (RC) was proposed, which are also called concrete-encased CFST composite columns or steel tube-reinforced concrete composite columns [
14,
16], as shown in
Figure 1. The outer RC wraps the inner CFST column, so its fire resistance is better than that of conventional CFST columns. The outer RC component improves the durability of concrete-encased CFST columns. Additionally, the outward buckling of the inner steel tube can be limited due to the existence of outer RC. Generally, it was found that concrete-encased CFST composite columns have a higher bearing capacity and ductility than conventional CFST columns at ambient temperature [
20,
21,
22,
23,
24,
25,
26,
27].
Due to their excellent mechanical properties, concrete-encased CFST composite columns have been widely used in high-rise and super high-rise buildings. However, research studies on the fire and post-fire mechanical performance of concrete-encased CFST composite column structures are relatively few. Xu et al. [
28] carried out experimental research on the fire resistance of concrete-encased CFST composite columns subjected to ISO-834 standard fire, which mainly evaluated the temperature distribution, fire resistance, displacement versus time relationship, and failure mechanism of the composite columns. Xu et al. and Bao et al. [
29,
30] conducted numerical analysis investigations on concrete-encased CFST composite columns subjected to 3-side fire and ISO-834 standard fire, respectively. The influences of important parameters, such as fire duration time, sectional dimension, slenderness ratio, and sectional core area ratio, on the temperature field of the composite columns were investigated. The previous research on concrete-encased CFST composite column exposure to high temperature focused on the fire-resistance performance and lack of research on residual performance and residual bearing capacity. It is urgent that the mechanical properties and damage rules of concrete-encased CFST composite column structures after fire exposure be studied; in particular, the residual bearing capacity of these structures should be further studied for evaluation and repair after fire damage.
In this paper, 14 concrete-encased CFST composite columns subjected to high temperatures were designed for an axial compression loading test. The influence of different heating parameters, steel tube diameters, and concrete cover thicknesses on the axial compressive performance and damage rules were investigated, and a calculation method for the residual bearing capacity of the composite columns after fire exposure was proposed.
2. Experimental Programs
2.1. Specimen Preparation
A total of 14 concrete-encased CFST composite columns were designed and manufactured, and successively subjected to high temperature and axial compression tests. The section size of each column specimen was 200 mm × 200 mm, and the column length was 600 mm. The concrete design strength was C60. The specimen test parameters included the heating temperature (ambient temperature (20 °C), 200 °C, 300 °C, 400 °C, 500 °C, 600 °C, 700 °C, 800 °C), the external diameter of the steel tube (89 mm, 114 mm, 138 mm), and the thickness of concrete cover (10 mm, 20 mm, 30 mm). The design details of all specimens are summarized in
Table 1.
Two types of steel were used in the test: rebar and steel tube. The stirrup was Φ6 HRB400 steel reinforcement bar. The stirrup spacing in the unencrypted area located within 400 mm in the middle of the column was 80 mm, and the other area was 30 mm. Longitudinal rebars were 4Φ12 HRB400 steel reinforcements located at four corners. The steel tubes were strength grade Q235B straight-welded circular steel tubes. There were 5 types of reinforcement for all specimen sections, as shown in
Figure 2.
The steel tube and the outer steel cage were welded at both ends to fix their positions. After the steel frame was welded successfully, it was put into a mold, then concrete was poured in layers and compacted with a vibrator. After pouring, the two ends of the specimens were polished smooth with a grinder to ensure the whole section was under uniform force, that is, the steel tube and RC component could work effectively during the whole loading process. All specimens were adopted with natural curing until tested.
2.2. Material Properties
Twenty-four steel standard samples, which were divided into eight groups corresponding to different heating temperatures, were tested for each batch of reinforced and steel tubes. The designed cube compressive strength of commercial concrete produced by China Resources Concrete (Nanning) Co. LTD was 60 MPa. The specific materials were as follows: cement: P·O 42.5 ordinary Portland cement; water; sand: natural river sand; coarse aggregate: crushed stones (5–10 mm); active admixtures: silica fume, slag powder, superplasticizer. Additional details on the materials are given in
Table 2.
According to the standard test method (Chinese code GB/T 50081-2002 [
31]), 24,150 mm × 300 mm cylinder concrete blocks were reserved and divided into eight groups. At the same time, the concrete standard samples and the column specimens were standing indoors and cured under identical conditions for 28 days.
After curing, all specimens (the concrete standard samples, the steel standard samples, and the column specimens) were exposed to high temperature using an RX3-45-9 industrial box resistance furnace at the State Key Laboratory of Engineering Disaster Prevention and Structural Safety, Guangxi University (China). The heating device and measured temperature rise curves are shown in
Figure 3. First, all specimens were heated to the design temperature, which was kept constant for 60 min. Then, the test specimens were taken out and cooled naturally to ambient temperature (20 °C).
The residual strengths of cylinder concrete and steel were respectively tested using Chinese code GB/T 50081-2002 [
31] and GB/T 228.1-2010 [
32]; the compression strength of cylinder concrete
fc’ (
T) and yield strength of steel
fy(
T) are shown in
Table 3 and
Table 4, respectively.
2.3. Test Procedure for Axial Compression Loading
The column specimens, which were subjected to high temperature under identical conditions for the standard samples and then naturally cooled to ambient temperature, were subjected to axial force loading using a 500 T Electro-hydraulic Servo Testing Machine at the State Key Laboratory of Engineering Disaster Prevention and Structural Safety, Guangxi University. The loading device is shown in
Figure 4. FRP was wrapped around both ends of the specimen and fitted with a unique 100 mm wide steel hoop to prevent the specimen from being crushed locally. Firstly, the preloading rate was 10 kN/min, and the target axial load was 10% of the estimated ultimate bearing capacity. Then, displacement control was used for loading, and the loading rate was 0.5 mm/min. When the bearing capacity of specimens fell to 70% of the peak load, the loading was stopped. Loading and displacement gauges connected to the IMP data acquisition system recorded the experimental results automatically.
3. Test Results and Discussion
3.1. Failure Patterns of the Composite Columns under Compression Loading
The axial compression failure patterns of the concrete-encased CFST composite columns subjected to high temperature were similar to those at ambient temperature, but the influence of the heating temperature, steel tube diameter, and concrete cover thickness was obvious, as shown in
Figure 5.
When the heating temperature T < 500 °C, the concrete cover did not completely peel off until failure, the vertical and oblique cracks staggered to form the main cracks, and the edge concrete collapsed and failed without longitudinal reinforcement bulking or stirrup deformation. When T ≥ 500 °C, the concrete cover was badly damaged and could not contribute to the ultimate bearing capacity of the specimen. At the same time, the damage to the outer concrete was serious, and the loading was mostly borne by the CFST with excellent deformation capacity, resulting in a large ultimate displacement until failure. The outer concrete was seriously peeled off, some stirrup bars were exposed and deformed, and the longitudinal reinforcements buckled.
At the same heating temperature, the larger the diameter of the steel tube, the more pronounced the peeling of the concrete cover, and the more serious the apparent damage to the specimen. The damage degree of the outer concrete increased as the thickness of the concrete cover increased.
3.2. Load-Displacement Curve
The axial load-displacement curves of specimens are shown in
Figure 6.
(1)
Figure 6a shows that the failure process can be divided into four stages. (a) Elastic stage (OA): At the initial stage of loading, no cracks were found on the surface of the concrete, and the load and displacement presented a linear relationship. (b) Elastic-plastic stage (AB): With the increase in displacement, when the longitudinal strain reached about 3.3‰, cracks appeared and continued to extend, and the curve gradually showed a nonlinear change. (c) Descending stage (BC): After reaching the peak load, the bearing capacity decreased, and the rate of decline was steep. (d) Residual stage (CD): As the displacement continued to increase, the bearing capacity of the specimen decreased significantly, the curve became flat, and the specimen was in the residual stage when the longitudinal strain reached about 10.0‰.
(2)
Figure 6b shows that the influence of heating temperature on the load-displacement curves was obvious. With the increase in heating temperature, the slope of the curve in the elastic stage gradually became smaller, that is, the initial stiffness decreased. The residual stage of the curves at
T < 600 °C was not obvious, whereas it was the opposite at
T ≥ 600 °C. The main reason is the outer RC subjected to high temperature was seriously damaged, and the load was mainly transferred by the core CFST columns.
(3)
Figure 6c,d indicate the influence of the steel tube diameter and concrete cover thickness on the load-displacement curves. There was no significant difference in the slope of the descending section of the curve with different steel tube diameters at ambient temperature as the diameter of the steel tube increased. However, when exposed to high temperature (
T = 600 °C), the descending section of the curve gradually flattened. The curves of specimens with different concrete cover thicknesses basically coincided at the initial stage but decreased slowly as the concrete cover thickness increased.
4. Analysis of Influential Factors
According to the load-displacement curves of each column specimen, the characteristic point parameters of the cracking load (
Ncr(
T)), peak load (
Nu(
T)), initial stiffness (
EA0(
T)), and displacement ductility coefficient (
μ(
T)) can be obtained, as shown in
Table 5, in which the initial stiffness is the secant stiffness at 0.4
Nu(
T) in the ascending section of the curves. The displacement ductility coefficient refers to the ratio of the ultimate displacement corresponding to 85%
Nu(
T) at the post-peak stage to the yield displacement determined by the general yield moment method.
4.1. Crack Load
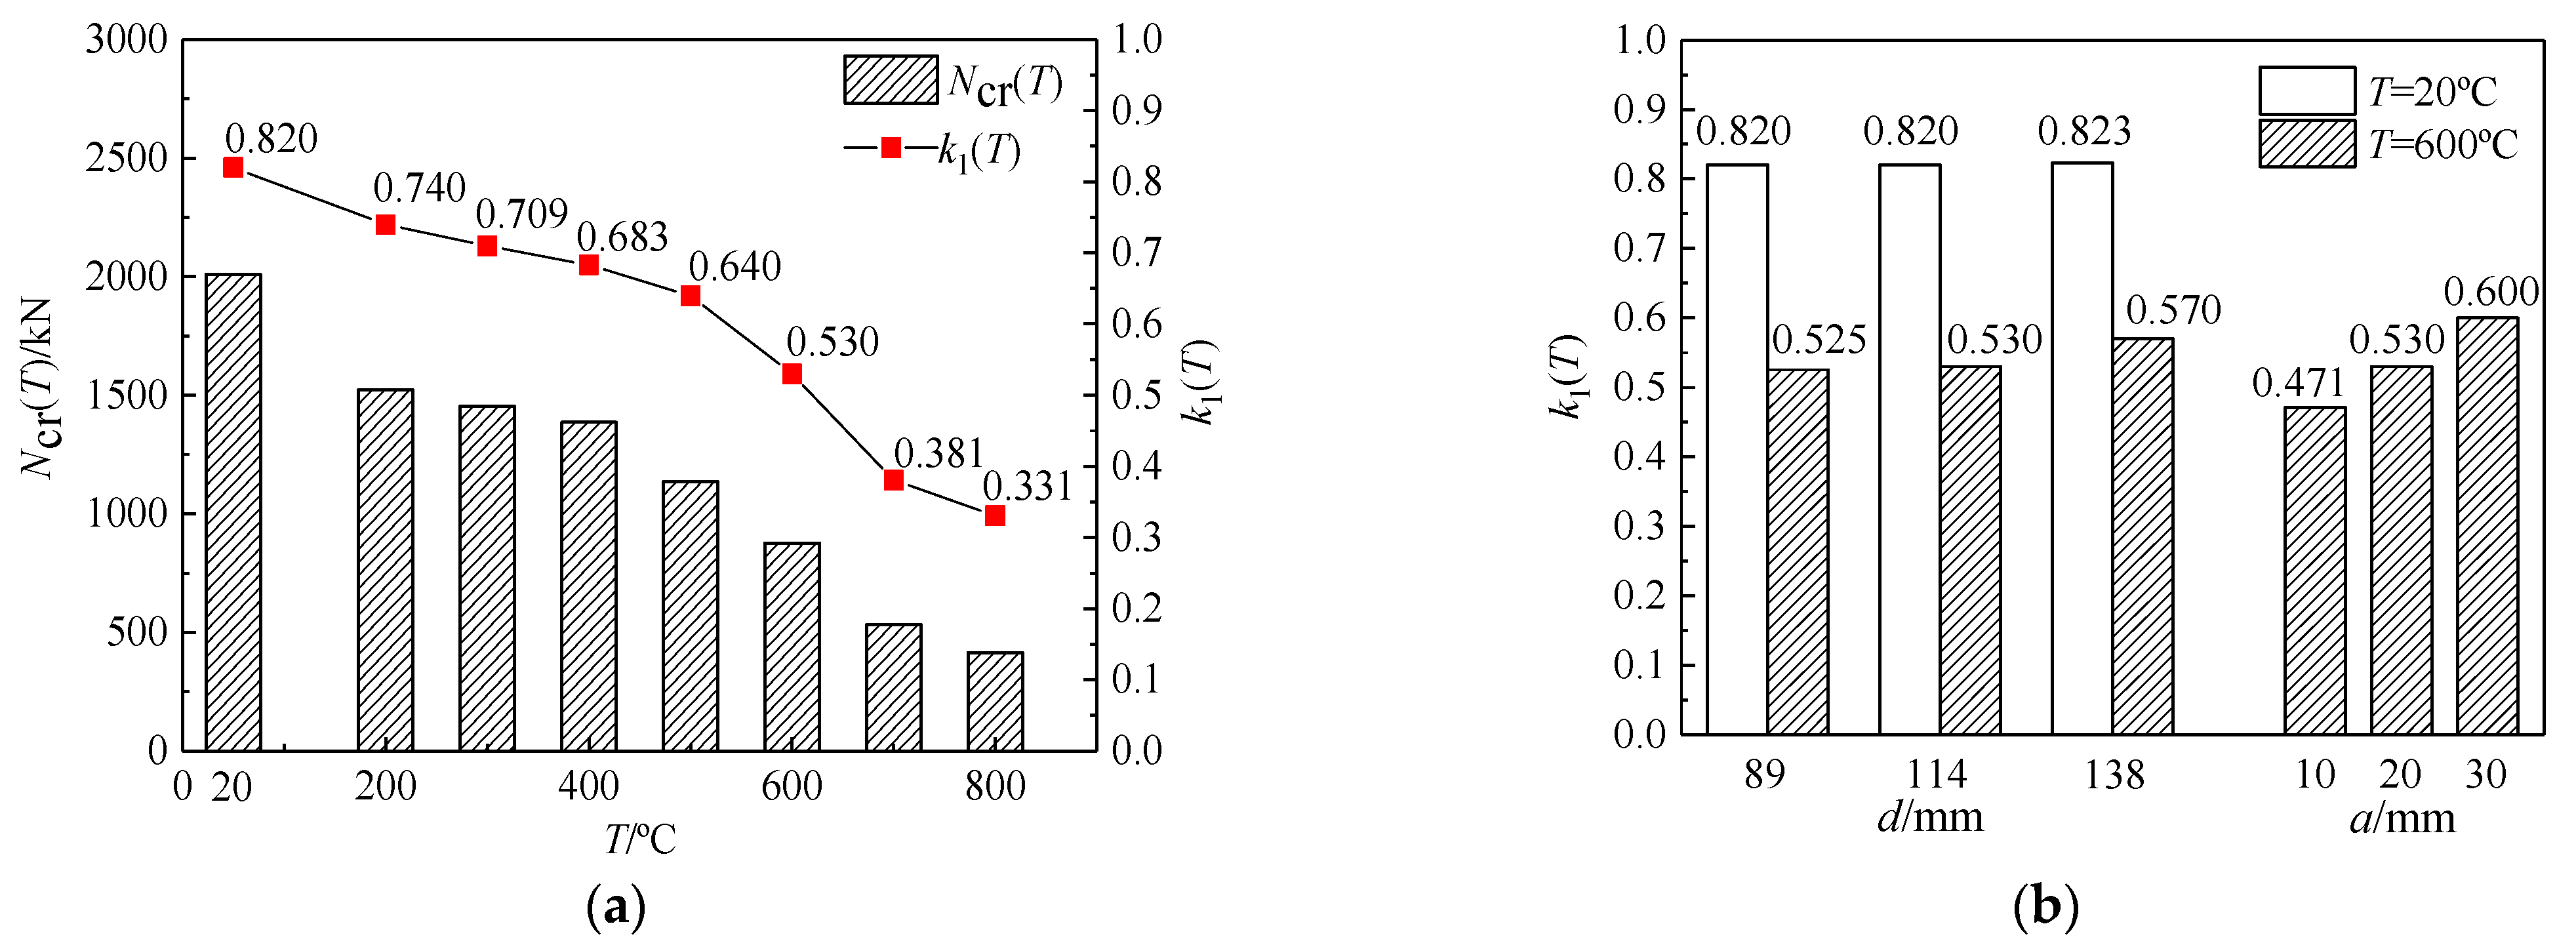
The variations in the ratio (
k1(
T)) of the crack load to the peak load of the composite columns subjected to different fire exposure are shown in
Figure 7.
It can be seen from
Figure 7a that the crack load of specimens decreased with the increase in the heating temperature, which declined more slowly within the range of 200 °C ≤
T ≤ 400 °C and then fell rapidly. Compared with the ambient temperature, the crack loads of the specimens at
T = 700 °C and 800 °C decreased by 73.43% and 79.33%, respectively. The
k1(
T)-value of the specimen at ambient temperature was 82%, while that of the specimen at
T = 800 °C was only 33%. It can be seen that the
k1(
T)-value was more reduced by the increase in heating temperature, indicating that the higher the heating temperature was, the earlier the surface crack of the specimen appeared.
Figure 7b reflects that the diameter of the steel tube had no significant influence on the
k1(
T)-value at ambient temperature, which was stable at about 82%. At high temperature (
T = 600 °C), the
k1(
T)-value uniformly increased with increases in steel tube diameter and concrete cover thickness, but the increase was small with the increase in steel tube diameter.
4.2. Residual Ultimate Bearing Capacity
To analyze the influence of the heating temperature on the residual bearing capacity of specimens, the heating temperature influence coefficient
k2(
T) of bearing capacity was introduced:
where
Nu(
T) and
Nu are the ultimate bearing capacity of the specimens subjected to high temperature and ambient temperature, respectively.
Figure 8 shows the variation in the heating temperature influence coefficient of bearing capacity.
As shown in
Figure 8a, the influence of the heating temperature on the ultimate bearing capacity of the specimens was very obvious. As the heating temperature increased, the ultimate bearing capacity of specimens decreased continuously. Compared with the specimen under ambient temperature, the
k2(
T) curve decreased slowly and not significantly (about 16.1~17.3%) within the range of 200 °C ≤
T ≤ 400 °C. Thereafter, the
k2(
T) curve dropped sharply and its decline varied from 27.6% to 48.8%. If the reduction in residual bearing capacity is regarded as the approximately linear variation with the heating temperature, the average rate of decrease was 6.256%·100 °C
−1.
Figure 8b reflects the influence of steel tube diameter (
d) on the ultimate bearing capacity of the specimens. It can be seen that under both ambient temperature and high temperature (
T = 600 °C), the ultimate bearing capacity increased with the increase in steel tube diameter. Compared with specimens with
d = 89 mm, the ultimate bearing capacity of the specimens with
d = 114 mm and 138 mm increased by 4.68% and 7.82%, respectively at ambient temperature, while it rose by 1.54% and 3.32%, respectively, under exposure to high temperature (
T = 600 °C).
Figure 8b indicates that the residual bearing capacity of the specimens after high temperature (
T = 600 °C) exposure decreased with the increase in concrete cover thickness (
a). The residual bearing capacity of specimens with
a = 20 mm and 30 mm decreased by 7.65% and 11.82% compared with that of specimens with
a = 10 mm. The main reason is that the concrete cover thickness basically failed at high temperature. When the concrete cover thickness was larger, the stirrup inner confining concrete was smaller, which reduced the bearing capacity of the outer RC and led to a reduction in overall bearing capacity of the specimens.
4.3. Initial Stiffness Degradation
To analyze the axial compressive initial stiffness degradation of the specimens after fire exposure, the heating temperature influence coefficient
η(
T) of initial stiffness was introduced:
where
EA0(
T) and
EA0 are the axial compression initial stiffness of the specimens subjected to high temperature and ambient temperature, respectively. The initial stiffness of the specimen can be expressed by the secant line stiffness corresponding to 0.4
Nu(
T) at the ascending section of the load-displacement curve.
Figure 9 shows the variation in the heating temperature influence coefficient of initial stiffness. It can be seen that the initial stiffness decreased continuously, with a reduction between 6% and 59%, with the increase in heating temperature, which was approximately linear, as shown in
Figure 9a. Compared with specimens with
d = 89 mm, the initial stiffness of the specimens with
d = 114 mm and 138 mm increased by 4.07% and 6.83%, respectively, at ambient temperature, while it increased by 4.32% and 7.57%, respectively, under exposure to high temperature (
T = 600 °C). The increase in initial stiffness under the two different temperatures was similar, indicating that the steel tube diameter had little influence on the strengthening of the initial stiffness of the specimen. If the reduction in initial stiffness is regarded as an approximately linear variation with the heating temperature, the average rate of decrease is 7.513%·100 °C
−1, as depicted in
Figure 9b. It can be observed that the degradation rate for initial stiffness is faster and more severe than that for residual bearing capacity.
Figure 9b illustrates that under exposure to high temperature (
T = 600 °C), the initial stiffness of the specimens with concrete cover thickness
a = 20 mm and 30 mm was increased by 6.18% and 6.96%, respectively, compared to that of specimens with concrete cover thickness
a = 10 mm.
4.4. Deformation Performance
The deformation performance of the concrete-encased CFST composite columns changed under exposure to high temperature, and could usually be evaluated with the deformation coefficient
μ, which is the ratio of the ultimate displacement corresponding to failure load to yield displacement of the specimens. For the convenience of analysis, the heating temperature influence coefficient
ζ(
T) of deformation was introduced:
where
μ(
T) and
μ0 are the axial compression deformation coefficient of the specimens subjected to high temperature and ambient temperature, respectively.
Figure 10 shows the variation of the heating temperature influence coefficient of deformation. It can be seen from
Figure 10a that with the increase in heating temperature, the deformation coefficient of the specimens takes
T = 400 °C as the inflexion point, showing a trend of decreasing first and increasing later. When
T = 400 °C, the deformation coefficient reached a valley value of 1.55, a decrease of 29.9% compared with specimens at ambient temperature. The main reason is that when the heating temperature was low (
T ≤ 400 °C), the initial damage to the outer RC was small, and its load proportion borne in the late loading period was large. However, due to the limited deformation capacity of the outer RC after the damage, the core CFST could not give full play to the deformation capacity of the specimen as a whole. When the heating temperature was high (
T > 400 °C), the damage to the outer RC was large, and it worsened with the increase in the heating temperature. As a result, the load borne by the outer RC was small at the later stage of loading. The overall deformation of the specimen increased with the increase in heating temperature due to the CFST with excellent deformation performance bearing most of the load.
It can be seen from
Figure 10b that at both ambient temperature and high temperature (
T = 600 °C), the deformation coefficient increased with the increase in steel tube diameter. The deformation capacity of the specimens with
d = 114 mm and 138 mm increased by 6.25% and 12.5%, respectively, at the ambient temperature, while increasing by 23.12% and 27.74%, respectively, under exposure to high temperature (
T = 600 °C) when compared to specimens with
d = 89 mm. This shows that the diameter of the steel tube contributed to the slight increase in deformation capacity of specimens exposed to high temperature.
Figure 10b reflects that the deformation capacities of the specimens with
a = 20 mm and 30 mm were increased by 34.81% and 55.61%, respectively, under exposure to high temperature (
T = 600 °C) when compared to specimens with concrete cover thickness
a = 10 mm. The main reason is that the greater the concrete cover thickness was, which basically failed after exposure to high temperature, the stronger the deformation performance of the specimens was, due to the good ductility of the core CFST columns.
4.5. Damage Analysis
To quantitatively evaluate the damage evolution rule for the composite columns exposed to high temperature, the damage variable parameter
D is introduced. When
D = 0, the specimen is in the non-destructive state. When
D = 1, the specimen is completely destroyed. The damage variable parameter can be calculated according to the following formula:
where
EA0(
T) represents the initial stiffness of the specimen under the non-destructive state, that is, the secant stiffness corresponding to 0.4
Nu(
T) at various high temperatures;
EA(
T) denotes the effective stiffness of the specimen after damage, that is, the secant stiffness at any time under different high temperatures.
In the whole loading process, the damage value of the specimen can be intuitively reflected by the damage evolution curve, as shown in
Figure 11.
Figure 11 indicates that the damage evolution curves can be divided into four stages:
(1) The horizontal line segment: the damage value at the initial stage of loading is an approximately horizontal line, and the specimen is in the elastic stage.
(2) The rapidly ascending segment: the damage value has increased rapidly, as manifested in the rapid development of cracks and the continuous peeling of concrete cover. The corresponding load-displacement curve is between the elastic-plastic stage and the descending section.
(3) The slowly ascending segment: the growth rate of the damage value has slowed, the concrete cover of the specimens has completely lost its function, and the corresponding load-displacement curve is between the descending section and residual section.
(4) The stable segment: the damage value shows almost no further increase, the outer RC of the specimen has basically lost its function, that is, the load is mainly borne by the core CFST column, and the corresponding load-displacement curve is in the residual section.
It can also be seen from
Figure 11 that the damage evolution curves of the specimens were not significantly affected by the diameter of the steel tube or the thickness of the concrete cover, and far less so than by the heating temperature. The higher the heating temperature was, the more serious the initial damage to the specimen was. Before the average longitudinal strain reached 3.3‰, the damage evolution curve of the specimen was in the horizontal and linear segment, and the damage accumulation was very small. Subsequently, the rapidly ascending section of the curve became shorter with increased heating temperature. The failure strain corresponding to 85%
Nu(
T) of the specimens at
T ≤ 500 °C varied between 13.3‰ and 16.7‰, while it was between 10.0‰ and 13.3‰ when
T ≥ 600 °C. Finally, only the curves of specimens at
T ≥ 600 °C could enter the stationary segment, and the deformation at the end of loading was relatively larger.
5. Calculation Method for Residual Bearing Capacity
Based on the Chinese “Technical specification for concrete-filled steel tube composite column structures” (CECS188:2005) [
33], the axial bearing capacity of the concrete-encased CFST composite columns (
Nu) is regarded as the sum of the bearing capacity of the outer RC and the core CFST column. The formula for calculation of the axial bearing capacity of the concrete-encased CFST short column is as follows:
where
θ denotes the confinement index of the core CFST;
fcc and
fco are the compressive strength of concrete inner and outer steel tubes, respectively, which have the same strength value in this test;
αc1 and
αc2, which are determined according to Chinese code GB 50010-2010, represent the ratio of prismatic strength to cube strength (
fcu) and the brittleness coefficient of concrete, respectively;
fy and
fa are the yield strength of longitudinal reinforcement and steel tube, respectively;
Acc and
Aco are the sectional area of concrete inside and outside steel tube, respectively; and
Ass and
Aa are the sectional area of longitudinal reinforcement and the steel tube, respectively.
Considering only the damage from heating temperature to the residual bearing capacity of the overall specimen, the residual bearing capacity (
Nu(
T)) of the concrete-encased CFST composite columns subjected to high temperature can be calculated by Equation (8).
where
kT denotes the high temperature influence coefficient of the residual bearing capacity after fire exposure, which is usually related to the heating temperature, section size, and other parameters. It is mainly regarded as the influence function of the heating temperature (
T) and the position coefficient
κ (
κ =
d/
b, where
d, b are the tube diameter and the section width, respectively) of the steel tube in this paper. Regression analysis of the test results can obtain the expression
kT, as follows:
Table 6 shows the theoretically calculated values for
Nu-c(
T) of the residual bearing capacity. As can be seen from
Table 6, the average ratio of the calculated values to the test values was 0.976, and the coefficient of variation was 0.067, which shows that the calculated results using the above method are in good agreement with the test results.
6. Conclusions
(1) Compared with the concrete cylinder blocks, the composite columns had no obvious cracks, and the explosion phenomenon occurred due to the action of steel reinforcement bars.
(2) The failure patterns in the column specimens were greatly affected by the heating temperature, the diameter of the steel tube, and the thickness of the concrete cover. The higher the heating temperature was, the earlier the vertical cracks appeared and the concrete cover fell off. The greater the steel tube diameter and the concrete cover thickness were, the more serious the damage to the outer RC was.
(3) The load-displacement curve of the specimen displayed an elastic stage, elastic-plastic stage, descending stage, and residual stage, which were not greatly affected by the diameter of the steel tube or the thickness of the concrete cover, but very significantly affected by the heating temperature.
(4) With the increase in the heating temperature, the bearing capacity and initial stiffness of the specimen decreased continuously, and the latter displayed a faster rate of decline due to the increased damage after fire exposure, while the deformation capacity first decreased and then increased. With the increase in steel tube diameter, the bearing capacity and deformation capacity increased, and the initial stiffness had no obvious effect. With the increase in concrete cover thickness, the bearing capacity decreased, and the initial stiffness and deformation capacity increased.
(5) Considering the influence of the heating temperature and the steel tube position, a method of calculating the axial compression bearing capacity of the concrete-encased CFST composite columns after high temperature exposure was put forward on the basis of the Chinese technical specification CECS 188:2005.
Author Contributions
Conceptualization, X.P.; Data curation, W.X.; Funding acquisition, X.K.; Investigation, W.X. and Y.D.; Supervision, X.P.; Validation, Y.D.; Visualization, W.X.; Writing—original draft, X.K.; Writing—review & editing, X.K. All authors have read and agreed to the published version of the manuscript.
Funding
This research was funded by National Natural Science Foundation of China Grant No. 51668007 and and Natural Science Foundation of Guangxi Province 2018GXNSFAA050007.
Institutional Review Board Statement
Not applicable.
Informed Consent Statement
Not applicable.
Data Availability Statement
The data presented in this study are available on request from the corresponding author. The data are not publicly available due to requirements of the funder.
Acknowledgments
The financial support from the National Natural Science Foundation of China (Grant No. 51668007) and Natural Science Foundation of Guangxi Province (2018GXNSFAA050007) are greatly acknowledged.
Conflicts of Interest
The authors declare that they have no known competing financial interest or personal relationship that could have appeared to influence the work reported in this paper.
References
- Patel, V.I.; Liang, Q.Q.; Hadi, M.N.S. Numerical analysis of high-strength concrete-filled steel tubular slender beam-columns under cyclic loading. J. Constr. Steel Res. 2014, 92, 183–194. [Google Scholar] [CrossRef] [Green Version]
- Gong, Y.; Ding, F.; Wang, L.; Huang, B.; Shan, Y.; Lyu, F. Finite model analysis and practical design equations of circular concrete-filled steel tube columns subjected to compression-torsion load. Materials 2021, 14, 5564. [Google Scholar] [CrossRef]
- Wang, G.; Bao, Y.; Yang, L.; Yu, Y. Analysis of fire resistance of square-cased square steel tube reinforced concrete (st-rc) columns. Materials 2021, 14, 5541. [Google Scholar] [CrossRef]
- Hong, S.; Varma, A.H. Analytical modeling of the standard fire behavior of loaded CFT columns. J. Constr. Steel. Res. 2009, 65, 54–69. [Google Scholar] [CrossRef]
- Tao, Z.; Han, L.H.; Uy, B.; Chen, X. Post-fire bond between the steel tube and concrete in concrete-filled steel tubular columns. J. Constr. Steel. Res. 2011, 67, 484–496. [Google Scholar] [CrossRef]
- Moliner, V.; Espinos, A.; Romero, M.L.; Hospitaler, A. Fire behaviour of eccentrically loaded slender high strength concrete-filled tubular columns. J. Constr. Steel Res. 2013, 83, 137–146. [Google Scholar] [CrossRef]
- Hu, Y.; Zhao, P.F.; Yang, B.; Dai, G.X. Numerical study on temperature distribution of high-strength concrete-filled steel tubes subjected to a fire. Int. J. Steel Struct. 2016, 16, 1057–1069. [Google Scholar] [CrossRef]
- Han, L.H. Fire performance of concrete filled steel tubular beam-columns. J. Constr. Steel Res. 2001, 57, 697–711. [Google Scholar] [CrossRef]
- Espinos, A.; Gardner, L.; Romero, M.L.; Hospitaler, A. Fire behaviour of concrete filled elliptical steel columns. Thin Walled Struct. 2011, 49, 239–255. [Google Scholar] [CrossRef]
- Espinos, A.; Romero, M.L.; Serra, E.; Hospitaler, A. Circular and square slender concrete-filled tubular columns under large eccentricities and fire. J. Constr. Steel Res. 2015, 110, 90–100. [Google Scholar] [CrossRef]
- Espinos, A.; Romero, M.L.; Lam, D. Fire performance of innovative steel-concrete composite columns using high strength steels. Thin Walled Struct. 2016, 106, 113–128. [Google Scholar] [CrossRef]
- Lu, H.; Zhao, X.L.; Han, L.H. Fire behaviour of high strength self-consolidating concrete filled steel tubular stub columns. J. Constr. Steel Res. 2009, 65, 1995–2010. [Google Scholar] [CrossRef]
- Song, T.Y.; Han, L.H.; Uy, B. Performance of CFST column to steel beam joints subjected to simulated fire including cooling phase. J. Constr. Steel Res. 2010, 66, 591–604. [Google Scholar] [CrossRef]
- Ding, F.; Liao, C.; Wang, E.; Lyu, F.; Xu, Y.; Liu, Y.; Feng, Y.; Shang, Z. Numerical investigation of the composite action of axially compressed concrete-filled circular aluminum alloy tubular stub columns. Materials 2021, 14, 2435. [Google Scholar] [CrossRef]
- Huo, J.S.; Han, L.H.; Wang, Y.C. Behaviour of repaired concrete filled steel tubular column to steel beam joints after exposure to fire. Adv. Struct. Eng. 2010, 13, 53–68. [Google Scholar] [CrossRef]
- Zhou, C.; Chen, W.; Ruan, X.; Tang, X. Experimental study on axial compression behavior and bearing capacity analysis of high titanium slag cfst columns. Appl. Sci. 2019, 9, 2021. [Google Scholar] [CrossRef] [Green Version]
- Ding, J.; Wang, Y.C. Experimental study of structural fire behaviour of steel beam to concrete filled tubular column assemblies with different types of joints. Eng. Struct. 2007, 29, 3485–3502. [Google Scholar] [CrossRef]
- Han, L.H.; Wang, W.H.; Yu, H.X. Experimental behaviour of reinforced concrete (RC) beam to concrete-filled steel tubular (CFST) column frames subjected to ISO-834 standard fire. Eng. Struct. 2010, 32, 3130–3144. [Google Scholar] [CrossRef]
- Lv, X.T.; Yang, H.; Zhang, S.M. Fire resistance behavior and mechanism of concrete filled square hollow columns in non-uniform fires. China J. Build. Struct. 2013, 34, 35–44. (In Chinese) [Google Scholar]
- Cai, M.; Ke, X.J.; Su, Y.S. Axial compressive performance of RAC-encased RACFST composite columns. Eng. Struct. 2020, 210, 110393. [Google Scholar] [CrossRef]
- Ji, X.; Zhang, M.; Kang, H.; Qian, J.; Hu, H. Effect of cumulative seismic damage to steel tube-reinforced concrete composite columns. Earthq. Struct. 2014, 7, 179–199. [Google Scholar] [CrossRef]
- Cai, J.; Pan, J.; Li, X. Behavior of ECC-encased CFST columns under axial compression. Eng. Struct. 2018, 171, 1–9. [Google Scholar] [CrossRef]
- Cai, J.; Pan, J.; Su, H.; Lu, C. Experimental study on the hysteretic behavior of ECC-encased CFST columns. Eng. Struct. 2018, 173, 107–121. [Google Scholar] [CrossRef]
- An, Y.F.; Han, L.H. Behaviour of concrete-encased CFST columns under combined compression and bending. J. Constr. Steel Res. 2014, 101, 314–330. [Google Scholar] [CrossRef]
- Han, L.H.; Wang, Z.B.; Xu, W. Behavior of concrete-encased CFST members under axial tension. J. Struct. Eng. 2015, 142, 04015149. [Google Scholar] [CrossRef]
- Liao, F.Y.; Han, L.H.; Tao, Z. Behaviour of composite joints with concrete encased CFST columns under cyclic loading: Experiments. Eng. Struct. 2014, 59, 745–764. [Google Scholar] [CrossRef]
- Ji, X.; Kang, H.; Chen, X.; Qian, J. Seismic behavior and strength capacity of steel tube- reinforced concrete composite columns. Earthq. Eng. Struct. Dyn. 2014, 43, 487–505. [Google Scholar] [CrossRef]
- Xu, L.; Liu, Y.B. Concrete filled steel tube reinforced concrete (cfstrc) columns subjected to ISO-834 standard fire: Experiment. Adv. Struct. Eng. 2013, 16, 1263–1282. [Google Scholar] [CrossRef]
- Xu, L.; Wang, M.T.; Bao, Y.H.; Wang, W.D. Numerical analysis on structural behaviors of concrete filled steel tube reinforced concrete (CFSTRC) columns subjected to 3-side fire. Int. J. Steel Struct. 2017, 17, 1515–1528. [Google Scholar] [CrossRef]
- Bao, Y.H.; Xu, L.; Wang, W.D.; Sun, J.G. Numerical analysis on mechanical property of concrete filled steel tube reinforced concrete (CFSTRC) columns subjected to ISO-834 standard fire. Int. J. Steel Struct. 2017, 17, 1561–1581. [Google Scholar] [CrossRef]
- GB/T 50081-2002; Standard for Test Method of Mechanical Properties on Ordinary Concrete. Architecture & Building Press: Beijing: China, 2003. (In Chinese)
- GB/T 228.1-2010; Metallic Materials Tensile Testing at Ambient Temperature. China Standard Press: Beijing, China, 2010. (In Chinese)
- CECS 188:2005; Technical Specification for Steel Tube-Reinforced Concrete Column Structure. China Planning Press: Beijing, China, 2005. (In Chinese)
- GB 50010-2010; Code for Design of Concrete Structures. China Architecture & Building Press: Beijing, China, 2010. (In Chinese)
- Comite Eur0-International du Beton. Bulletion D’information No.213/214 CEB-FIP Model Code 1990 (Concrete Structures); Comite Eur0-International du Beton: Lausanne, Switzerland, 1993. [Google Scholar]
| Publisher’s Note: MDPI stays neutral with regard to jurisdictional claims in published maps and institutional affiliations. |
© 2022 by the authors. Licensee MDPI, Basel, Switzerland. This article is an open access article distributed under the terms and conditions of the Creative Commons Attribution (CC BY) license (https://creativecommons.org/licenses/by/4.0/).


 ” denote the HRB400 steel in this article. Units: mm.


