Article

Polymorphism of 16s rRNA Gene: Any Effect on the Biomolecular Quantitation of the Honey Bee (Apis mellifera L., 1758) Pathogen Nosema ceranae?

1
CREA Research Centre for Agriculture and Environment, Via di Saliceto 80, 40128 Bologna, Italy
2
Dipartimento di Scienze e Tecnologie Agro-Alimentari, Alma Mater Studiorum Università di Bologna, Viale Fanin 42, 40127 Bologna, Italy
*
Author to whom correspondence should be addressed.
Appl. Sci. 2022, 12(1), 422; https://doi.org/10.3390/app12010422
Submission received: 8 November 2021 / Revised: 7 December 2021 / Accepted: 21 December 2021 / Published: 2 January 2022

Abstract

:
The microsporidian Nosema ceranae is a severe threat to the western honey bee Apis mellifera, as it is responsible for nosemosis type C, which leads the colonies to dwindle and collapse. Infection quantification is essential to clinical and research aims. Assessment is made often with molecular assays based on rRNA genes, which are present in the N. ceranae genome as multiple and polymorphic copies. This study aims to compare two different methods of Real-Time PCR (qPCR), respectively relying on the 16S rRNA and Hsp70 genes, the first of which is described as a multiple and polymorphic gene. Young worker bees, hatched in the laboratory and artificially inoculated with N. ceranae spores, were incubated at 33 °C and subject to different treatment regimens. Samples were taken post-infection and analyzed with both qPCR methods. Compared to Hsp70, the 16S rRNA method systematically detected higher abundance. Straightforward conversion between the two methods is made impossible by erratic 16s rRNA/Hsp70 ratios. The 16s rRNA polymorphism showed an increase around the inoculated dose, where a higher prevalence of ungerminated spores was expected due to the treatment effects. The possible genetic background of that irregular distribution is discussed in detail. The polymorphic nature of 16S rRNA showed to be a limit in the infection quantification. More reliably, the N. ceranae abundance can be assessed in honey bee samples with methods based on the single-copy gene Hsp70.

1. Introduction

The nosemosis type C is a disease of honey bees caused by the microsporidium Nosema ceranae [1,2]. The parasite, native of the Asian honey bee Apis cerana [3], spread rapidly around the world becoming one of the diseases causing colony decline and collapse in the European honey bee Apis mellifera, often replacing Nosema apis [4,5,6,7,8]. The microsporidium is an intracellular obligate parasite with high tropism for the honey bee ventriculum [3,9,10], infecting its epithelial cells to replicate [11]. Usually, the N. ceranae infection tends to be asymptomatic, but in symptomatic individuals [5,12], the disease may be shortening the lifespan of workers, inducing lethargic behavior and reducing the foraging activity [9,13,14]. N. ceranae represents an important threat for pollinators and hymenopterans, other than honey bees [15,16,17,18,19,20,21]. Although the transmission routes remain unknown [15,22], N. ceranae spores were found in the hive pest Aethina tumida and the regurgitated pellets of the bee-eater Merops apiaster [23,24]
All microsporidia have very small genomes, usually less than 20 million megabases (Mb) [25]. The N. ceranae genome appears to be approximately 7.86 Mb [26], similarly to N. apis (8.50 Mb) [27].
The ribosomal DNA (rDNA) represents the portion of DNA coding for the RNA that makes up the ribosomes of a living organism (rRNA) [28]. Typically, rDNA is organized within the genome in repeated copies in tandem. Each copy represents a well-defined unit, which is made up of two main components: Small Sub Unit rDNA (SSU-rDNA) and Large Sub Unit rDNA (LSU-rDNA), which represent the coding sequences for the rRNAs that will, respectively, constitute the minor and major subunits of the ribosome [29]. The rRNAs, depending on their sedimentation coefficient, take on different names in various living organisms. In the case of N. ceranae the SSU-rRNA is represented as 16S, while the LSU-rRNA as 18S. The two coding sequences are separated from each other by a non-coding one called Internal Transcribed Spacer (ITS), while between each repeated unit of rDNA there is another non-coding sequence called Intergenic Spacer (IGS) [29]. These DNA sequences are frequently used for phylogenetic studies of eukaryotic organisms [1], and the same approach was used to study N. ceranae also [3]. Therefore, rDNA has also been used to distinguish the different species belonging to the genus Nosema, especially N. ceranae from N. apis, both capable of infecting A. mellifera [30,31,32,33], as well as to evaluate the degree of intraspecific variability of those two microsporidia [31,34,35].In general, the quantification of N. ceranae abundance relies on primer pairs designed on different sequences of the same SSU-rRNA (16S rRNA) [36].
The first contribution of N. ceranae genome highlighted the possible presence of multiple copies of rDNA [26]. Various subsequent studies demonstrated their existence, and revealed a high degree of polymorphism between them [6,34,37]. Additionally, in other microsporidia, e.g. Encephalitozoon cuniculi, multiple copies of ribosomal genes are present, albeit they are homogeneous within the same genome [38]. The point that ribosomal genes are repeated within the genome is considered normal in eukaryotes. However, the repetitions are usually homogeneous or denote minimal variations in their sequences [39]. That occurs thanks to the phenomenon of concerted evolution, normally defined as the process by which the paralogous genes (genes repeated within the genome) present in a given species show greater sequence similarity compared to ortholog genes (genes with different origins but with similar functions) present in other related species [40]. Concerted evolution, therefore, provides for molecular mechanisms that prevent the independent evolution of repeated sequences, keeping them homogeneous within the genome. Ribosomal genes are among the best known examples of concerted evolution [39]. In the literature, however, there are other cases of eukaryotes in which rDNA was found to violate this mechanism; polymorphic copies of rDNA in the same genome were found both in eukaryotic microorganisms, Cryptosporidium parvum [41], Plasmodium berghei [42], and Prototheca wickerhamii [43], and in more complex eukaryotes, as grasshoppers [44] and flatworms [45]. The fact that rDNA variants are present in genome-wide does not necessarily mean that they are expressed in different ribosomes. However, in N. ceranae, the genetic variants of rDNA are transcribed and translated into functional proteins, suggesting changeable roles during the development life stages or under different environmental conditions [37].. Various subsequent studies have then demonstrated their actual existence, also and revealing revealed a high degree of polymorphism between them [6,34,37] [6,36,38]. Additionally, in other microsporidia, such ase.g. Encephalitozoon cuniculi, multiple copies of ribosomal genes are present, however, thesealbeit they are homogeneous within the same genome [38]. The point that ribosomal genes are repeated within the genome is considered normal in eukaryotes. However, the repetitions are usually homogeneous with each other, withor denote minimal variations in their sequences [39]. This That occurs thanks to the phenomenon of concerted evolution, normally defined as the process by which the paralogous genes (genes repeated within the genome) present in a given species, show greater sequence similarity to each other, rather thancompared to ortholog genes (genes with different origins but with similar functions) are present in other related species [40]. Concerted evolution, therefore, provides for molecular mechanisms that prevent the independent evolution of repeated sequences, keeping them homogeneous within the genome. Ribosomal genes are among the best known examples one of the greatest examples of concerted evolution [39]. In the literature, however, there are other cases of eukaryotes in which the rDNA has beenwas found to escape violate this mechanism; polymorphic copies of rDNA in the same genome have beenwere found both in eukaryotic microorganisms, such as Cryptosporidium parvum [41], Plasmodium berghei [42], and Prototheca wickerhamii [43], and in more complex eukaryotes, as eukaryotes more complex, such as grasshoppers [44] and flatworms [45]. The fact that rDNA variants are present in the genome-wide does not necessarily mean that thesye are expressed in different ribosomes. However, in N. ceranae, the genetic variants of rDNA are transcribed and translated into functional proteins, suggesting changeable roles during the development life stages or under differenttheir possible role during the different stages of development of microsporidium or in different environmental conditions [37].
On the other side, the Hsp70 gene codifies for one of the highest conserved proteins throughout the evolution [46]. That gene was found in a single copy in all organisms, including archaeobacteria, plants, fungi, and animals, as the coded protein is strictly related to species-specific functions [47,48]. In the case of Nosema spp., that protein protects the spores against overheating, therefore contributing to the microsporidium survival in hostile environments [49,50]. The literature shows that the highly conserved single-copy gene Hsp70 represents a better alternative to rDNA genes in the molecular approach to species-specific identification, quantification, and genotyping [51,52,53,54,55,56,57,58,59,60].
Several theories have been envisaged to explain the origin of the genetic variability observed in the N. ceranae rDNA. One of the most frequently advocated is the possibility that single colonies of A. mellifera become infected by multiple genetic variants of the microsporidium, thereafter multiplying asexually [7,34,61]. However, this hypothesis alone does not account for the variability observed within the different isolates, either considered as an entire colony or individual hosts [6,34]. This statement arises from the fact that the high levels of polymorphism reported for the various sequences within the different isolates (colonies or single bees), were found to be shared with other isolates from different geographical origins. In addition, subsequent attempts aimed at differentiating populations based on that polymorphism did not produce statistically valid results [7,34,61]. In other words, the different isolates are highly polymorphic within themselves, but they do not appear different from each other, suggesting a certain degree of gene flow [7,49]. A further source of genetic variability could be due to recombination, that may occur between the different genetic variants of N. ceranae infecting the same colony of A. mellifera [6,34]. Evidence of recombination between genetic sequences of N. ceranae was brought to light both for SSU-rDNA [34,37] and for several genes encoding structural proteins, such as DNA-directed RNA polymerase II subunit RPB1, Protein-tyrosine-phosphatase 1 (PTP1), PTP2, and PTP3 [34,37] and for several genes encoding structural proteins, such as DNA-directed RNA polymerase II subunit RPB1, Protein-tyrosine-phosphatase 1 (PTP1), PTP2, and PTP3 [6,7,49,61,62,63]. Such recombination events were reported in some cases as frequent [34,37,49,63], while in other cases as rare [6,61]. In addition to these results on N. ceranae, there are others on N. apis, reporting the observation of recombination phenomena for the RPB1 and PTP2 genes for this species [62].. Such recombination events would bewere reported considered in some cases as frequent [34,37,49,63], while in other cases as rare [6,61]. In addition to these results on N. ceranae, there are others on N. apis, which also reporting the observation of recombination phenomena for the RPB1 and PTP2 genes for this species [62].
Recombination in N. ceranae may result from a meiosis process, which occurs during the sexual phases of the life cycle, or parasexual phenomena, such as mitotic crossing-over, non-homologous recombination, and gene conversion [62].Recombination in N. ceranae cmay result from a ould occur through the meiosis process, which occurs during the sexual phases of the life cycle, or they could result from parasexual phenomena, such as mitotic crossing-over, non-homologous recombination, and gene conversion [62].
The maintenance of these genes in a reduced N. ceranae genome suggests their possible expression within a process of sexual reproduction [64]. Inferences about the presence of cryptic sexual reproduction have also been suggested for another species belonging to the Nosema genus, Nosema granulosis [65]. In this regard, it has been hypothesized that the common ancestor of the genus Nosema was endowed with sexual reproduction, which was lost repeatedly and independently in the different evolutionary lines [66].In this regard, it has been hypothesized that the common ancestor of the genus Nosema was endowed with sexual reproduction, which was lost repeatedly and and that this was then lost several times independently in the different evolutionary lines [66]. Despite that opens to the sexuality of N. ceranae, to date cytological evidence of the entire process or any of its phases has never been achieved [49] and which makes this microsporidium still considered asexual. A further hypothesis involves the clonal reproduction of N. ceranae, which would involve a high genetic variability in relation to polyploidy [6]. That stems from the possibility hypothesis that the microsporidia possess at least a tetraploid genome or two heterogeneous diploid nuclei [67].
Therefore, although clonal reproduction is the norm and the observed recombination events are considered ancestral [67], the repeatedly found heterogeneity of N. ceranae rDNA could be due to the presence of either multiple genetic variants that reproduce clonally or a single variant that is polyploid and therefore heterozygous for some markers [64]. The cause of these recombinations would be meiosis, which requires the fusion of two nuclei [64]. That process could take place between two heterogeneous nuclei present within the same spore or between nuclei belonging to genetically different spores during the multiplication of N. ceranae within the intestine of A. mellifera [64].
This investigation aimed to evaluate two different qPCR assays for quantifying the number of copies of N. ceranae present within individuals of A. mellifera. The two assays were based on sequences belonging to different target genes: 16S rRNA and Hsp70 which, due to their intrinsic characteristics, may affect the quantification differently.

2. Materials and Methods

2.1. Experimental Design

This study is a part of a laboratory treatment trial encompassing treated groups and untreated controls. The results on the effects against the N. ceranae infection have been reported previously [68]. In this paper, we concentrate on methodological aspects.
Briefly, in summer 2018, 450 newborn A. mellifera ligustica workers reared in an incubator from the brood of colonies selected from the apiary of CREA-AA (Bologna, Italy, 44°31′27.1″ N 11°21′03.6″ E) were inoculated with 187,500 purified N. ceranae spores/bee. The bees were reared in hoarding cages in groups of 25 each, fed with the test diets and kept at 33 °C throughout the experiment [68]. Whenever possible, five living individuals were sampled per cage, albeit bee mortality did not allow to complete the bee sampling in all groups. For this reason, 306 bees could be collected in total, which were stored at −20 °C until the molecular analysis.

2.2. DNA Extraction and qPCR

The sampled bees were analyzed individually. Once dissected, each digestive tract from the ventriculum to the rectum was collected in a microtube and homogenized in 1 mL nuclease-free water using Tissue Lyser II (Qiagen, Hilden, Germany) for 3 min at 30 Hz, as previously reported [69].
From each homogenate, the total DNA was extracted using a Quick DNA Microprep Plus Kit (Zymo Research, Irvine, CA, USA) following the procedure indicated for the processing of solid tissue. The DNA obtained was split into two aliquots, which were analyzed separately using two different primer pairs and probes designed on the sequence of the 16s rRNA [70] and Hsp70 [50] genes of N. ceranae (Table 1). For each specific target gene, 15 µL total reaction volume was prepared using 2xQuantiTect Probe PCR Master Mix (Qiagen), 2 µM forward and reverse primers, 500 nM probe, and 3 µL DNA extract.
The standard curve for each target gene was generated by the amplification of recombinant plasmids cloned with CloneJET PCR Cloning Kit (ThermoFisher Scientific, Waltham, MA, USA) containing the N. ceranae-specific DNA fragment diluted from 100 to 109 copies, as previously reported [69].
All the analyses were performed with two technical replicates.

2.3. Statistical Analysis

The N. ceranae abundance was determined at the individual level (N = 306) by averaging each of the two replicates for the two methods of qPCR. The number of N. ceranae copies detected in the same bee by the two methods was compared using a two-tailed T-test for paired samples. Due to a large number of samples, the control of the assumption of normality was not considered as stringent. The association between continuous variables was evaluated through the two-tailed Pearson correlation index. In addition, the abundance values obtained with both methods were used for the construction of a linear regression model, using the abundance values measured with 16S rRNA as the dependent variable and those obtained with Hsp70 as an explanatory independent variable. A further linear regression model was developed using as dependent variable the ratio between the abundance values obtained with both methods for each sample (16S rRNA/Hsp70) and as independent variable the abundance values measured with Hsp70.

3. Results

The averages of the values obtained with the two different methods are reported in Figure 1. The t-test performed on the samples indicated a higher number of copies detected with the 16S rRNA method (1,568,482.9 ± 53,725.1 se, SD = 939,805.8) compared to the Hsp70 ones (152,579.8 ± 5,853.1 se, SD = 102,388.2) (t (305) = + 28.991, p = 0.000).
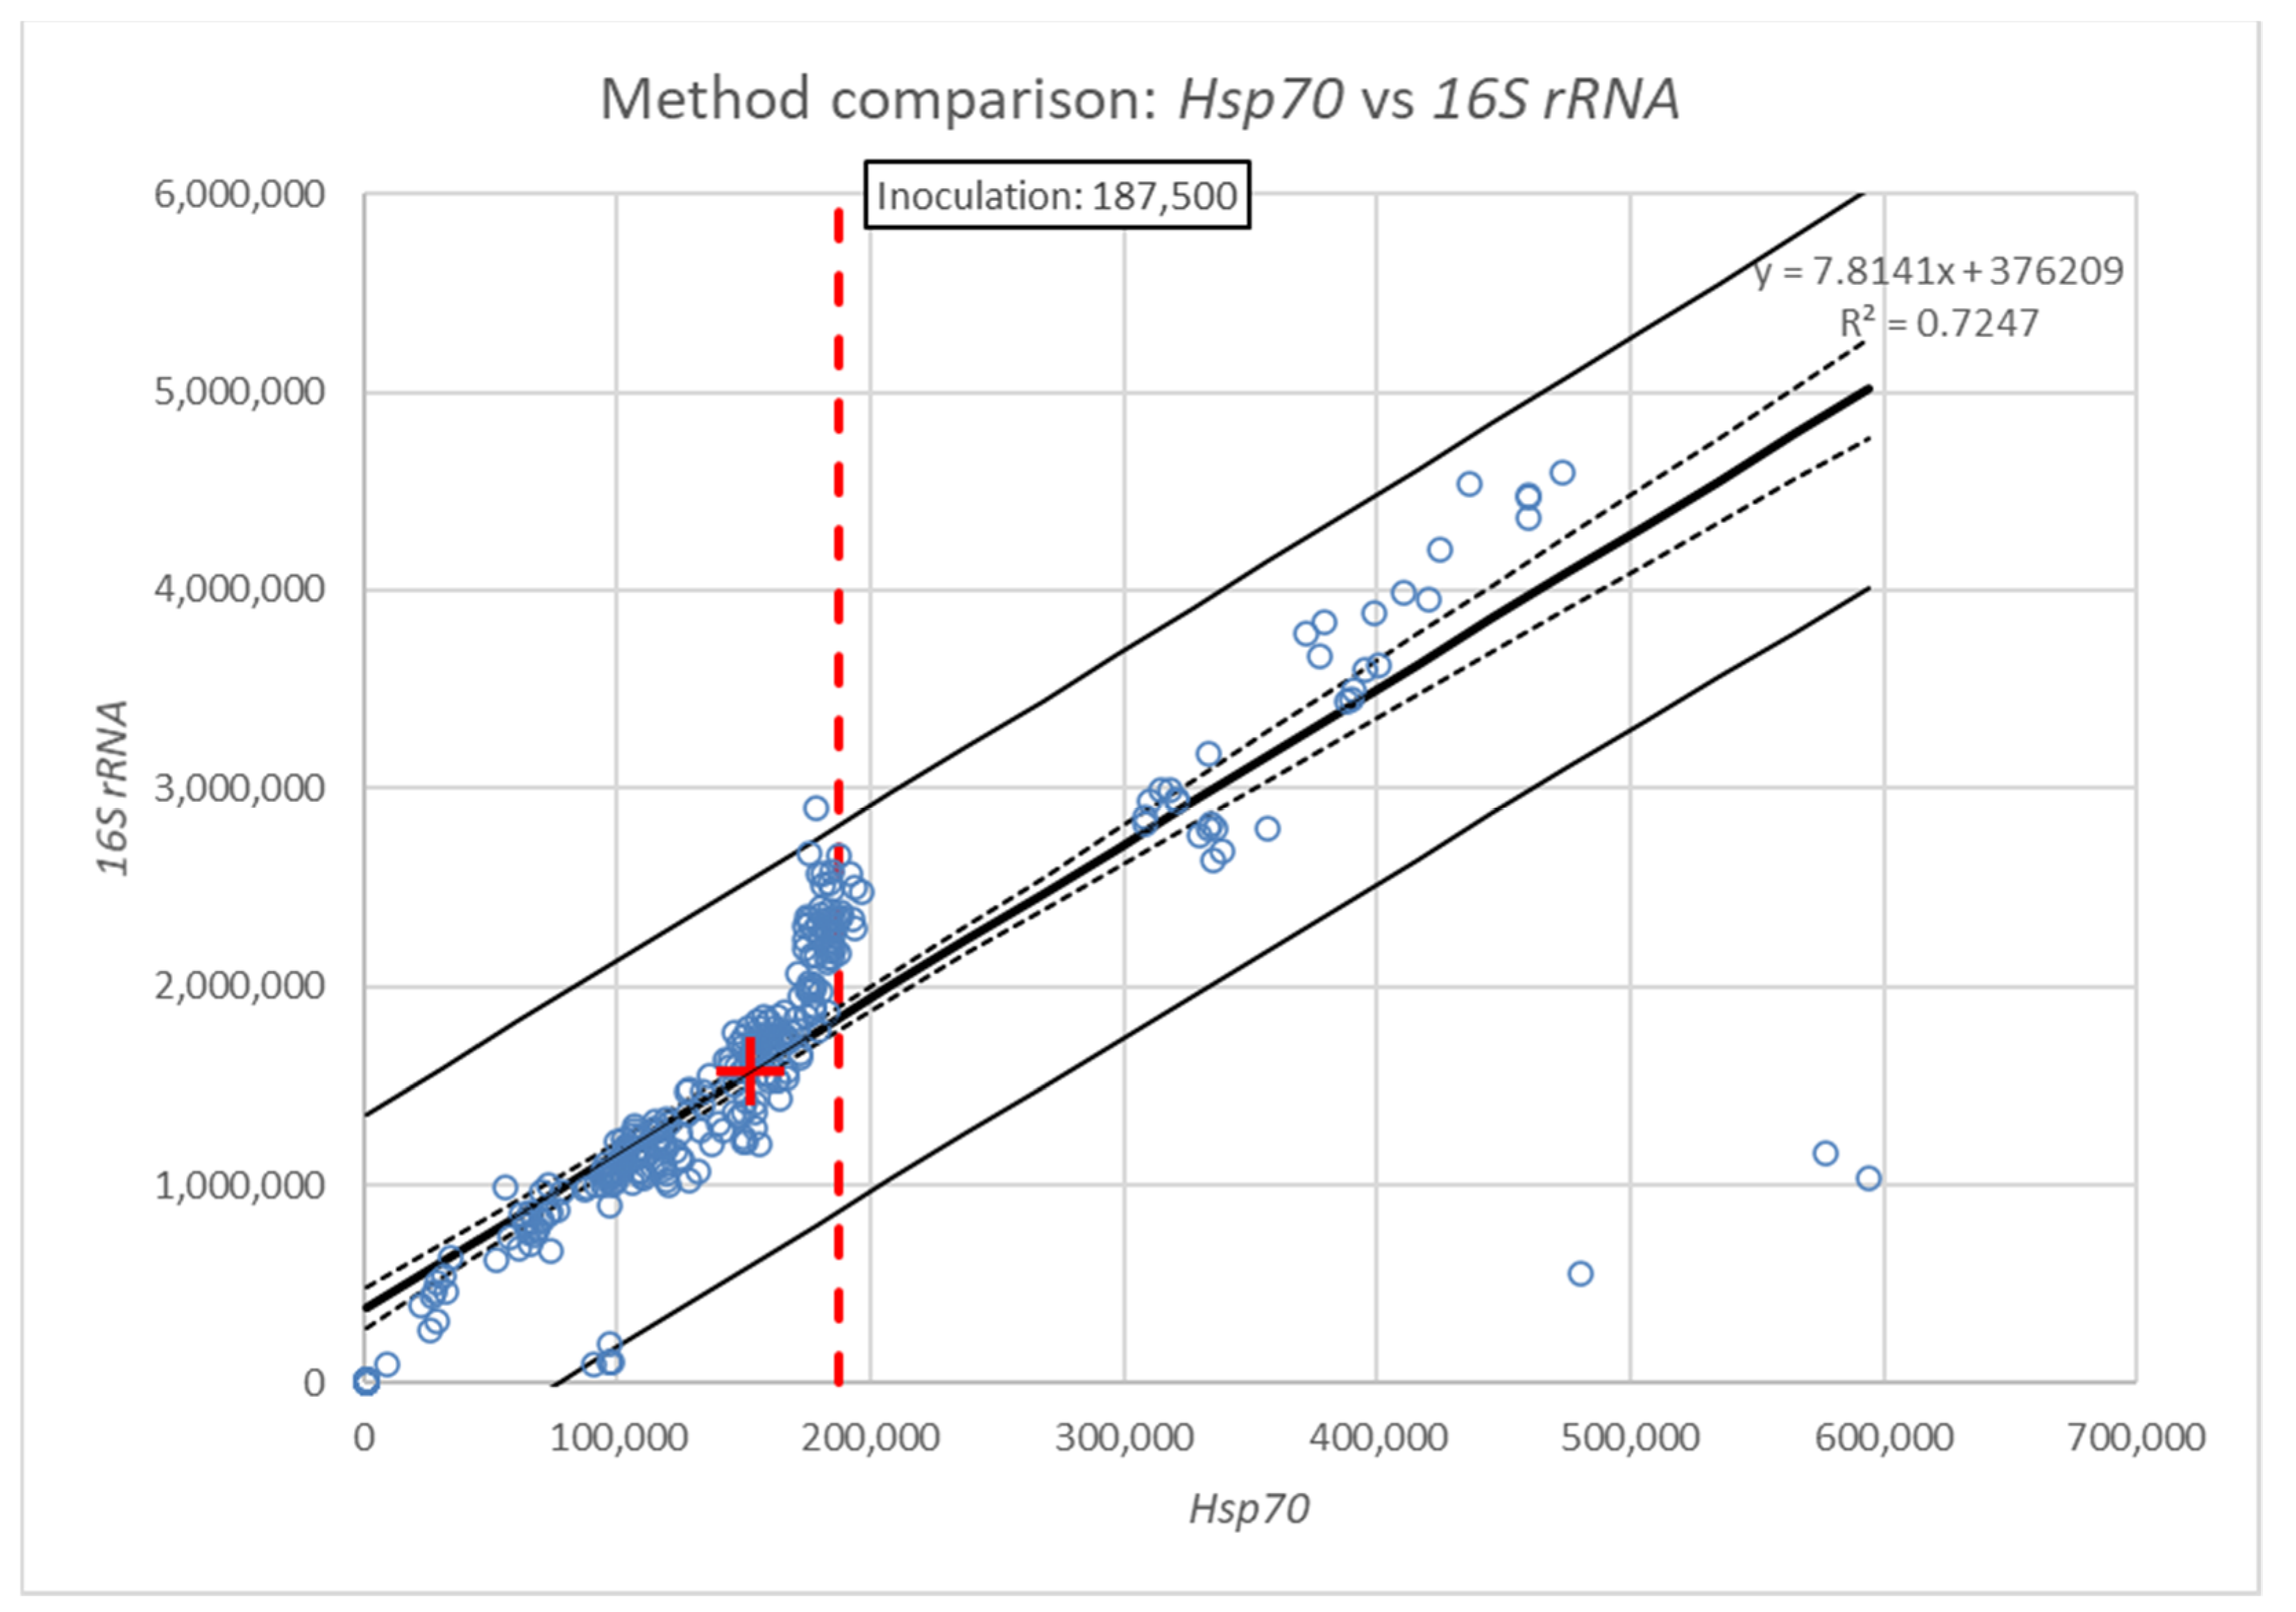
A positive correlation was calculated between the two analytical data series (r (306) = 0.851, p = 0.000). In a linear regression model (Table 2), the abundance obtained with 16S rRNA was considered as the dependent variable versus the abundance obtained with Hsp70 considered as the independent predictor variable (Figure 2).
The regression model is significant (p = 0.000), indicating the existence of a relationship between the two variables. Similarly, the intercept and slope values are also significant (p = 0.000). The obtained regression index (R2) is high (0.724), therefore in this model, the independent variable (Hsp70) has a strong influence in the determination of the dependent one (16S rRNA). However, the forecast interval is very wide, and this is not compatible with an effective forecast of the value obtained with 16S rRNA, starting from that obtained with Hsp70 and vice versa. In addition, the graph highlights an anomaly in the distribution of the values, which tends to concentrate around the number of copies relating to the dose of inoculum (187500). This is related to the fact that most of the bees analyzed were subjected to treatments with substances that produced efficacy against N. ceranae.
Concerning the 16S rRNA/Hsp70 ratio, the minimum and maximum values were 1.01 and 18.68, respectively. The distribution of values reached maximum frequency in the range 10.00 to 12.00 (50.3% of all values), with most of the remaining ones positioned in the ranges 8.00 to 10.00 and 12.00 to 14.00 (total 41.2% of all values. Only a few other observations fell outside the ranges mentioned (8.5% of all values).
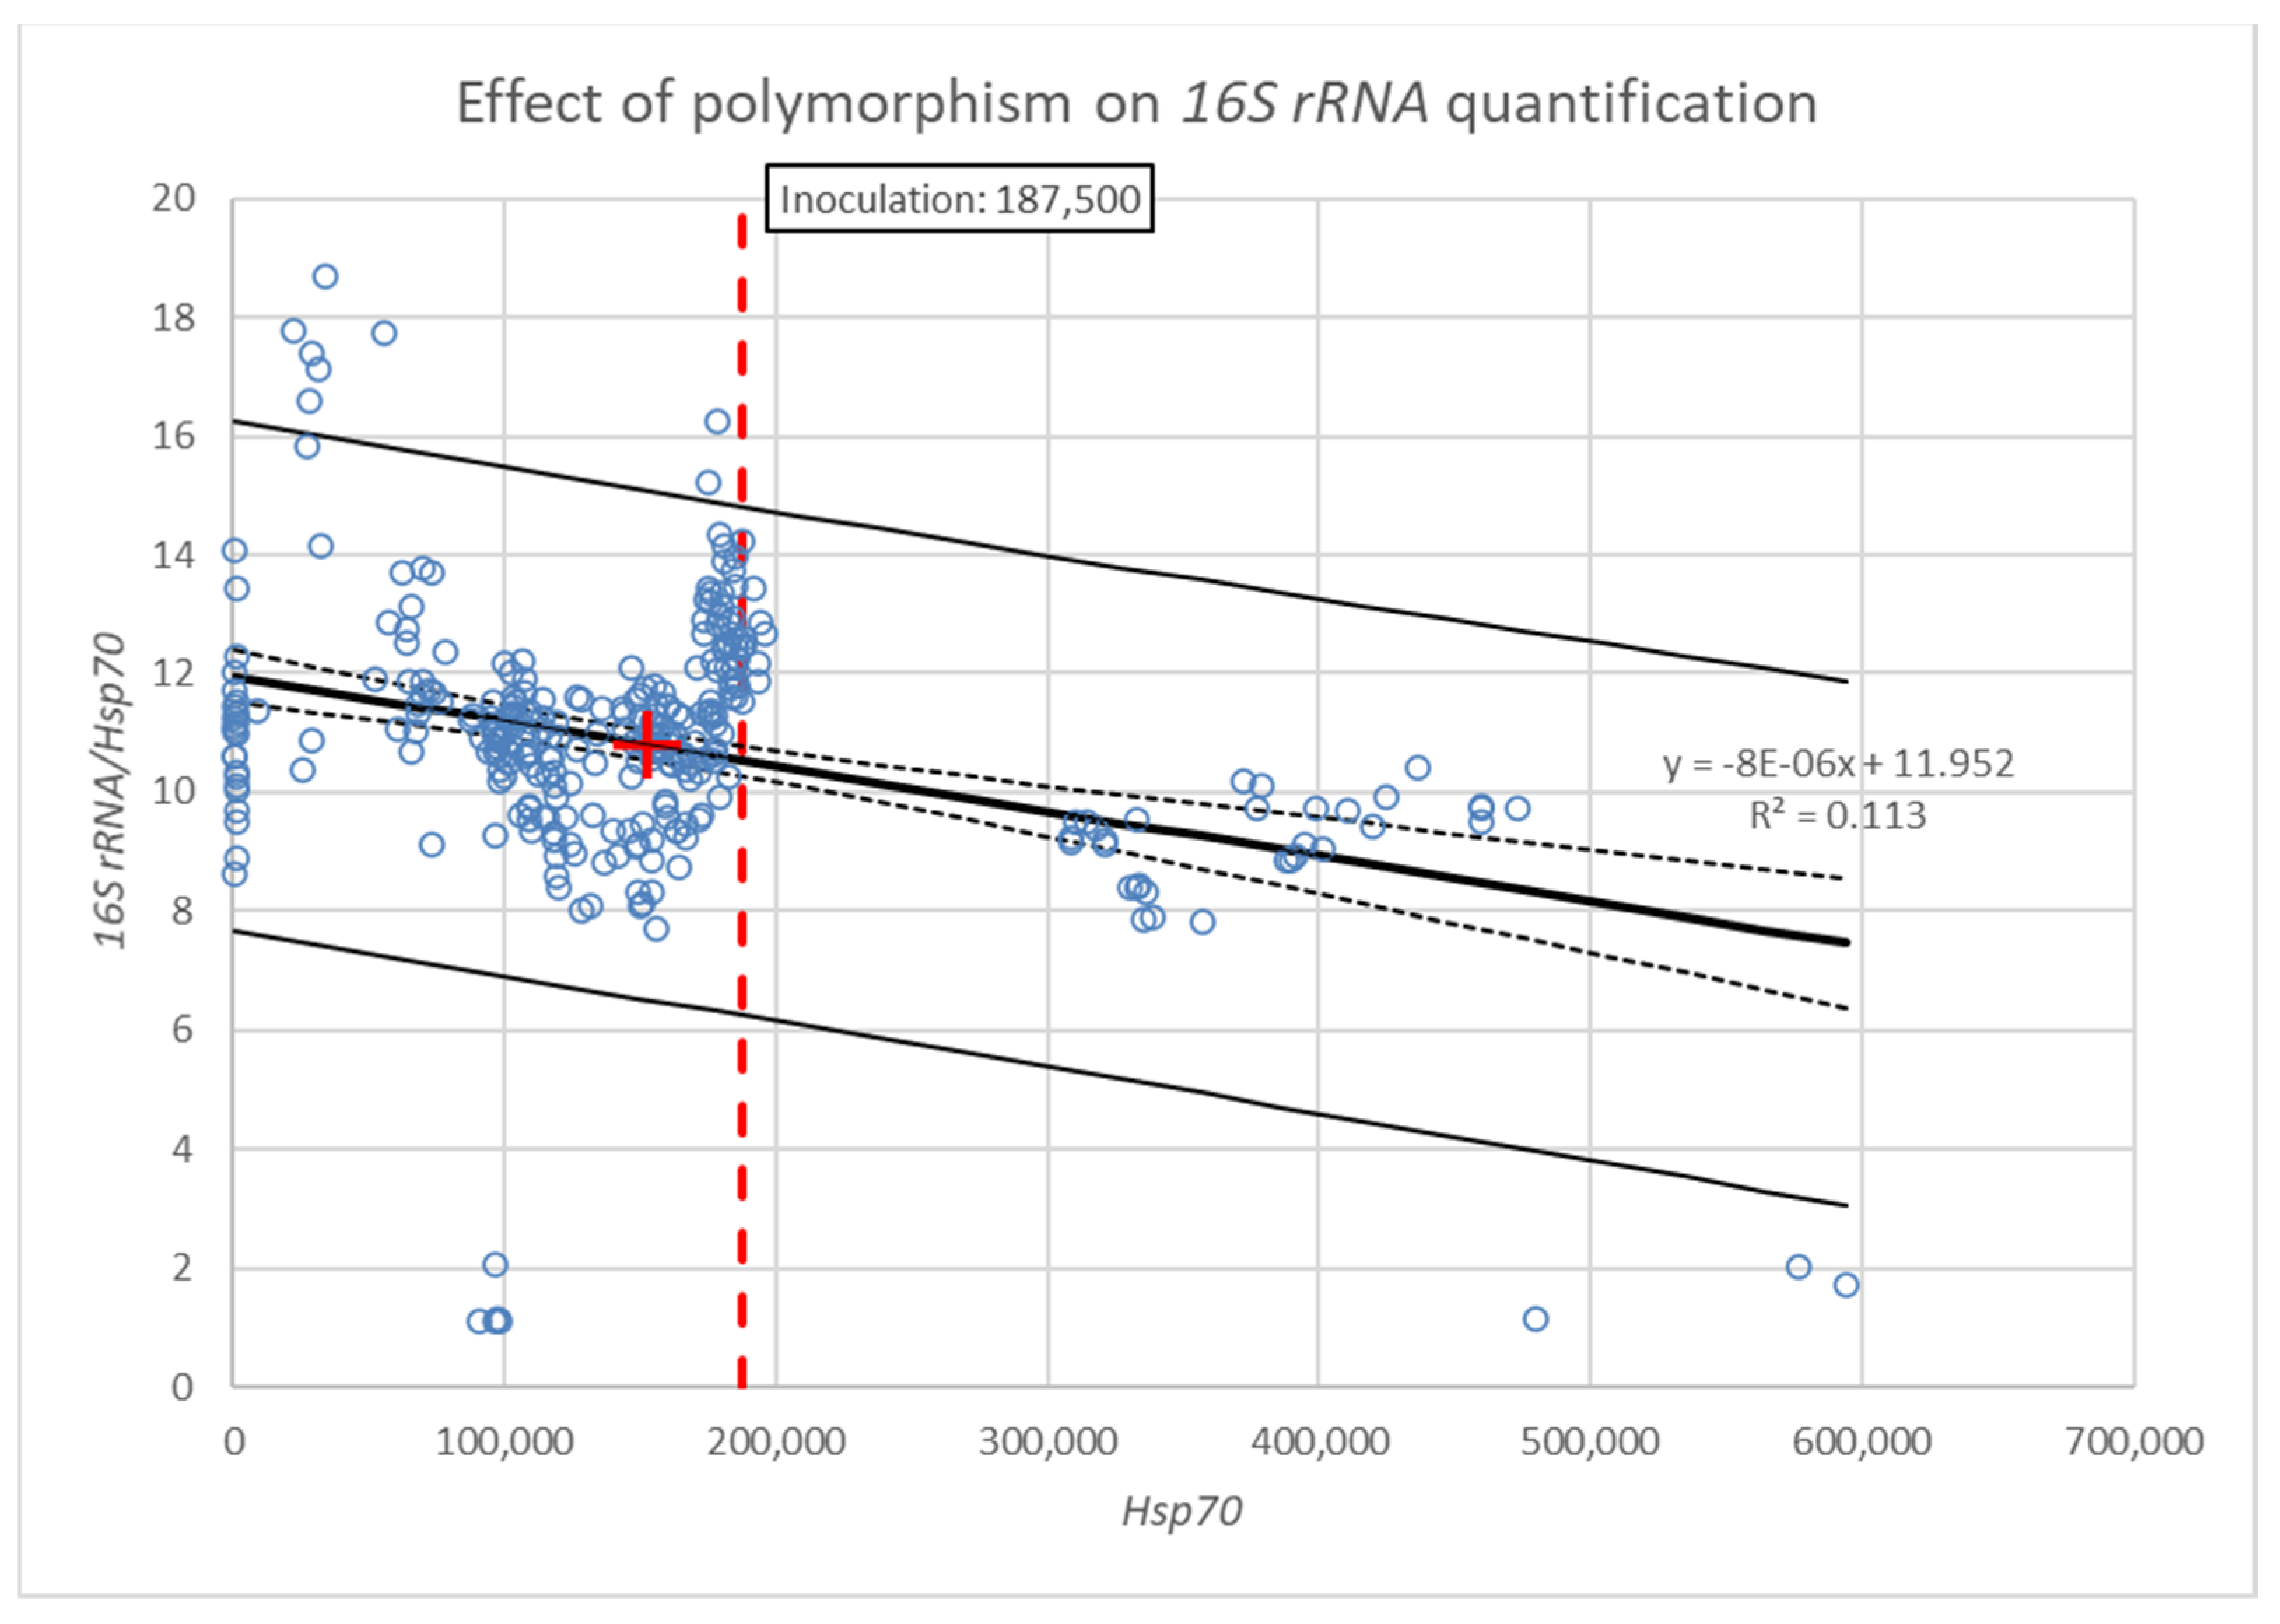
In a further linear regression model (Table 3), the 16S rRNA/Hsp70 ratio was considered as the dependent variable against the abundance obtained with Hsp70 considered as the independent predictor variable (Figure 3).
Additionally, in this case, the regression model, the intercept values, and the slope values are significant (p = 0.000), however, the coefficient of determination (R2) is low (0.113), indicating the presence of other factors capable of influencing the dependent variable, not considered in the model. The graph highlights the already observed accumulation of data around the inoculation zone, but furthermore, it indicates that near this threshold the 16S rRNA/Hsp70 ratio tends to assume greater variability, signaling an increase in the polymorphism of the 16S rRNA gene in correspondence with these values.
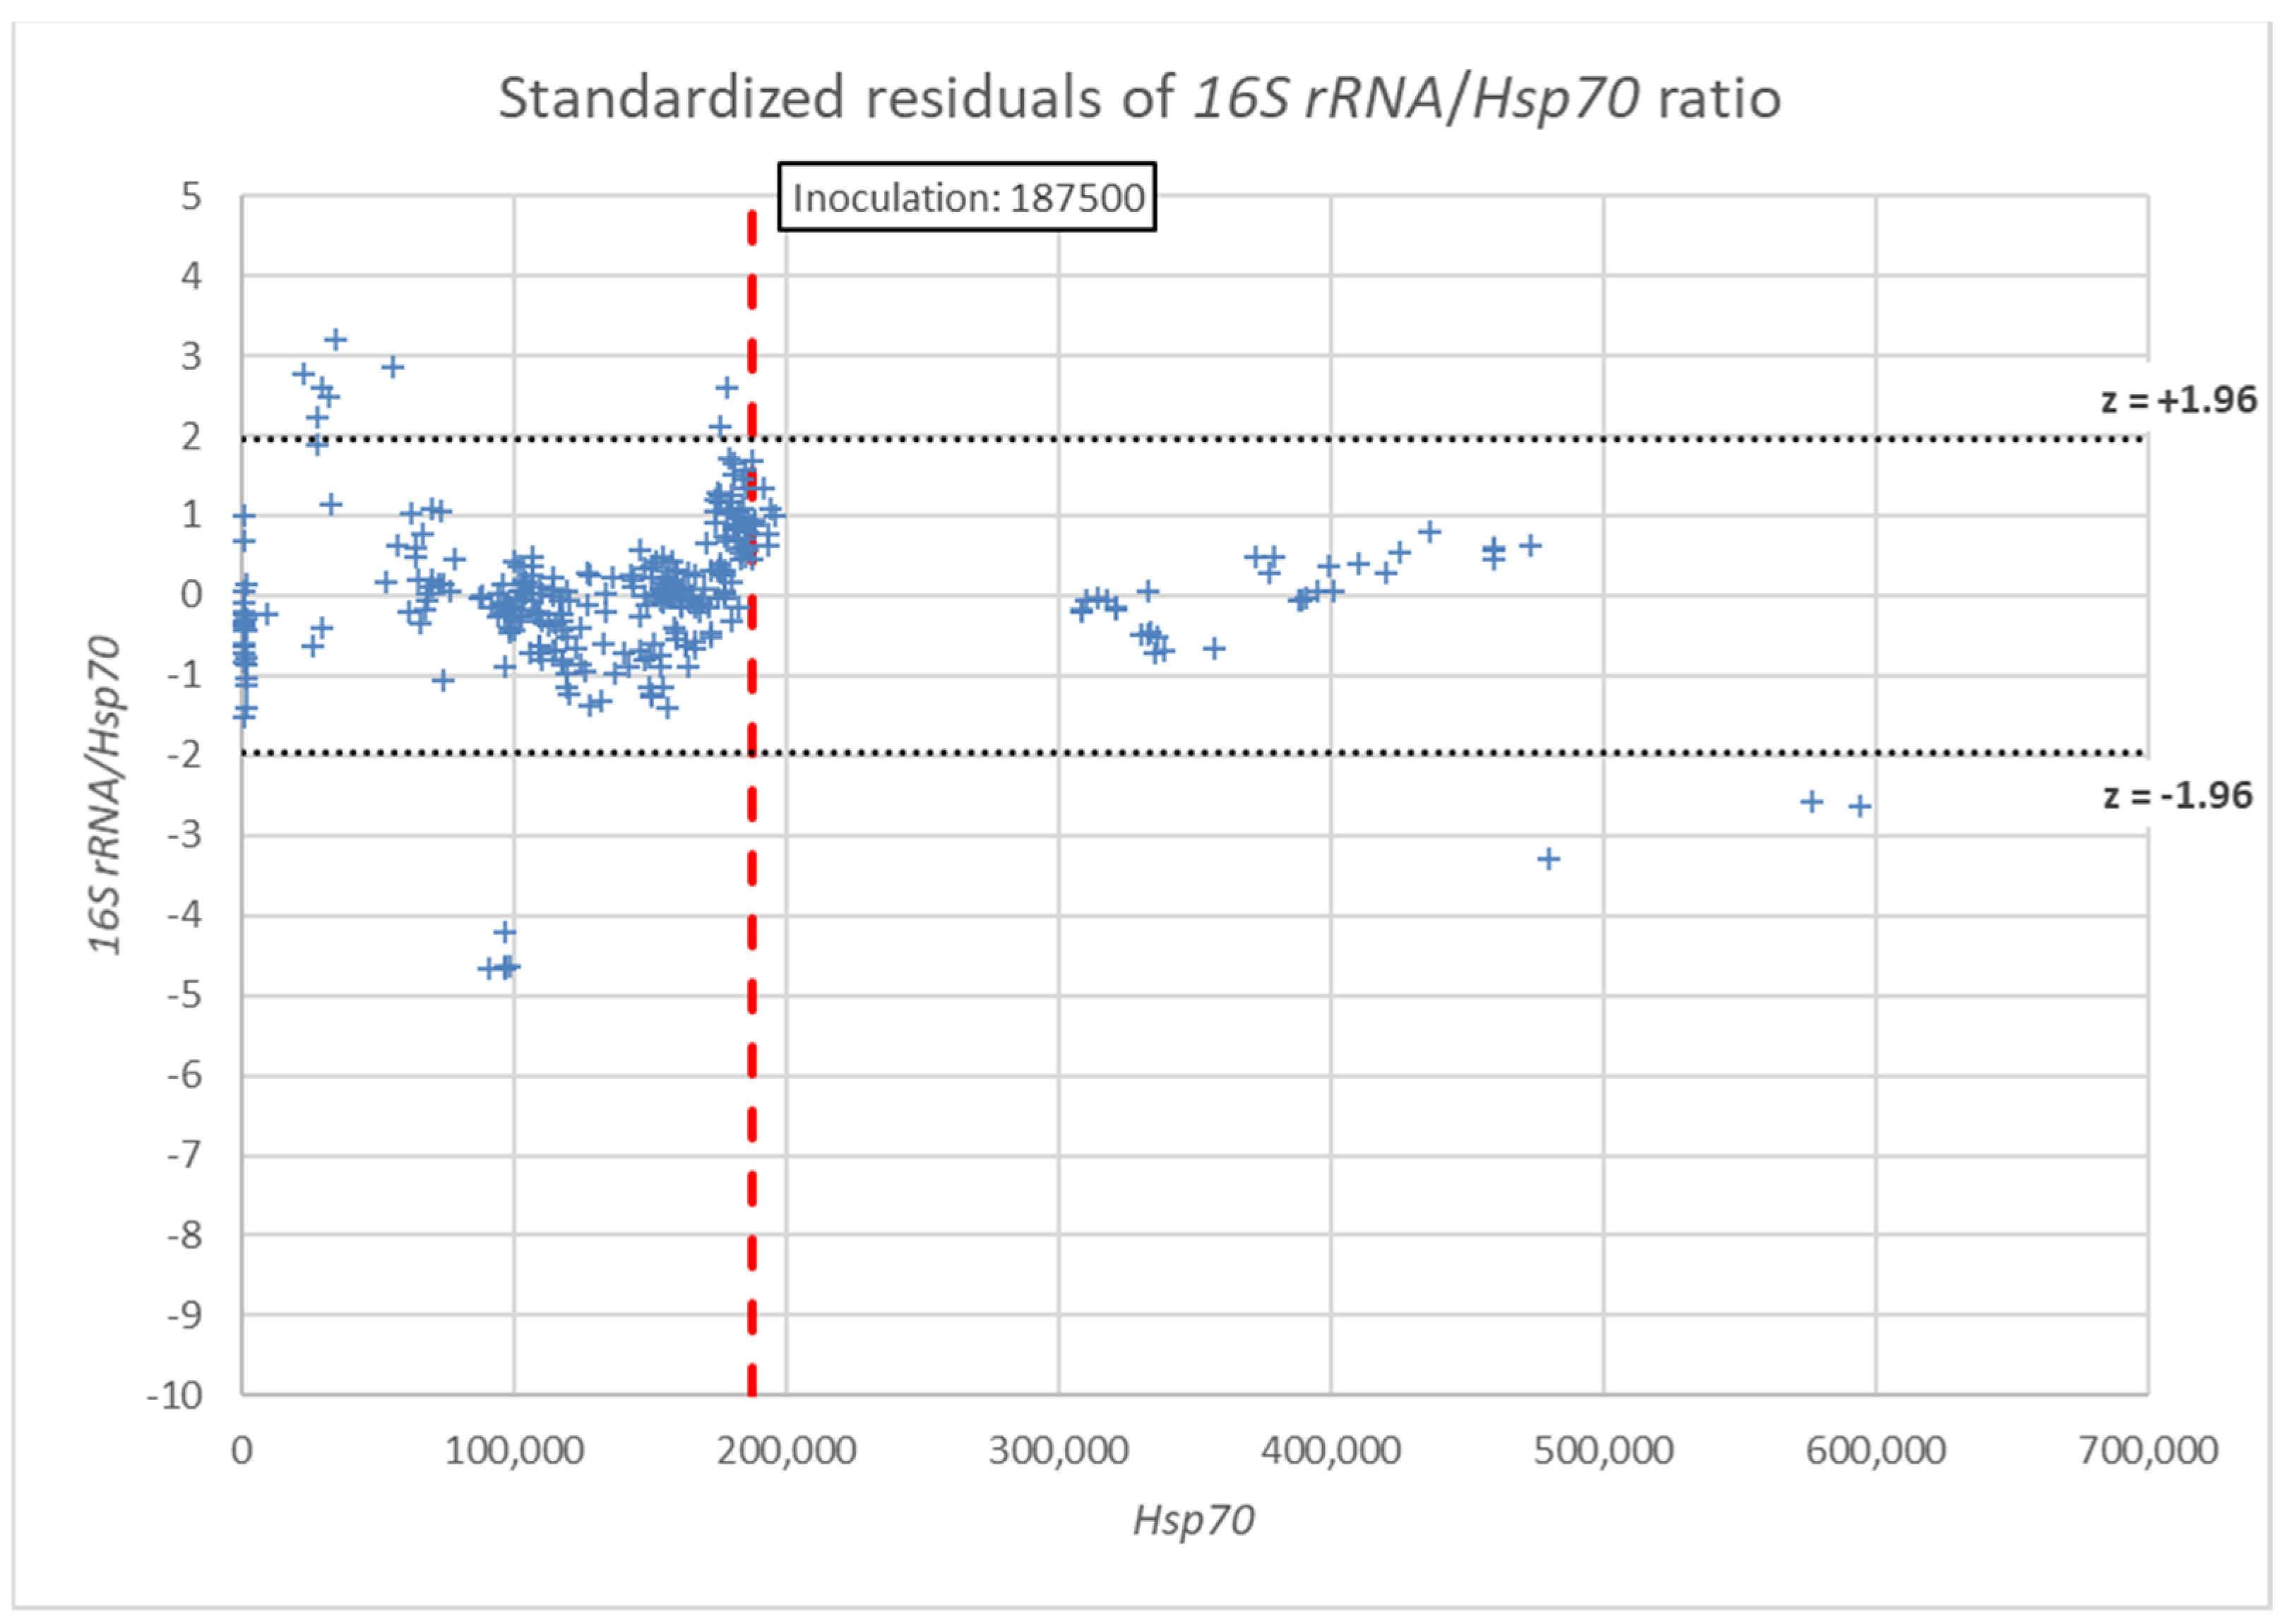
The analysis of the standardized residues of the 16S rRNA/Hsp70 ratio revealed a data distribution compatible with normality, as only few values fell outside the 95% boundaries of the normally distributed data (Figure 4).

4. Discussion

In this investigation we wanted to compare two different methods of qPCR, in use to quantify the number of N. ceranae copies present in infected A. mellifera samples. Those methods differ mainly for the target sequence in the microsporidian DNA, in that they respectively amplify sequences belonging to the genes coding for 16S rRNA (SSU-rDNA) and Hsp70 (Heat Shock Protein).
The comparison indicates that the abundance obtained with the qPCR technique based on 16S rRNA is systematically higher. This observation is in line with what reported in other comparative studies considering the same methods [8,69], where the authors detected instable ratios between the data obtained on different samples. This variability was also observed in the present study, with values of the 16S rRNA/Hsp70 ratio oscillating between 1.01 and 18.68. Those values are in line with previous observations [8], where the ratio varied within a range of 1.35 and 16.53. Besides, the distribution of the 16S rRNA/Hsp70 ratio did not appear evenly distributed, as the frequency peaked between 10.00 and 12.00, with more than 50% of all observed values included in that range and 91.5% of all values in the range 8.00–13.00. This indicates that the observed large variability was concentrated within a specific range. The average ratio was 10.80, which is higher but still in line with the previously observed value of 8.59 [8]. Since in the N. ceranae genome the Hsp70 gene is present as a single copy [49,52], whereas the 16S rRNA gene is polymorphic, with high variability, and presenting an undefined number of copies in its genome [34,37], we can assume that the 16S rRNA/Hsp70 ratio reflects the number of 16S rRNA copies present in the N. [34,37], it we can be assumed that the 16S rRNA/Hsp70 ratio reflects the copy number of 16S rRNA copies present in the N. ceranae genome of the considered samples.
Based on both observed data and literature, it is possible to hypothesize that 16S rRNA is generally present in N. ceranae in an average number of copies oscillating between 8 and 14. This hypothesis is in agreement with what reported by Bourgeois et al. (2010), who suggest that approximately 10 copies of the gene are present [70]. However, it is necessary to consider that the qPCR analysis was performed on the total DNA extracted from a single individual of A. mellifera, which can contain millions of N. ceranae copies [71]. As all the data obtained, including the 16S rRNA/Hsp70 ratio, refer to a given infecting N. ceranae population, the number of 16S rRNA copies represent the average for the population found within the host bees in the sample. As indicated, the calculated ratio largely falls within a specific range. However, the lowest (e.g., 1.12; 1.73; 2.01) and highest (e.g., 16.61; 17.78; 18.68) values (Supplementary Table S1) account for high genetic variability in N. ceranae [6,49,64,67]. To explain the genetic variability observed in this microsporidium, two main explanations were proposed. The first hypothesis suggests the presence of a single clonal N. ceranae population, with dikaryotic and polyploid spores [6,67]. Although this hypothesis partly clarifies the extensive genetic variability in N. ceranae, it does not appear explanatory of the observed values. Considering, as suggested, a tetraploid genome, it would be possible to have four variants of ribosomal genes in each spore [67]. These variants could differ from each other both in terms of repeated number of copies and nucleotide sequences which, taken together, would determine the average copy number of 16S rRNA for a given N. ceranae spore. However, assuming clonal reproduction, all spores would maintain a high degree of genetic similarity and, therefore, the values observed in different isolates should be characterized by constancy or little variability, making it unlikely to observe the ratios mentioned above. The second hypothesis includes the possibility that every single infected individual of A. mellifera contains a heterogeneous population made of a number of N. ceranae genetic variants [7,34,49,61,64]. Those variants, would be polymorphic for a certain number of sequences in their genome, including the 16S rRNA gene, that would be present in multiple copies. Therefore, the average number of 16S rRNA copies for a given N. ceranae population infecting an individual A. mellifera, would depend on the specific genetic variants present within the host. This second hypothesis appears to account for a larger variability of the 16S rRNA/Hsp70 ratio [7,34,49,61,64]. Theose genetic variants, would in addition to being polymorphic for a certain number of sequences placed alongin their genome, including would also be polymorphic forthe 16S rRNA gene, as well asthat would be presenting a different number of repetitions for this genein multiple copies. Therefore, the average number of copies of 16S rRNA copies for a given N. ceranae population of N. ceranae infecting an individual of A. mellifera, wouldill depend on the specific genetic variants present within the host. TThrough this second hypothesis, therefore, appears to account for a larger it is possible to include greater variability of the 16S rRNA/Hsp70 ratio.
However, the aspects above provide only a limited perspective. Indeed, there is clear evidence of recombination in N. ceranae, both in sequences coding for specific proteins [7,49,61,62,63] and in ribosomal genes [6,34,37]. Recombination requires fusion of two nuclei followed by meiosis, which allows to obtain new variants. This could happen both between two nuclei present within the same spore and between nuclei coming from different spores, admitting, in this case, the presence of a cryptic sexual phase in an organism that has been so far considered asexual [64]. The occurrence of recombinant events could therefore lead to the generation of variants with a new number of copies of the 16S rRNA gene. Recombination events could also generate new nucleotide sequences on that gene. If the new sequences were formed at the pairing sites of the primers used in the qPCR assay, the primers would not pair, preventing amplification and leading to a low 16S rRNA/Hsp70 ratio value. It is then necessary to consider that in the specific case of rDNA further mechanisms, in addition to meiosis, could lead to recombination. One of them is the Sister Chromatid Exchange (SCE) implying that, during DNA replication, two identical chromosomes pair up and exchange portions [72]. Considering that the ribosomal genes of N. ceranae are present at least in tandem and as variably repeated number of copies within the same genome [26,34], new sequences of this gene could be generated through the recombination of the different repetitions [34], without the need of a fusion between two nuclei. However, this mechanism would not be effective in the case of the Hsp70 gene, as it represents a highly conserved portion present in a single copy in the N. ceranae genome [49,52]. For this reason, the 16S rRNA gene can be considered much more prone to recombination than Hsp70. The picture may be completed considering that a number of microsporidian genes derives from the horizontal genetic transfer (HGT), to which other organisms, mainly bacteria, concur [73]. In N. ceranae, the 0.44 to 1.31% of the genes result from HGT events [73]. The occurrence of such events between prokaryotes and eukaryotes are not rare and, in most cases, they end in the functional loss of the newly acquired gene or in its more or less rapid erosion [74]. Erosion is the phenomenon by which a given species loses races and populations, but in this case, the term refers to the loss of N. ceranae alleles [75,76]. Factors promoting HGT events include an organism’s ability to acquire exogenous DNA, accessibility to its “germline” and the frequency of exogenous DNA “donors” in the environment [74]. From this point of view, N. ceranae and other microsporidia, as a unicellular eukaryotic parasite, are candidates particularly prone to acquire exogenous DNA. Each N. ceranae spore represents a single germline and the organ in which it stabilizes in A. mellifera, the ventricle, as a part of the digestive system is colonized by an extensive bacterial flora, consisting of at least 9 different species [77]. To this adds the environmental microbial contamination. Therefore, microsporidia like N. ceranae, when penetrating the host, may come into contact with exogenous bacterial DNA dispersed in the environment, that may subsequently acquired [73]. Such a mechanism might have occurred with 16s rRNA bacterial genes, which may have been repeatedly incorporated independently into the different genetic variants of N. ceranae, further expanding the observed variability of the number of 16S rRNA copies. It is, therefore, clear that qPCR methods based on the amplification of 16S rRNA are not accurate in precisely defining the extent of the infection. Doubts about the use of this gene in diagnostics have also been previously raised. In a comparative study, it has been indicated that primer-based PCR assays capable of amplifying a sequence belonging to 16S rRNA can produce false negatives or, in the case of mixed infections of N. apis and N. ceranae, overestimate the infection of the latter pathogen [78]. Further evidence is provided reporting false negative results using assays based on 16S rRNA [79], and indicating that assays based on this gene can amplify sequences belonging to N. apis, so altering the analytical result [80]. It is true that both studies base on End Point PCR assays; however, those primers can be used in Real Time PCR assays also and, as the low reliability has to be ascribed to the molecular characteristics of 16S rRNA, those statements can also be extended to the latter technique. The other assay considered in the study is based on the amplification of a highly conserved sequence belonging to the Hsp70 gene. This gene is present in a single copy within the N. ceranae genome [49,52] and no evidence of intraspecific genetic variability has been reported so far [50]. Furthermore, it was shown to be specific for N. ceranae, generating no reaction with DNA from N. apis [50]. For these characteristics, this assay represents a valid and reliable alternative in the quantification of the number of N. ceranae copies in a honey bee sample.
The regression analysis highlighted an anomaly in the distribution corresponding to a number of copies close to the inoculated dose (187,500 spores/bee), indicating an increased 16S rRNA polymorphism. Given the specific experimental conditions, the bees were unable to defecate, so unloading the intestinal spores. Likely, in that area of the distribution concentrated spores that were killed or made quiescent by the experimental treatments in progress, whereas vegetative forms of the pathogen were prevailing elsewhere. The coincidence of the high concentration of spores in an area of high polymorphism of 16S rRNA would therefore be compatible with a potential accentuation of this phenomenon in the forms of resistance compared to the vegetative ones. Alternatively, the dead or quiescent spores could undergo degradation within the infected tissues, thus releasing nucleic acids in the cellular matrix. Fragments of dispersed 16S rRNA could therefore be acquired from viable spores or vegetative forms of N. ceranae in a similar way to what happens with other microorganisms [73], thus altering the quantification and thus also increasing the eventual 16S rRNA/Hsp70 ratio.

5. Conclusions

The experiment showed that the use of qPCR assays based on the 16S rRNA gene results in the systematic detection of a higher number of copies than the assay based on the Hsp70 gene, thus overestimating the quantitative infection. This is certainly related to the multi-copy nature of 16S rRNA, however, the ratio between the two measurements is not constant, making it impossible to obtain a quick conversion factor between the two values. Considering that Hsp70 is present in a single copy, the cause of this variability is to be found in the nature of 16S rRNA, which is subject to a more frequent recombination. Therefore, the qPCR assay based on Hsp70 appears to be a valid and reliable alternative for the precise quantification of the number of copies of N. ceranae. Using diagnostic tools with these characteristics it will be possible to develop effective treatments against this pathogen, thus reducing the pollinator decline due to this pathogen. In addition, the experimental conditions characterized by artificial infections with N. ceranae spores, and the impossibility of defecation seem capable of influencing the polymorphism of the 16S rRNA gene through an increase in dead spores within the intestine of A. mellifera. These would inherently possess a greater polymorphism than the vegetative forms or could constitute a source of exogenous 16S rRNA for the viable forms of N. ceranae, representing a further negative aspect to consider if a qPCR assay based on this gene is to be used.

Supplementary Materials

The following are available online at https://www.mdpi.com/article/10.3390/app12010422/s1, Table S1. Detailed information for all samples in this study: honey bee ID, number of copies detected in each replicate for each target gene (Hsp70 and 16srRNA) and their ratio.

Author Contributions

Conceptualization, G.C. and A.N.; methodology, G.C., G.L., and A.N.; formal analysis, G.C. and G.L.; investigation, G.C. and G.L.; data curation, G.C., G.L. and A.N.; writing—original draft preparation, G.C., G.L. and A.N.; writing—review and editing, G.C., G.L., and A.N.; supervision, G.C. and A.N.; project administration, A.N.; funding acquisition, A.N. All authors have read and agreed to the published version of the manuscript.

Funding

This research was funded by the Italian Ministry of Agricultural, Food and Forestry Policies (MIPAAF), through the National Beekeeping Plan 2017-19, year 2019, within the frame of the Regulation (EU) No. 1308/2013 of the European Parliament and the Council and by the project BeeNet (Italian National Fund under FEASR 2014-2020 from MIPAAF.

Institutional Review Board Statement

Not applicable.

Informed Consent Statement

Not applicable.

Data Availability Statement

MDPI Research Data Policies.

Conflicts of Interest

The authors declare no conflict of interest.

References

  1. Fries, I. Nosema ceranae in European honey bees (Apis mellifera). J. Invertebr. Pathol. 2010, 103, S73–S79. [Google Scholar] [CrossRef]
  2. Botías, C.; Martín-hernández, R.; Barrios, L.; Meana, A.; Higes, M. Nosema spp. infection and its negative effects on honey bees (Apis mellifera iberiensis ) at the colony level. Vet. Res. 2013, 44, 1–14. [Google Scholar] [CrossRef] [PubMed] [Green Version]
  3. Fries, I.; Feng, F.; Da Silva, A.; Slemenda, S.B.; Pieniazek, N.J. Nosema ceranae n. sp. (Microspora, Nosematidae), morphological and molecular characterization of a microsporidian parasite of the Asian honey bee Apis cerana (Hymenoptera, Apidae). Eur. J. Protistol. 1996, 32, 356–365. [Google Scholar] [CrossRef]
  4. Klee, J.; Besana, A.M.; Genersch, E.; Gisder, S.; Nanetti, A.; Tam, D.Q.; Chinh, T.X.; Puerta, F.; Ruz, J.M.; Kryger, P.; et al. Widespread dispersal of the microsporidian Nosema ceranae, an emergent pathogen of the western honey bee, Apis mellifera. J. Invertebr. Pathol. 2007, 96, 1–10. [Google Scholar] [CrossRef] [PubMed]
  5. Higes, M.; Martín, R.; Meana, A. Nosema ceranae, a new microsporidian parasite in honeybees in Europe. J. Invertebr. Pathol. 2006, 92, 93–95. [Google Scholar] [CrossRef] [PubMed]
  6. Roudel, M.; Aufauvre, J.; Corbara, B.; Delbac, F.; Blot, N. New insights on the genetic diversity of the honeybee parasite Nosema ceranae based on multilocus sequence analysis. Parasitology 2013, 140, 1346–1356. [Google Scholar] [CrossRef]
  7. Van der Zee, R.; Gómez-Moracho, T.; Pisa, L.; Sagastume, S.; García-Palencia, P.; Maside, X.; Bartolomé, C.; Martín-Hernández, R.; Higes, M. Virulence and polar tube protein genetic diversity of Nosema ceranae (Microsporidia) field isolates from Northern and Southern Europe in honeybees (Apis mellifera iberiensis). Environ. Microbiol. Rep. 2014, 6, 401–413. [Google Scholar] [CrossRef] [PubMed]
  8. Cilia, G.; Sagona, S.; Giusti, M.; Jarmela dos Santos, P.E.; Nanetti, A.; Felicioli, A. Nosema ceranae infection in honeybee samples from Tuscanian Archipelago (Central Italy) investigated by two qPCR methods. Saudi J. Biol. Sci. 2019, 26, 1553–1556. [Google Scholar] [CrossRef]
  9. Higes, M.; García-Palencia, P.; Martín-Hernández, R.; Meana, A. Experimental infection of Apis mellifera honeybees with Nosema ceranae (Microsporidia). J. Invertebr. Pathol. 2007, 94, 211–217. [Google Scholar] [CrossRef] [PubMed]
  10. Higes, M.; Martín-Hernández, R.; Botías, C.; Bailón, E.G.; González-Porto, A.V.; Barrios, L.; Del Nozal, M.J.; Bernal, J.L.; Jiménez, J.J.; Palencia, P.G.; et al. How natural infection by Nosema ceranae causes honeybee colony collapse. Environ. Microbiol. 2008, 10, 2659–2669. [Google Scholar] [CrossRef]
  11. Higes, M.; García-Palencia, P.; Urbieta, A.; Nanetti, A.; Martín-Hernández, R. Nosema apis and Nosema ceranae Tissue Tropism in Worker Honey Bees (Apis mellifera). Vet. Pathol. 2020, 57, 132–138. [Google Scholar] [CrossRef] [PubMed]
  12. Giersch, T.; Berg, T.; Galea, F.; Hornitzky, M. Nosema ceranae infects honey bees ( Apis mellifera ) and contaminates honey in Australia. Apidologie 2009, 40, 117–123. [Google Scholar] [CrossRef] [Green Version]
  13. Eiri, D.M.; Suwannapong, G.; Endler, M.; Nieh, J.C. Nosema ceranae Can Infect Honey Bee Larvae and Reduces Subsequent Adult Longevity. PLoS ONE 2015, 10, e0126330. [Google Scholar] [CrossRef] [PubMed] [Green Version]
  14. Higes, M.; Martín-Hernández, R.; Garrido-Bailón, E.; González-Porto, A.V.; García-Palencia, P.; Meana, A.; del Nozal, M.J.; Mayo, R.; Bernal, J.L.; Kamer, Y.; et al. Honeybee colony collapse due to Nosema ceranae in professional apiaries. Environ. Microbiol. Rep. 2009, 1, 110–113. [Google Scholar] [CrossRef]
  15. Nanetti, A.; Bortolotti, L.; Cilia, G. Pathogens Spillover from Honey Bees to Other Arthropods. Pathogen 2021, 10, 1044. [Google Scholar] [CrossRef]
  16. Graystock, P.; Yates, K.; Darvill, B.; Goulson, D.; Hughes, W.O.H. Emerging dangers: Deadly effects of an emergent parasite in a new pollinator host. J. Invertebr. Pathol. 2013, 114, 114–119. [Google Scholar] [CrossRef]
  17. Purkiss, T.; Lach, L. Pathogen spillover from Apis mellifera to a stingless bee. Proc. R. Soc. B Biol. Sci. 2019, 286, 20191071. [Google Scholar] [CrossRef] [PubMed] [Green Version]
  18. Brown, M.J.F. Microsporidia: An Emerging Threat to Bumblebees? Trends Parasitol. 2017, 33, 754–762. [Google Scholar] [CrossRef]
  19. Porrini, M.P.; Porrini, L.P.; Garrido, P.M.; De Melo, C.; Neto, S.; Porrini, D.P.; Muller, F.; Nuñez, L.A.; Alvarez, L.; Fernandez Iriarte, P.; et al. Nosema ceranae in South American Native Stingless Bees and Social Wasp. Microb. Ecol. 2017, 74, 761–764. [Google Scholar] [CrossRef]
  20. Ravoet, J.; De Smet, L.; Meeus, I.; Smagghe, G.; Wenseleers, T.; de Graaf, D.C. Widespread occurrence of honey bee pathogens in solitary bees. J. Invertebr. Pathol. 2014, 122, 55–58. [Google Scholar] [CrossRef] [PubMed]
  21. Ilyasov, R.A.; Gaifullina, L.R.; Saltykova, E.S.; Poskryakov, A.V.; Nikolenko, A.G. Review of the expression of antimicrobial peptide defensin in honey bees Apis mellifera L. J. Apic. Sci. 2012, 56, 115–124. [Google Scholar] [CrossRef] [Green Version]
  22. Higes, M.; Martín-Hernández, R.; Garrido-Bailón, E.; Botías, C.; García-Palencia, P.; Meana, A. Regurgitated pellets of Merops apiaster as fomites of infective Nosema ceranae (Microsporidia) spores. Environ. Microbiol. 2008, 10, 1374–1379. [Google Scholar] [CrossRef] [PubMed]
  23. Valera, F.; Martín-Hernández, R.; Higes, M. Evaluation of large-scale dissemination of Nosema ceranae spores by European bee-eaters Merops apiaster. Environ. Microbiol. Rep. 2011, 3, 47–53. [Google Scholar] [CrossRef]
  24. Cilia, G.; Cardaio, I.; dos Santos, P.E.J.; Ellis, J.D.; Nanetti, A. The first detection of Nosema ceranae (Microsporidia) in the small hive beetle, Aethina tumida Murray (Coleoptera: Nitidulidae). Apidologie 2018, 49, 619–624. [Google Scholar] [CrossRef] [Green Version]
  25. Wadi, L.; Reinke, A.W. Evolution of microsporidia: An extremely successful group of eukaryotic intracellular parasites. PLoS Pathog. 2020, 16, e1008276. [Google Scholar] [CrossRef]
  26. Cornman, R.S.; Chen, Y.; Schatz, M.C.; Street, C.; Zhao, Y.; Desany, B.; Egholm, M.; Hutchison, S.; Pettis, J.S.; Lipkin, W.I.; et al. Genomic analyses of the microsporidian Nosema ceranae, an emergent pathogen of honey bees. PLoS Pathog. 2009, 5, 1000466. [Google Scholar] [CrossRef]
  27. Chen, Y.; Pettis, J.S.; Zhao, Y.; Liu, X.; Tallon, L.J.; Sadzewicz, L.D.; Li, R.; Zheng, H.; Huang, S.; Zhang, X.; et al. Genome sequencing and comparative genomics of honey bee microsporidia, Nosema apis reveal novel insights into host-parasite interactions. BMC Genom. 2013, 14, 1–16. [Google Scholar] [CrossRef] [PubMed] [Green Version]
  28. Gregory, R.T. Genome Size Evolution in Animals; Elsevier Inc.: Amsterdam, The Netherlands, 2005; ISBN 9780123014634. [Google Scholar]
  29. Ironside, J.E. Diversity and Recombination of Dispersed Ribosomal DNA and Protein Coding Genes in Microsporidia. PLoS ONE 2013, 8, 55878. [Google Scholar] [CrossRef] [PubMed] [Green Version]
  30. Huang, W.F.; Jiang, J.H.; Chen, Y.W.; Wang, C.H. A Nosema ceranae isolate from the honeybee Apis mellifera. Apidologie 2007, 38, 30–37. [Google Scholar] [CrossRef]
  31. Chen, Y.; Evans, J.D.; Zhou, L.; Boncristiani, H.; Kimura, K.; Xiao, T.; Litkowski, A.M.; Pettis, J.S. Asymmetrical coexistence of Nosema ceranae and Nosema apis in honey bees. J. Invertebr. Pathol. 2009, 101, 204–209. [Google Scholar] [CrossRef] [PubMed]
  32. Martín-Hernández, R.; Meana, A.; Prieto, L.; Salvador, A.M.; Garrido-Bailón, E.; Higes, M. Outcome of colonization of Apis mellifera by Nosema ceranae. Appl. Environ. Microbiol. 2007, 73, 6331–6338. [Google Scholar] [CrossRef] [Green Version]
  33. Williams, G.R.; Shafer, A.B.A.; Rogers, R.E.L.; Shutler, D.; Stewart, D.T. First detection of Nosema ceranae, a microsporidian parasite of European honey bees (Apis mellifera), in Canada and central USA. J. Invertebr. Pathol. 2008, 97, 189–192. [Google Scholar] [CrossRef] [PubMed]
  34. Sagastume, S.; del Águila, C.; Martín-Hernández, R.; Higes, M.; Henriques-Gil, N. Polymorphism and recombination for rDNA in the putatively asexual microsporidian Nosema ceranae, a pathogen of honeybees. Environ. Microbiol. 2011, 13, 84–95. [Google Scholar] [CrossRef]
  35. Huang, W.F.; Bocquet, M.; Lee, K.C.; Sung, I.H.; Jiang, J.H.; Chen, Y.W.; Wang, C.H. The comparison of rDNA spacer regions of Nosema ceranae isolates from different hosts and locations. J. Invertebr. Pathol. 2008, 97, 9–13. [Google Scholar] [CrossRef] [PubMed]
  36. Fries, I.; Chauzat, M.-P.; Chen, Y.-P.; Doublet, V.; Genersch, E.; Gisder, S.; Higes, M.; McMahon, D.P.; Martín-Hernández, R.; Natsopoulou, M.; et al. Standard methods for Nosema research. J. Apic. Res. 2013, 52, 1–28. [Google Scholar] [CrossRef] [Green Version]
  37. Sagastume, S.; Martín-Hernández, R.; Higes, M.; Henriques-Gil, N. Ribosomal gene polymorphism in small genomes: Analysis of different 16s rRNA sequences expressed in the honeybee parasite Nosema ceranae (Microsporidia). J. Eukaryot. Microbiol. 2014, 61, 42–50. [Google Scholar] [CrossRef] [PubMed]
  38. Katinka, M.D.; Duprat, S.; Cornillott, E.; Méténler, G.; Thomarat, F.; Prensier, G.; Barbe, V.; Peyretaillade, E.; Brottier, P.; Wincker, P.; et al. Genome sequence and gene compaction of the eukaryote parasite Encephalitozoon cuniculi. Nature 2001, 414, 450–453. [Google Scholar] [CrossRef] [Green Version]
  39. Liao, D. Concerted evolution: Molecular mechanism and biological implications. Am. J. Hum. Genet. 1999, 64, 24–30. [Google Scholar] [CrossRef] [PubMed] [Green Version]
  40. Ganley, A.R.D. Concerted Evolution. In Reference Module in Life Sciences; Elsevier: Amsterdam, The Netherlands, 2017. [Google Scholar]
  41. Rooney, A.P. Mechanisms underlying the evolution and maintenance of functionally heterogeneous 18S rRNA genes in apicomplexans. Mol. Biol. Evol. 2004, 21, 1704–1711. [Google Scholar] [CrossRef] [PubMed] [Green Version]
  42. Nishimoto, Y.; Arisue, N.; Kawai, S.; Escalante, A.A.; Horii, T.; Tanabe, K.; Hashimoto, T. Evolution and phylogeny of the heterogeneous cytosolic SSU rRNA genes in the genus Plasmodium. Mol. Phylogenet. Evol. 2008, 47, 45–53. [Google Scholar] [CrossRef]
  43. Ueno, R.; Huss, V.A.R.; Urano, N.; Watabe, S. Direct evidence for redundant segmental replacement between multiple 18S rRNA genes in a single Prototheca strain. Microbiology 2007, 153, 3879–3893. [Google Scholar] [CrossRef] [Green Version]
  44. Keller, I.; Chintauan-Marquier, I.C.; Veltsos, P.; Nichols, R.A. Ribosomal DNA in the grasshopper Podisma pedestris: Escape from concerted evolution. Genetics 2006, 174, 863–874. [Google Scholar] [CrossRef] [PubMed] [Green Version]
  45. Carranza, S.; Baguñà, J.; Riutort, M. Origin and evolution of paralogous rRNA gene clusters within the flatworm family Dugesiidae (Platyhelminthes, Tricladida). J. Mol. Evol. 1999, 49, 250–259. [Google Scholar] [CrossRef] [PubMed] [Green Version]
  46. Daugaard, M.; Rohde, M.; Jäättelä, M. The heat shock protein 70 family: Highly homologous proteins with overlapping and distinct functions. FEBS Lett. 2007, 581, 3702–3710. [Google Scholar] [CrossRef] [PubMed] [Green Version]
  47. Schwerin, M.; Maak, S.; Kalbe, C.; Fuerbass, R. Functional promoter variants of highly conserved inducible hsp70 genes significantly affect stress response. Biochim. Biophys. Acta 2001, 1522, 108–111. [Google Scholar] [CrossRef]
  48. Gupta, R.S.; Singh, B. Phylogenetic analysis of 70 kD heat shock protein sequences suggests a chimeric origin for the eukaryotic cell nucleus. Curr. Biol. 1994, 4, 1104–1114. [Google Scholar] [CrossRef]
  49. Gómez-Moracho, T.; Maside, X.; Martín-Hernández, R.; Higes, M.; Bartolomé, C. High levels of genetic diversity in Nosema ceranae within Apis mellifera colonies. Parasitology 2014, 141, 475–481. [Google Scholar] [CrossRef]
  50. Cilia, G.; Cabbri, R.; Maiorana, G.; Cardaio, I.; Dall’Olio, R.; Nanetti, A. A novel TaqMan® assay for Nosema ceranae quantification in honey bee, based on the protein coding gene Hsp70. Eur. J. Protistol. 2018, 63, 44–50. [Google Scholar] [CrossRef]
  51. Dong, Z.; Long, J.; Huang, L.; Hu, Z.; Chen, P.; Hu, N.; Zheng, N.; Huang, X.; Lu, C.; Pan, M. Construction and application of an HSP70 promoter-inducible genome editing system in transgenic silkworm to induce resistance to Nosema bombycis. Appl. Microbiol. Biotechnol. 2019, 103, 9583–9592. [Google Scholar] [CrossRef]
  52. Wang, Y.; Ru, Y.; Liu, W.; Wang, D.; Zhou, J.; Jiang, Y.; Shi, S.; Qin, L. Morphological characterization and HSP70-, IGS-based phylogenetic analysis of two microsporidian parasites isolated from Antheraea pernyi. Parasitol. Res. 2017, 116, 971–977. [Google Scholar] [CrossRef] [PubMed]
  53. Gobet, P.; Toze, S. Sensitive genotyping of Cryptosporidium parvum by PCR-RFLP analysis of the 70-kilodalton heat shock protein (HSP70) gene. FEMS Microbiol. Lett. 2001, 200, 37–41. [Google Scholar] [CrossRef] [Green Version]
  54. Garcés-Sanchez, G.; Wilderer, P.A.; Munch, J.C.; Horn, H.; Lebuhn, M. Evaluation of two methods for quantification of hsp70 mRNA from the waterborne pathogen Cryptosporidium parvum by reverse transcription real-time PCR in environmental samples. Water Res. 2009, 43, 2669–2678. [Google Scholar] [CrossRef]
  55. Germot, A.; Philippe, H.; Le Guyader, H. Evidence for loss of mitochondria in Microsporidia from a mitochondrial-type HSP70 in Nosema locustae. Mol. Biochem. Parasitol. 1997, 87, 159–168. [Google Scholar] [CrossRef]
  56. Zampieri, R.A.; Laranjeira-Silva, M.F.; Muxel, S.M.; Stocco de Lima, A.C.; Shaw, J.J.; Floeter-Winter, L.M. High Resolution Melting Analysis Targeting hsp70 as a Fast and Efficient Method for the Discrimination of Leishmania Species. PLoS Negl. Trop. Dis. 2016, 10, e0004485. [Google Scholar] [CrossRef] [Green Version]
  57. Deane, E.E.; Woo, N.Y.S. Impact of heavy metals and organochlorines on hsp70 and hsc70 gene expression in black sea bream fibroblasts. Aquat. Toxicol. 2006, 79, 9–15. [Google Scholar] [CrossRef]
  58. Lee, G.C.; Nam, S.H.; Chae, J.C.; Lee, C.H. Giardia duodenalis: Improved detection of viable cysts by reverse transcription-PCR of heat shock-inducible hsp70 gene. Exp. Parasitol. 2009, 123, 377–380. [Google Scholar] [CrossRef]
  59. Liang, Z.; Keeley, A. Detection of viable Cryptosporidium parvum in soil by reverse transcription-real-time PCR targeting hsp70 mRNA. Appl. Environ. Microbiol. 2011, 77, 6476–6485. [Google Scholar] [CrossRef] [PubMed]
  60. Piao, L.X.; Aosai, F.; Chen, M.; Fang, H.; Mun, H.S.; Norose, K.; Yano, A. A quantitative assay method of Toxoplasma gondii HSP70 mRNA by quantitative competitive-reverse transcriptase-PCR. Parasitol. Int. 2004, 53, 49–58. [Google Scholar] [CrossRef] [PubMed]
  61. Gómez-Moracho, T.; Bartolomé, C.; Martín-Hernández, R.; Higes, M.; Maside, X. Evidence for weak genetic recombination at the PTP2 locus of Nosema ceranae. Environ. Microbiol. 2015, 17, 1300–1309. [Google Scholar] [CrossRef]
  62. Maside, X.; Gómez-Moracho, T.; Jara, L.; Martín-Hernández, R.; De La Rúa, P.; Higes, M.; Bartolomé, C. Population genetics of Nosema apis and Nosema ceranae: One host (apis mellifera) and two different histories. PLoS ONE 2015, 10, e0145609. [Google Scholar] [CrossRef] [Green Version]
  63. Gómez-Moracho, T.; Bartolomé, C.; Bello, X.; Martín-Hernández, R.; Higes, M.; Maside, X. Recent worldwide expansion of Nosema ceranae (Microsporidia) in Apis mellifera populations inferred from multilocus patterns of genetic variation. Infect. Genet. Evol. 2015, 31, 87–94. [Google Scholar] [CrossRef] [PubMed]
  64. Sagastume, S.; Martín-Hernández, R.; Higes, M.; Henriques-Gil, N. Genotype diversity in the honey bee parasite Nosema ceranae: Multi-strain isolates, cryptic sex or both? BMC Evol. Biol. 2016, 16, 216. [Google Scholar] [CrossRef] [Green Version]
  65. Krebes, L.; Zeidler, L.; Frankowski, J.; Bastrop, R. (Cryptic) sex in the microsporidian Nosema granulosis – Evidence from parasite rDNA and host mitochondrial DNA. Infect. Genet. Evol. 2014, 21, 259–268. [Google Scholar] [CrossRef]
  66. Ironside, J.E. Multiple losses of sex within a single genus of Microsporidia. BMC Evol. Biol. 2007 71 2007, 7, 1–16. [Google Scholar] [CrossRef] [PubMed] [Green Version]
  67. Pelin, A.; Selman, M.; Aris-Brosou, S.; Farinelli, L.; Corradi, N. Genome analyses suggest the presence of polyploidy and recent human-driven expansions in eight global populations of the honeybee pathogen Nosema ceranae. Environ. Microbiol. 2015, 17, 4443–4458. [Google Scholar] [CrossRef]
  68. Nanetti, A.; Ugolini, L.; Cilia, G.; Pagnotta, E.; Malaguti, L.; Cardaio, I.; Matteo, R.; Lazzeri, L. Seed Meals from Brassica nigra and Eruca sativa Control Artificial Nosema ceranae Infections in Apis mellifera. Microorganisms 2021, 9, 949. [Google Scholar] [CrossRef]
  69. Cilia, G.; Garrido, C.; Bonetto, M.; Tesoriero, D.; Nanetti, A. Effect of Api-Bioxal ® and ApiHerb ® Treatments against Nosema ceranae Infection in Apis mellifera Investigated by Two qPCR Methods. Vet. Sci. 2020, 7, 125. [Google Scholar] [CrossRef]
  70. Bourgeois, A.L.; Rinderer, T.E.; Beaman, L.D.; Danka, R.G. Genetic detection and quantification of Nosema apis and N. ceranae in the honey bee. J. Invertebr. Pathol. 2010, 103, 53–58. [Google Scholar] [CrossRef]
  71. Paxton, R.J.; Klee, J.; Korpela, S.; Fries, I. Nosema ceranae has infected Apis mellifera in Europe since at least 1998 and may be more virulent than Nosema apis. Apidologie 2007, 38, 558–565. [Google Scholar] [CrossRef]
  72. Wilson, D.M.; Thompson, L.H. Molecular mechanisms of sister-chromatid exchange. Mutat. Res. -Fundam. Mol. Mech. Mutagen. 2007, 616, 11–23. [Google Scholar] [CrossRef] [PubMed]
  73. Alexander, W.G.; Wisecaver, J.H.; Rokas, A.; Hittinger, C.T. Horizontally acquired genes in early-diverging pathogenic fungi enable the use of host nucleosides and nucleotides. Proc. Natl. Acad. Sci. USA 2016, 113, 4116–4121. [Google Scholar] [CrossRef] [PubMed] [Green Version]
  74. Husnik, F.; McCutcheon, J.P. Functional horizontal gene transfer from bacteria to eukaryotes. Nat. Publ. Gr. 2017, 16, 67–79. [Google Scholar] [CrossRef]
  75. Mortier, J.; Gayán, E.; Van Eyken, R.; Torres Montaguth, O.E.; Khodaparast, L.; Khodaparast, L.; Houben, B.; Carpentier, S.; Rousseau, F.; Schymkowitz, J.; et al. Gene Erosion Can Lead to Gain-of-Function Alleles That Contribute to Bacterial Fitness. MBio 2021, 12. [Google Scholar] [CrossRef]
  76. Brown, B.P.; Wernegreen, J.J. Genomic erosion and extensive horizontal gene transfer in gut-associated Acetobacteraceae. BMC Genomics 2019, 20, 1–15. [Google Scholar] [CrossRef] [Green Version]
  77. Kwong, W.K.; Moran, N.A. Gut microbial communities of social bees. Nat. Rev. Microbiol. 2016, 14, 374–384. [Google Scholar] [CrossRef]
  78. Gisder, S.; Genersch, E. Molecular differentiation of Nosema apis and Nosema ceranae based on species–specific sequence differences in a protein coding gene. J. Invertebr. Pathol. 2013, 113, 1–6. [Google Scholar] [CrossRef]
  79. Stevanovic, J.; Stanimirovic, Z.; Genersch, E.; Kovacevic, S.R.; Ljubenkovic, J.; Radakovic, M.; Aleksic, N. Dominance of Nosema ceranae in honey bees in the Balkan countries in the absence of symptoms of colony collapse disorder. Apidologie 2011, 42, 49–58. [Google Scholar] [CrossRef] [Green Version]
  80. Erler, S.; Lommatzsch, S.; Lattorff, H.M.G. Comparative analysis of detection limits and specificity of molecular diagnostic markers for three pathogens (Microsporidia, Nosema spp.) in the key pollinators Apis mellifera and Bombus terrestris. Parasitol. Res. 2012, 110, 1403–1410. [Google Scholar] [CrossRef] [PubMed]
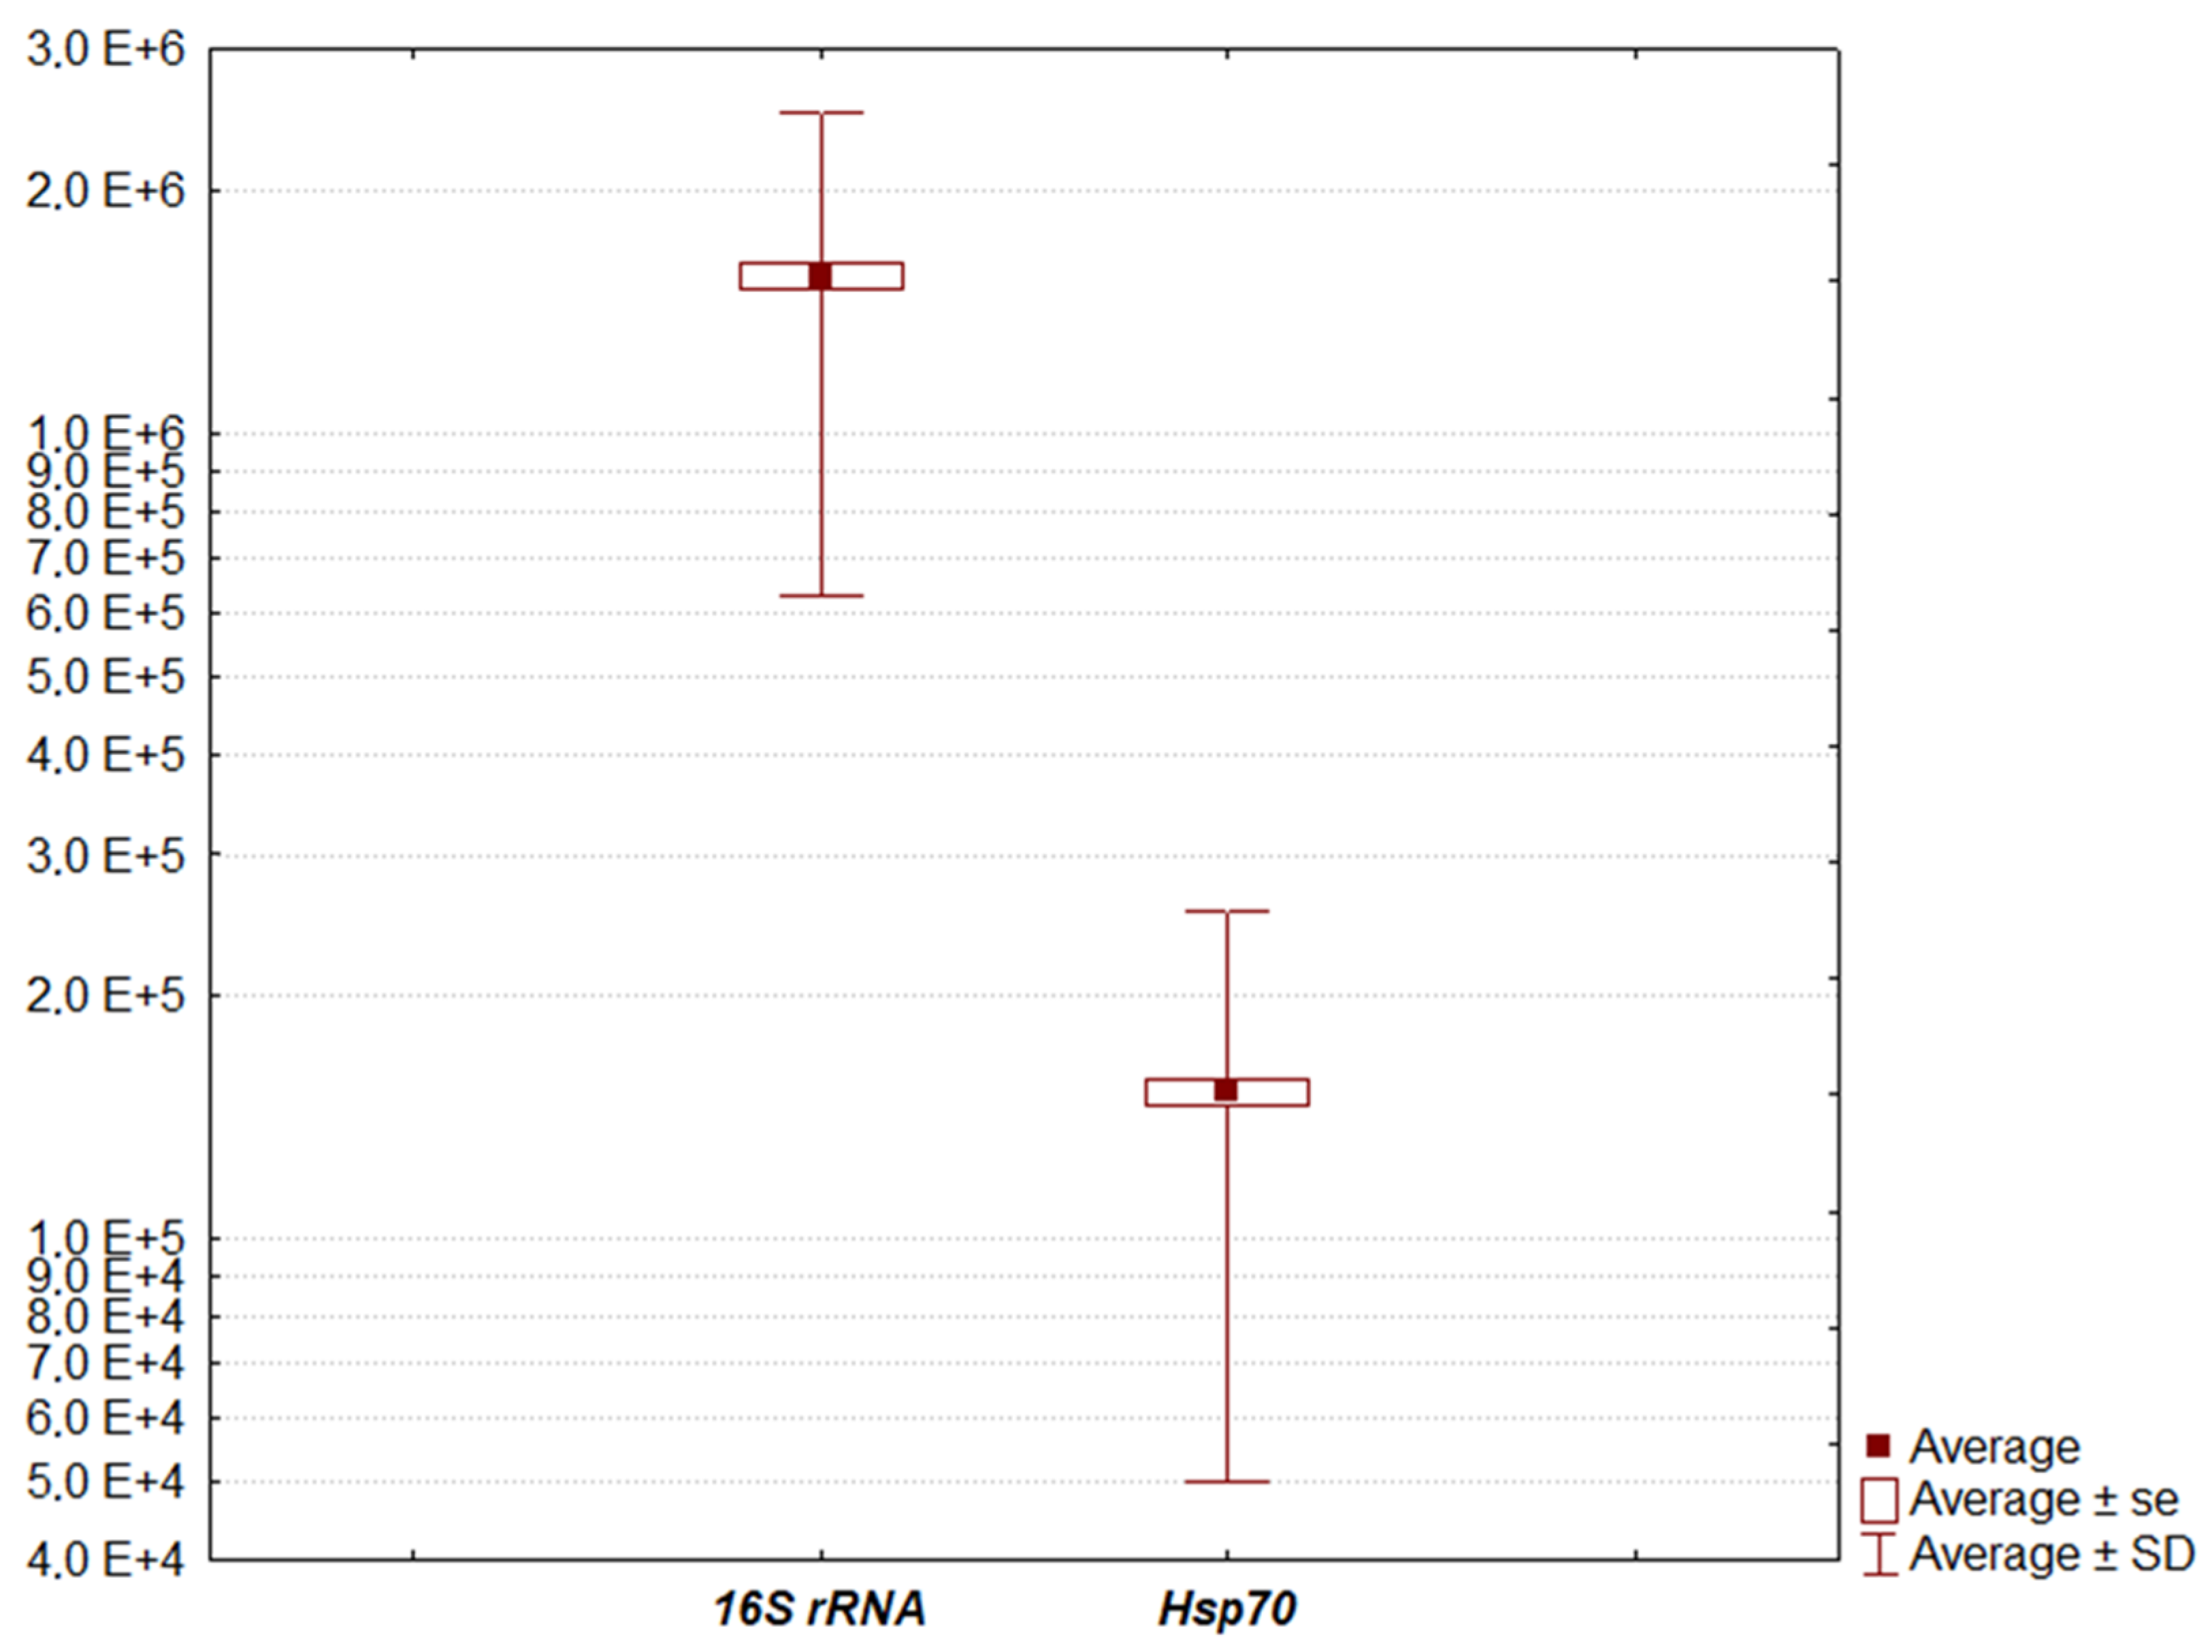
Figure 1. Boxplot showing average, standard error and standard deviation of the individual N. ceranae abundance values measured with the two methods examined here (16S rRNA and Hsp70). The number of copies is reported against a logarithmic vertical axis.
Applsci 12 00422 g001
Figure 2. Linear regression analysis between the abundance measured with 16S rRNA (dependent variable) and with Hsp70 (independent variable) methods. Legend-blue circles: experimental data, red cross: average values, red dashed line: inoculated dose, thick solid line: regression line, dashed thin lines: confidence interval of regression, solid thin lines: prediction interval.
Applsci 12 00422 g002
Figure 3. Figure 3. Linear regression analysis between the 16S rRNA/Hsp70 ratio (dependent variable) and the abundance measured with the Hsp70 method (independent variable). Legend-blue circles: experimental data, red cross: average values, red dashed line: inoculated dose, thick solid line: regression line, dashed thin lines: confidence interval of regression, solid thin lines: prediction interval.
Applsci 12 00422 g003
Figure 4. Scatterplot showing the relationship between the error variance of the 16S rRNA/Hsp70 ratio, and the abundance measured with the Hsp70 method (N = 306). Legend-blue crosses: individual standardized residuals, red dashed line: inoculated dose, dotted black lines: 95% interval of the normally distributed data (z = ±1.96).
Applsci 12 00422 g004
Table 1. Primer sequences used for the qPCR analysis with the Hsp70 and 16S rRNA genes and TaqMan Probes.
GenePrimerSequence (5′-3′)Reference
16S rRNAForwardAAGAGTGAGACCTATCAGCTAGTTG
ReverseCCGTCTCTCAGGCTCCTTCTC[70]
Taqman ProbeACCGTTACCCGTCACAGCCTTGTT
Hsp70ForwardGGGATTACAAGTGCTTAGAGTGATT
ReverseTGTCAAGCCCATAAGCAAGTG[50]
Taqman ProbeTGAGCCTACTGCGGC
Table 2. Characterization of the regression model relating the 16S rRNA abundance (dependent variable) to the Hsp70 abundance (independent variable).
ModelF (1.304) = 800.403, p = 0.000, Adj. R2 = 0.724
Intercept376,209.4 ± 50,726.0 s.e. (95% CI = 276,390.9, 476,028.0), t (304) = 7.417, p = 0.000
Slope7.8 ± 0.3 s.e. (95% CI = 7.3, 8.4), t (304) = 28.291, p = 0.000
Table 3. Characterization of the regression model relating the abundance ratio 16S rRNA/Hsp70 (dependent variable) to the Hsp70 abundance (independent variable).
ModelF (1.304) = 38.740, p = 0.000, Adj. R2 = 0.110
Intercept11.9 ± 0.2 s.e. (95% CI = 11.5, 12.4), t (304) = 53.551, p = 0.000
Slope−7.6 × 10⁻⁶ ± 1.2 × 10⁻⁶ s.e. (95% CI = −10 × 10−6, −5.2 × 10⁻⁶), t (304) = −6.224, p = 0.000
Publisher’s Note: MDPI stays neutral with regard to jurisdictional claims in published maps and institutional affiliations.