Article

Optimized Cell Mixing Facilitates the Reproducible Bioprinting of Constructs with High Cell Viability

1
Department of Life Science Engineering, Institute of Bioprocess Engineering and Pharmaceutical Technology, Technische Hochschule Mittelhessen—University of Applied Sciences, Wiesenstrasse 14, 35390 Giessen, Germany
2
Department of Biology and Chemistry, Justus Liebig University, Ludwigstrasse 23, 35390 Giessen, Germany
3
Department of Pharmaceutics and Biopharmaceutics, Philipps University, Robert-Koch-Strasse 4, 35037 Marburg, Germany
*
Authors to whom correspondence should be addressed.
Appl. Sci. 2022, 12(1), 326; https://doi.org/10.3390/app12010326
Submission received: 22 November 2021 / Revised: 21 December 2021 / Accepted: 28 December 2021 / Published: 30 December 2021
(This article belongs to the Special Issue 3D Printing in Bio-Medical Applications)

Abstract

:

Featured Application

Before the fabrication of constructs using bioink, the carrier material and cells must be mixed in a precise and highly reproducible manner to ensure functionality. Here, we present an optimal mixing strategy and investigate its impact on bioink printing behavior and cell viability.

Abstract

Bioprinting with cell-laden hydrogels (bioink) requires the careful mixing of cells with the hydrogel carrier to ensure that the bioink is homogeneous and functional, and the printing results are reproducible. Bioink preparation is therefore a critical process step that must accommodate the specific rheological properties of different bioinks. Here, we developed a reproducible method for the optimized mixing of cells and hydrogel carriers that can be integrated into current bioprinting processes. First, we tested and optimized different mixing devices for their effect on bioink homogeneity and rheological properties, resulting in a low-shear process for the preparation of homogenous bioinks. Based on these findings, we evaluated the impact of different cell densities on the rheological profile of bioinks according to shear and temperature, and estimated the impact of shear stress intensity and duration on 1.1B4 cells. Finally, we integrated the optimized mixing method into a current printing process and monitored the printed construct for 14 days to confirm cell viability. We found that the cell viability in the printed cell-laden constructs remained in excess of 91% after 14 days.

Graphical Abstract

1. Introduction

Biofabrication involves the production of functional complex tissues, addressing many of the limitations of cell therapy and cell-based screening models [1,2]. One of the most promising forms of biofabrication is 3D printing (bioprinting) with cell-laden carrier material (bioink). Several bioprinting technologies have been developed, including inkjet and laser printing options, but extrusion-based bioprinting (EBB) is almost the most widespread because it is compatible with viscous carrier materials and high cell densities, both of which are favorable for tissue reconstruction and regeneration [3].
Biofabrication involves the preparation and mixing of components, the printing step, and post-processing steps such as cross-linking to mature the construct and maintain its properties in situ. Critical process parameters during the printing step have been explored in detail, including the bioink temperature, nozzle geometry, print head speed, and driving force [4]. However, the preparation and mixing of components before printing is also a key process step and may have an even greater impact on the performance of the resulting construct than the printing process. For example, a significant difference in cell viability was observed between non-embedded cells and cells that had been embedded in carrier material by mixing with a spatula [5], whereas the printing step had relatively little additional impact, perhaps due to error propagation following the mixing process [5,6,7].
The characteristics of the mixing process can be broken down into aspects such as the rheological properties of the carrier material and the nature and operational profile of the mixing device, both of which affect the intensity and duration of shear stress during mixing and thus affect biophysical properties such as cell homogeneity and sedimentation, as well as functional properties such as cell viability [4]. Poorly mixed regions of the bioink feature spikes or troughs in cell density that are incompatible with tissue construct requirements, or can cause air bubbles that result in discontinuous strands or variable droplet volumes that disrupt EBB and inkjet bioprinters. The viscosity of bioink can be modulated by temperature to facilitate mixing, but threshold values have not been established and the critical parameters are unknown [4]. Highly viscous hydrogels are more difficult to mix with cells than aqueous-like hydrogels, preventing the formation of homogenous cell suspensions. This can be addressed by increasing the shear forces during mixing, but excess shear forces cause damage to cells and interfere with homeostasis [8] as demonstrated in many types of processing equipment [9]. The presence of cells can also affect the rheological properties of the carrier material: gelatin methacrylamide hydrogels (10% w/v) became weaker and less viscous with increasing cell density [10], whereas collagen hydrogels (0.8% w/v) became stronger with increasing cell density before gelation but weaker after gelation due to the slower growth rate of the storage modulus [11]. These data highlight the need for a strategy to form homogenous cell-laden bioinks to ensure the highly reproducible bioprinting of viable and functional tissue constructs.
To address the mentioned issues, we investigated the critical process of mixing prior to the printing process using the example of a highly viscous bioink and a model cell line 1.1B4 to reduce the complexity of the bioprinting process. Thereby, the cell line was chosen due to its human origin and hormone secretion, which can be used for functionality investigations in later tissue constructs. The aim is to demonstrate a targeted concept for the evaluation of bioink and cell mixing as well as to gain first insights into the interaction of cells and the bioprinting process. First, we compared different mixing devices with regard to their effect on the homogeneity of the bioink using a fluorescent dye. We also evaluated the consistency of rheological properties after the mixing procedure. These experiments defined a specific requirements profile for the mixing process and allowed us to optimize the method for our model bioink, including cell sedimentation calculations for various conditions. Based on this knowledge, we calculated critical process parameters for reproducible bioprinting (Reynolds numbers and cell viability under different shear conditions) in order to integrate the mixing method with the subsequent printing process. We evaluated the printing behavior of bioink and the cell-free carrier by viscosity measurements and temperature sweeps. Finally, the carrier was mixed with cells at a density of 5 × 10⁵ cells·mL−1 and we monitored cell viability in the printed construct for 14 days.

2. Materials and Methods

2.1. Carrier Material

Cells were embedded in our previously described carrier material consisting of 3.5% (w/v) gelatin, 0.5% (w/v) κ-carrageenan, 2.4% (w/v) carboxymethylcellulose (CMC), and 1.5% (w/v) alginate [12]. This was prepared in two parts, the first comprising γ-irradiated gelatin solution, and the other comprising the autoclaved gelling agent solution (κ-carrageenan, CMC, and alginate). The two components were mixed using a microspatula. The gelling agents were all purchased from Sigma-Aldrich (Darmstadt, Germany) and dissolved in phosphate-buffered saline (PBS) from Capricorn Scientific (Ebsdorfergrund, Germany). The viscous fluids were manipulated using a 1000 µL Microman E M1000E pipette (Gilson, Germany).

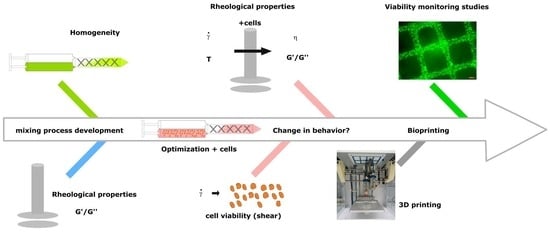
2.2. Mixing Process—Assessment and Optimization

2.2.1. Evaluation of Mixing Behavior

We compared three different mixing devices: (1) the CELLMIXER [13] (CELLINK, Sweden); (2) a manual coupling of two 3 mL syringes (Braun, Germany) via a double female connector (Sigma-Aldrich); and (3) the Adchem K-system cartridge equipped with an MKHX 03-16S mixer and lip pistons (Adchem, Germany). These devices (Table 1 and Figure 1A, mixers of the different systems) were loaded and operated manually using a 1:10 ratio of PBS and carrier material. The carrier material was pre-mixed with a microspatula before loading, and the homogeneity and rheology of the resulting constructs were evaluated. The concentrations of the gelling agents were adapted to the corresponding mixing device and ratio so that the final concentration of the original bioink material was achieved.

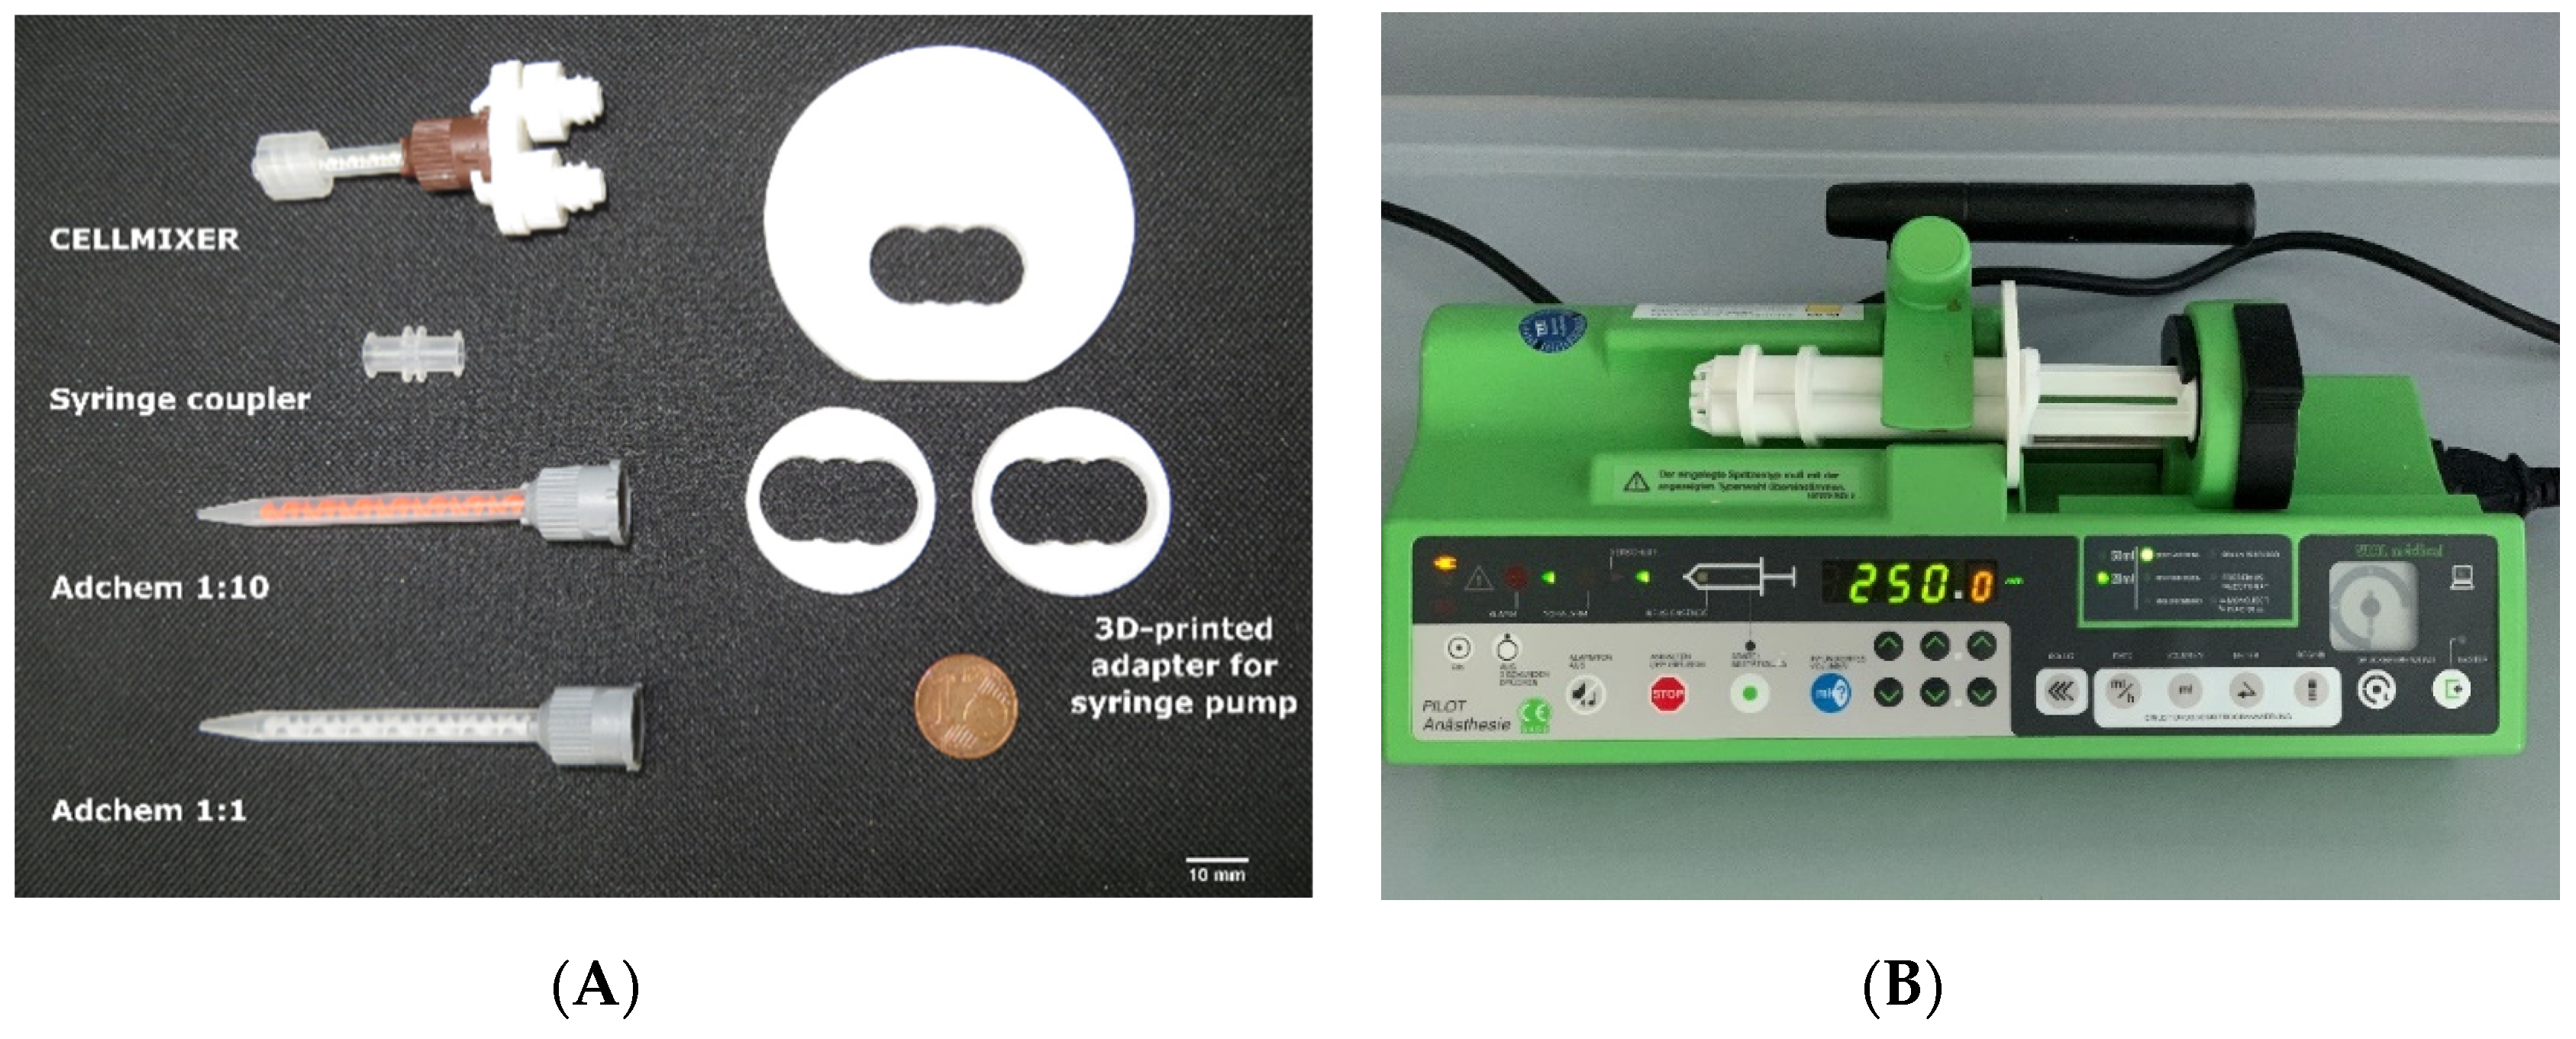
2.2.2. Optimization for Bioprinting

Following the evaluation of recommended settings, a desirable requirements profile for bioprinting was prepared (Table 2). This was used for process optimization, focusing on simplicity, standardization and high reproducibility.
The Adchem K-system cartridge was tested without pre-mixing the two components of the carrier material, resulting in a gelatin part and a κ-carrageenan, carboxymethylcellulose and alginate part. Following rheological tests and cell sedimentation calculations, the two parts were mixed at a 1:1 ratio in the device. We also evaluated the impact of pipetting during cell suspension by testing the gel structure of the gelatin solution according to the number of pipette strokes. For constant pressure experiments, a PILOT Anesthesia syringe pump (Fresenius, Germany) was equipped with a self-printed holding device (Figure 1B) for the Adchem K-system cartridge.

2.3. Analytical Methods for Mixing Evaluation

2.3.1. Mixing Homogeneity

The homogeneity of mixing was quantified using 0.75 mg·mL−1 sodium fluorescein (Sigma-Aldrich) in PBS without Ca2+/Mg2+ (Capricorn Scientific, Germany) as an indicator of cell distribution. Therefore, the total volume of each mixing system was divided into three volumetrically equal sections (section #1–#3) in order to assess the homogeneity during the whole mixing process. Fluorescence measurements (excitation 485 nm, emission 528 nm) with an area scan of 3 × 3 squares in a 200 µL sample volume were acquired using a Synergy HTX plate reader (BioTek, Bad Friedrichshall, Germany) and were analyzed using Gen5 v2.07.17 (BioTek). Carrier material without fluorescein was used as the blank.

2.3.2. Mixing Rheology

Rheological parameters (G′ and G″) after mixing were estimated from the mean of three data points measured using an MRC 102 rheometer (Anton Paar, Ostfildern, Germany) in oscillation mode with a PP-25 (500 µm gap). We applied 1% shear strain at 10 rad·s−1 for 1 min at 27 °C. For comparability with an established printing process at 37 °C [12], the pre-mixed carrier material was used at 37 °C after incubation for 30 min.

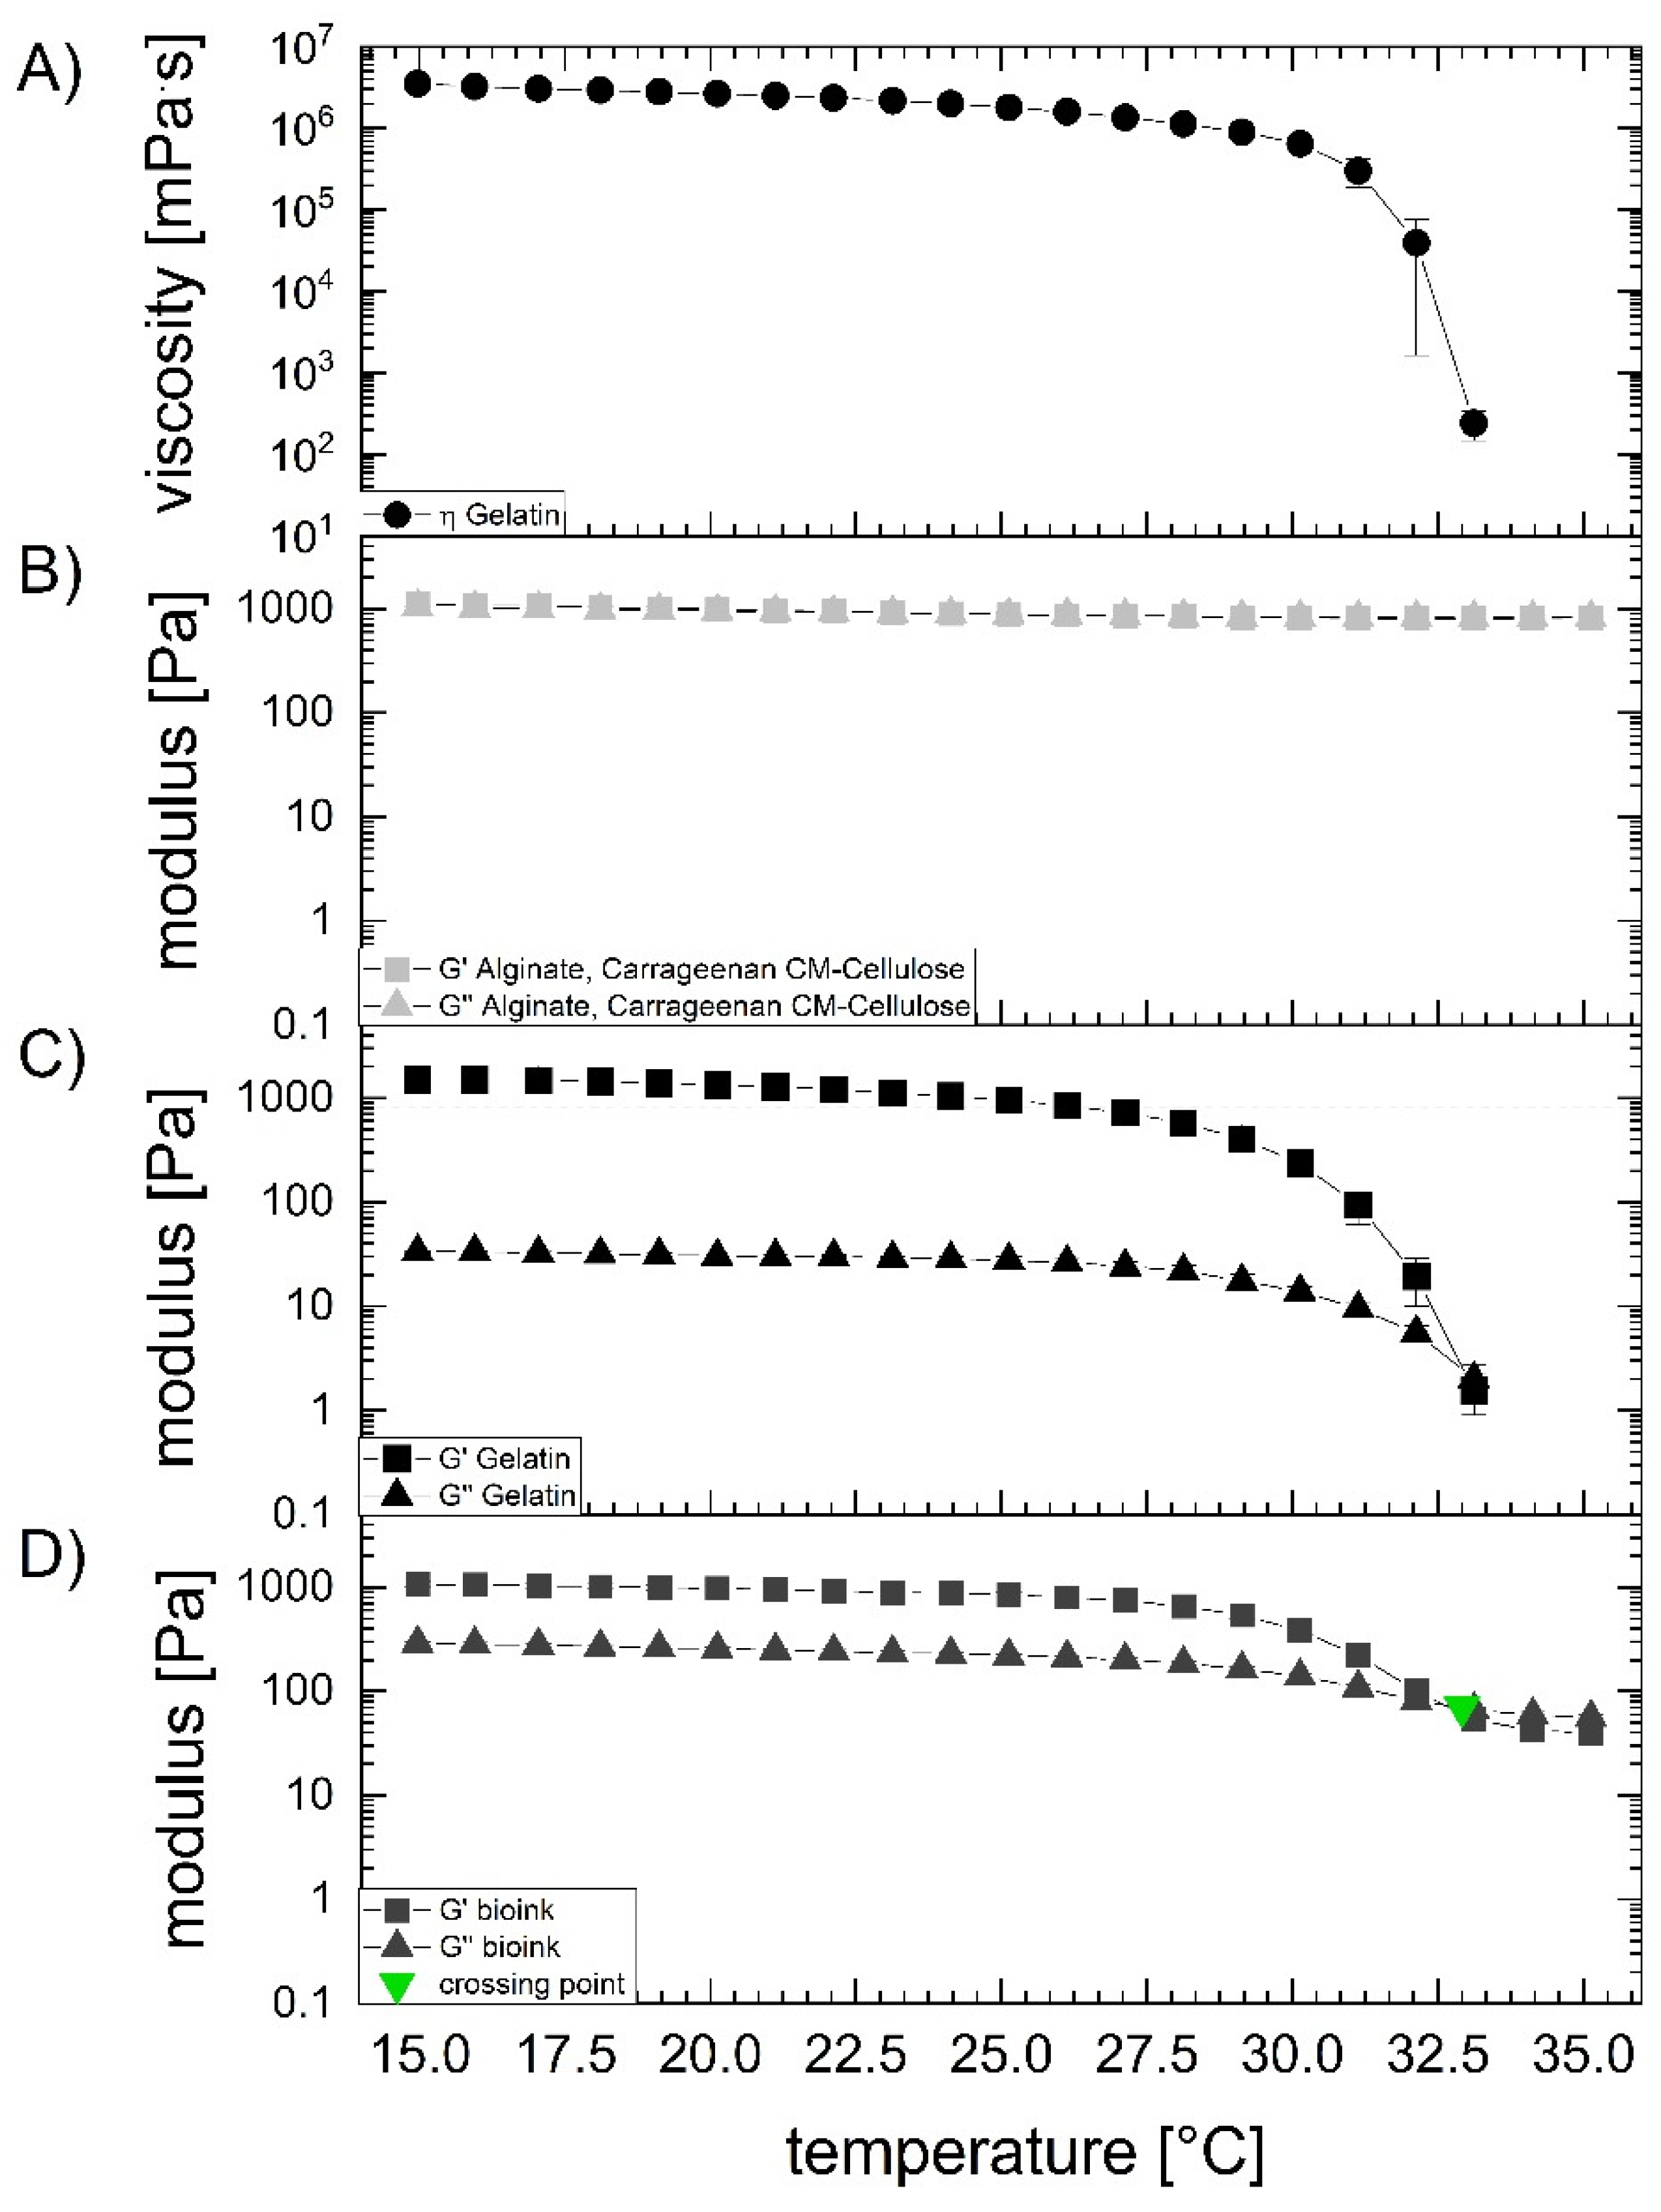
2.3.3. Temperature Sweeps

Two temperature sweeps of 15–35 °C (rotation and oscillation mode) were applied to the carrier material using the MRC 102 rheometer with a PP-25 (500 µm gap). In rotation mode, 0.1 s−1 was set with a linear temperature increase of 1 K·3 min−1. In oscillation mode, we applied 1% shear strain at 10 rad·s−1, also with a linear increase of 1 K·3 min−1. The samples were equilibrated for 3 min before each experiment and a solvent trap was used to prevent drying.

2.3.4. Cell Sedimentation

Cell sedimentation was calculated using Stoke’s general equation (Equation (1)) and estimates of viscosity for the bioink [12], gelatin solution (0.1 s−1), and pure water at 37 °C (1 mPa·s). The mass of a single cell was estimated as ~4 ng [14]. We assumed that 1.1B4 cells (Sigma-Aldrich) were approximately spherical particles and recoded a mean diameter of 14 µm (n = 6) using a DMi1 inverted microscope and LASAF v4.12 (Leica Microsystems, Wetzlar, Germany). These data were combined with the previously determined density and viscosity parameters of the surrounding fluid [12]:
v = 2 × 9−1·(ρSρLr2·g·η−1
where v is the sedimentation velocity of the particle (cell), ρS is the density of the particle, ρL is the density of the surrounding medium, r is the radius of the spherical particle, g is the gravity and η the viscosity of the fluid around the particles. The time was calculated using the chamber of the Adchem K-system (1:1 ratio) with a path length of 7 cm after filling.

2.4. Estimation of Shear Stress

2.4.1. Cell culture and Bioink Preparation

Pancreatic 1.1B4 cells were cultured and subcultured in high-glucose DMEM containing 10% v/v FBS, 4 mM glutamine, and 1 mM sodium pyruvate (all from Capricorn Scientific) as previously described [15] in a humified atmosphere containing 5% v/v CO2. Subcultivation was carried out at about 80% confluence by trypsinization. Only passages 40–60 were used. Viability during cultivation was determined by staining with 0.4% trypan blue (Sigma-Aldrich, Germany).
For bioink preparation (final cell density 5 × 10⁵ cells·mL−1), the cells were first centrifuged with the Megastar 600R (VWR, Bruchsal, Germany) and suspended in the gelatin solution part using the Microman E M1000E pipette. Afterwards, the optimized mixing procedure (Adchem K-system 1:1 with syringe pump) was used to unite the cell-laden gelatin solution with the other hydrogel component. The resulting mixture was directly pushed into 3 mL syringes for subsequent bioprinting.

2.4.2. Shear Stress during Printing

Flow rates were calculated using a strand printing procedure with a pre-incubation temperature of 37 °C, 40 min cooling, a G20 cylindrical stainless steel nozzle (∅ 600 µm, length 25 mm; CELLINK), 100 kPa and 2 mm·s−1 combined with the bioink density [12]. The mass over time was measured using a Secura 225D-1S scale (Sartorius, Göttingen, Germany) to determine the approximate flow rate through the nozzle. The wall shear rate and thus shear stress (pre-incubation temperature 37 °C, 40 min cooling [12]) were estimated based on the flow rate and dimensions of the G20 nozzle:
γ ˙   =   4 · V ˙ · ( π · r 3 ) 1
where γ ˙ is the wall sheer rate, V ˙ is the flow rate, and r is the radius of the nozzle. Reynolds numbers were calculated using the power-law and Carreau–Yasuda models [16] and previous data [12]. The residence time z was calculated using the ratio of volume of the nozzle V R and the flow rate:
z = V R · V ˙ 1
The shear response of pancreatic 1.1B4 cells (106 cells·mL−1 in aqueous medium) was tested according to the intensity and duration of shear stress. Accordingly, we applied shear stresses of 0–20 Pa for 10–60 s using the MCR 102 rheometer with CP-40 (80 µm gap, 37 °C). Viability was determined using the CellTox Green kit (Promega, Walldorf, Germany) according to the manufacturer’s instructions for endpoint determination. The fluorescence signal (excitation 485 nm, emission of 520 nm) was measured with the Synergy HTX plate reader (BioTek, Germany). Subsequently, the cells were sheared at the defined conditions, analyzed and normalized to the sample without shear stress as reference (100%).

2.4.3. Rheological Assessment of Cells and Bioink

Following the suspension of cells in gelatin and the subsequent mixing of final cell-laden bioinks using the Adchem K-system (1:1) and a syringe pump (150 mL·min−1), rheological properties were determined as previously described [12], with cell-free carrier material as the reference.

2.5. Cell Viability after Printing

The optimized cell mixing procedure was combined with an established printing method [12] using a G20 cylindrical print head (100 kPa, pre-incubation at 37 °C, cooling for 40 min) and the incredible+ 3D printer (CELLINK). We printed 1.8 × 1.8 cm grids (~120 µg, 6 × 6 strands) and crosslinked the ionic-dependent gelling agent alginate with 100 mM CaCl2 for 20 min in six-well plates (working volume 2 mL, bioink with 5 × 10⁵ cells·mL1). The grids were then incubated in DMEM supplemented as above plus 50 µg·mL−1 gentamicin (Capricorn Scientific) at 37 °C in a 5% (v/v) CO2 atmosphere. Cell viability was initially evaluated by trypan blue staining as reference and subsequently by live/dead staining with 8 µg·mL−1 fluorescein diacetate (Sigma-Aldrich) to detect viable cells and 20 µg·mL−1 propidium iodide to detect dead cells (Sigma-Aldrich) for 5 min in the dark. After five washes in 2 mL 100 mM CaCl2, images of representative grid sections were captured using a DMI6000 microscope (Leica Microsystems) with an HCX PL FLUOTAR 10.0x/0.30 dry objective in combination with L5 (excitation 480/40 nm, emission 527/30 nm) and N3 (excitation 546/12, emission 600/40 nm) filter cubes. Thereby, we focused the microscopic system to obtain sharp edges of each strand in the transmitted light image, roughly representing the middle of the analyzed strand. A similar exposure time (29.6 ms) gain (2.0) and gamma (0.8) were used for each image, with an existing protocol as basis [17]. We used a Photofluor II light source (Chroma Technology, Rockingham, VT, USA). Images after 14 d cultivation time were captured in a similar manner, but the exposure time was reduced to 24.3 ms. Images were captured from three different regions of each grid and were processed using ImageJ v1.52a (National Institutes of Health, Bethesda, MD, USA). The background was subtracted (rolling ball radius = 100 pixels), followed by channel splitting and threshold adjustment. Finally, the separated green channel (viable cells) and red channel (dead cells) were analyzed by counting from 40 µm2 to infinity for the green channel and from 0 to 13 µm2 for the red channel. The counted areas were used to calculate viability after comparing them with representative cytoplasm/nucleus areas within each image:
Viability [%] = cell count green·(cell count green + cell count red)−1·100 [%]

2.6. Data Analysis

All data are presented as means ± standard deviations (SDs), which were calculated using OriginPro v2019b (Originlab, Northampton, MA, USA). Each experiment comprised three replicates unless otherwise stated. Fluorescence readouts were determined at least in duplicate. Significance was evaluated using a non-parametric Kruskal–Wallis test and plotted using the post hoc analysis tool for nonparametric tests in OriginPro.

3. Results

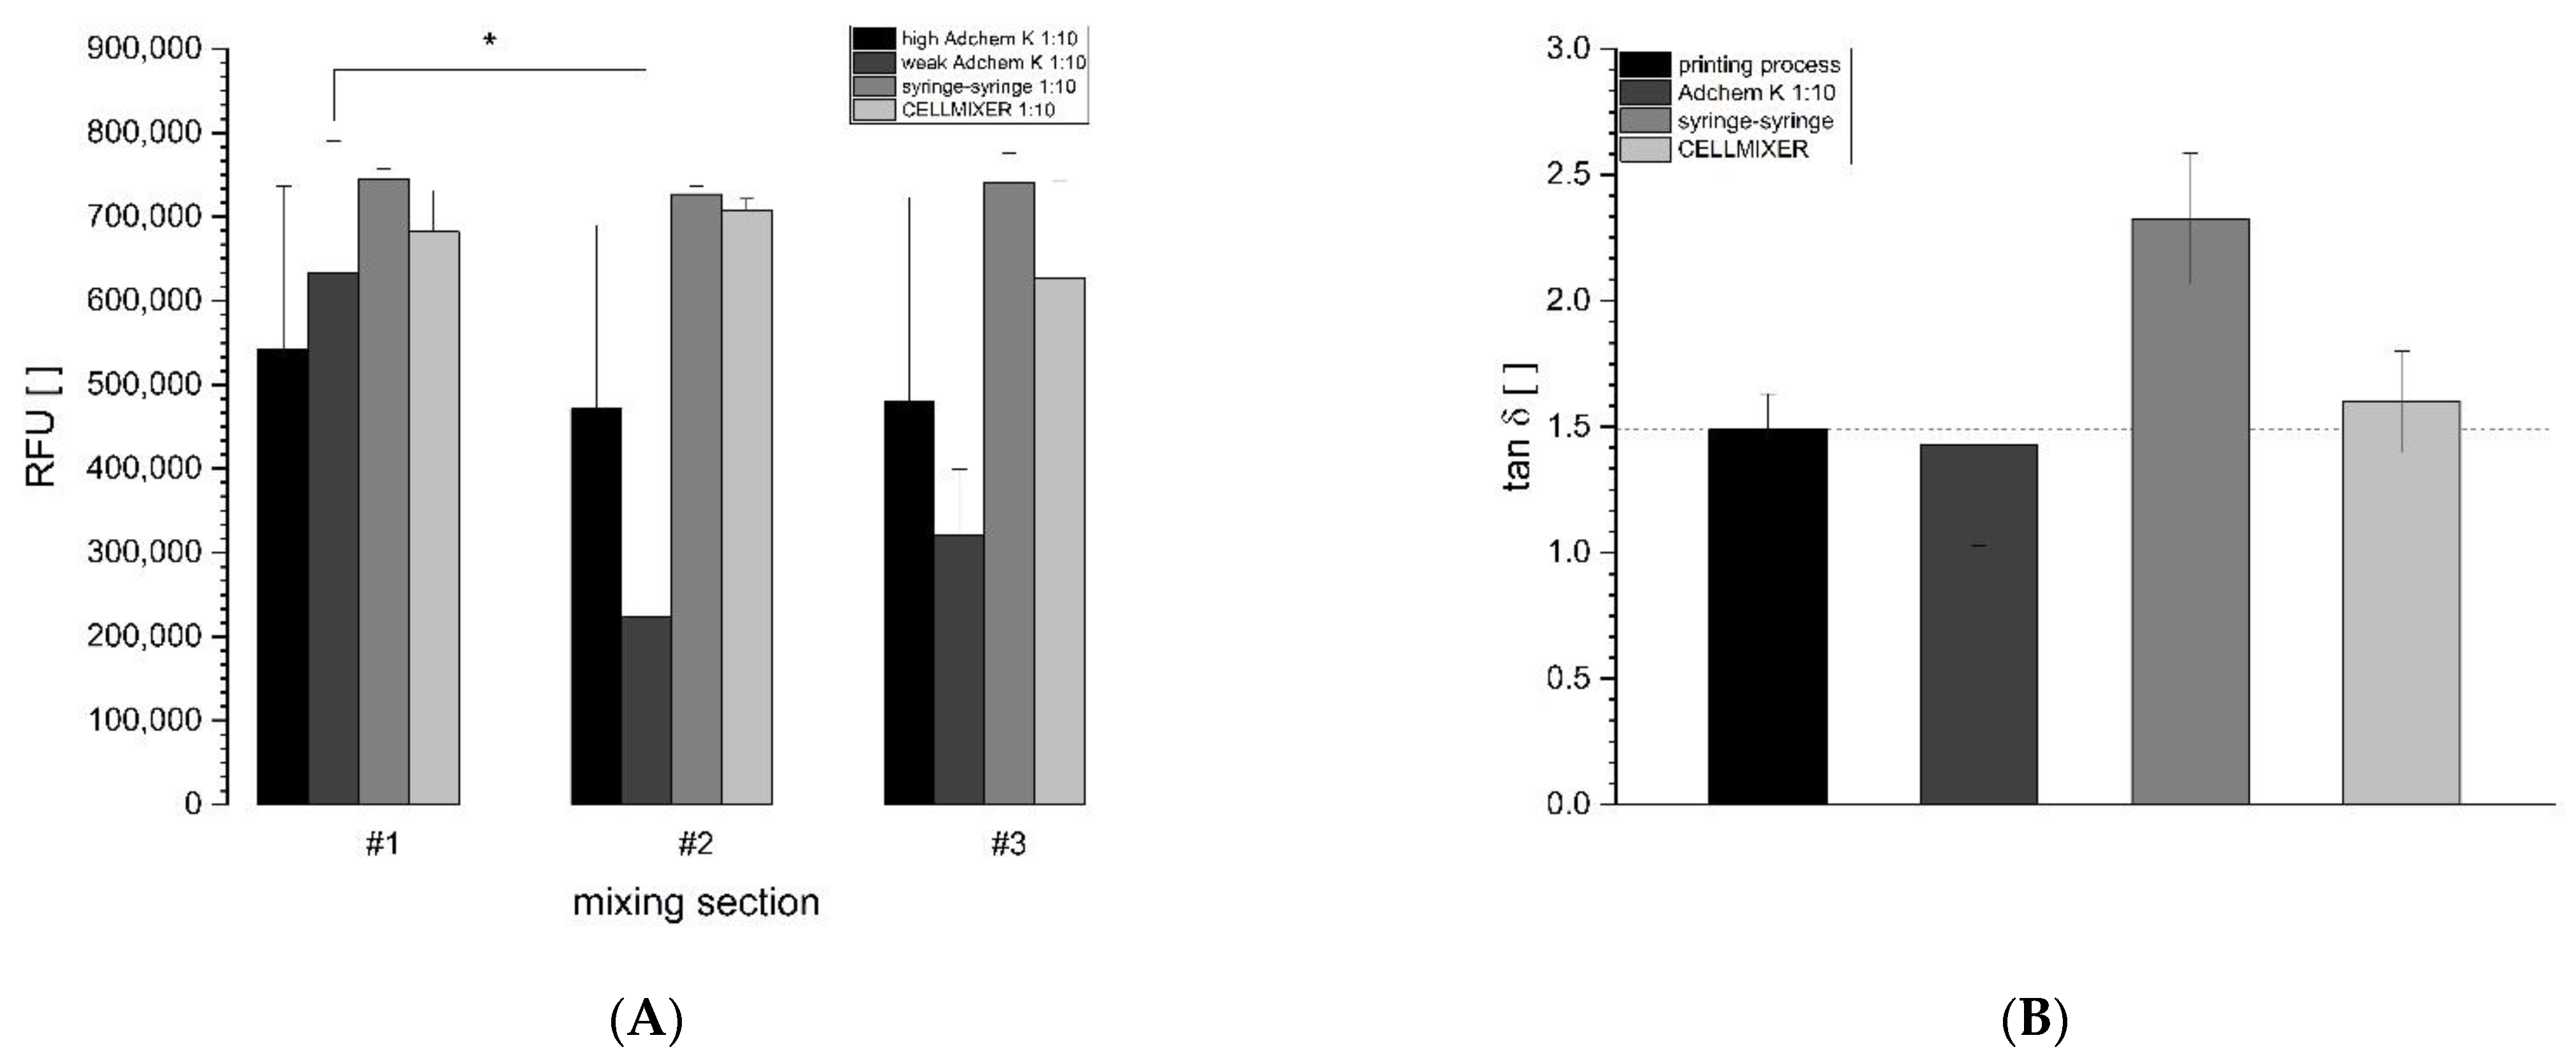
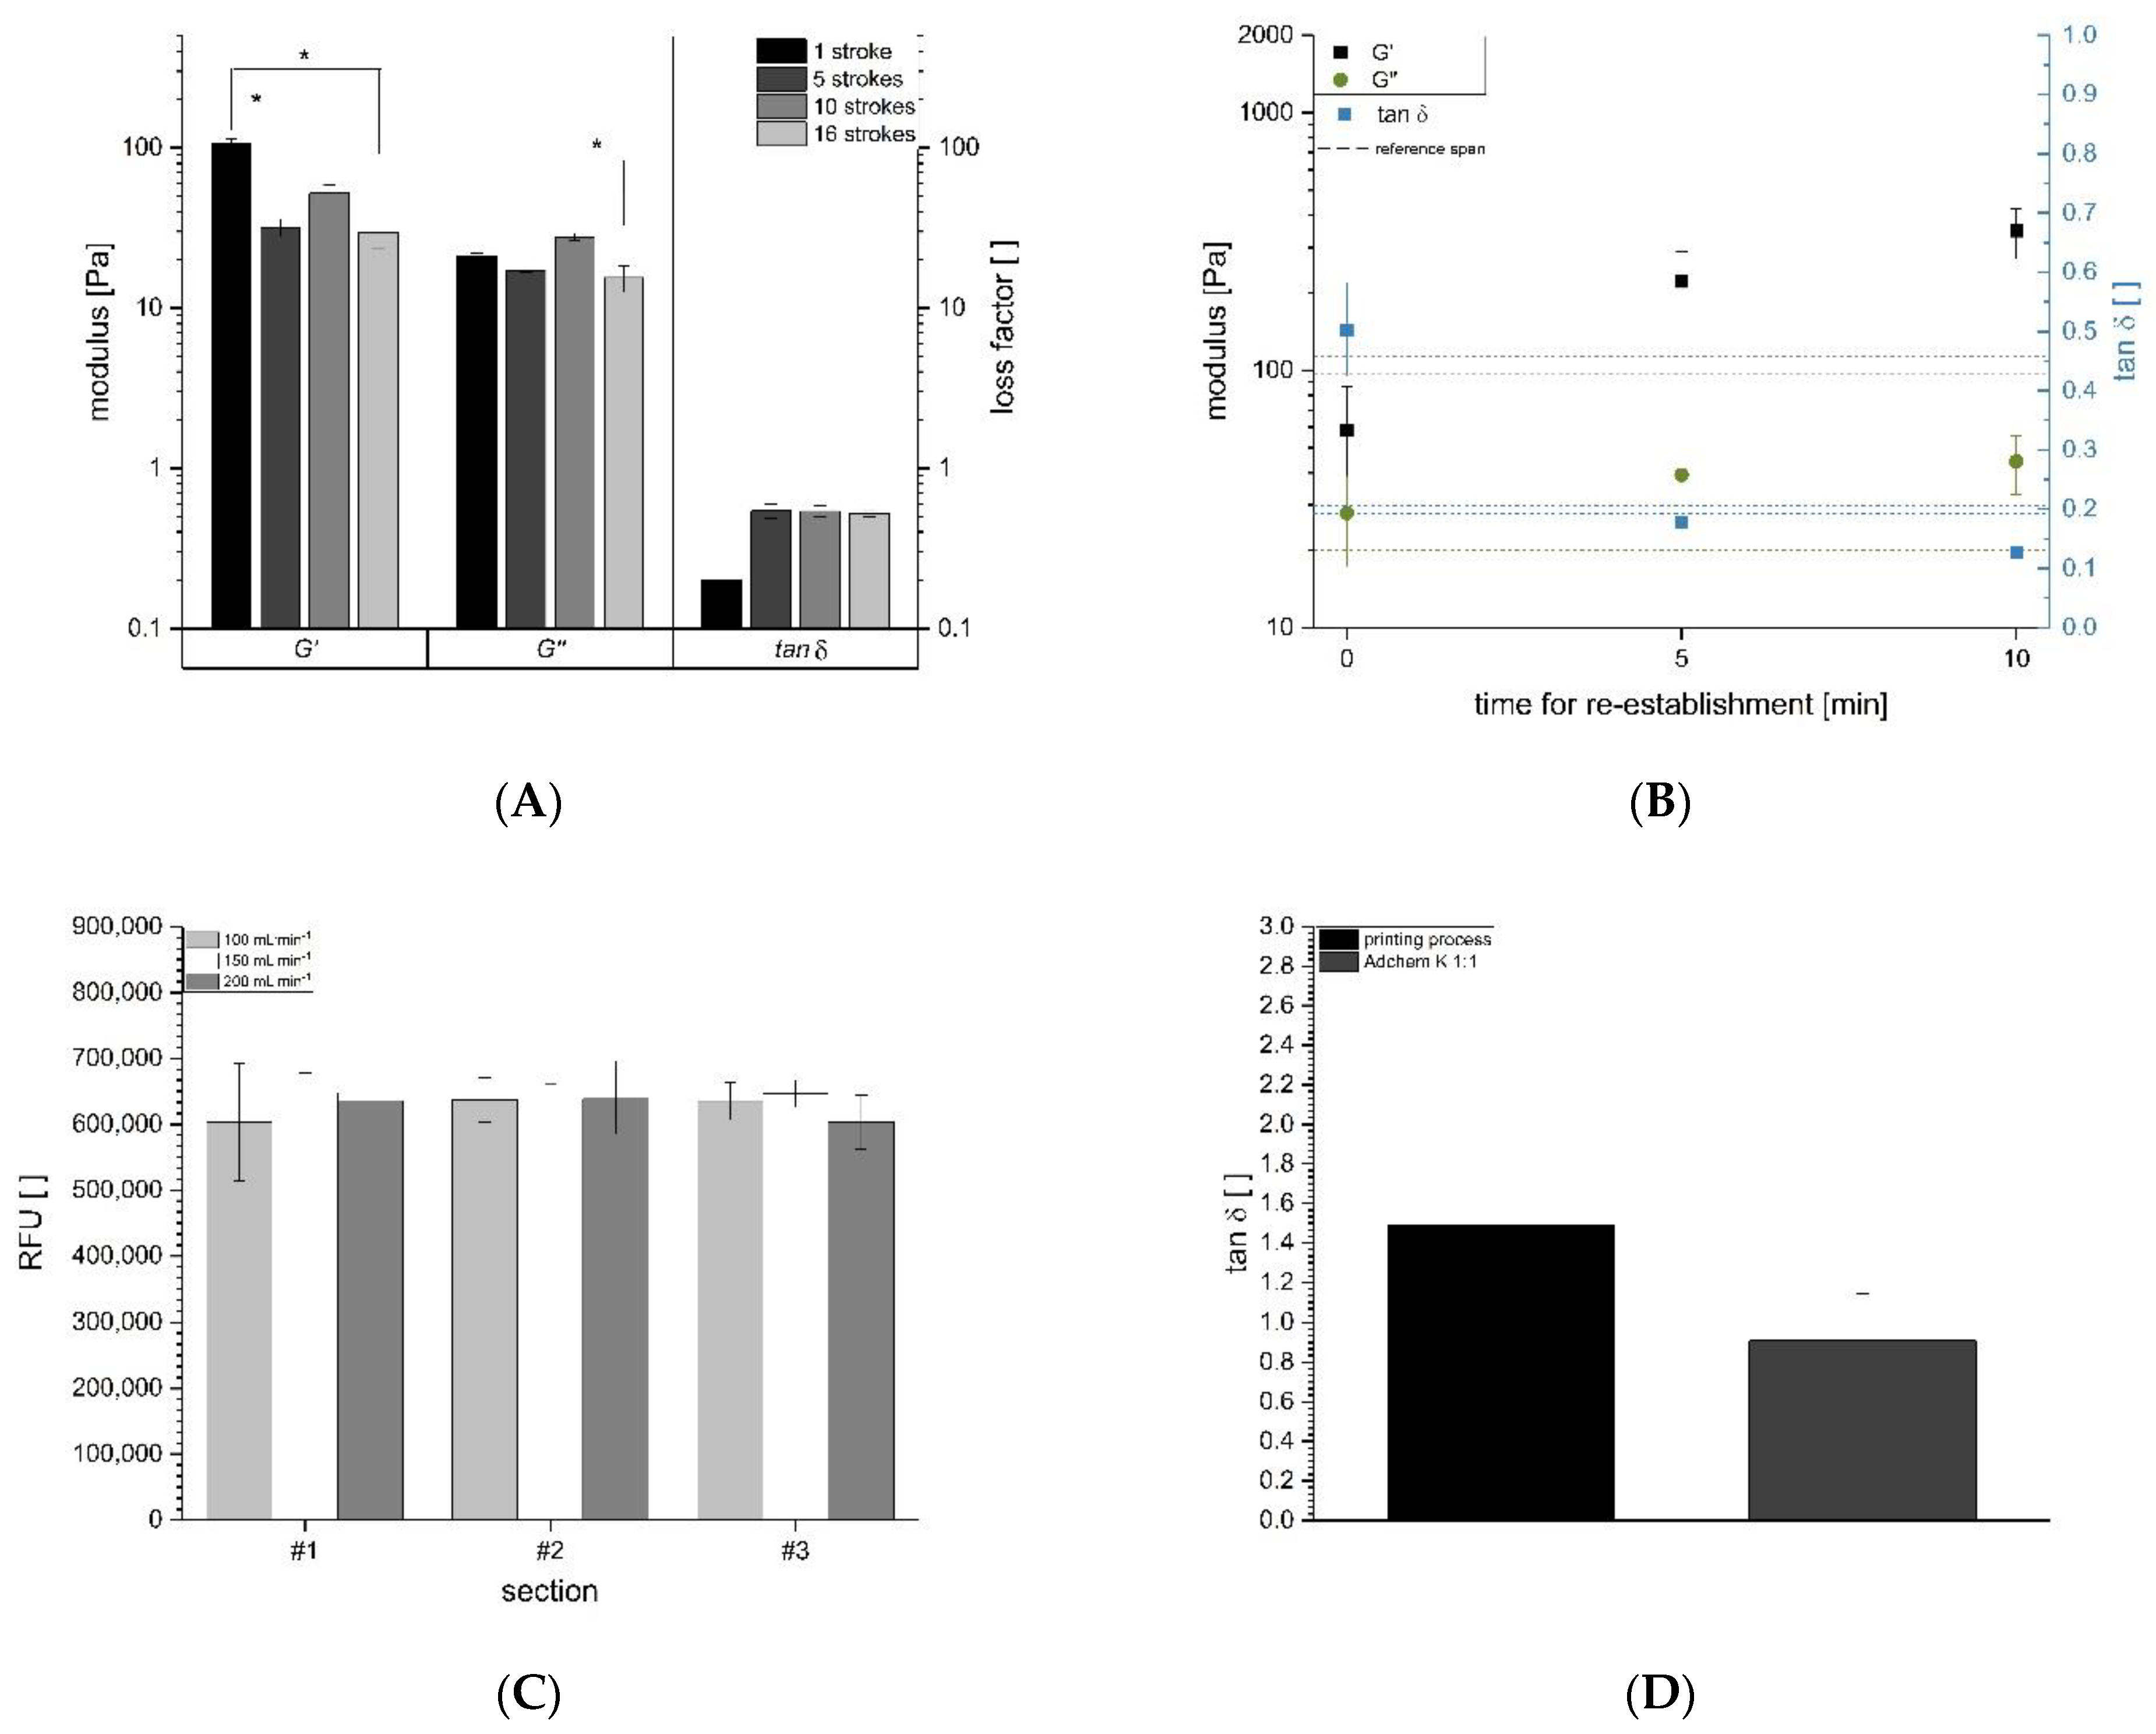
3.1. Assessment and Optimization of the Mixing Process

The evaluation of bioink homogeneity (1:10 ratio) showed a high dependency on the mixing device and the mixing section (Figure 2). We assessed both low and high pressure manual mixing but differences were evident only in the Adchem K static mixer (Figure 2A). The manually applied low and high pressure in the Adchem K mixer resulted in wide deviations between the three mixing sections at 37 °C. Significant differences were even observed for the weak pressure between sections #1 and #2. The syringe–syringe system achieved the greatest homogeneity, with a narrow band of 745,416–727,144 relative fluorescence units (RFUs) representing a standard deviation below 4.78%. The CELLMIXER achieved good homogeneity in the first and second sections but mixing was poor in the third section (18.41% deviation). The Adchem K-system with weak manual pressure was excluded from further experiments due to insufficient homogeneity.
The rheological behavior of the initial heating step (30 min) of an established 3D printing process for bioprinting [12] showed a loss factor (tan δ) of 1.49 ± 0.14. In contrast, the value for the coupled syringe–syringe system was 2.32 ± 0.26, indicating high shear forces. The CELLMIXER system fell within the reference range with a value of 1.60 ± 0.20. Similarly, the Adchem K (1:10) system achieved a value of 1.43 ± 0.40 (Figure 2B). The static mixing systems therefore generated the lowest shear intensity.

3.2. Optimization of the Mixing Process for Bioprinting

Higher temperatures reduced the viscosity and gel strength (G′) of the carrier material and its two component parts (Figure 3). For gelatin, the steepest decrease during the temperature sweep in rotation mode occurred above 31 °C, with a decrease from 301,264 ± 114,938 mPa·s at 31 °C to 241 ± 93 mPa·s at 33 °C (Figure 3A). Similar temperature-dependent flow behavior was observed in oscillation mode, with a greater loss of strength above 31 °C (Figure 3B,C). However, G′ was dominant over G″ for the entire measurement, indicating a more solid-like behavior. The second part of the carrier material (alginate, κ-carrageenan, and CMC) did not vary as much as gelatin. The temperature effect caused G′ to decline from 1111 ± 53 to 817 ± 14 Pa over the measuring period, with solid-like behavior until 26 °C and more viscous behavior thereafter, as G″ dominated G′. However, the two moduli were very close over the whole temperature period and the two components showed similar flow behavior at 27.5 °C, which is the mixing temperature in the Adchem K 1:1 system. Combining the two parts to the final carrier material composition (Figure 3D) resulted in solid-like behavior until 33 °C, whereupon more liquid-like properties were evident.
The sedimentation time of single cells was evaluated as a function of shear rates and temperatures in different fluids (Table 3). For the final carrier material mixture at 37 °C, an increase in shear reduced the sedimentation time. The slowest sedimentation was observed for carrier material with zero shear (1,714,440.5 min) whereas the fastest sedimentation was observed for carrier material with infinity shear (0.6 min). However, even at high shear rates of 1000 s−1, the sedimentation time was at 3061.0 min, suggesting that sedimentation is unlikely to occur during processing. The sedimentation time for a gelatin solution at 28 °C (Figure 3) was 6,900,247.9 min for single cells at a very low shear rate of 0.1 s−1. In contrast, cells suspended in pure water at 37 °C sedimented after 6.1 min, indicating that insufficient viscosity leads to poor homogeneity in the resulting mixtures.
The impact of the cell suspension step on the rheology of gelatin revealed a high dependency on the pipetting technique (Figure 4A). We observed significant differences in gel strength when cells were suspended in a single pipette stroke compared with five strokes (–30.21%) and 16 strokes (–28.22%). Furthermore, the loss factor increased from 0.198 ± 0.007 (one stroke) to a plateau of 0.544 ± 0.056 (five strokes) with further strokes having no significant additional effect on the gel strength or loss factor. We therefore used 16 strokes in subsequent tests. The thixotropic behavior of the gelatin solution after one stroke and 16 strokes (Figure 4B) revealed that rheological properties were re-established without shear following incubation for 5 min. The liquid-like behavior of the hydrogel changed to a more solid-like behavior, as seen by the crossover of G′ and G″. Prolonged incubation increased the gel strength further. The optimal syringe pump perfusion speed was 150 mL·min−1 (Figure 4C) for all three mixing sections and the reproducibility was high, as indicated by the maximum SD of 5.27%. The homogeneity was lowest in section #1 at a speed of 100 mL·min−1 (603,479 ± 89,199 RFU). At speeds higher than 150 mL·min−1, the homogeneity values were lower in the third mixing section. Using the optimal speed of 150 mL·min−1 for the syringe pump with the Adchem K-system 1:1, we achieved a tan δ of 0.91 ± 0.24 directly after mixing (Figure 4D). We therefore selected the Adchem K-system 1:1 equipped with a syringe pump (150 mL·min−1) at 27.5 °C as the optimal mixing strategy for the subsequent printing process [12].

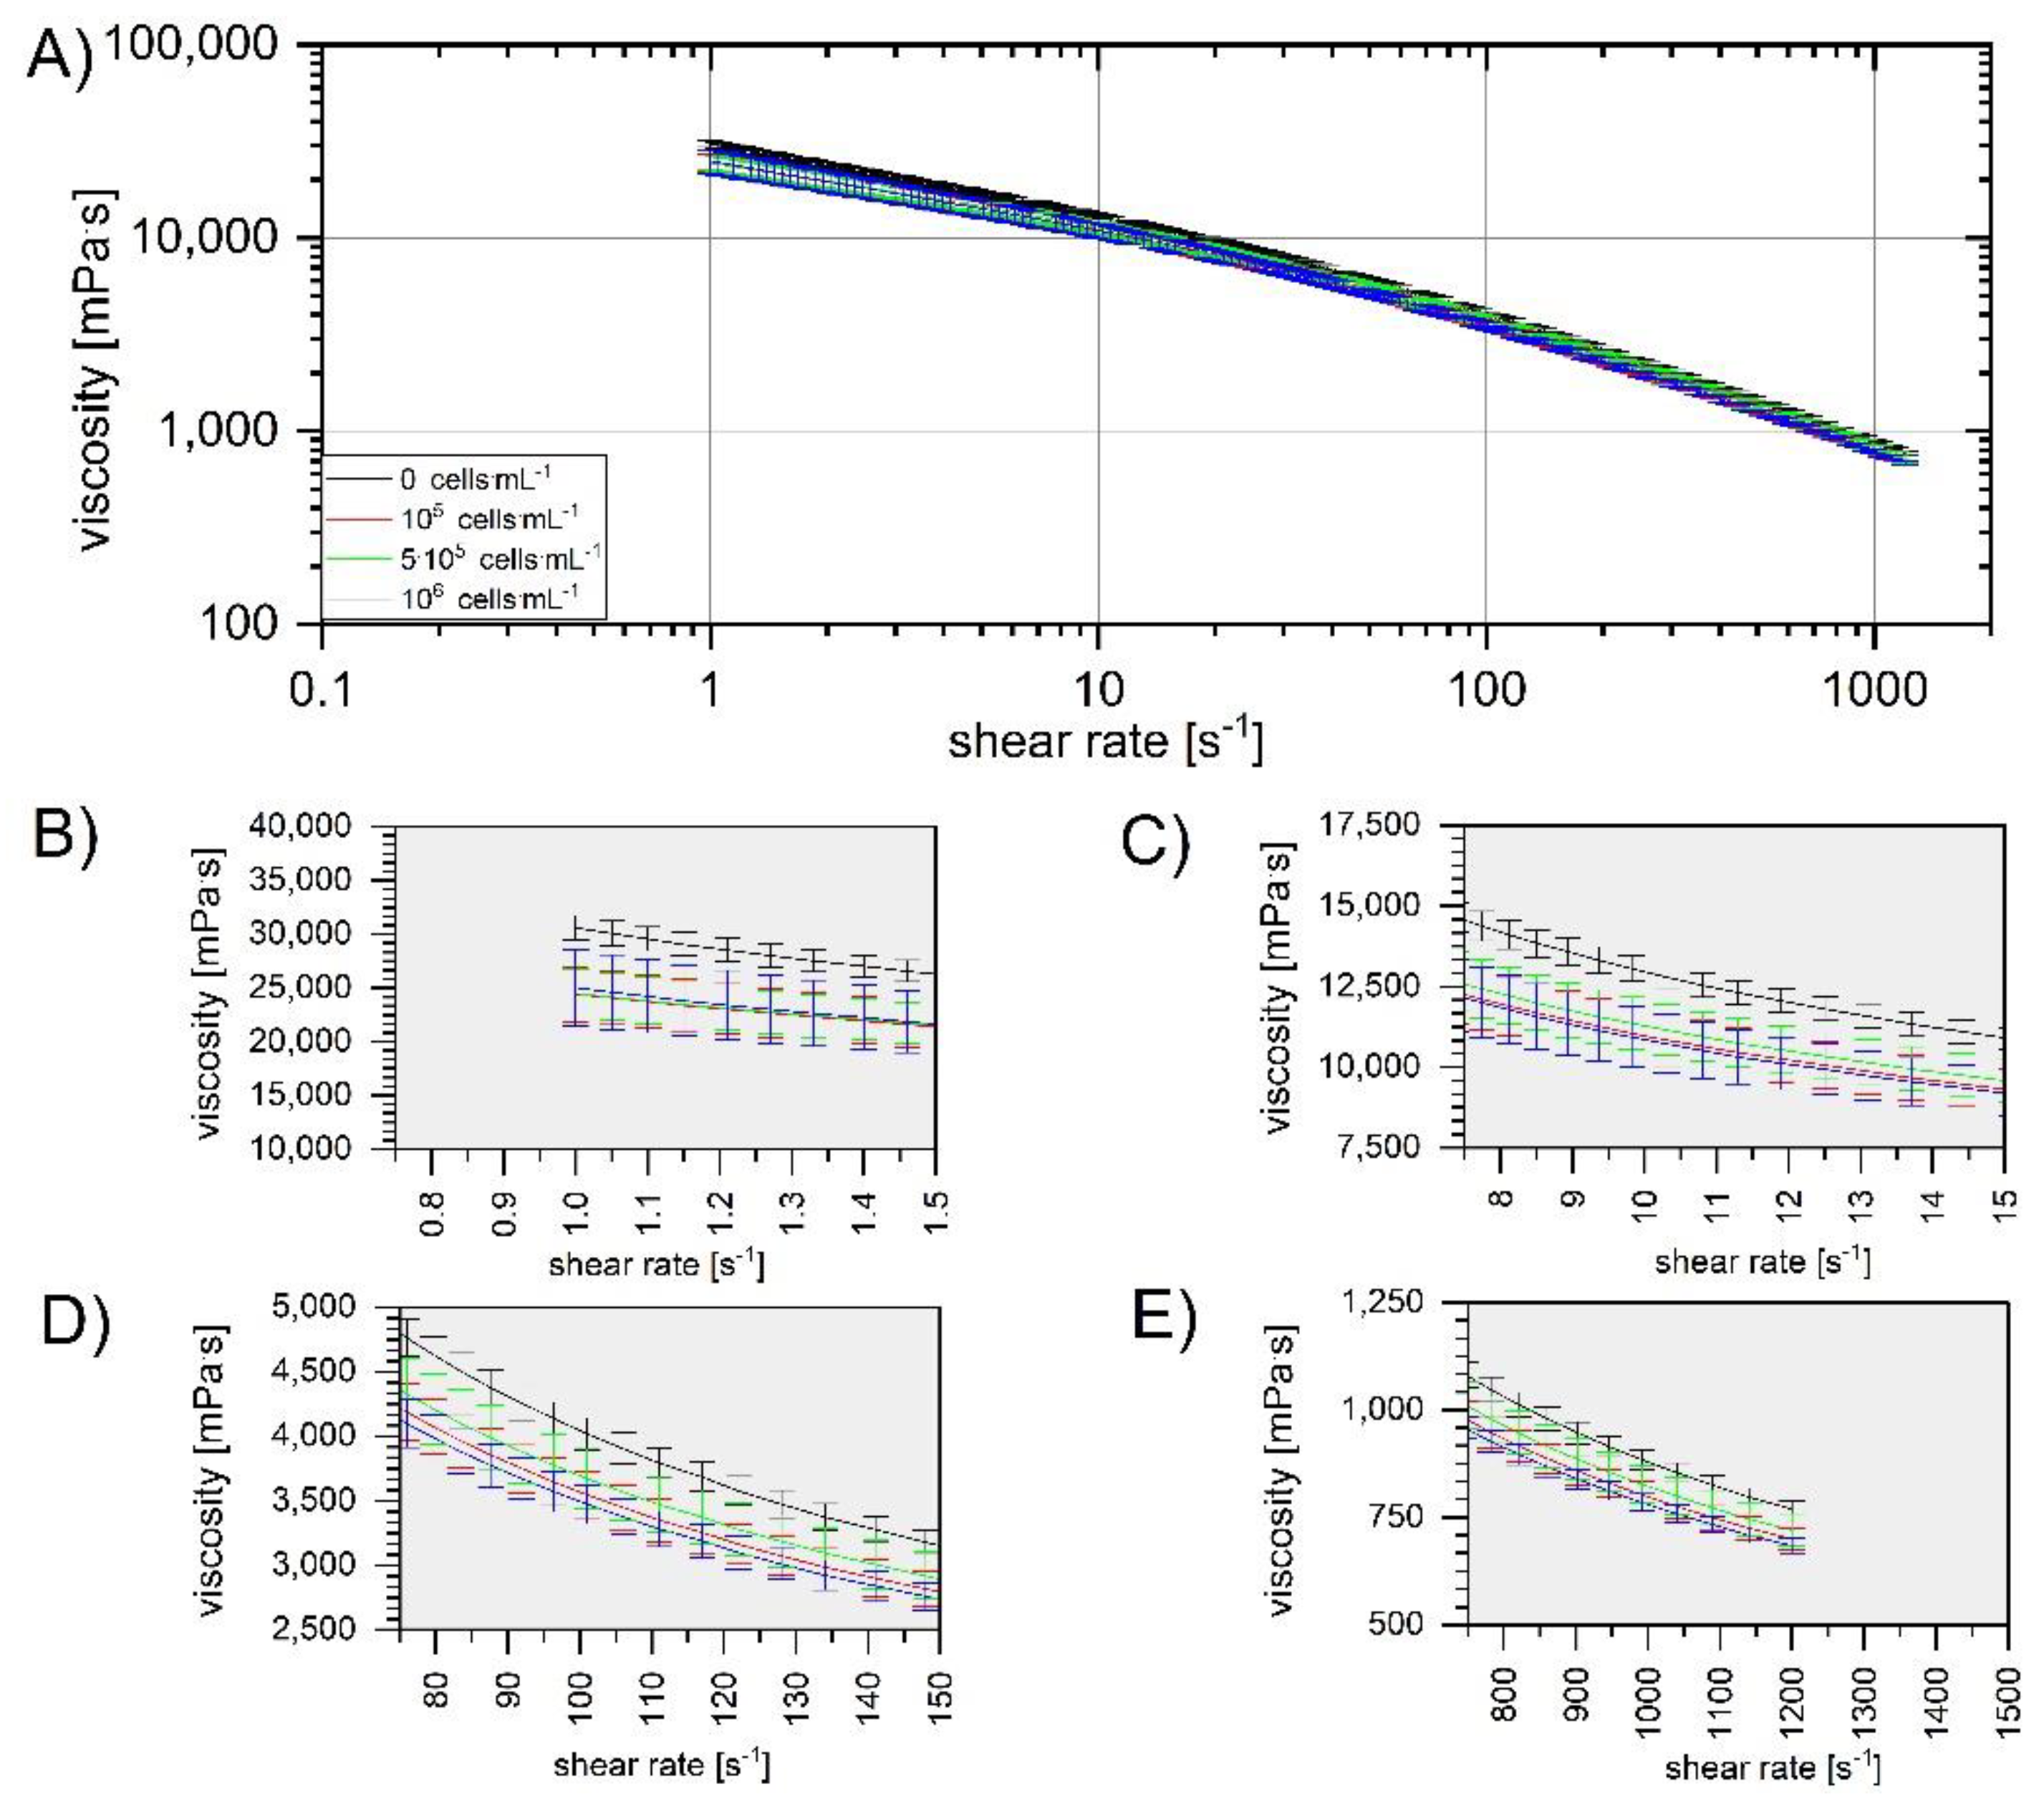
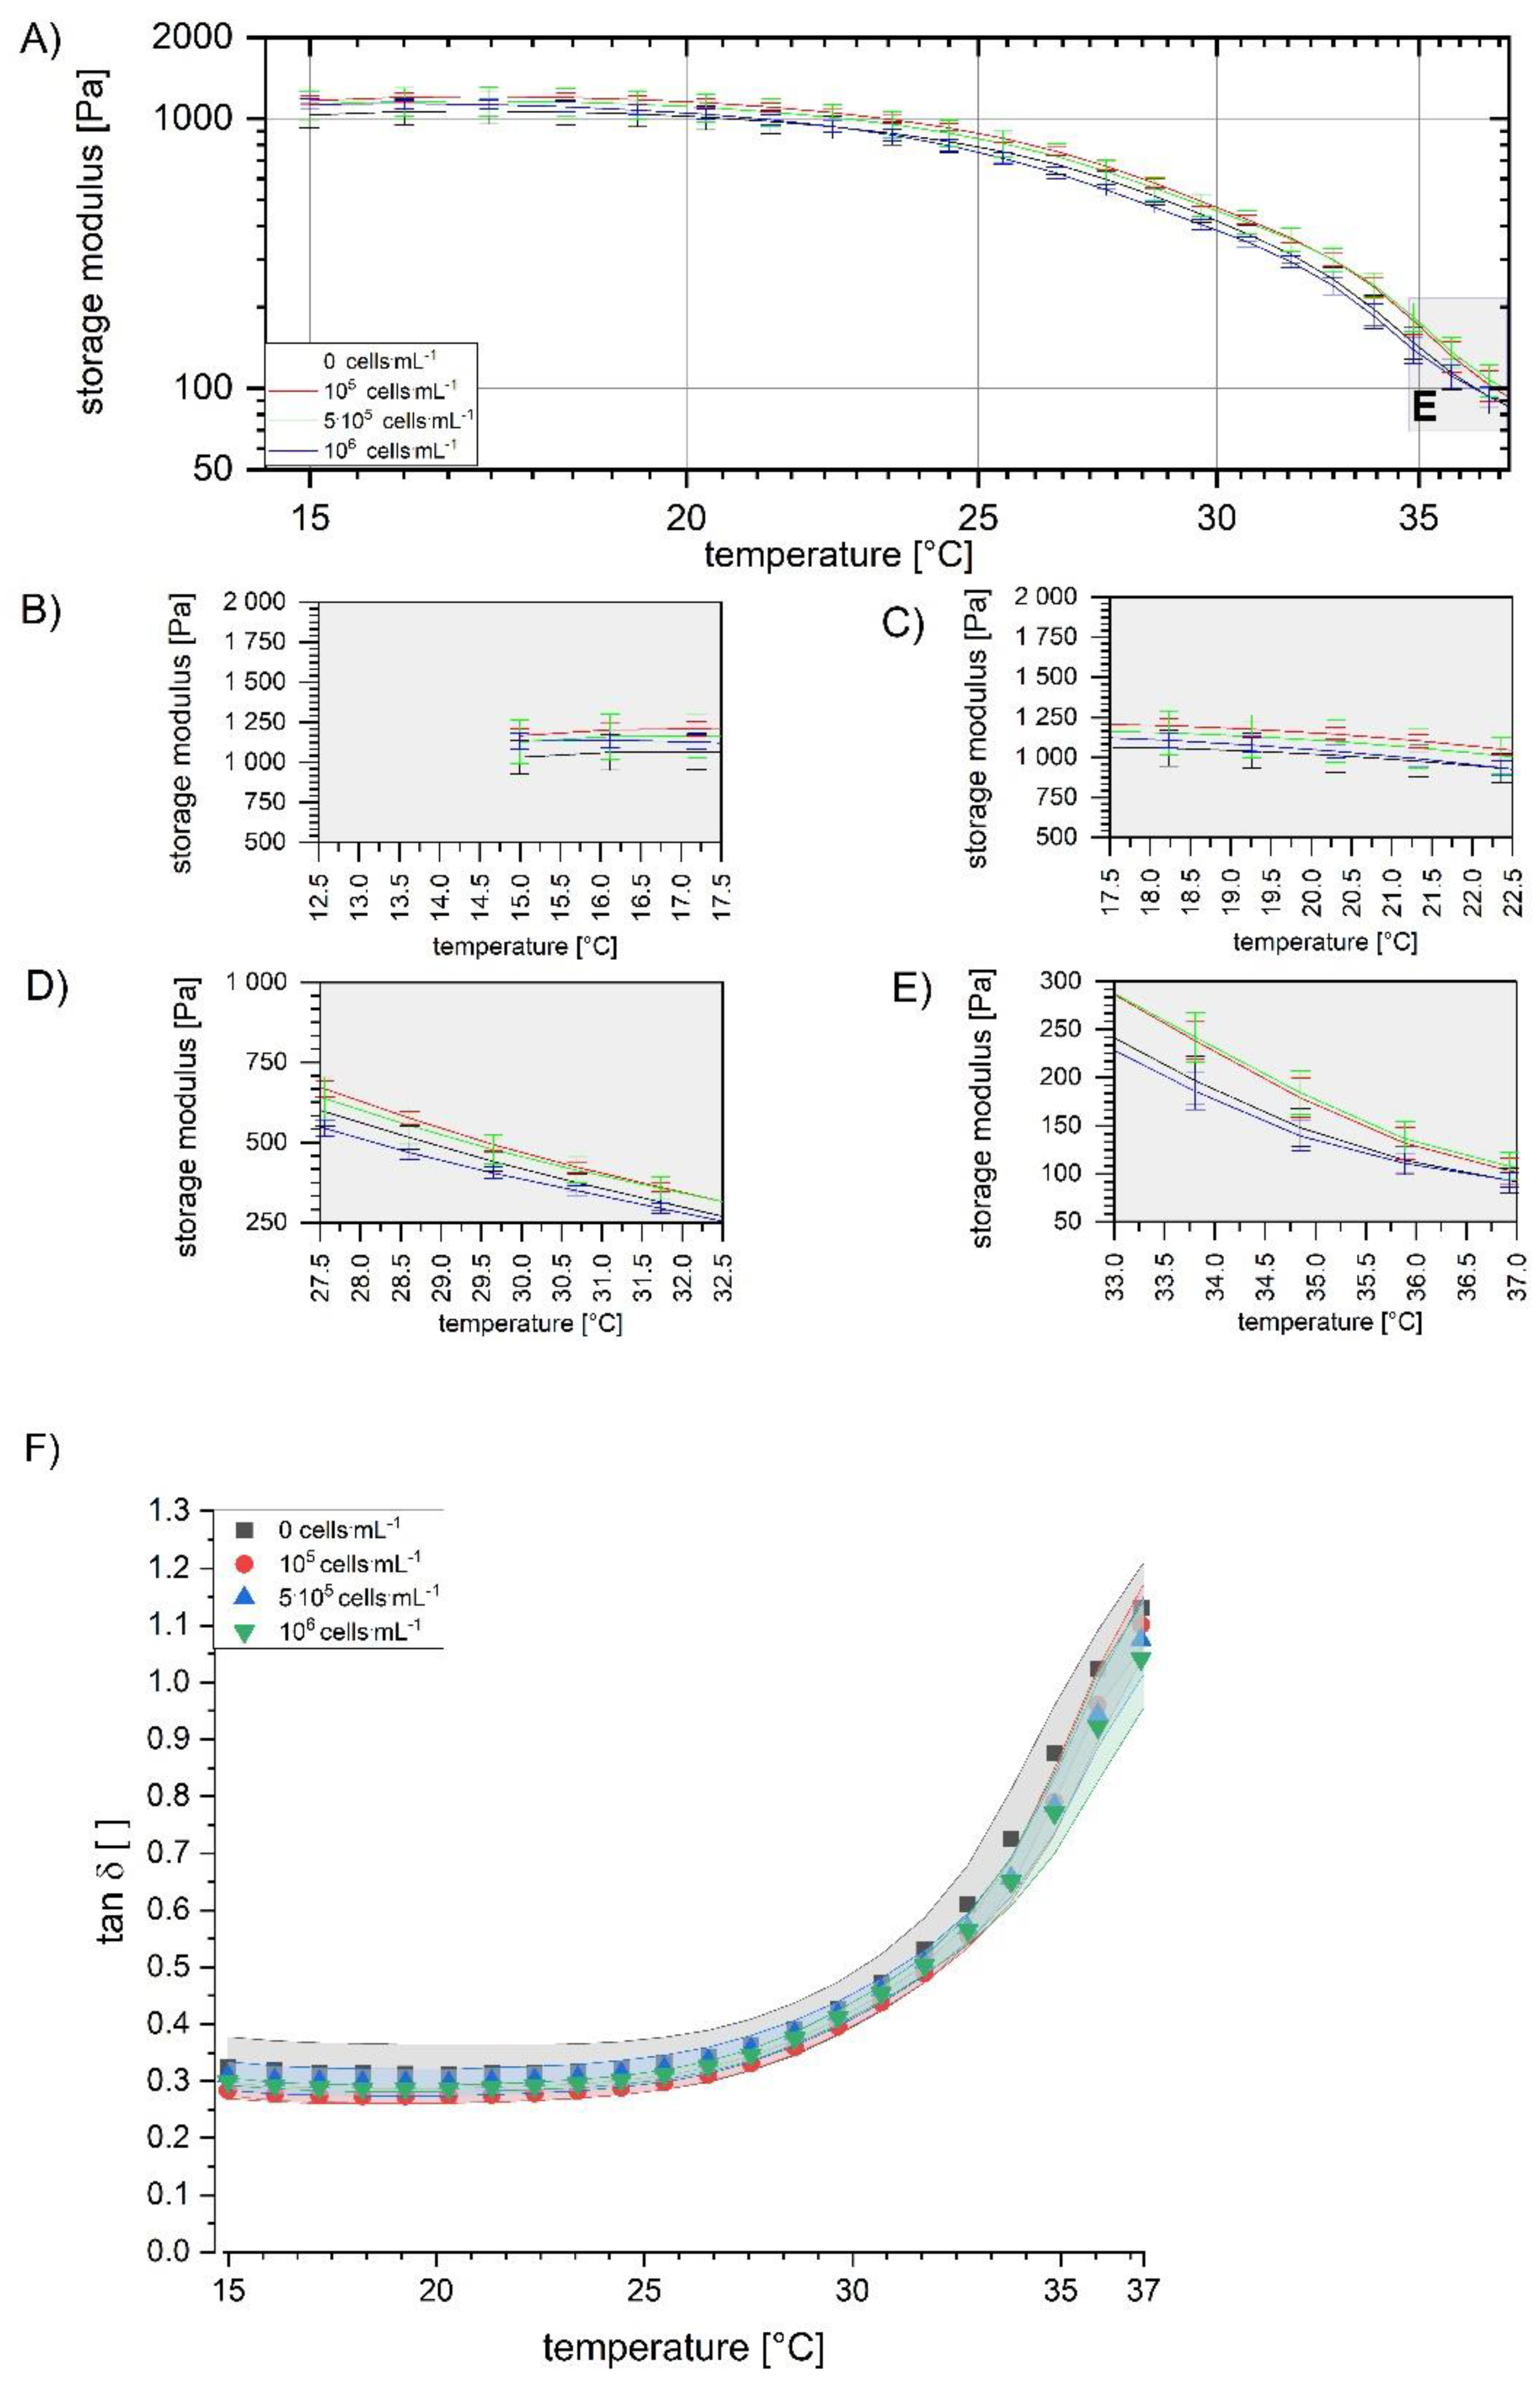
3.3. Estimation of Shear during the Printing Process and on Cells

A flow rate of 0.10 mL·min−1 during printing was determined for our established printing process [12], reflecting a wall shear stress of 226.0 Pa in the nozzle and a very small Reynolds number indicating laminar flow (Table 4). The residence time in the nozzle at this flow rate was 13.6 s. The shear could be reduced by slowing the flow of bioink, but this increased the residence time to 54.30 s. In contrast, higher flow rates increased the shear and reduced the residence time. The flow profile was universally laminar, with theoretical calculations ruling out turbulent flow conditions within the nozzle. The shear exposure in subsequent experiments was therefore set to the determined residence times in the nozzle: 10 s (100 kPa) and 60 s.
Increasing the shear intensity and exposure time reduced cell viability, as shown in the fluorescence-based Celltox Green assay (Figure 5). The viability during the 10 s exposure was 90.27 ± 20.77% (1 Pa) and 91.46 ± 16.24% (20 Pa), whereas the viability during the 60 s exposure decreased continuously from 89.46 ± 28.46% (1 Pa) to 66.45 ± 19.36% (20 Pa). Cell viability therefore appears to depend on the combination of shear intensity and exposure time.
The shear-dependent behavior of the carrier material and corresponding bioink (loaded with 105–106 cells·mL−1) at 37 °C showed a decrease in viscosity as the shear rate increased (Figure 6A), indicating that shear thinning occurred in all samples. The viscosity of the carrier material (Figure 6, black line) started at 30,603 ± 1145 mPa·s (1 s−1) and declined to 770 ± 20 mPa·s (1200 s−1). Adding cells reduced the viscosity of the low-shear regions (Figure 6B,C) compared with the carrier. The viscosity of the bioink ranged from 24,445 to 25,002 mPa·s (1 s−1), representing decreases of 20.12% and 18.30%, respectively, indicating no direct relationship between cell density and viscosity. The carrier and bioink showed greater similarities in the medium and high shear regions (Figure 6D,E), with cell loading reducing the viscosity of the carrier by only 11.32% (100 s−1) and 9.75% (1000 s−1).
The carrier material and bioink showed temperature-dependent behavior, with lower temperatures favoring a higher gel strength (Figure 7). G′ fell by almost 50% in the temperature range 15–29 °C, from 1032.21 ± 105.10 to 516.04 ± 35.94 Pa for the carrier and from 1142.33 ± 21.39 to 532.67 ± 56.32 Pa for the mean of all bioinks. These results show that the addition of cells does not affect gel strength over a range of temperatures (Figure 7B–E). The loss factor declined from a plateau of 0.28–0.33 to final values ranging from 1.04 to 1.13, with the sharpest decline between 25 °C and 37 °C for all samples (Figure 7F).

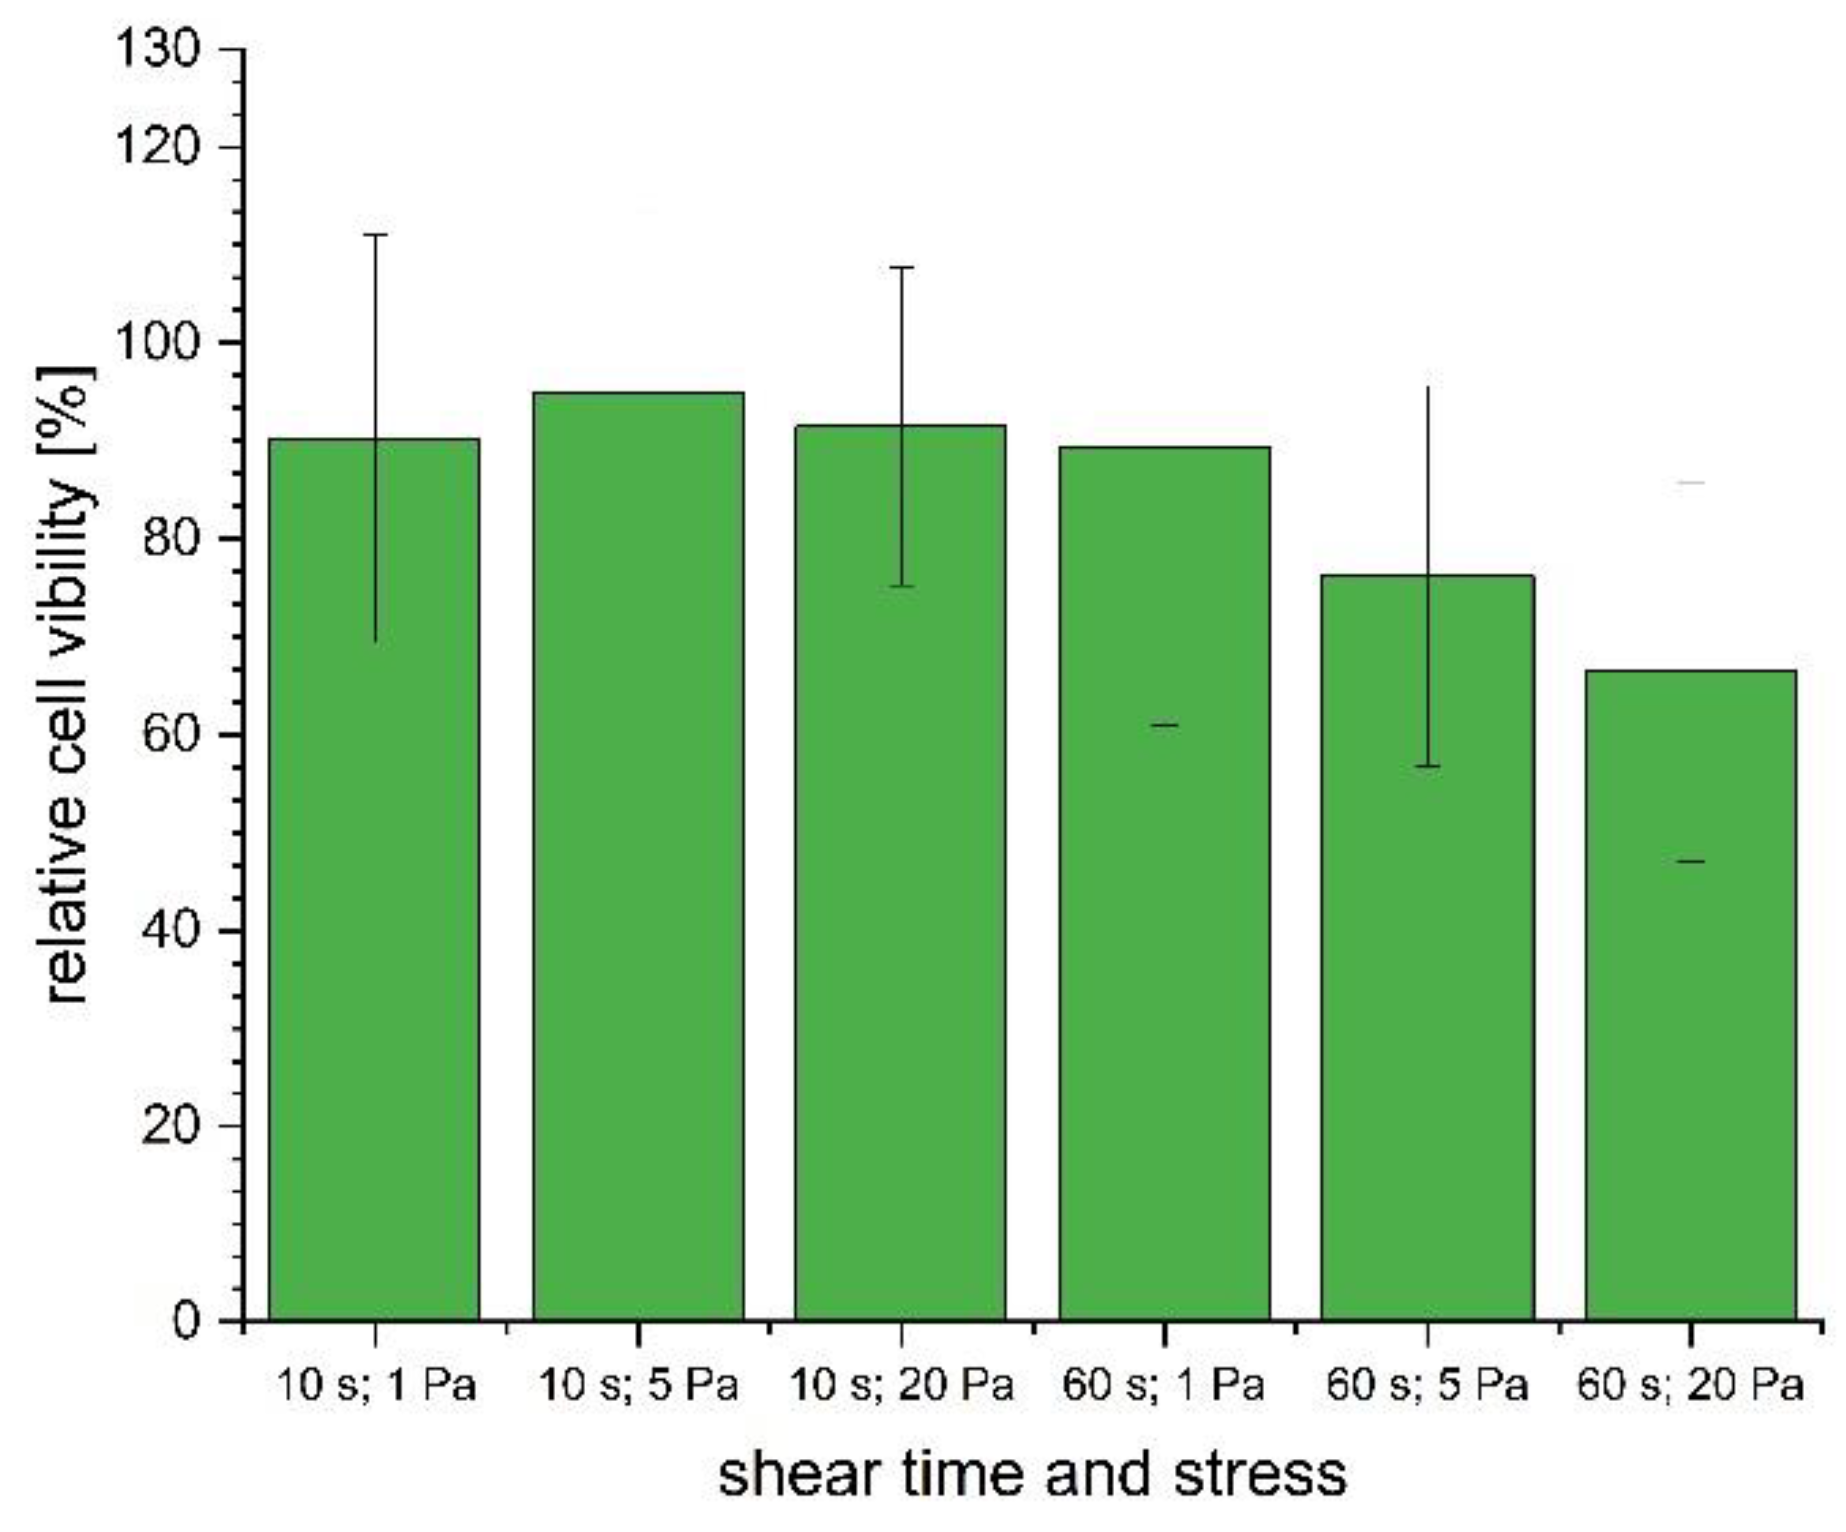
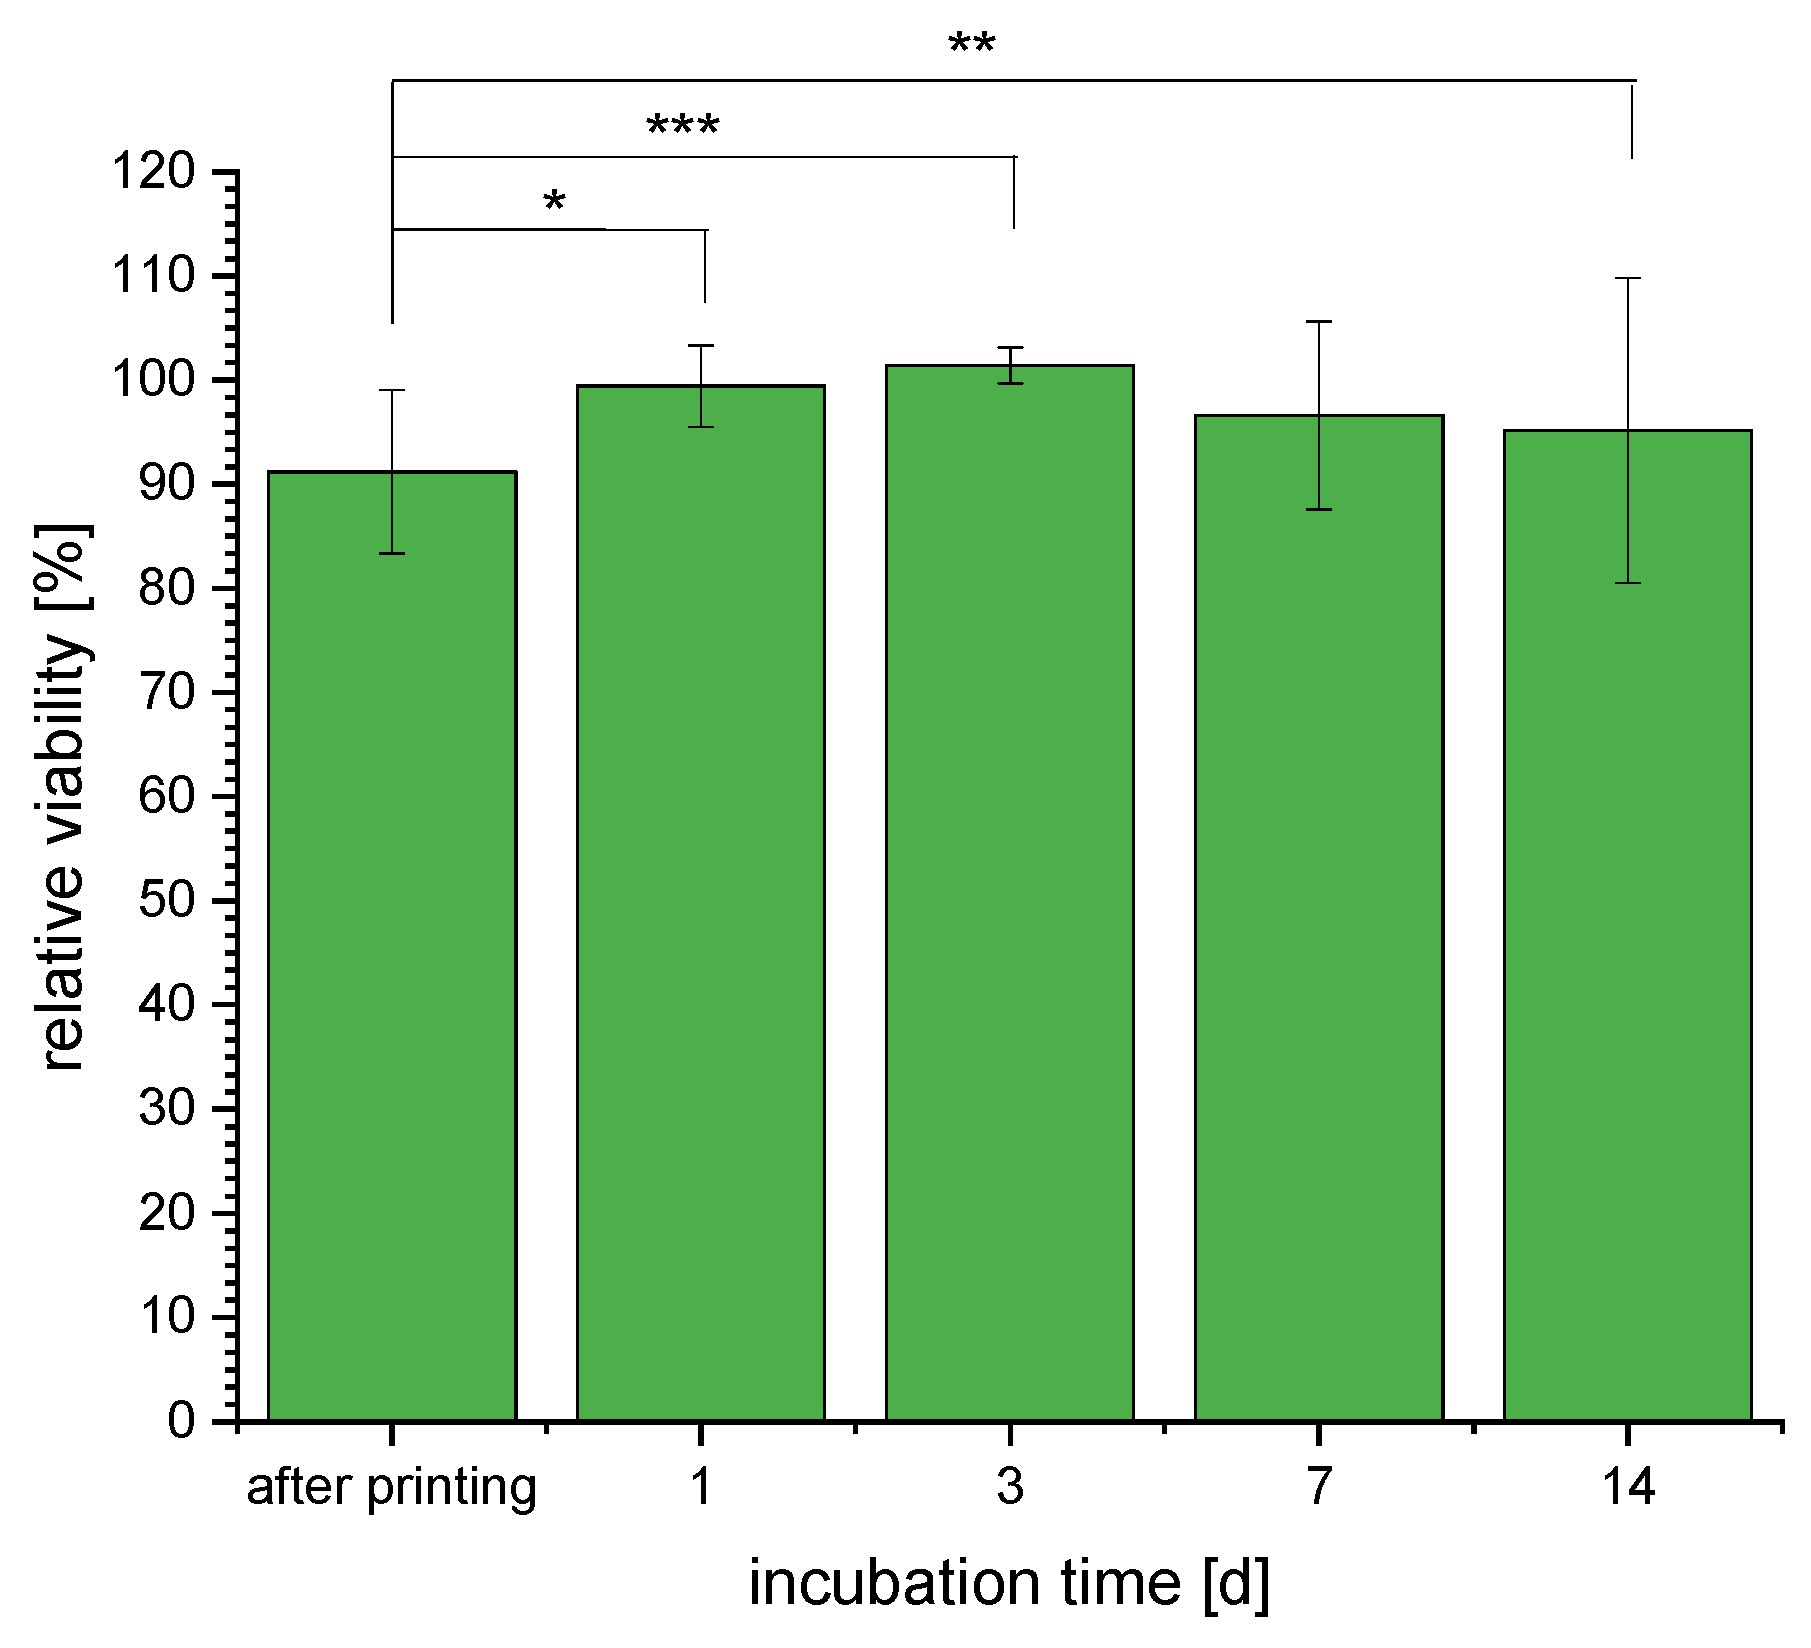
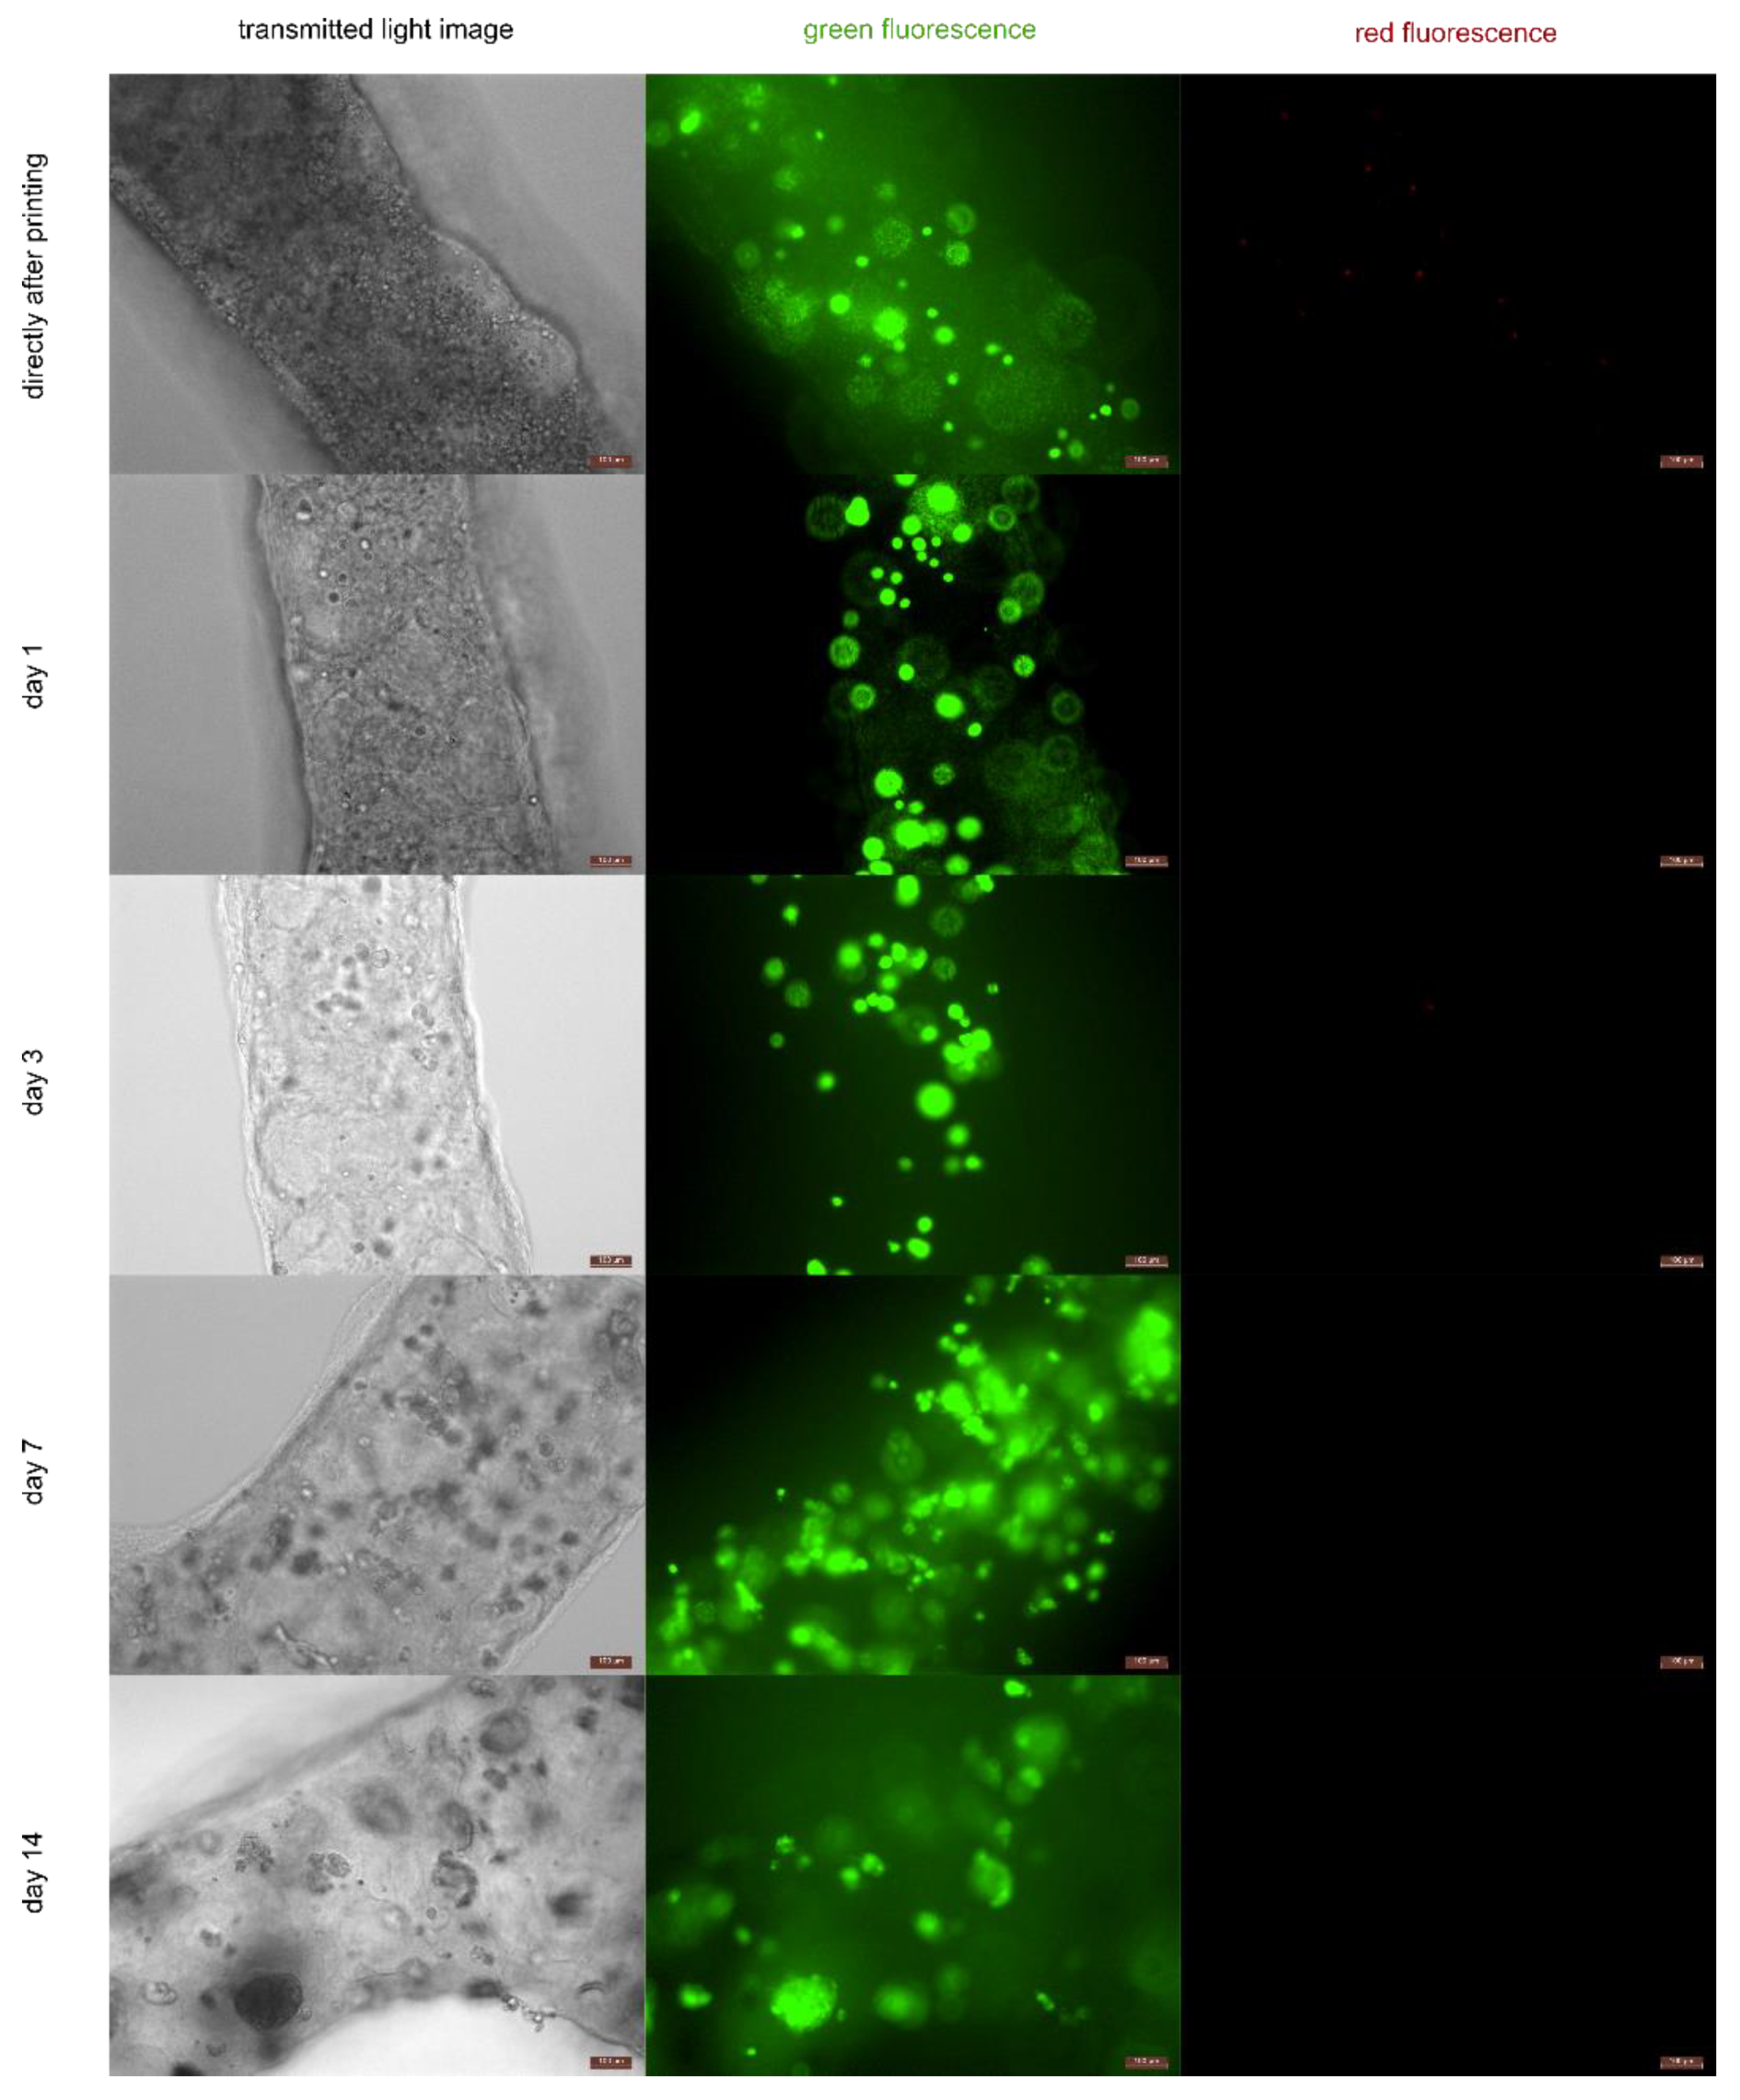
3.4. Cell Viability after Printing

Cell viability was assessed up to 14 days after bioprinting (Figure 8). The viability was lowest directly after printing (91.2 ± 7.8%) and the greatest variability was observed after the full 14 days (95.1 ± 14.6%). Compared with the viability directly after printing, we observed significant differences on days 1, 3, and 14, with day 3 showing the most significant difference.
Transmitted light images were captured during the live/dead cell assay (Figure 9). The largest proportion of dead cells was found directly after printing (right corner), whereas fewer dead cells were detected over time. Meanwhile, the increasing green signal indicated cell expansion. The longer the incubation time, the more cells appeared within the bioink (the exposure time had to be reduced at day 14). The presence of round cell aggregates on day 7 indicated the formation of spheroids.

4. Discussion

The development of carriers and bioinks for 3D printing have been widely investigated, along with the conditions for printing with these substrates [18]. However, the cell mixing step, which is critical for highly reproducible bioprinting, has not been considered in detail [4]. The gelling properties of hydrogels are typically used to control viscosity during cell suspension [4,19]. If the carrier is too viscous, mixing is inefficient and air bubbles are more likely to form, resulting in a heterogenous cell distribution [4]. On the other hand, if the carrier is not viscous enough then cells begin to settle, not only resulting in a heterogeneous distribution but also causing cells to accumulate and block the nozzle [4].
To address this issue, we developed and optimized a cell mixing procedure based on a defined requirements profile, followed by the analysis of rheology and homogeneity. Static mixers achieve efficient mixing in a single step [20], whereas a pair of coupled syringes allow the mixing process to be repeated easily [21]. However, more than eight repetitions are normally required to achieve satisfactory homogeneity, which also reduces the strength of the gel [21]. In our study, we tested three devices with a 1:10 mixing ratio, revealing a lack of homogeneity in the mixing sections or rheological properties that were incompatible with instant printing using our existing bioprinting protocol, thus causing too much shear. Accordingly, we chose a 1:1 mixing ratio in the static mixer system with a long mixing section, which had less impact on the rheology of the carrier and thus a lower shear intensity on the cells. We adapted the volume flow and rheological properties based on temperature-dependent measurements and applied a defined pressure using a syringe pump, resulting in homogenous mixing sections and a low shear impact. Adaption of the volume flow by separating the gelling agents also reduced cell sedimentation compared with a pure aqueous solution. Cell sedimentation is dependent on incubation time and the polymer content of the carrier [22,23]. For example, lower alginate concentrations in a bioink (0.5–4% w/v) accelerated cell sedimentation [22]. In the absence of shear, the cell sedimentation rate was 0.33 µm·s−1 in 1.5% alginate hydrogels and 0.05 µm·s−1 when the alginate concentration was 4% [22]. In contrast, our sedimentation rate was ~6.8 × 10⁻⁴ µm·s−1 for bioink with zero shear (according to Carreau–Yasuda) at 37 °C, and 1.7 × 10⁻⁴ µm·s−1 for a gelatin solution at 28 °C (0.1 s−1). We therefore do not anticipate any complications caused by cell sedimentation in our bioink. In contrast, cells suspended in water sedimented with a velocity of 1.91 µm·s−1, which will result in heterogeneous mixing results. An optimized mixing procedure based on a specific requirements profile was therefore adapted to achieve highly reproducible homogenous distributions, which is the prerequisite for successful bioprinting. The syringe pump and the selected mixing system are also easy to scale for different applications.
The volume flow of the bioink through the nozzle during bioprinting determines the intensity and duration of shear stress for the carrier and the cells. Using an established printing process, we were able to vary the volume flow to predict the behavior of the carrier and the cells within the nozzle. The Reynolds number can predict the flow profile of fluids in a defined geometry [16]. We predicted a laminar flow profile (Re << 1), which agrees with previous studies on the behavior of other hydrogels in capillaries [24,25]. Mathematical models can be used for the precise calculation of flow profiles in a nozzle [24]. The maximum wall shear intensity and the residence time of the fluid were also important criteria for cell survival.
Based on the residence time data, we assessed cell viability following the application of different shear rates in the culture medium, revealing a loss of up to 35% of the cells. Generally, the greater the shear intensity and/or exposure time, the greater the loss of cell viability. This was previously demonstrated by comparing different nozzles, revealing that nozzle geometry and length both influence the degree of cell lysis [26]. Hydrogels with a high concentration of gelling agent (14.4% w/v total) appear to protect the cells from shear stress and maintain viability at levels exceeding 90% [27]. This has been described as the guarding effect [28]. The carrier material we used has a gelling agent content of 7.9% (w/v) [12] and the power law regression model at 20 Pa resulted in shear rates below 1 s−1, confirming the ability to protect cells. Intense and/or prolonged shear stress on the cell membrane cause mechanochemical transduction [8], which induces the expression of protective factors and inhibits cell proliferation, alignment, and survival. It is therefore important to evaluate the status of cells during and after printing. Shear stress is well understood as a critical process parameter during bioprinting [29], with higher extrusion forces leading to more cell death [10,30]. Nozzle geometry, especially the inner diameter, seems to have a major impact on cell viability at medium to high extrusion rates by increasing the shear forces [26,30]. Moreover, the shear rates applied in a previous study caused more cells to undergo apoptosis rather than necrosis, leading the authors to develop an empirical equation system to predict cell viability for different nozzles [26]. We adapted this approach for the calculation of cell viability in BIOINK4 (2% fibrinogen, 2% alginate, and 5% w/v gelatin) [26] for our bioink and printing process [12], indicating a viability of 118.4% at a flow rate of 0.1 mL·min−1. We assumed a 600 µm diameter nozzle (compared with the G20 cylindrical nozzle we used) and extrapolated the residence time values at the wall (adapting the nozzle size from 400 to 600 µm and the length from 6 mm to 25 mm by a scale factor, and adapting our flow rate to their value of 5 µL·s−1 by a scale factor). We found that the shear forces generated during our printing process had a low impact on cell viability.
Cells suspended in the bioink also influence the rheology of the carrier and thus its flow behavior during biofabrication. We observed a maximum viscosity of 20.12% at low shear rates (1–10 s−1) following cell loading, but there was less impact at medium and high shear rates. The temperature profile of the bioink was very similar to the carrier. Higher cell concentrations were previously found to stiffen a collagen hydrogel before gelation but reduce the stiffness after gelation, although the bioink and carrier material were almost identical in terms of the crossover of the storage and loss moduli [11]. In partial agreement with our results, cell loading caused the viscosity of a gelatin methacrylamide hydrogel to decrease, although this was observed in all shear regions, and the temperature profile was only minimally affected [10], as previously reported [31]. The crossing point of the mixture during the temperature sweep was also very similar before and after cell loading [10], as reported for the collagen hydrogel [11]. After the mixing process, we were able to produce 3D-printed grids with continuous and visually equal strand widths using our established bioprinting procedure [12]. Given that the printing performance reflects the temperature behavior of the bioinks and that we obtained clearly defined results, we assume no serious change in printing behavior.
The cell-laden grids were incubated for 2 weeks to determine the viability of the embedded cells. We observed viabilities exceeding 91.2% even after 14 days, which confirms the mixing protocol is compatible with the printing method. Previous studies with gelatin and its derivates as carriers (5% GelMA/8% gelatin) also achieved high cell viabilities up to 7 days and reported good compatibility with the printing process [7]. Billet et al. [10] also observed very high viabilities with 10% GelMA as gelling agent. However, if the gelling agent content was too high it interfered with cell homeostasis (30% GelMA: 62.7–70.4% viability) [7]. Mondal et al. [6] also found some consequential damage after printing due to the increasing extrusion force for more viscous hydrogel samples, using two gelling agents (4% gelatin and 3–4% alginate). However, they reported only ~50% viability after day 15, which may reflect an inadequate nutrient supply because the initial cell density in the bioink was too high. Other researchers also report a strong dependence of cell viability on gelling agent content and composition [5]. Besides the complexity of the surrounding material, the supply conditions for the cells have to be appropriate. Mass transfer and cell consumption models can be used to ensure sufficient nutrient supply [15]. Further, more detailed studies of cellular metabolism and functionality over time should be performed. The long-term survival of cells in encapsulated constructs is necessary to establish cell–cell signaling and regain functional tissues, such as pancreatic islets [32]. By day 7, we observed the formation of large cell aggregates with the appearance of spheroids. Mondal et al. [6] also observed this form of cell–cell interaction but at the earlier stage of 4 days after bioprinting. We therefore assume that cell expansion and cell–cell signaling are possible using our bioink. Further studies should focus on the morphological structure of our spheroids, functionality, metabolism and dose-response experiments to determine their properties as a potential 3D cell culture study model.

5. Conclusions

We have demonstrated the importance of a highly reproducible mixing step to produce bioink from carrier material and cells, leading to successful bioprinting results. The parameters of homogeneity and rheological behavior were valuable to optimize the mixing process and can facilitate the development of processes that are compatible with other established bioprinting methods. Our targeted considerations regarding the impact of shear on the cells during printing and the change in rheology by the cell-loading step resulted in high viable cell-laden 3D printed constructs, even after 14 days. The inclusion of such parameters during process development will help others to improve the reproducibility of their bioprinting processes and the functionality of the resulting tissue constructs.

Author Contributions

Conceptualization, A.P. and P.S.; methodology, A.P., D.H. and P.S.; software, A.P.; validation, A.P. and P.S.; formal analysis, A.P.; investigation, A.P.; resources, A.P.; data curation, A.P.; writing—original draft preparation, A.P.; writing—review and editing, A.P., D.H., P.S. and F.E.R.; visualization, A.P. and D.H.; supervision, P.S. and F.E.R.; project administration, P.S. and F.E.R.; funding acquisition, F.E.R. All authors have read and agreed to the published version of the manuscript.

Funding

This research was funded by the Hessian State Ministry of Higher Education, Research, and the Arts under the initiative ‘Forschungscampus Mittelhessen’ and the APCs were covered by the Technische Hochschule Mittelhessen publication fund.

Institutional Review Board Statement

Not applicable.

Informed Consent Statement

Not applicable.

Data Availability Statement

All data are available in the manuscript.

Acknowledgments

We acknowledge Patrick Thomas Werner Dillmann for helpful assistance with the mixing devices and cell mixing processes, and Richard M. Twyman for manuscript editing.

Conflicts of Interest

The authors declare no conflict of interest. The funders had no role in the design of the study; in the collection, analyses, or interpretation of data; in the writing of the manuscript, or in the decision to publish the results.

References

  1. Groll, J.; Boland, T.; Blunk, T.; Burdick, J.A.; Cho, D.-W.; Dalton, P.D.; Derby, B.; Forgacs, G.; Li, Q.; Mironov, V.A. Biofabrication: Reappraising the definition of an evolving field. Biofabrication 2016, 8, 13001. [Google Scholar] [CrossRef] [Green Version]
  2. Ramos, T.A.D.S.; Moroni, L. Tissue engineering and regenerative medicine 2019: The role of biofabrication—A year in review. Tissue Eng. Part C Methods 2020, 26, 91–106. [Google Scholar] [CrossRef]
  3. Hölzl, K.; Lin, S.; Tytgat, L.; van Vlierberghe, S.; Gu, L.; Ovsianikov, A. Bioink properties before, during and after 3D bioprinting. Biofabrication 2016, 8, 32002. [Google Scholar] [CrossRef] [PubMed]
  4. Gillispie, G.; Prim, P.; Copus, J.; Fisher, J.; Mikos, A.G.; Yoo, J.J.; Atala, A.; Lee, S.J. Assessment methodologies for extrusion-based bioink printability. Biofabrication 2020, 12, 22003. [Google Scholar] [CrossRef]
  5. Markstedt, K.; Mantas, A.; Tournier, I.; Ávila, H.M.; Hägg, D.; Gatenholm, P. 3D bioprinting human chondrocytes with nanocellulose-alginate bioink for cartilage tissue engineering applications. Biomacromolecules 2015, 16, 1489–1496. [Google Scholar] [CrossRef] [PubMed]
  6. Mondal, A.; Gebeyehu, A.; Miranda, M.; Bahadur, D.; Patel, N.; Ramakrishnan, S.; Rishi, A.K.; Singh, M. Characterization and printability of sodium alginate-gelatin hydrogel for bioprinting NSCLC co-culture. Sci. Rep. 2019, 9, 19914. [Google Scholar] [CrossRef]
  7. Yin, J.; Yan, M.; Wang, Y.; Fu, J.; Suo, H. 3D bioprinting of low-concentration cell-laden gelatin methacrylate (GelMA) bioinks with a two-step cross-linking strategy. ACS Appl. Mater. Interfaces 2018, 10, 6849–6857. [Google Scholar] [CrossRef] [PubMed]
  8. White, C.R.; Frangos, J.A. The shear stress of it all: The cell membrane and mechanochemical transduction. Philos. Trans. R. Soc. B Biol. Sci. 2007, 362, 1459–1467. [Google Scholar] [CrossRef] [PubMed]
  9. Chisti, Y. Hydrodynamic damage to animal cells. Crit. Rev. Biotechnol. 2001, 21, 67–110. [Google Scholar] [CrossRef]
  10. Billiet, T.; Gevaert, E.; de Schryver, T.; Cornelissen, M.; Dubruel, P. The 3D printing of gelatin methacrylamide cell-laden tissue-engineered constructs with high cell viability. Biomaterials 2014, 35, 49–62. [Google Scholar] [CrossRef]
  11. Diamantides, N.; Dugopolski, C.; Blahut, E.; Kennedy, S.; Bonassar, L.J. High density cell seeding affects the rheology and printability of collagen bioinks. Biofabrication 2019, 11, 45016. [Google Scholar] [CrossRef] [PubMed]
  12. Pössl, A.; Hartzke, D.; Schmidts, T.M.; Runkel, F.E.; Schlupp, P. A targeted rheological bioink development guideline and its systematic correlation with printing behavior. Biofabrication 2021, 13, 035021. [Google Scholar] [CrossRef] [PubMed]
  13. Thayer, P.S.; Orrhult, L.S.; Martínez, H. Bioprinting of cartilage and skin tissue analogs utilizing a novel passive mixing unit technique for bioink precellularization. J. Vis. Exp. JoVE 2018, 131, e56372. [Google Scholar] [CrossRef] [Green Version]
  14. Park, K.; Jang, J.; Irimia, D.; Sturgis, J.; Lee, J.; Robinson, J.P.; Toner, M.; Bashir, R. ‘Living cantilever arrays’ for characterization of mass of single live cells in fluids. Lab A Chip 2008, 8, 1034–1041. [Google Scholar] [CrossRef] [PubMed] [Green Version]
  15. Pössl, A.; Hartzke, D.; Schlupp, P.; Runkel, F.E. Calculation of Mass Transfer and Cell-Specific Consumption Rates to Improve Cell Viability in Bioink Tissue Constructs. Materials 2021, 14, 4387. [Google Scholar] [CrossRef]
  16. Castillo, E.; Codina, R. Stabilized stress-velocity-pressure finite element formulations of the Navier–Stokes problem for fluids with non-linear viscosity. Comput. Methods Appl. Mech. Eng. 2014, 279, 554–578. [Google Scholar] [CrossRef]
  17. Salzig, D.; Schmiermund, A.; Grace, P.P.; Elseberg, C.; Weber, C.; Czermak, P. Enzymatic detachment of therapeutic mesenchymal stromal cells grown on glass carriers in a bioreactor. Open Biomed. Eng. J. 2013, 7, 147. [Google Scholar] [CrossRef] [Green Version]
  18. Hospodiuk, M.; Dey, M.; Sosnoski, D.; Ozbolat, I.T. The bioink: A comprehensive review on bioprintable materials. Biotechnol. Adv. 2017, 35, 217–239. [Google Scholar] [CrossRef] [Green Version]
  19. Mouser, V.H.; Melchels, F.P.; Visser, J.; Dhert, W.J.; Gawlitta, D.; Malda, J. Yield stress determines bioprintability of hydrogels based on gelatin-methacryloyl and gellan gum for cartilage bioprinting. Biofabrication 2016, 8, 35003. [Google Scholar] [CrossRef]
  20. Kumar, V.; Shirke, V.; Nigam, K. Performance of Kenics static mixer over a wide range of Reynolds number. Chem. Eng. J. 2008, 139, 284–295. [Google Scholar] [CrossRef]
  21. Cohen, D.L.; Lo, W.; Tsavaris, A.; Peng, D.; Lipson, H.; Bonassar, L.J. Increased mixing improves hydrogel homogeneity and quality of three-dimensional printed constructs. Tissue Eng. Part C Methods 2011, 17, 239–248. [Google Scholar] [CrossRef] [PubMed]
  22. Xu, H.; Zhang, Z.; Xu, C. Sedimentation study of bioink containing living cells. J. Appl. Phys. 2019, 125, 114901. [Google Scholar] [CrossRef]
  23. Dubbin, K.; Tabet, A.; Heilshorn, S.C. Quantitative criteria to benchmark new and existing bio-inks for cell compatibility. Biofabrication 2017, 9, 44102. [Google Scholar] [CrossRef] [PubMed]
  24. Müller, S.J.; Mirzahossein, E.; Iftekhar, E.N.; Bächer, C.; Schrüfer, S.; Schubert, D.W.; Fabry, B.; Gekle, S. Flow and hydrodynamic shear stress inside a printing needle during biofabrication. PLoS ONE 2020, 15, e0236371. [Google Scholar] [CrossRef]
  25. Yan, C.; Mackay, M.E.; Czymmek, K.; Nagarkar, R.P.; Schneider, J.; Pochan, D.J. Injectable solid peptide hydrogel as a cell carrier: Effects of shear flow on hydrogels and cell payload. Langmuir 2012, 28, 6076–6087. [Google Scholar] [CrossRef] [Green Version]
  26. Lucas, L.; Aravind, A.; Emma, P.; Christophe, M.; Edwin-Joffrey, C. Rheology, simulation and data analysis toward bioprinting cell viability awareness. Bioprinting 2021, 21, e00119. [Google Scholar]
  27. Li, Z.; Huang, S.; Liu, Y.; Yao, B.; Hu, T.; Shi, H.; Xie, J.; Fu, X. Tuning alginate-gelatin bioink properties by varying solvent and their impact on stem cell behavior. Sci. Rep. 2018, 8, 8020. [Google Scholar] [CrossRef] [Green Version]
  28. Panwar, A.; Tan, L.P. Current status of bioinks for micro-extrusion-based 3D bioprinting. Molecules 2016, 21, 685. [Google Scholar] [CrossRef]
  29. Blaeser, A.; Duarte Campos, D.F.; Puster, U.; Richtering, W.; Stevens, M.M.; Fischer, H. Controlling shear stress in 3D bioprinting is a key factor to balance printing resolution and stem cell integrity. Adv. Healthc. Mater. 2016, 5, 326–333. [Google Scholar] [CrossRef]
  30. Nair, K.; Gandhi, M.; Khalil, S.; Yan, K.C.; Marcolongo, M.; Barbee, K.; Sun, W. Characterization of cell viability during bioprinting processes. Biotechnol. J. Healthc. Nutr. Technol. 2009, 4, 1168–1177. [Google Scholar] [CrossRef] [PubMed]
  31. Zhao, Y.; Li, Y.; Mao, S.; Sun, W.; Yao, R. The influence of printing parameters on cell survival rate and printability in microextrusion-based 3D cell printing technology. Biofabrication 2015, 7, 45002. [Google Scholar] [CrossRef] [PubMed]
  32. Petry, F.; Weidner, T.; Czermak, P.; Salzig, D. Three-dimensional bioreactor technologies for the cocultivation of human mesenchymal stem/stromal cells and beta cells. Stem Cells Int. 2018, 2018, 2547098. [Google Scholar] [CrossRef] [PubMed] [Green Version]
Figure 1. The mixing devices used in this study. (A) Appearance of the mixers (CELLMIXER, Syringe coupler, Adchem 1:10 and 1:1) without the cartridges and the custom designed adapter for the 1:1 Adchem K system; (B) custom designed adapter to hold the 1:1 Adchem K cartridge in shape while using the syringe pump without mixer. Scale bar = 10 mm.
Applsci 12 00326 g001
Figure 2. Homogeneity of mixing and rheological properties with a 1:10 mixing ratio at 37 °C in three commercial devices. (A) Homogeneity of a fluorescein dye in three time-dependent mixing sections. (B) Rheological properties after mixing with respect to an established heating process for bioprinting after 30 min at 37 °C (black column). Data are means ± SD (n = 3; Kruskal–Wallis test * p < 0.05).
Applsci 12 00326 g002
Figure 3. Temperature sweeps of the carrier material and its components. (A) Rheological behavior of the gelatin component in rotation mode at 0.1 s−1. (B) Temperature dependency of the κ-carrageenan, CMC, and alginate component in oscillation mode (1% strain, 10 rad·s−1). (C) gelatin component in oscillation mode (1% strain, 10 rad·s−1). (D) Temperature dependency of the mixed carrier material in oscillation mode (1% strain, 10 rad·s−1) showing the crossing point. Data are means ± SD (n = 3).
Applsci 12 00326 g003
Figure 4. Optimization of the mixing process by applying the requirements profile (Table 2) to the Adchem 1:1 system at 28 °C. (A) Rheological assessment of the impact of pipetting strokes on the gelatin solution (n = 3; Kruskal–Wallis test * p < 0.1). (B) Time-dependent re-establishment of the gelatin solution after 16 strokes compared with one stroke (n = 3). (C) Analysis of homogeneity using fluorescein for the three mixing sections (n = 3) with different syringe pump settings. (D) Rheological properties after mixing (n = 6) relative to an established printing process (black column).
Applsci 12 00326 g004
Figure 5. Viability of 1.1B4 cells determined using the CellTox Green assay at different shear intensities (1–20 Pa) and exposure times (10 s and 60 s) in cell culture medium with an 80-µm gap at 37 °C (n = 3). The sheared samples were normalized to untreated cells (100%).
Applsci 12 00326 g005
Figure 6. The effect of shear on the properties of the cell-free carrier and cell-laden bioink. (A) The overall flow curve. (BE) Zoomed segments of the flow curve showing shear characteristics in the low, medium, and high shear regions. The carrier material (no cells) is shown in black, whereas the bioinks are shown in red (105 cells·mL−1), green (5 × 10⁵ cells·mL−1), and blue (106 cells·mL−1). Data are means ± SD (n = 3).
Applsci 12 00326 g006
Figure 7. Temperature-dependent gel strength of the carrier material and cell-laden bioinks. The carrier material is shown in black and the bioinks in red (105 cells·mL−1), green (5 × 10⁵ cells·mL−1), and blue (106 cells·mL−1). (A) The overall temperature sweep for the samples in oscillation mode. (BE) Zoomed segments of the temperature curve. (F) The corresponding loss factors. Data are means ± SD (n = 3).
Applsci 12 00326 g007
Figure 8. Viability of cells directly after printing and at several time points thereafter compared with viability before printing (set at 100%) determined in a live/dead cell staining assay. Data are means ± SD (n = 4 grids, 3 images each; Kruskal–Wallis test, * p < 0.1, ** p < 0.05, *** p < 0.01).
Applsci 12 00326 g008
Figure 9. Representative non-processed images of a cell-laden strand over time. Left panels show transmitted light images. Center panels show the green fluorescence channel (FDA), indicating the viable cells. Right panels show the red fluorescence channel, indicating dead cells (PI). Scale bar = 100 µm. For high quality images, the reader is referred to the web version.
Applsci 12 00326 g009
Table 1. Major characteristics of the mixing devices used in this study.
System/
Mixing Ratio
Volume Chamber 1
(mL)
Volume Chamber 2
(mL)
Mixing
Principle
Number of Mixing StepsMixer Length/Inner/Outlet
Diameter (mm)
Adchem K/1:109.01.0Static mixer174.0/3.2/1.0
CELLMIXER/1:102.70.3Static mixer125.7/1.8/1.8
Syringe–syringe/1:102.70.3Tapering409.4/1.6/1.6
Adchem K/1:16.56.5Static mixer174.0/3.2/1.0
Table 2. Requirements profile for the optimization of the mixing process with cells for bioprinting.
ChallengeSolution
Cell sedimentation in aqueous solution
can occur during the process
Increase η and split the carrier material into two parts
Strongly differing viscosity causes unsteady flow inside the mixers and leads to heterogenous mixing resultsOptimize rheological properties by using separate gelling agents in the bioink material, ensuring a steady flow from each chamber
The smaller cell suspension volume,
the greater likelihood of cell damage
Select acceptable ratio
from 1:10 to 1:1
One mixing step reduces shear stress intensity and makes the process more scalableSelect a static mixer
Variability caused by manual mixing leads to poor reproducibility during printing Mix with syringe pump instead to improve reproducibility
Table 3. Summary of sedimentation times for the carrier material (left), gelatin (middle), and water (right) according to the shear rate, assuming a path length of 7 cm. The temperatures represent the later printing process temperature (37 °C) and the rheological optimization temperature for gelatin (Figure 3).
Bioink Material (Pössl et al. [12])Gelatin SolutionWater
Carreau–Yasuda
37 °C
Measured
37 °C
Measured
37 °C
Measured
37 °C
Measured
37 °C
Carreau–Yasuda
37 °C
Measured
28 °C
37 °C
Shear rate (s−1)01.010.0100.01000.0Infinity0.1Not relevant
viscosity (Pa·s)280.0521.008.002.500.500.00011127.140.001
Resulting v (m·s−1)
·10−10
6.890.7238.2762.33811.419,057,237.91.71,905,723.8
Sedimentation time (min)1,714,440.5128,560.148,975.315,305.83061.00.66,900,247.96.1
Table 4. Calculation of shear intensity, Reynolds number, and residence time at different flow rates in a G20 nozzle (∅ 600 µm, 25 mm length, cylindrical). As reference for the printing process [12], the volume flow rate is presented for 37 °C and 40 min cooling time.
Volume Flow Rate (mL·min−1)τ
Wall (Pa)
γ ˙
Wall (s−1)
Reynolds Number Power LawReynolds Number Carreau–YasudaResidence Time z
in Nozzle
(s)
0.025112.219.60.0001180.00001454.30
0.05159.339.30.0003320.00002727.14
0.10
(100 kPa)
226.078.60.0009350.00005413.60
0.50509.5393.00.0103750.0002712.71
0.75625.2589.50.0190220.0004071.81
Publisher’s Note: MDPI stays neutral with regard to jurisdictional claims in published maps and institutional affiliations.

