Article

Laser-Induced Chemical Liquid-Phase Deposition Plasmonic Gold Nanoparticles on Porous TiO2 Film with Great Photoelectrochemical Performance

by
Anton S. Voronin
1,2,3,*,
Ivan V. Nemtsev
1,4,5,
Maxim S. Molokeev
6,7,
Mikhail M. Simunin
1,8,9,
Ekaterina A. Kozlova
10,
Dina V. Markovskaya
10,11,
Denis V. Lebedev
12,13,
Dmitry S. Lopatin
14 and
Stanislav V. Khartov
1
1
Department of Molecular Electronics, Federal Research Center (Krasnoyarsk Scientific Center), Siberian Branch, Russian Academy of Sciences (FRC KSC SB RAS), 660036 Krasnoyarsk, Russia
2
School of Engineering and Construction, Siberian Federal University, 660041 Krasnoyarsk, Russia
3
Laboratory of EMI Shielding Materials, Bauman Moscow State Technical University, 105005 Moscow, Russia
4
School of Fundamental Biology and Biotechnology, Siberian Federal University, 660041 Krasnoyarsk, Russia
5
Laboratory of Molecular Spectroscopy, L.V. Kirensky Institute of Physics, Siberian Branch, Russian Academy of Sciences, 660036 Krasnoyarsk, Russia
6
School of Engineering Physics and Radio Electronics, Siberian Federal University, 660041 Krasnoyarsk, Russia
7
Laboratory of Crystal Physics, L.V. Kirensky Institute of Physics, Siberian Branch, Russian Academy of Sciences, 660036 Krasnoyarsk, Russia
8
School of Non-Ferrous Metals and Materials Science, Siberian Federal University, 660041 Krasnoyarsk, Russia
9
Department of Aircraft, Reshetnev Siberian State University of Science and Technology, 660037 Krasnoyarsk, Russia
10
Department of Heterogeneous Catalysis, Federal Research Center, Boreskov Institute of Catalysis SB RAS, 630090 Novosibirsk, Russia
11
Faculty of Natural Science, Novosibirsk State University, 630090 Novosibirsk, Russia
12
Institute of Chemistry, Saint Petersburg State University, 199034 St. Petersburg, Russia
13
Laboratory of Renewable Energy Sources, Alferov University, 194021 St. Petersburg, Russia
14
PhotoChem Electronics LLC, 353292 Goryachiy Klyuch, Russia
*
Author to whom correspondence should be addressed.
Appl. Sci. 2022, 12(1), 30; https://doi.org/10.3390/app12010030
Submission received: 22 November 2021 / Revised: 15 December 2021 / Accepted: 16 December 2021 / Published: 21 December 2021
(This article belongs to the Section Materials Science and Engineering)

Abstract

:
This paper considers the photoelectrochemical characteristics of a composite porous TiO2 thin film with deposited plasmonic gold nanoparticles. The deposition of gold nanoparticles was carried out by the laser-induced chemical liquid-phase deposition (LCLD) method. The structural characteristics of the composite have been studied; it has been shown that the porous TiO2 film has a lattice related to the tetragonal system and is in the anatase phase. Gold nanoparticles form on the surface of a porous TiO2 film. A complex of photoelectrochemical measurements was carried out. It was shown that the deposition of plasmonic gold nanoparticles led to a significant increase in the photocurrent density by ~820%. The proposed concept is aimed at testing the method of forming a uniform layer of plasmonic gold nanoparticles on a porous TiO2 film, studying their photocatalytic properties for further scaling, and obtaining large area Au/TiO2/FTO photoelectrodes, including in the roll-to-roll process.

1. Introduction

Photoelectrochemistry is one of an important area of chemical science and uses the renewable resource of the sun to initiate a complex of chemical transformations required in industry and in everyday life. The main photoelectrochemical processes include the decomposition of water into molecular H2 and O2 [1,2,3], the reduction of CO2 to the simplest organic compounds (artificial photosynthesis) [4,5,6,7], and dye-sensitized solar cell cells [8,9].
A large number of photoactive semiconductor materials based on double or ternary oxides [10], sulfides [11], and phosphides [12] of transition metals exhibiting high activity in various photoelectrochemicals reactions have been studied and proposed. The mechanism of action of these photoactive semiconductor materials is as follows: by absorbing a photon in a photoactive semiconductor, an electron–hole pair (e and h+) is generated, which, when it diffuses to the surface, can participate in a cycle of redox reactions on anodes and cathodes.
A significant problem is the fact that wide-gap semiconductors (especially oxide semiconductors) have a low absorption coefficient in thin layers. This problem was solved by applying metal nanoparticles, such as Au, Ag, Cu, etc., to the semiconductor [13,14,15]. Metal nanoparticles have the effect of surface plasmon resonance, increasing the absorption coefficient of visible radiation by a semiconductor film increasing its photocatalytic and photoelectrochemical characteristics The material, morphology, and size of metal particles are key factors that determine the spectral region in which plasmon resonance will be observed [16] and, therefore, whether the absorption of visible radiation will increase. In the literature, the formation of a layer of metal nanoparticles using a physical and chemical approach is considered. As an example, we can cite the production of granular gold films by magnetron [17] and thermal [18] sputtering methods. The chemical approach to the deposition of gold nanoparticles is also diverse; standard methods of wet chemistry [19] and methods of photochemistry [20] have both been proposed. In our opinion, one of the most promising methods related to photochemistry is the method of laser-induced chemical liquid-phase deposition (LCLD) of metals from solution on the surface [21,22]. This method was used to form gold nanoparticles on the oxide-modified surface. This technique is based on the photochemical reduction of a metal on the surface of a dielectric under the influence of laser radiation. LCLD method makes it possible to form metal nanoparticles both in porous media [23] and on flat surfaces [24]. In this study, we propose a simple technique for applying a layer of plasmonic gold nanoparticles to the surface of a porous TiO2 film in order to increase its photoelectrochemical characteristics. Moreover, with the help of such photo-deposition it is possible to scale the process over large surface areas while maintaining the particle size distribution [24]. This will allow the formation of large area photoelectrodes with reproducible properties, which can become the basis for the formation of commercial artificial photosynthesis modules.

2. Materials and Methods

2.1. Materials

Titanium isopropoxide Ti(OCH(CH3)2)4 (TTIP), titanium acetylacetonate Ti(AcAc), isopropyl alcohol (C3H7OH), oleylamine (C18H37N), and PEG 4000, nitric acid (HNO3) were used as precursors for the synthesis of a porous TiO2 film. For the synthesis of plasmonic gold nanoparticles, we used tetrachloroaurate trihydrate (HAuCl4·3H2O) and deionized water. To prepare a Cu2S counter electrode and buffer solution for photoelectrochemical measurements, we used hydrochloric acid (HCl), sodium sulfide (Na2S), and sodium chloride (NaCl). All reagents used were classified as chemically pure. Commercial FTO transparent electrode on glass substrate ~10 Ω/sq was used as conductive substrate for the studied composite film.

2.2. Synthesis of TiO2 Porous Film on FTO/Glass Substrate

A suspension of titanium dioxide was synthesized by the hydrothermal method; at the first stage, titanium isopropoxide, isopropyl alcohol, oleylamine, deionized water, and nitric acid were mixed in a mass ratio of 1:4:2:200:0.5. At the second stage, the mixture was placed in a stainless-steel autoclave with a Teflon liner and kept at a temperature of 180° C for 15 h.
Next, a 20% solution of Ti(AcAc) in isopropyl alcohol, at 10% of the volume of the suspension, was added to the titanium dioxide suspension. To increase the viscosity, 0.5% PEG 4000 was added to the mixture.
After that, the mixture was applied to glass with an FTO layer using the Dr. Blade method. The liquid film was dry at 90 °C degrees to remove water without boiling for 30 min, after drying, the system was annealed for 1 h at 450 °C. After annealing, the TiO2/FTO/glass structure was washed with isopropyl alcohol.

2.3. LCLD Gold Nanoparticles on TiO2 Porous Film

For the synthesis of gold nanoparticles, a solution of chloroauric acid (HAuCl4·3H2O) in water was used as a working solution. A typical concentration value of 3 mM was used. In order to ensure a uniform coating of the sample surface with the precursor solution, the following technique was applied: 70 μL of solution was dropped onto the center of the sample, after which the drop and the sample were covered with a layer of glass with a thickness of 450 μm. Thus, the entire solution was evenly distributed under the coverslip. After applying the solution, the sample was placed on a motorized optical stage. This stage was able to move in the plane of the sample, so enabled us to irradiate all parts of the sample at the same time. The samples were irradiated using a MATRIX pulsed laser (Coherent Inc., Santa Clara, CA, USA) with a diode pump with a wavelength of 355 nm, operating in the single-mode regime, which allows the generation of radiation in a wide power range. The duration of the optical pulses was 25 ns, and the frequency was 8000 Hz. The laser radiation power on the sample was 0.3 Watts. Using focusing lenses, a radiation spot 1 cm in diameter was formed in the sample plane. The area inside this spot was irradiated with a uniform intensity. After positioning the sample and adjusting the laser, we opened the shutter for 2 min 20 s. During this time, gold nanoparticles were synthesized on the sample surface. Then, the sample was dried at room conditions.
The complete process of reduction of gold atoms under light irradiation and their nucleation into nanoparticles can be described using the following six reaction equations [22]:
( H A u 3 + C l 4 ) ( H A u 3 + C l 4 ) u n d e r h v
( H A u 2 + C l 4 ) ( H A u 2 + C l 3 C l )
( H A u 2 + C l 3 C l ) H A u 2 + C l 3 + C l
2 H A u 2 + C l 3 H A u 3 + C l 4 + H A u + C l 2
H A u + C l 2 A u 0 + H C l + C l u n d e r h v
n A u 0 ( A u 0 ) n

2.4. Scanning Electron Microscopy (SEM) and Transmission Electron Microscopy (TEM) Study

The morphology of the TiO2/FTO and Au/TiO2/FTO films was studied using the FE-SEM method on a S-5500 (Hitachi, Tokyo, Japan); the accelerated voltage was 3 kV. EDS analysis was carried out using a TM4000 Plus (Hitachi, Tokyo, Japan) equipped with a Bruker X-Flash 630Hc (Bruker, Billerica, MA, USA) detector, the accelerating voltage during mapping was 20 kV at maximum current (mode 4), the card accumulation time was 5 min.
The distribution of the elements and the morphology of the Au/TiO2 porous film composite were studied using a high-resolution TEM in the cross-section mode. The lamellas were prepared using dual beam SEM FEI Scios (FEI Company, Hillsboro, OR, USA). The electron microscopy TEM (measurements, analysis) and EDS experiments were carried out using a high-resolution transmission electron microscope FEI Tecnai Osiris (FEI Company, USA, Oregon, Hillsboro) with field emission gun operating on at 200 kV and Bruker SuperX EDS detector (Bruker, Billerica, MA, USA) in TEM, HRTEM, STEM, and EDS modes.

2.5. XRD Analysis

The powder diffraction data of all of the samples for Rietveld analysis were collected at room temperature with a Bruker D8 ADVANCE powder diffractometer (Curadiation) and linear VANTEC detector (Bruker, Billerica, MA, USA). The step size of was 0.016°, and the counting time was 0.5 s per step. Rietveld refinement of all structures was performed using a TOPAS 4.2 (Bruker AXS TOPAS V4: General profile and structure analysis software for powder diffraction data—User’s Manual. Bruker AXS, Karlsruhe, Germany, 2008).

2.6. Optical Properties’ Measurements

The optical density spectra for the TiO2/FTO and Au/TiO2/FTO photoelectrode samples were measured in the range of 400–700 nm on a UV 3600 spectrophotometer (Shimadzu, Kyoto, Japan). The measurements were carried out using an aperture 10 mm in diameter and a resolution of 1 nm.

2.7. Photoelectrochemical Measurements

The photoelectrochemical properties of the samples were studied in a two-electrode cell. The provided photoelectrodes were used as working electrodes. Cu2S deposited on the brass served as a counter electrode. The counter electrode was obtained by treating the brass for an hour with concentrated hydrochloric acid at 70 °C, rinsing with distilled water, and immersing it in a 1 M aqueous solution of sodium sulfide for fifteen minutes [25]. The electrolyte used was a solution consisting of 1 M S (hereinafter referred to as 1 M Na2Sn), 1 M Na2S, and 0.1 M NaCl [26]. The electrodes were compressed to optimize contact. Photovoltaic characteristics were measured using a P-45X potentiostat–galvanostat with an FRA-24M electrochemical impedance measurement module (Electrochemical Instruments, Chernogolovka, Russia) in a voltage range from −0.8 to +0.8 V. The potential sweep rate was 0.02 V/s. The time dependences of the changes in the photocurrent density were recorded at a potential equal to 0 V. The measurements taken using impedance spectroscopy were carried out in the frequency range of 0.8–105 Hz, with an amplitude of 10 mV at a constant value of the potential equal to 0.2 V. The Mott–Schottky dependences were studied in the voltage range from −0.6 V to 0.7 V, with an amplitude of 10 mV at a constant frequency of 1000 Hz. All potentials are given in comparison with those measured using a normal hydrogen electrode. In all experiments, a 450-LED light-emitting diode with a wavelength of 450 nm and radiation power of 19.2 mW/cm2 was used as an illumination source. The area of the illuminated surface in the cell was 1 cm2.

3. Results and Discussion

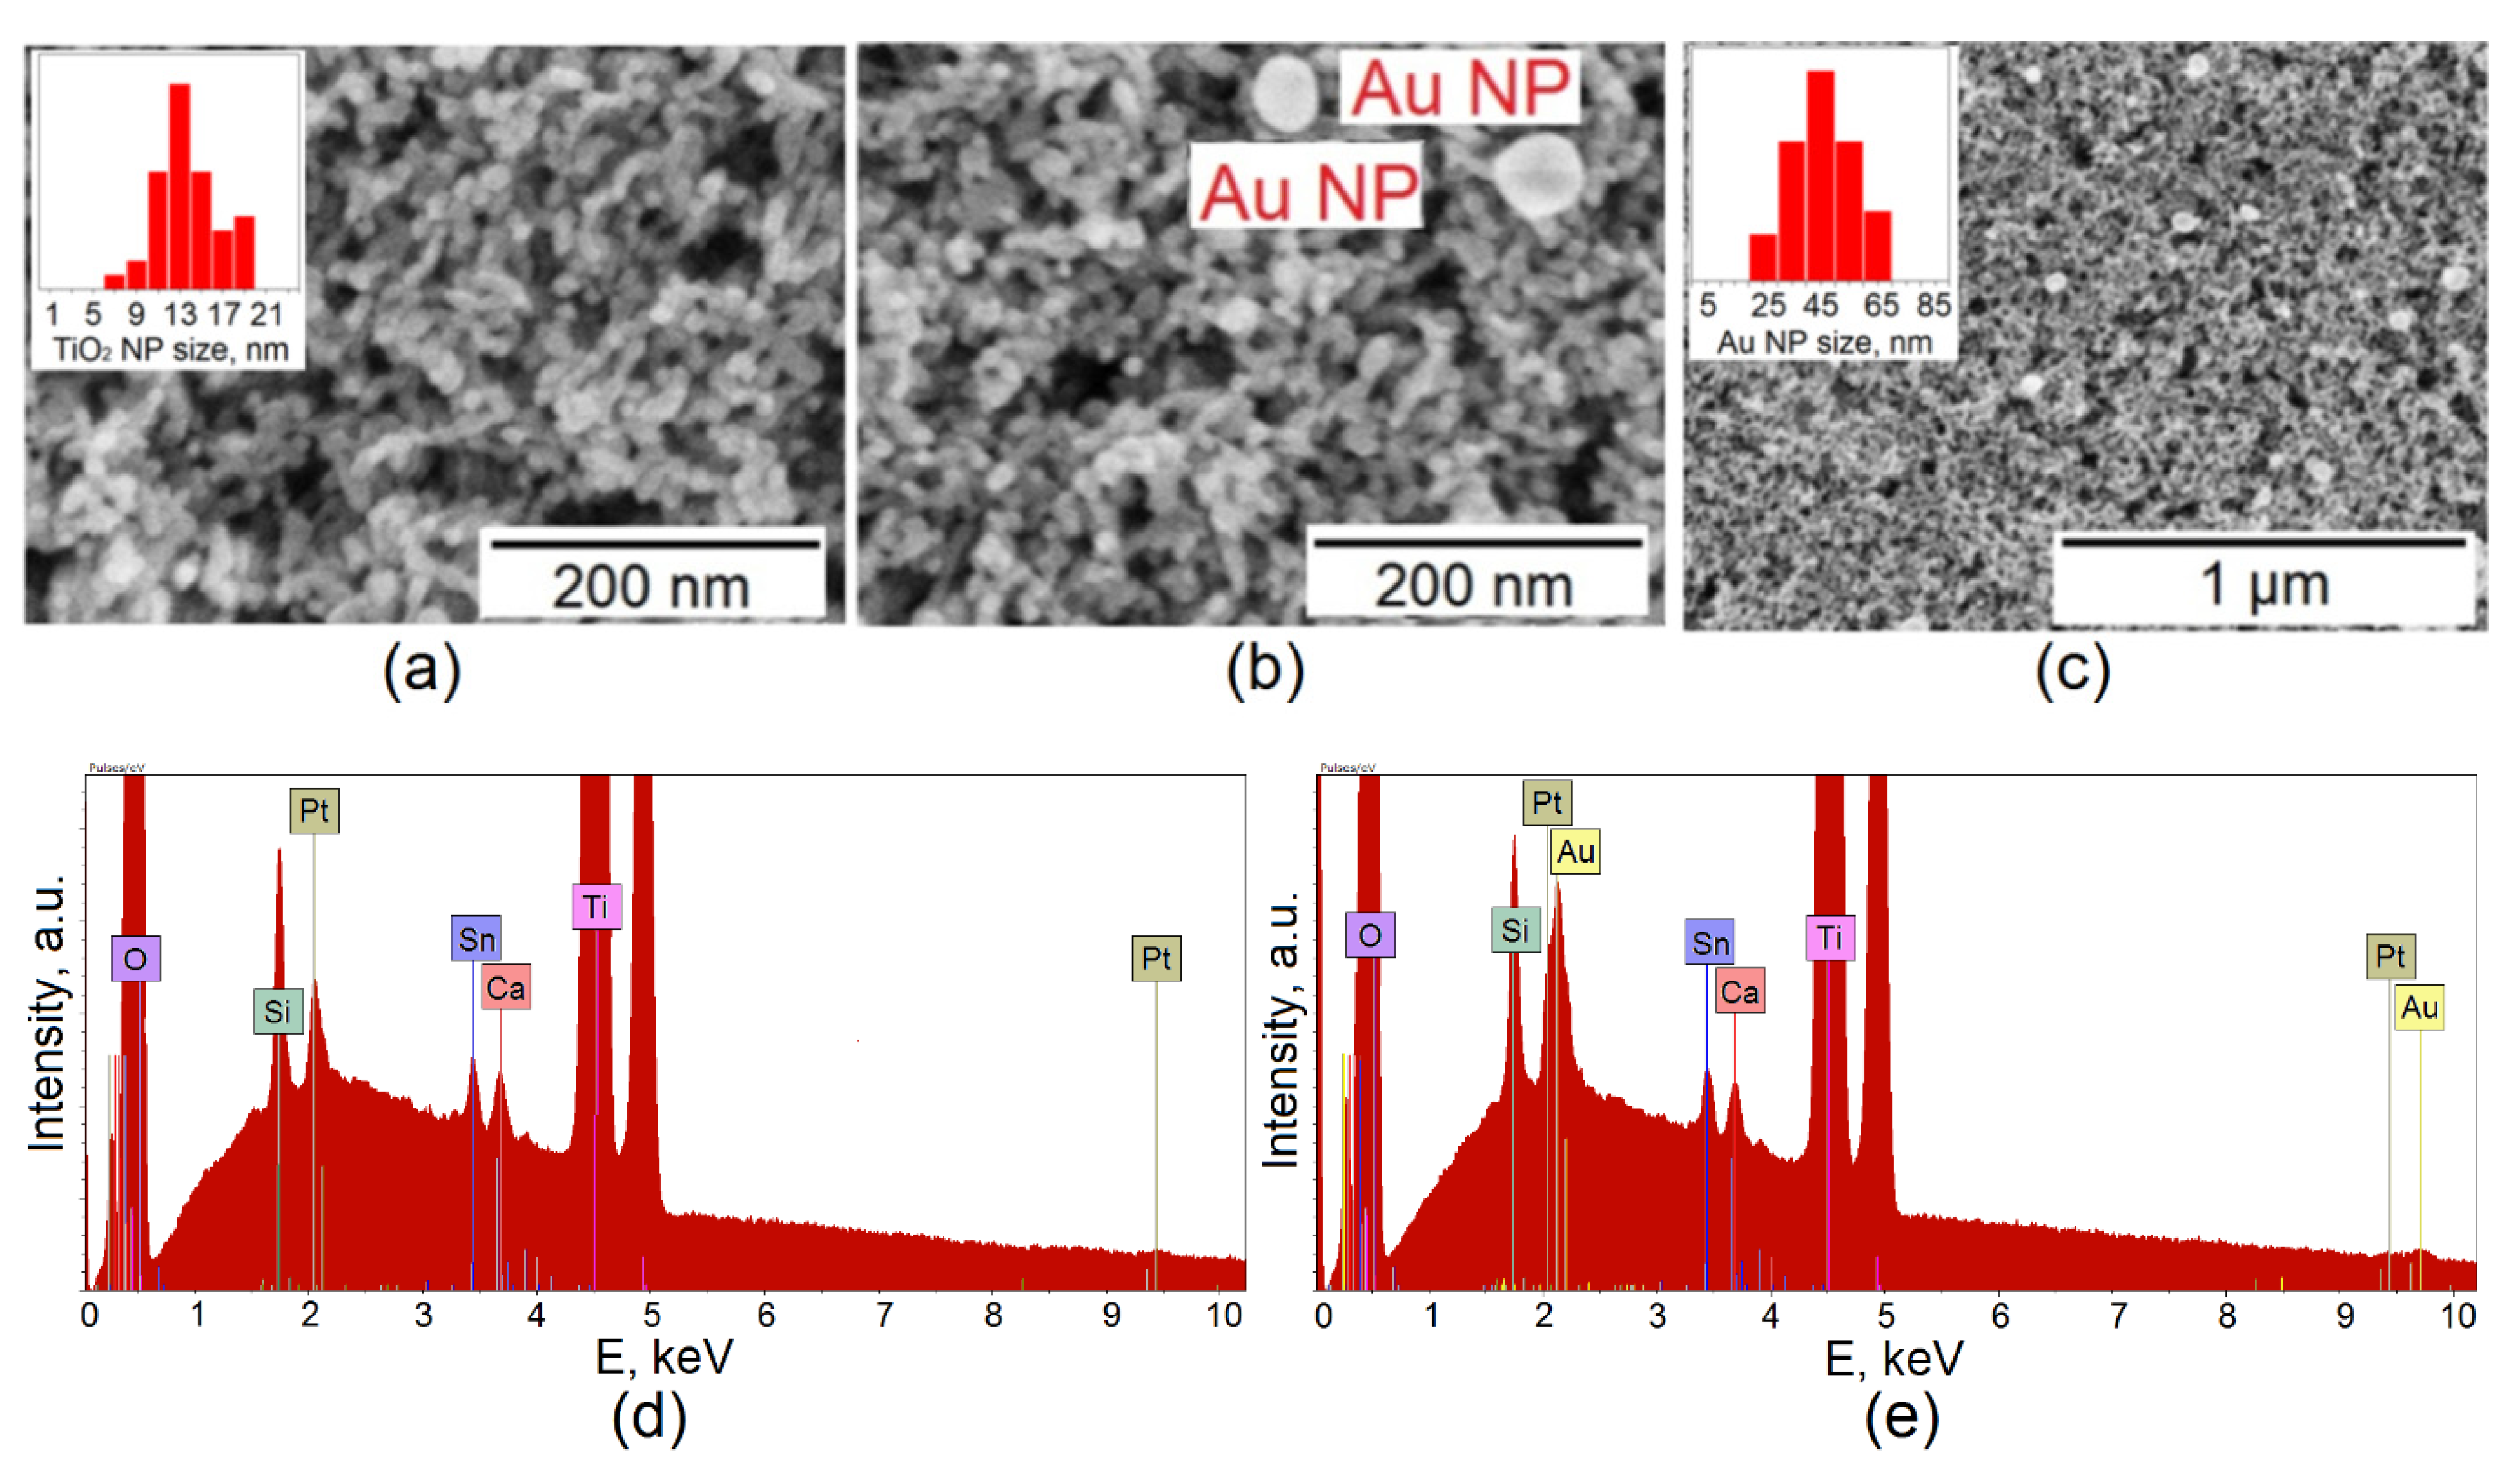
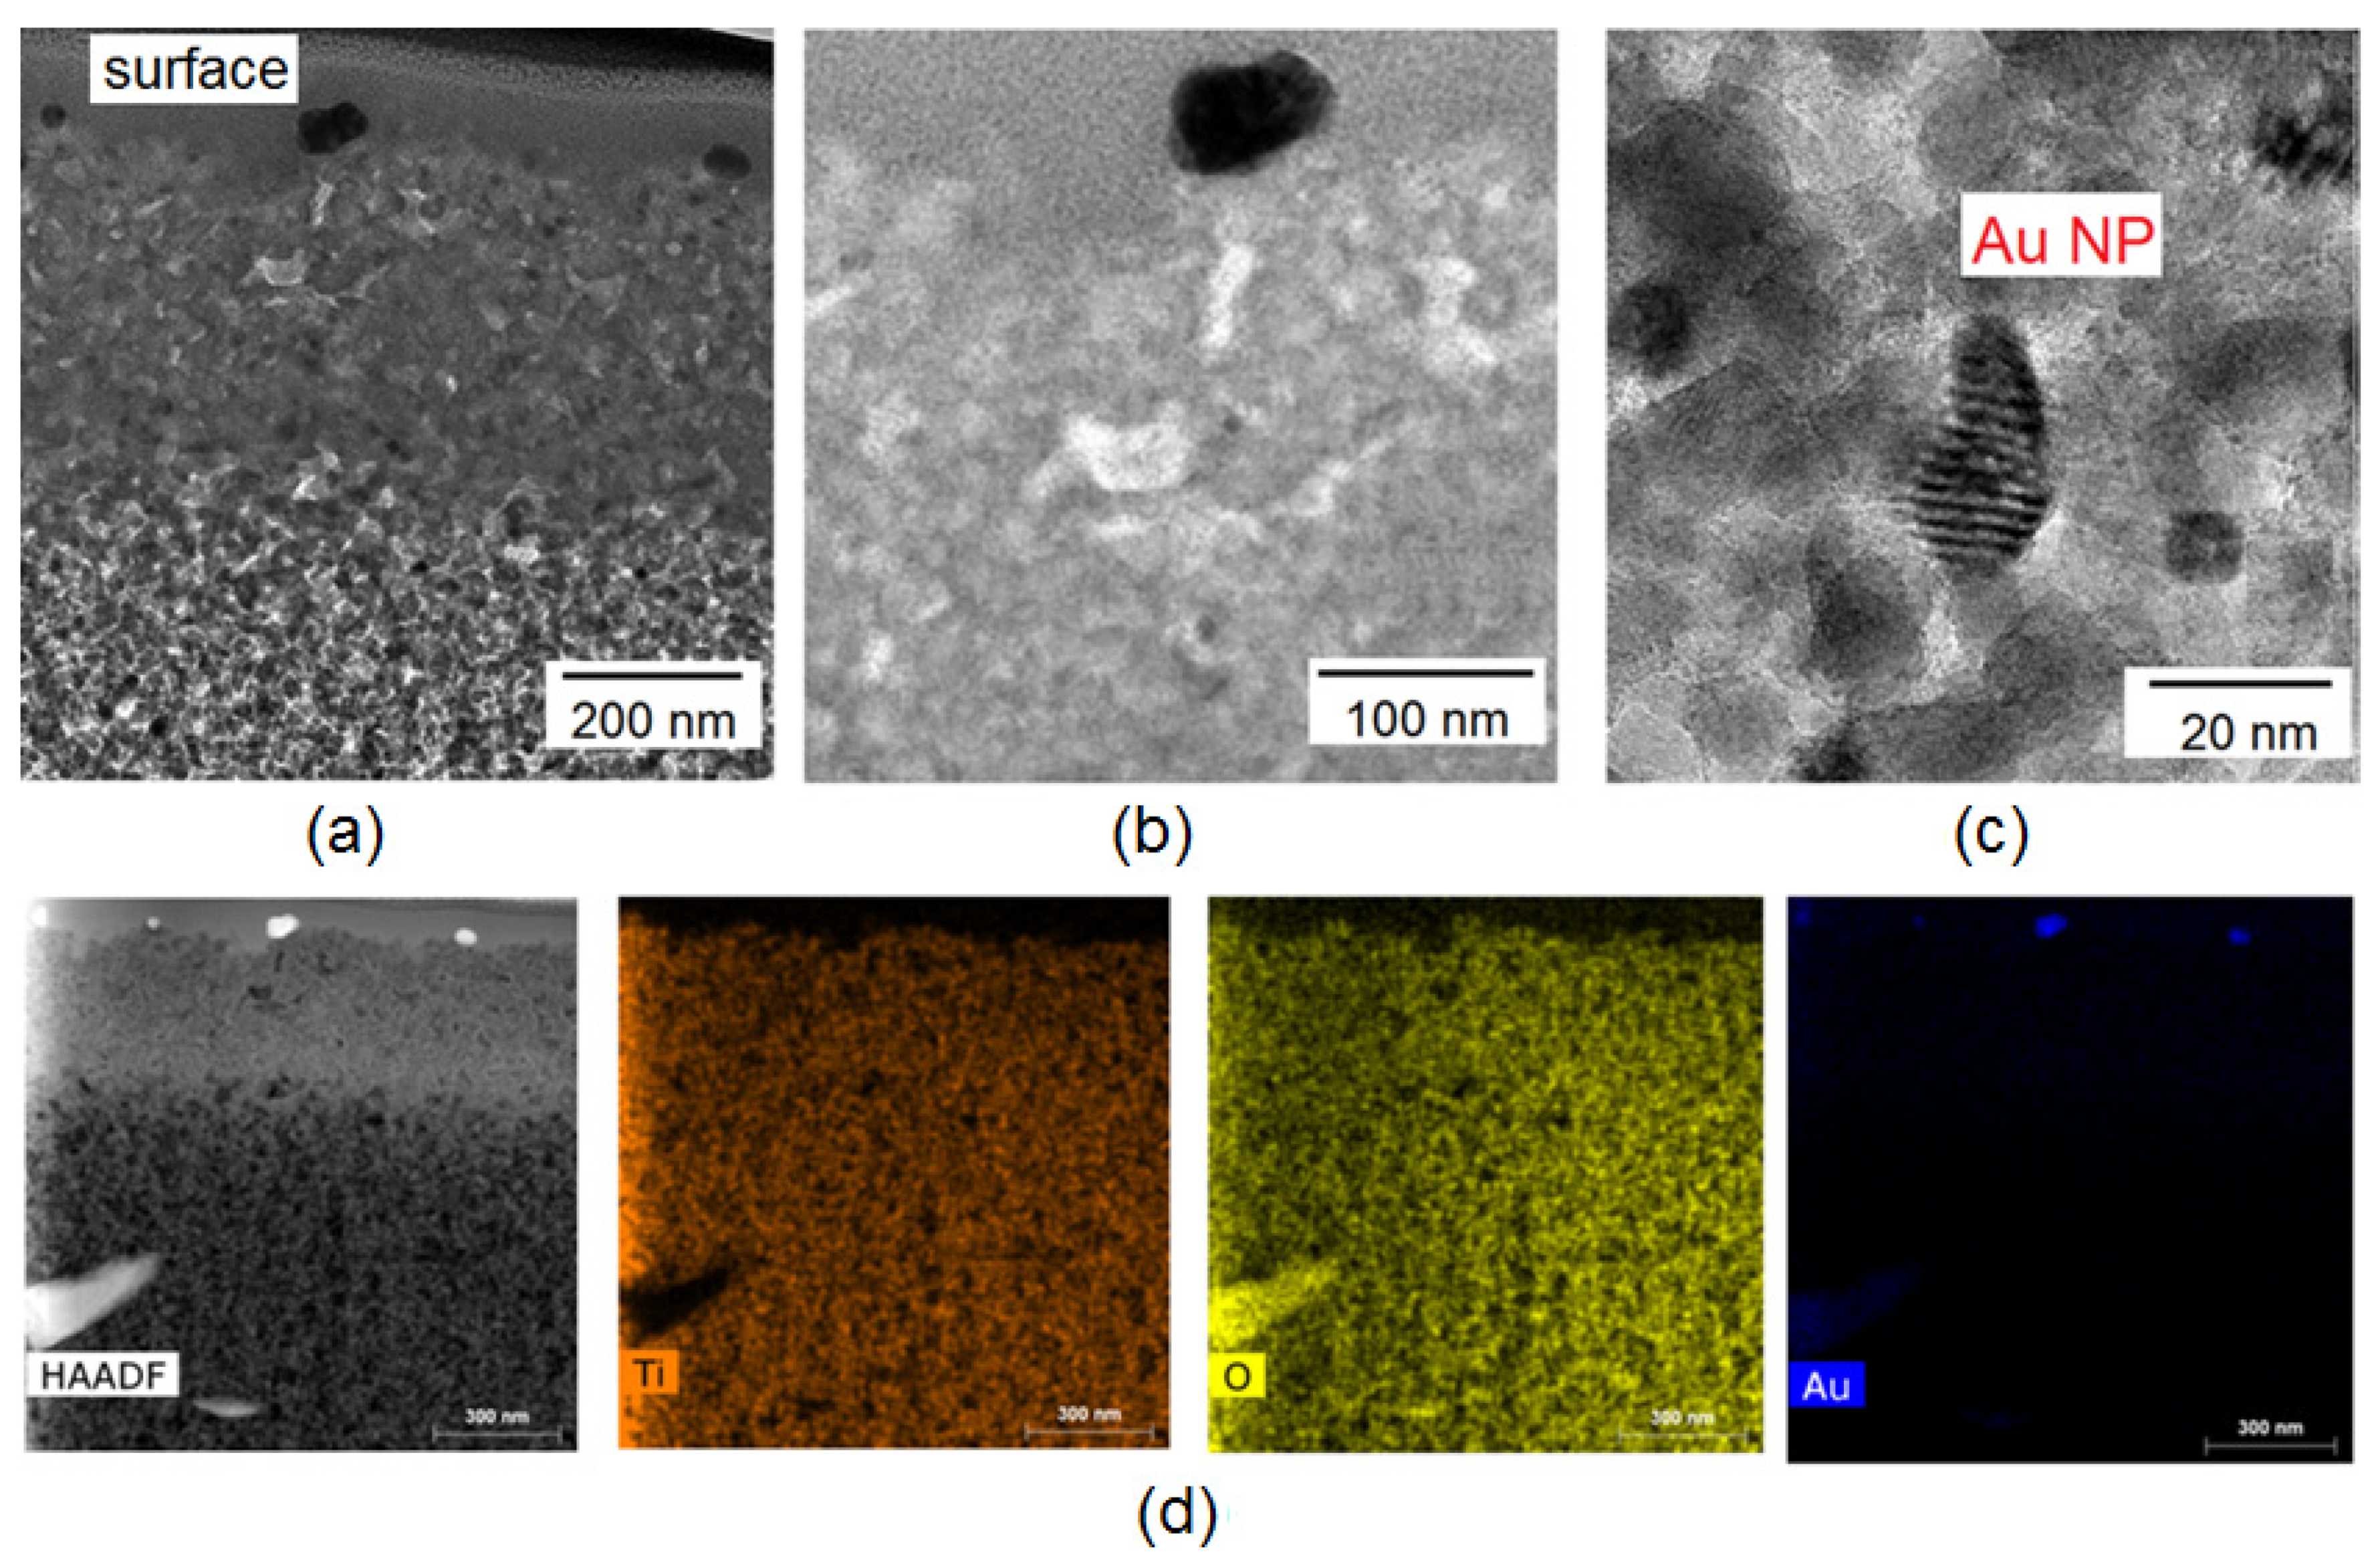
3.1. SEM and TEM Study TiO2/FTO and Au/TiO2/FTO Films

The study of the surface of composite porous TiO2 layers using the SEM method before and after gold deposition by the LCLD method provides complete information on the morphology of the porous TiO2 film, as well as the morphology, geometric dimensions, and specific density of gold nanoparticles. Figure 1 shows typical SEM images of surface a porous TiO2 film (Figure 1a) and a composite Au/TiO2 film (Figure 1b).
According to SEM data, the porous TiO2 film consists of nanoparticles with an average diameter of 13.5 nm (Figure 1a histogram in the inset), the morphology of the particles is close to spherical, but ellipsoidal particles can also be found.
The average diameter of gold nanoparticles is 45.7 nm (Figure 1c histogram in the inset). The areal density of gold nanoparticles is 1–3 nanoparticles per µm2 (Figure 1c). The LCLD method makes it possible to obtain particles with different morphologies (triangle, rod, star-like, etc.) [23].
It can be seen in the EDS analysis of TiO2/FTO/glass (Figure 1d) that the spectrum contains lines characteristic of the carrier glass substrate—these are the peaks for Si (Kα1~1.740 keV) and Ca (Kα1~3.692 keV). The Sn peaks (Lα1~3.444 keV and Lβ1~3.663 keV) belong to the transparent conductive FTO film. The highest intensity peaks are observed for Ti (Kα1~4.512 keV and Kβ1~4.933 keV) and oxygen O (Kα1~0.525 keV). It should be noted that oxygen is present in all layers.
After the LCLD process, the EDS spectrum shows (Figure 1e) the same set of peaks, except that the 2–2.5 keV region in which the Au peak appeared changed (Mα1~2.123 keV); however, the region overlaps with the Pt peak (Mα~2.050 keV). Reliable evidence for the presence of Au on the photoelectrode is a low-intensity peak with an energy of 9.713 keV corresponding to the Lα1 series of gold (Figure 1e).
TEM studies in cross-section mode provide a complete picture of the thickness morphology of the Au/TiO2 composite and the distribution of elements over the cross section. Figure 2a–c show TEM images of Au/TiO2 film.
According to TEM images, gold nanoparticles are present only on the surface, directly at the interface of the porous TiO2 film and air (Figure 2a).
EDS analysis provides an idea of the distribution of elements by thickness (Figure 2d). It can be seen that the elements Ti and O are uniformly distributed over the cross section of the composite, while Au is concentrated at the interface.

3.2. XRD Study TiO2/FTO and Au/TiO2/FTO Films

TiO2 has three polymorphic modifications: low-temperature phases anatase (tetragonal system, space group I41/amd) and brookite (orthorhombic system, space group Pbca), which irreversibly transform on heating into the high-temperature modification of rutile (tetragonal system, space group P42/mnm) [27,28]. From the point of view of photocatalysis and photoelectrochemical application, the anatase phase is interesting. It is more active than rutile due to the rapid transfer of excitons from the bulk to the surface [29]. Figure 3 shows XRD pattern for TiO2/FTO (Figure 3a) and Au/TiO2/FTO.
From the analysis of XRD patterns, it was found that the porous TiO2 film belongs to the tetragonal system with the unit cell parameters a = 3.7797(13) Å, and c = 9.500(4) Å and the volume V = 135.71(11) Å3 belonging to the space group of symmetry I41/amd (Figure 3a). The set of hkl indexes and d-space for TiO2 are shown in Table S1. The LCLD process does not affect the structural properties of the porous TiO2 film (Figure 3b). After the LCLD process, the unit cell parameters of the porous TiO2 film are a = 3.7780(2) Å, and c = 9.504(6) Å and the unit cell volume is V = 135.80(17) Å3. The XRD pattern also has Au peaks, the weak intensity of the peaks is due to the small amount of gold, which is confirmed by the data of SEM (Figure 1) and TEM (Figure 2). According to XRD analysis, gold has a cubic crystal lattice, the unit cell parameter is a = 4.087(3) Å, and the unit cell volume is V = 68.29(15) Å3. The crystal lattice of gold belongs to the group of spatial symmetry Fm-3m. The set of hkl indexes and d-space for Au are shown in Table S2.
In addition to TiO2 and Au, the XRD patterns show peaks associated with the transparent electrode FTO (SnO2:F) (Figure 3a,b). The hkl indexes and d-space for SnO2 is shown in Table S3.
Since, according to SEM data (Figure 1), the particle sizes of TiO2 and Au are less than 1000 nm, it is possible to make an approximate estimate of the average particle size, using the total profile fitting during the Rietveld refinement in Topas 4.2, taking into account instrumental FWHM peak broadening, which was measured from standard sample SiO2. According to the calculation, the average diameter of TiO2 particles before the LCLD process is 13.7(2) nm; after the LCLD process, the average diameter of TiO2 particles is 12.9(2) nm. The average size of a gold nanoparticle is 19.2(11) nm.

3.3. Optical Properties of TiO2/FTO and Au/TiO2/FTO Films

Spectral absorption is a key characteristic of any photoactive material. It is the absorption spectrum that provides information on which wavelengths the material most actively interacts with. Figure 4 shows the optical density spectra of photoelectrodes before and after the LCLD process.
The maximum optical density for TiO2/FTO is 0.387 at a wavelength of 400 nm; therefore, the transmittance is 0.41. The reason for the increase in optical density with decreasing radiation wavelength is Rayleigh scattering.
The application of gold nanoparticles leads to an increase in the overall level of optical density, and plasmon resonance is also observed at a wavelength of 531 nm. According to the spectrum, at the resonance frequency, the optical density becomes 0.445, and the transmittance is 0.358. The maximum optical density is observed at a wavelength of 400 nm and is 0.592; the transmittance is 0.255. The value of the resonance wavelength obtained in this work agrees with the calculations completed using the FTDT method [30] of gold nanoparticles on a TiO2 substrate. Accordingly, our results have a high level of agreement with the theoretical results for gold particles with a diameter of 50 nm in point contact with a TiO2 substrate, whose resonance wavelength is 530 nm.

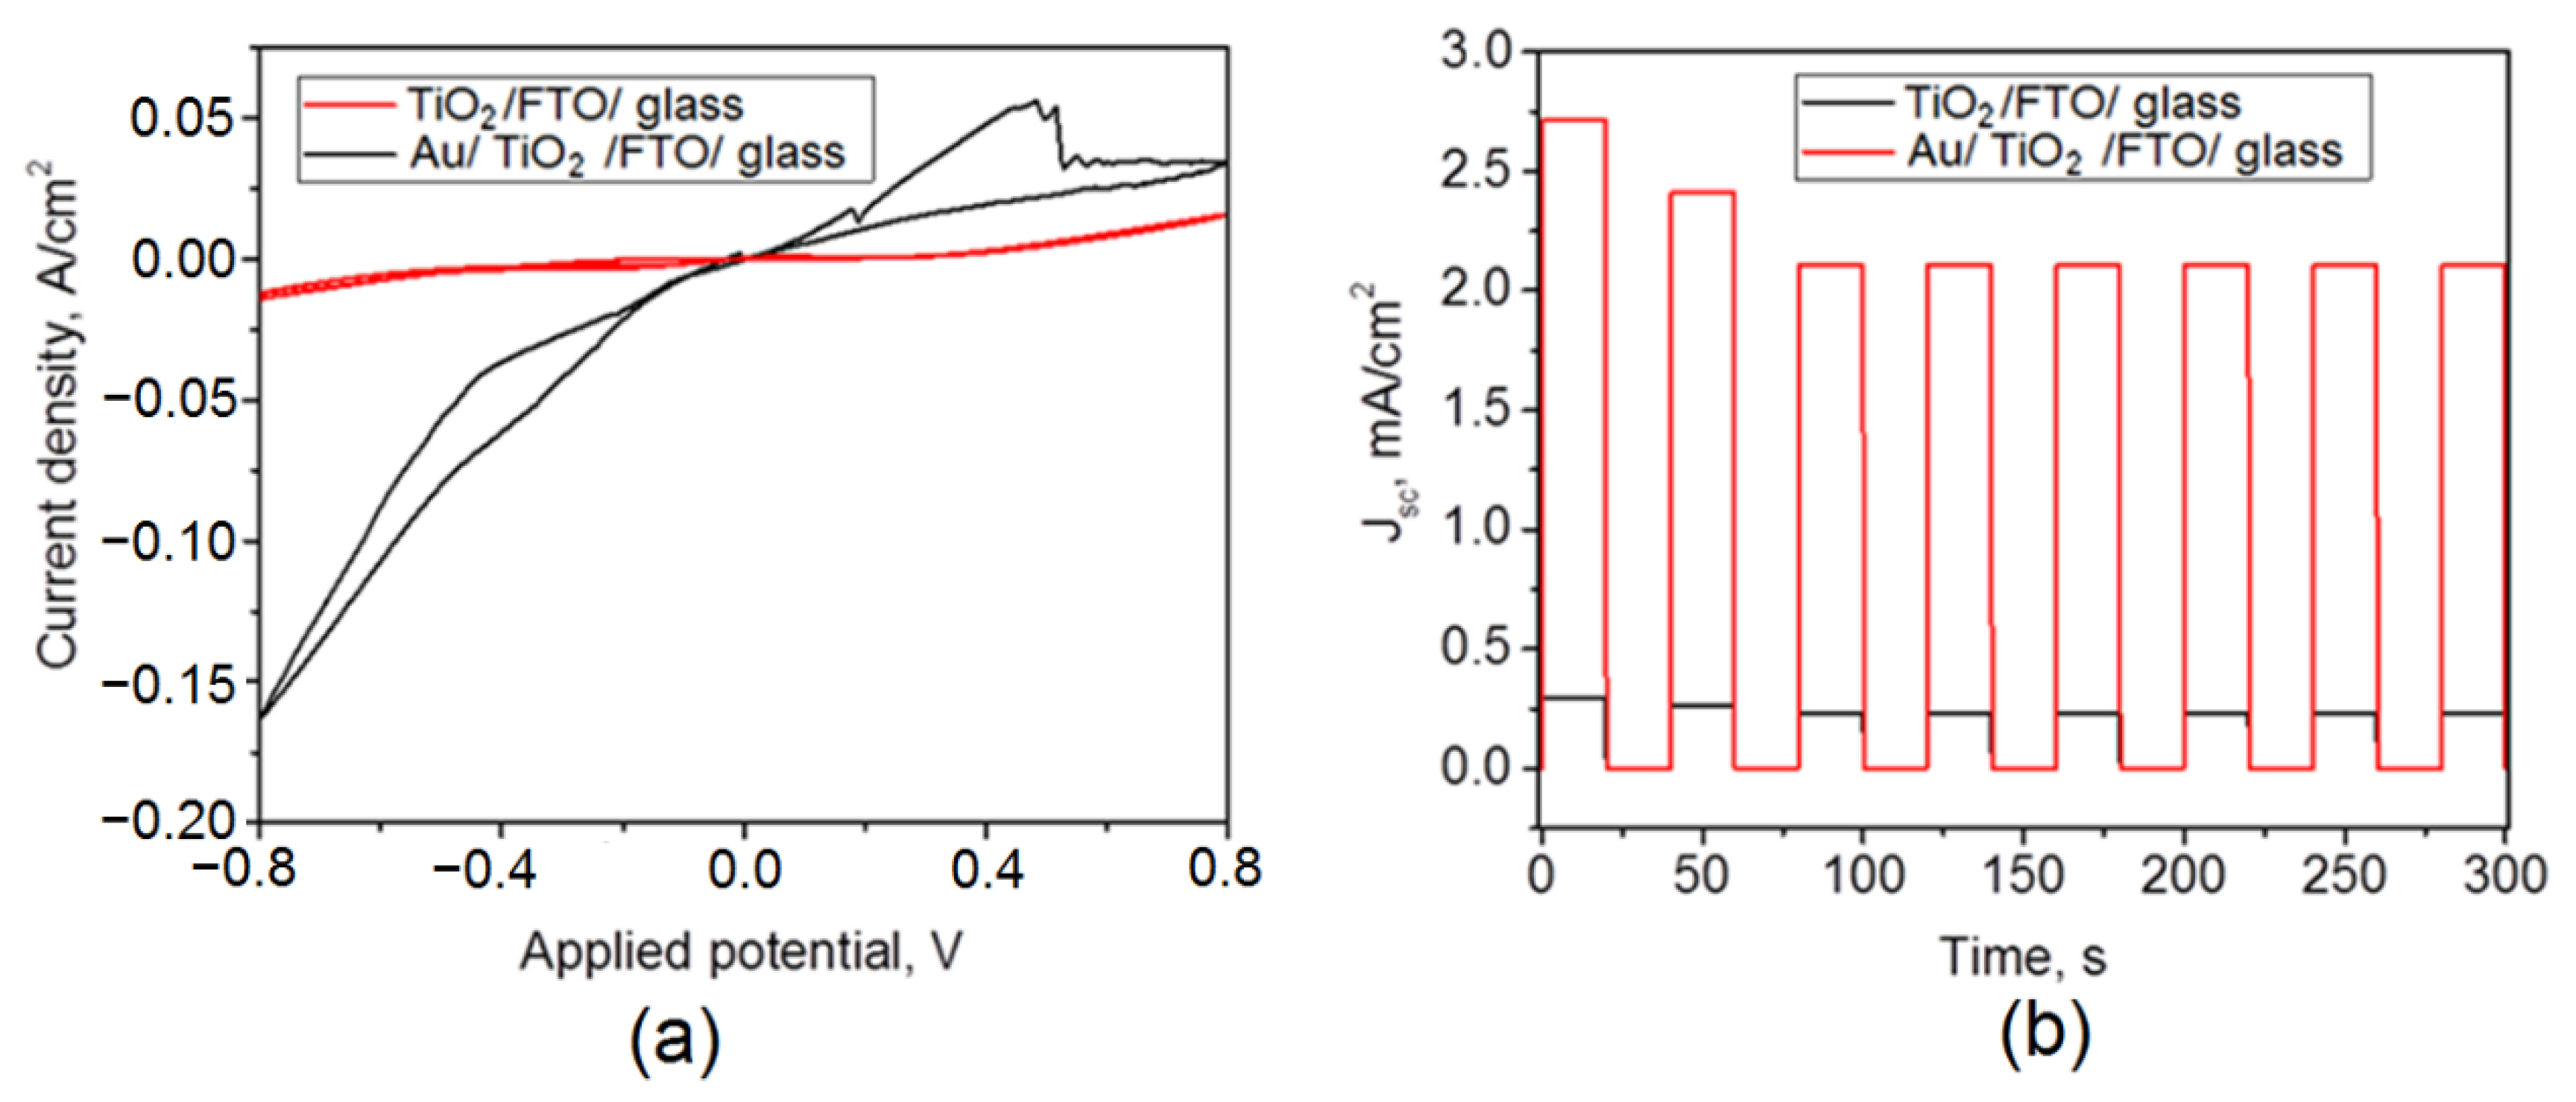
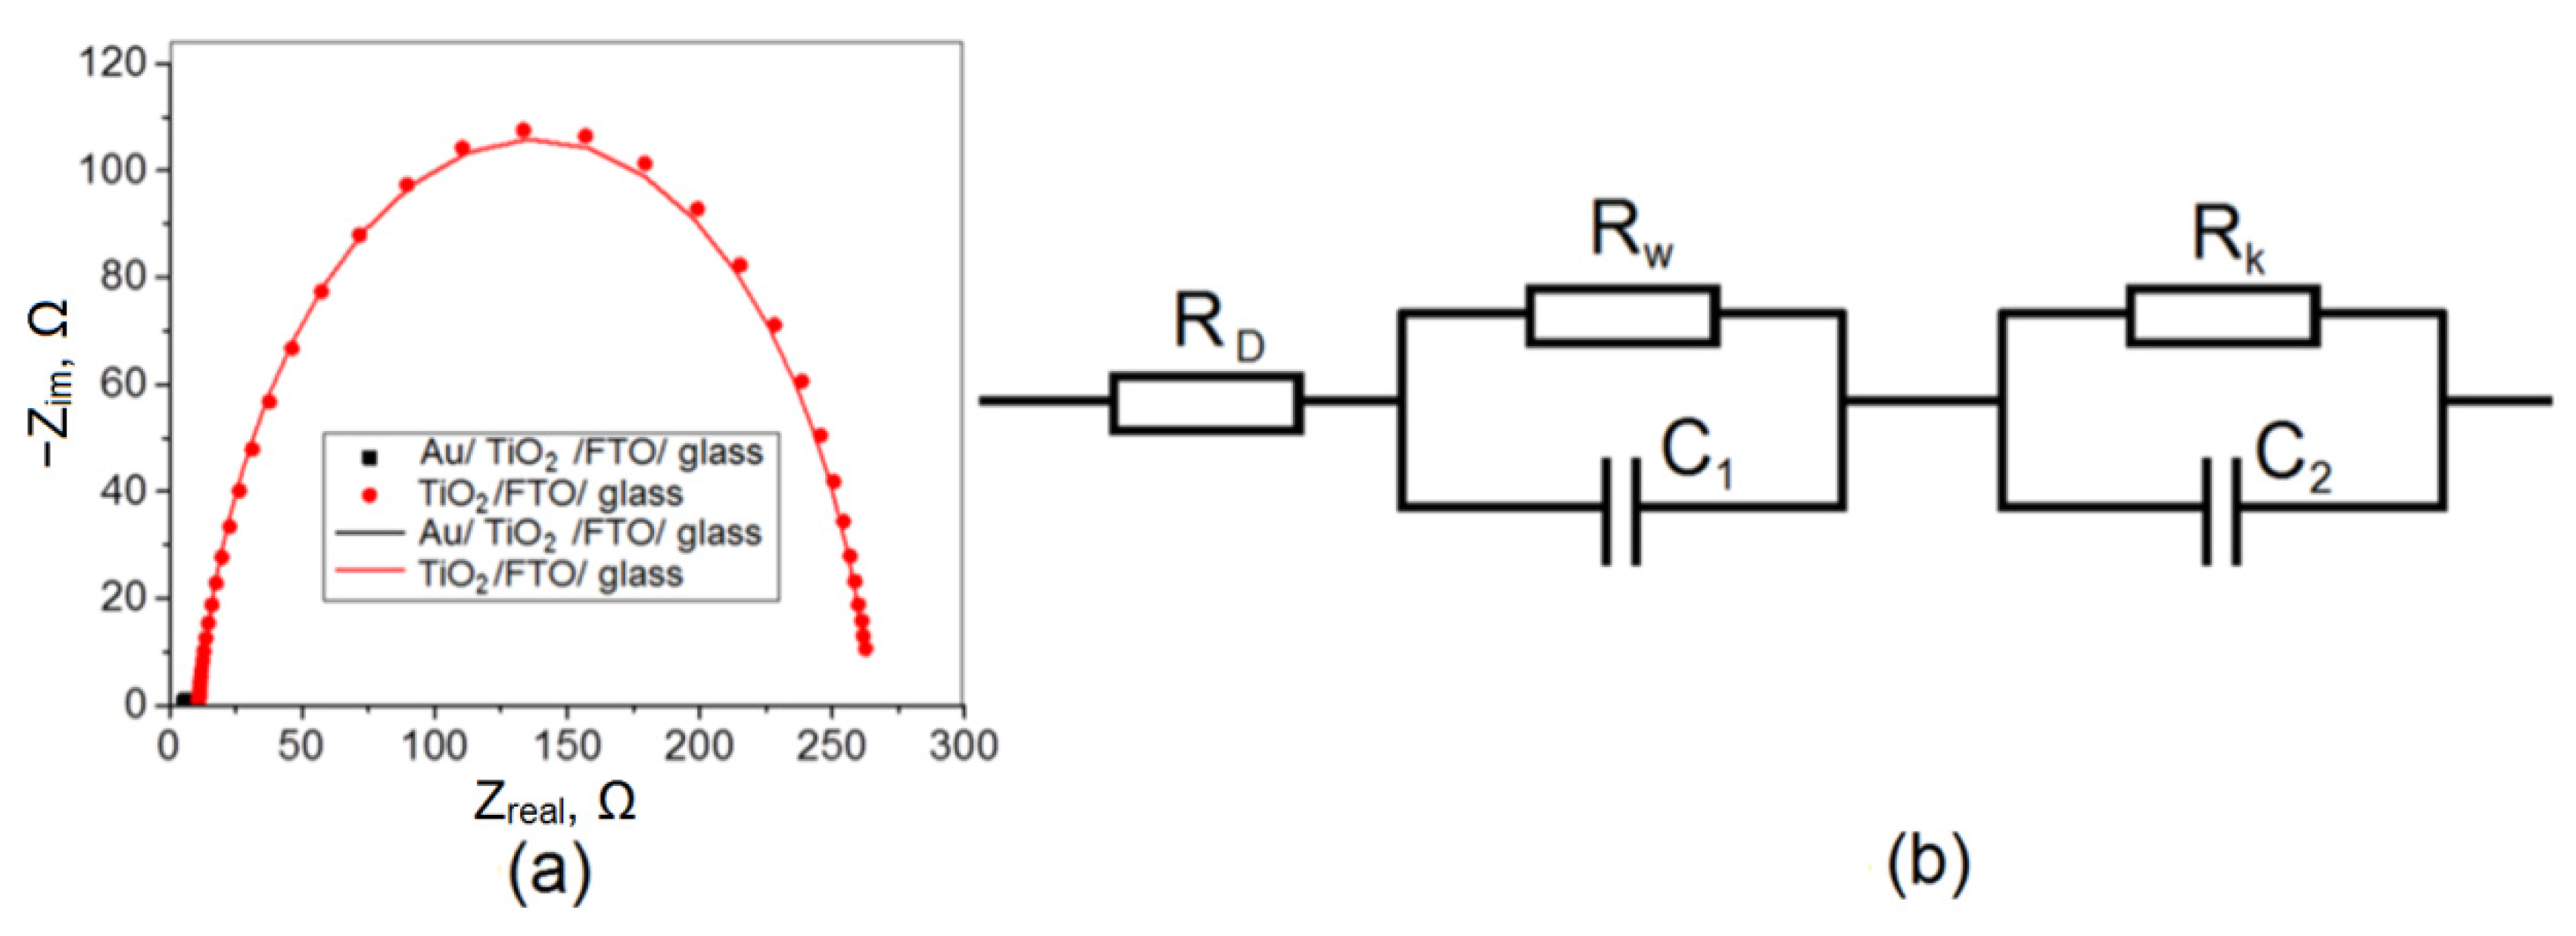
3.4. Photoelectrochemical Properties of TiO2/FTO and Au/TiO2/FTO Photoelectrodes

Figure 5a shows voltammograms of the samples under study. The titanium dioxide electrode is electrochemically stable over the entire potential range. The deposition of gold promotes an increase in the current density; however, peaks of electrochemical transformations of unknown origin at 0.4 V appear on the voltammogram. The probable explanation of the observed phenomenon may be supported by the electrochemical gold oxidation in basic solutions to the corresponding oxide. This effect was mentioned for bare gold in solutions of sodium hydroxide [31] or sodium hydrocarbonate [32]. This peak would have been saved if gold particles were deposited on the substrate, for example, on nickel hydroxide [31]. Perhaps, in solutions of sodium sulfide, gold oxidation by hydroxide ions may also be occurred. The ox–red potential of gold oxidation is known to be ca. 0.5 V; however, this position may be changed depending on hydroxide concentration and/or sweep rates.
Figure 5b shows on–off curves for the studied photoelectrodes. It can be seen that in the first three cycles of switching the lighting on and off, a slight decrease in the short-circuit current density occurs, and, over the next six cycles, this value does not change. Thus, the obtained materials are distinguished by high stability of electrodes in time, which is important when considering aspects of the practical application of the obtained photoelectrodes.
In a stable mode of operation, a porous TiO2 film is characterized by a photocurrent density of about 0.2 mA/cm2. The deposition of plasmonic gold nanoparticles by the LCLD method has a significant effect on the photocurrent density, increasing it approximately 10-fold. As shown in Table 1, gold deposition can improve other photovoltaic characteristics, for example, open circuit potential, which increased from 13 mV to 27 mV. The maximum value of the open circuit potential is logarithmically related to the short circuit current density [33]. An increase in Jsc by 9.2 times leads to an increase in Voc by a factor of 2.2, in accordance with the logarithmic dependence. The filling factor for both electrodes is the same and amounts to 28%. The efficiency of converting the energy of light radiation into electricity η increases when gold is deposited on the surface of titanium dioxide. It is likely that the deposition of gold makes it possible to improve the separation of charge carriers in space, which favors the photocatalytic and photovoltaic properties of the samples under study.
For a more detailed consideration of the effect arising from the deposition of gold on titanium dioxide, studies were carried out using impedance spectroscopy. The obtained data in Nyquist coordinates are shown in Figure 6. It can be seen that the TiO2/FTO hodograph radius significantly decreases when the sample surface is modified with gold. Thus, the resistance in the system is significantly reduced, which may be associated with an increase in the photovoltaic characteristics Jsc and η.
The obtained hodographs can be approximated by an equivalent electrical circuit [34] shown in Figure 6b, the approximation parameters are given in Table 2. The circuit consists of a series resistance RD, which includes the resistances of conductive glass and electrolyte Rw, which is associated with the transfer of charge carriers from the photoelectrode surface to the electrolyte solution, and RK, which is responsible for the processes that occur on the counter electrode and at the interface between the phases, the counter electrode/electrolyte. The capacitors C1 and C2 in the diagram denote electric double layers arising at the interface between the phases of the working electrode/electrolyte and the counter electrode/electrolyte, respectively.
The RD parameter shows the resistance in the electrochemical circuit associated with the resistance of the solution itself, the connection of electrodes to an external circuit, etc. As a rule, this value is no more than 10 Ω and depends only slightly on the nature of the photoelectrode. The Rk parameter, which reflects the processes occurring on the counter electrode, sharply decreases when gold is deposited on titanium dioxide. In the case of the RW parameter, which reflects the processes occurring at the working electrode, it is difficult to establish certain patterns. In the general case, changes in resistance are associated with the features of the microstructure of the samples, the formation of an electric double layer, and the transfer of charges across the phase interface.
Additionally, the lifetimes of charge carriers were calculated from the impedance data and are shown in Table 2. The lifetime of electrons for a sample containing gold is almost an order of magnitude higher than that for titanium dioxide. Note that an increase in the short-circuit current density also occurs 10 times. The deposition of gold on the surface of titanium dioxide leads to an improvement in the separation of electron–hole pairs, which is quantitatively reflected in the same changes in the electron lifetime and short circuit current density.
According to modern concepts, plasmonic nanoparticles can affect the photoelectrochemical properties in three ways: plasmon-induced resonant energy transfer, scattering, and hot electron injection (direct or indirect mechanism) [35]. The most probable mechanisms are a combination of scattering and injection of hot carriers into the semiconductor TiO2 layer. This assumption follows from Table 2, where it is shown that the addition of plasmonic gold nanoparticles leads to an increase in the concentration of charge carriers from 2.0 × 10¹⁷ to 2.5 × 1018 cm−3.

4. Conclusions

The LCLD method was used to form a layer of plasmonic gold nanoparticles on the surface of a porous TiO2 film. This method is productive and promising for the formation of large-area photocatalytic panels. A comprehensive physicochemical analysis of the morphology and structure of photoelectrodes of two types TiO2/FTO and Au/TiO2/FTO has been carried out. According to the data of photoelectrochemical measurements and data of impedance spectroscopy, the deposition of a layer of plasmonic gold nanoparticles increases the photocurrent density from 0.295 mA/cm2 to 2.711 mA/cm2. The efficiency of the process increases from 0.019% to 0.374% at a wavelength of 450 nm. The significant effect of plasmonic gold nanoparticles on the complex of photochemical transformations is an important factor in the optimization of photocatalytic modules. The LSLD method appears to be a promising solution for the formation of a uniform layer of plasmonic gold particles, including the roll-to-roll process.

Supplementary Materials

The following are available online at https://www.mdpi.com/article/10.3390/app12010030/s1: Table S1: The coordinates, d-space and hkl-indexes of TiO2 phase; Table S2: The coordinates, d-space and hkl-indexes of Au phase; Table S3: The coordinates, d-space and hkl-indexes of SnO2 (FTO) phase.

Author Contributions

Conceptualization: A.S.V. and S.V.K.; experiment and data analysis: A.S.V., I.V.N., M.S.M., D.V.M. and E.A.K.; synthesis: D.V.L. and D.S.L.; writing–original draft preparation: A.S.V., E.A.K. and D.V.L.; writing–review and editing: A.S.V., M.M.S., E.A.K. and D.V.L.; project administration: S.V.K. All authors have read and agreed to the published version of the manuscript.

Funding

This research received no external funding.

Institutional Review Board Statement

Not applicable.

Informed Consent Statement

Not applicable.

Data Availability Statement

Not applicable.

Acknowledgments

The SEM: XRD and optical properties measurements of materials were carried out on the equipment of Krasnoyarsk Regional Center of Research Equipment of Federal Research Center «Krasnoyarsk Science Center SB RAS». The TEM was performed using the equipment of the Shared Research Center FSRC “Crystallography and Photonics” RAS.

Conflicts of Interest

The authors declare no conflict of interest.

References

  1. Hamdani, I.R.; Bhaskarwar, A.N. Recent progress in material selection and device designs for photoelectrochemical water-splitting. Renew. Sustain. Energy Rev. 2021, 138, 110503. [Google Scholar] [CrossRef]
  2. Ahmed, M.; Dincer, I. A review on photoelectrochemical hydrogen production systems: Challenges and future directions. Int. J. Hydrogen Energy 2019, 44, 2474–2507. [Google Scholar] [CrossRef]
  3. Chiu, Y.-H.; Lai, T.-H.; Kuo, M.-Y.; Hsieh, P.-Y.; Hsu, Y.-J. Photoelectrochemical cells for solar hydrogen production: Challenges and opportunities featured. APL Mater. 2019, 7, 080901. [Google Scholar] [CrossRef] [Green Version]
  4. Ding, P.; Jiang, T.; Han, N.; Li, Y. Photocathode engineering for efficient photoelectrochemical CO2 reduction. Mater. Today Nano 2020, 10, 100077. [Google Scholar] [CrossRef]
  5. Kumaravel, V.; Bartlett, J.; Pillai, S.C. Photoelectrochemical Conversion of Carbon Dioxide (CO2) into Fuels and Value-Added Products. ACS Energy Lett. 2020, 5, 486–519. [Google Scholar] [CrossRef] [Green Version]
  6. Kumar, B.; Llorente, M.; Froehlich, J.; Dang, T.; Sathrum, A.; Kubiak, C.P. Photochemical and Photoelectrochemical Reduction of CO2. Annu. Rev. Phys. Chem. 2012, 63, 541–569. [Google Scholar] [CrossRef] [Green Version]
  7. Kim, C.; Choi, S.; Choi, M.-J.; Lee, S.A.; Ahn, S.H.; Kim, S.Y.; Jang, H.W. Photoelectrochemical Reduction of CO2 to Syngas by Reduced Ag Catalysts on Si Photocathodes. Appl. Sci. 2020, 10, 3487. [Google Scholar] [CrossRef]
  8. Grätzel, M. Dye-sensitized solar cells. J. Photochem. Photobiol. C Photochem. Rev. 2003, 4, 145–153. [Google Scholar] [CrossRef]
  9. Sharma, K.; Sharma, V.; Sharma, S.S. Dye-Sensitized Solar Cells: Fundamentals and Current Status. Nanoscale Res. Lett. 2018, 13, 381. [Google Scholar] [CrossRef]
  10. Abdi, F.F.; Berglund, S.P.; van de Krol, R. Multinary Metal Oxide Photoelectrodes. In Photoelectrochemical Solar Fuel Production; Giménez, S., Bisquert, J., Eds.; Springer: Cham, Switzerland, 2016. [Google Scholar] [CrossRef]
  11. Chandrasekaran, S.; Yao, L.; Deng, L.; Bowen, C.; Zhang, Y.; Chen, S.; Lin, Z.; Peng, F.; Zhang, P. Recent advances in metal sulfides: From controlled fabrication to electrocatalytic, photocatalytic and photoelectrochemical water splitting and beyond. Chem. Soc. Rev. 2019, 48, 4178–4280. [Google Scholar] [CrossRef]
  12. Zhang, Y.; Xiao, J.; Lv, Q.; Wang, S. Self-supported transition metal phosphide based electrodes as high-efficient water splitting cathodes. Front. Chem. Sci. Eng. 2018, 12, 494–508. [Google Scholar] [CrossRef]
  13. Zada, A.; Muhammad, P.; Ahmad, W.; Hussain, Z.; Ali, S.; Khan, M.; Khan, Q.; Maqbool, M. Surface Plasmonic-Assisted Photocatalysis and Optoelectronic Devices with Noble Metal Nanocrystals: Design, Synthesis, and Applications. Adv. Funct. Mater. 2020, 30, 1906744. [Google Scholar] [CrossRef]
  14. Sheu, J.-K.; Liao, P.-H.; Lee, Y.-C.; Wang, H.-K.; Lee, M.-L. Photoelectrochemical Generation of Hydrogen and Formic Acid Using GaN Films Decorated with TiO2/Ag Nanoparticles Composite Structure as Photoelectrodes. J. Phys. Chem. C 2020, 124, 9591–9598. [Google Scholar] [CrossRef]
  15. Sun, Q.-C.; Ding, Y.; Goodman, S.M.; Funke, H.H.; Nagpal, P. Copper plasmonics and catalysis: Role of electron–phonon interactions in dephasing localized surface plasmons. Nanoscale 2014, 6, 12450–12457. [Google Scholar] [CrossRef] [Green Version]
  16. Fan, X.; Zheng, W.; Singh, D. Light scattering and surface plasmons on small spherical particles. Light. Sci. Appl. 2014, 3, 179. [Google Scholar] [CrossRef] [Green Version]
  17. Licklederer, M.; Mohammadi, R.; Nguyen, N.T.; Park, H.; Hejazi, S.; Halik, M.; Vogel, N.; Altomare, M.; Schmuki, P. Dewetted Au Nanoparticles on TiO2 Surfaces: Evidence of a Size-Independent Plasmonic Photoelectrochemical Response. J. Phys. Chem. C 2019, 123, 16934–16942. [Google Scholar] [CrossRef]
  18. Gaspar, D.; Pimentel, A.C.; Mateus, T.; Leitão, J.P.; Soares, J.; Falcão, B.P.; Araújo, A.; Vicente, A.; Filonovich, S.A.; Águas, H.; et al. Influence of the layer thickness in plasmonic gold nanoparticles produced by thermal evaporation. Sci. Rep. 2013, 3, 1469. [Google Scholar] [CrossRef] [PubMed]
  19. Rodríguez-Martínez, C.; García-Domínguez, Á.E.; Guerrero-Robles, F.; Saavedra-Díaz, R.O.; Torres-Torres, G.; Felipe, C.; Ojeda-López, R.; Silahua-Pavón, A.; Cervantes-Uribe, A. Synthesis of Supported Metal Nanoparticles (Au/TiO2) by the Suspension Impregnation Method. J. Compos. Sci. 2020, 4, 89. [Google Scholar] [CrossRef]
  20. Veziroglu, S.; Ullrich, M.; Hussain, M.; Drewes, J.; Shondo, J.; Strunskus, T.; Adam, J.; Faupel, F.; Aktas, O.C. Plasmonic and non-plasmonic contributions on photocatalytic activity of Au-TiO2 thin film under mixed UV–visible light. Surf. Coat. Technol. 2020, 389, 125613. [Google Scholar] [CrossRef]
  21. Smikhovskaia, A.V.; Andrianov, V.S.; Khairullina, E.M.; Lebedev, D.V.; Ryazantsev, M.N.; Panov, M.S.; Tumkin, I.I. In situ laser-induced synthesis of copper-silver microcomposite for enzyme-free d-glucose and l-alanine sensing. Appl. Surf. Sci. 2019, 488, 531–536. [Google Scholar] [CrossRef]
  22. Sakamoto, M.; Fujistuka, M.; Majima, T. Light as a construction tool of metal nanoparticles: Synthesis and mechanism. J. Photochem. Photobiol. C Photochem. Rev. 2009, 10, 33–56. [Google Scholar] [CrossRef]
  23. Lebedev, D.; Novomlinsky, M.; Kochemirovsky, V.; Ryzhkov, I.; Anfimova, I.; Panov, M.; Antropova, T. Glass/Au Composite Membranes with Gold Nanoparticles Synthesized inside Pores for Selective Ion Transport. Materials 2020, 13, 1767. [Google Scholar] [CrossRef] [Green Version]
  24. Cure, J.; Assi, H.; Cocq, K.; Marìn, L.; Fajerwerg, K.; Fau, P.; Bêche, E.; Chabal, Y.J.; Estève, A.; Rossi, C. Controlled Growth and Grafting of High-Density Au Nanoparticles on Zinc Oxide Thin Films by Photo-Deposition. Langmuir 2018, 34, 1932–1940. [Google Scholar] [CrossRef] [PubMed] [Green Version]
  25. Kamaja, C.K.; Devarapalli, R.R.; Dave, Y.; Debgupta, J.; Shelke, M.V. Synthesis of novel Cu2S nanohusks as high performance counter electrode for CdS/CdSe sensitized solar cell. J. Power Source 2016, 315, 277–283. [Google Scholar] [CrossRef]
  26. Markovskaya, D.V.; Gribov, E.N.; Kozlova, E.A.; Kozlov, D.V.; Parmon, V.N. Modification of sulfide-based photocatalyst with zinc- and nickel-containing compounds: Correlation between photocatalytic activity and photoelectrochemical parameters. Renew. Energy 2020, 151, 286–294. [Google Scholar] [CrossRef]
  27. Hanaor, D.A.H.; Sorrell, C.C. Review of the anatase to rutile phase transformation. J. Mater. Sci. 2011, 46, 855–874. [Google Scholar] [CrossRef] [Green Version]
  28. Li, J.-G.; Ishigaki, T. Brookite → rutile phase transformation of TiO2 studied with monodispersed particles. Acta Mater. 2004, 52, 5143–5150. [Google Scholar] [CrossRef]
  29. Luttrell, T.; Halpegamage, S.; Tao, J.; Kramer, A.; Sutter, E.; Batzill, M. Why is anatase a better photocatalyst than rutile?—Model studies on epitaxial TiO2 films. Sci. Rep. 2014, 4, 4043. [Google Scholar] [CrossRef] [Green Version]
  30. Yao, G.-Y.; Liu, Q.-L.; Zhao, Z.-Y. Studied Localized Surface Plasmon Resonance Effects of Au Nanoparticles on TiO2 by FDTD Simulations. Catalysts 2018, 8, 236. [Google Scholar] [CrossRef]
  31. Tucceri, R. The charge transport process at gold electrodes modified by thick nickel hydroxide films. A study employing rotating disc electrode voltammetry in the presence of the Fe(CN)63−/4− redox couple. J. Electroanal. Chem. 2016, 782, 125–132. [Google Scholar] [CrossRef]
  32. Avramov Ivić, M.; Lović, J.; Stevanović, S.; Nikolić, N.D.; Trišović, N.; Lađarević, J.; Vuković, D.; Drmanić, S.; Mladenović, A.; Jadranin, M.; et al. Electrochemical behavior of esomeprazole: Its determination at Au electrode as standard and in injection powder combined with the study of its degradation. J. Electroanal. Chem. 2019, 848, 113303. [Google Scholar] [CrossRef]
  33. Kamat, P.V.; Tvrdy, K.; Baker, D.R.; Padich, J.G. Beyong photovoltaics: Semiconductor nanoarchitectures for liquid-junction solar cells. Chem. Rev. 2010, 110, 6664–6688. [Google Scholar] [CrossRef] [PubMed]
  34. Markovskaya, D.V.; Zhurenok, A.V.; Cherepanova, S.V.; Kozlova, E.A. Solid solutions of CdS and ZnS: Comparing photocatalytic activity and photocurrent generation. Appl. Surf. Sci. Adv. 2021, 4, 100076. [Google Scholar] [CrossRef]
  35. Mascaretti, L.; Dutta, A.; Kment, Š.; Shalaev, V.M.; Boltasseva, A.; Zboril, R.; Naldoni, A. Plasmon-Enhanced Photoelectrochemical Water Splitting for Efficient Renewable Energy Storage. Adv. Mater. 2019, 31, 1805513. [Google Scholar] [CrossRef] [PubMed]
Figure 1. SEM image of the surface of a Au/TiO2/FTO composite film at various magnifications (ac); EDS analysis of the photoelectrode before (d) and after (e) deposition of gold nanoparticles using the LCLD method.
Applsci 12 00030 g001
Figure 2. TEM images of the Au/TiO2 layer in cross-section mode at various magnifications (ac); EDS map of the Au/TiO2/FTO layer (d).
Applsci 12 00030 g002
Figure 3. XRD pattern of (a) TiO2/FTO/glass and (b) Au/TiO2/FTO/glass photoelectrodes.
Applsci 12 00030 g003
Figure 4. Optical density spectra of TiO2/FTO and Au/TiO2/FTO films.
Applsci 12 00030 g004
Figure 5. Cyclic voltammogram of the TiO2/FTO and Au/TiO2/FTO samples (a); time variation of the short-circuit current density of the TiO2/FTO and Au/TiO2/FTO samples (b).
Applsci 12 00030 g005
Figure 6. Nyquist plots for TiO2/FTO and Au/TiO2/FTO (a); equivalent circuit used to simulate the frequency dependence of the impedance of an electrochemical cell (b).
Applsci 12 00030 g006
Table 1. Photovoltaic characteristics of the photoelectrodes under study.
PhotoelectrodeJsc, mA/cm2Voc, mVFF, %η, %
TiO2/FTO0.29413280.019
Au/TiO2/FTO2.71127280.374
Table 2. Approximation of data obtained using impedance spectroscopy.
SampleRK, ΩRW, ΩRD, ΩR2τ, msVfb, VN, m−3
TiO2/FTO254 ± 10.83 ± 0.0510.0 ± 0.20.9990.12−0.342.0 × 1017
Au/TiO2/FTO1.0 ± 0.13.05 ± 0.034.8 ± 0.10.9891−0.432.5 × 1018
Publisher’s Note: MDPI stays neutral with regard to jurisdictional claims in published maps and institutional affiliations.

