Article

Trapa japonica Flerov Extract Prevents Obesity by Regulating Adipogenesis and Lipolysis in Differentiated 3T3-L1 Cells

1
Beirne B. Cater Center for Immunology Research, University of Virginia, Charlottesville, VA 22901, USA
2
Clinical Nutrition Institute, Kyung Hee University, Seoul 02453, Korea
3
Department of Medical Nutrition, Kyung Hee University, Yongin 17104, Korea
4
Research Institute, Bio Port Korea Inc., Busan 46048, Korea
*
Author to whom correspondence should be addressed.
Appl. Sci. 2022, 12(1), 290; https://doi.org/10.3390/app12010290
Submission received: 26 October 2021 / Revised: 20 December 2021 / Accepted: 27 December 2021 / Published: 29 December 2021
(This article belongs to the Topic Applied Sciences in Functional Foods)

Abstract

:
Our study investigated that the anti-obesity effect of the Trapa japonica Flerov extract (TJ) in differentiated 3T3-L1 adipocytes. To this end, 3T3-L1 cells were treated with TJ during their differentiation period. On the last day of the cell culture, we tested intracellular cAMP, FA, glycerol release, TG, and performed Oil Red O staining and Western blot assays. On the part of adipogenesis, lipogenesis, and lipolysis mechanism, TJ increased the cAMP (maximum 125.4%) levels and glycerol release (maximum four times) and decreased FA (maximum 35.1%) and TG (maximum 35.7%) levels. Furthermore, the protein expression levels of each mechanism-related factor were regulated in a dose-dependent manner. These results indicate that TJ reduced lipid accumulation by max 53.6% and 47.9%, respectively, in adipogenesis and lipolysis mechanisms. We expect this effect of TJ to be due to its component, ellagic acid. In conclusion, we found that TJ inhibits TG synthesis during adipogenesis and lipogenesis, promotes lipolysis, and thus, indicating its potential as a functional food for obesity prevention.

1. Introduction

Obesity is a serious disease with an increasing prevalence of epidemics in the Western world, including the United States [1]. Obesity-related diseases have been known through numerous reports so far, and the resulting complications have a significant negative impact on the quality of life of modern people [2,3,4]. Moreover, adipose tissue is an important regulator of whole-body metabolism and energy homeostasis [5].
Adipogenesis is the process of generating mature adipocytes from preadipocytes and was based on studies using murine preadipocytes, 3T3-L1 cells, to accelerate lipid accumulation [6]. When differentiation of preadipocytes begins, specific transcription factors are combined to induce the expression of differentiation initiating factors [7,8]. Excessive action of carbohydrate absorption and insulin signaling in the body accelerates lipogenesis in adipocytes. Acetyl coenzyme A (acetyl-CoA), which plays an important role in the tricarboxylic acid (TCA) cycle during lipogenesis, moves from the intracellular mitochondrial membrane to the cytoplasm. Acetyl-CoA is also involved in the production of fatty acid (FA) and is converted to malonyl-CoA under the influence of the multifunctional enzyme acetyl-CoA carboxylase (ACC) [9]. In the body, not only the accumulation of fat but also the breakdown of fat is regulated by several hormones and various transcription factors [10,11]. In particular, in the case of the lipolysis process in which TG is degraded, several pathways exist, but the cAMP-PKA pathway leads to the activation of hormone-sensitive lipase (HSL), and the reduction in phosphodiesterase 3B (PDE3B) stands out [12]. Phosphorylated HSL acts on perilipin and leads to the glycerol release of TG [13].
Trapa japonica Flerov (T. japonica) has long been used for food and medicinal purposes. TJ is an annual aquatic plant found in lakes and waters around the world, including Korea, China, India, and North America. T. japonica is also called water chestnut, and it has many varieties such as Trapa natans, T. japonica, and Trapa bicornis. It contains 80% starch, 5% protein as well as a significant amount of vitamins and is reported to have a variety of polyphenols [14]. Based on this, the inhibitory effect of adipogenic transcription factors of T. japonica was recently reported, but only some factors in the mechanism of adipogenesis are dealt with [15]. In addition, T. japonica has been reported to have antioxidant, antidiabetic, and antitumor effects [16,17,18]. However, there are limited studies on the regulatory activity of Chinese T. japonica among various metabolic mechanisms related to anti-obesity. In particular, studies on the lipolytic effect in fully mature adipocytes should be explored. Therefore, in this study, we investigated whether a 20% ethyl alcohol extract of Chinese T. japonica had a modulating effect on the mechanisms of adipogenesis, lipogenesis, and lipolysis in differentiated 3T3-L1 cells.

2. Materials and Methods

2.1. Preparation of Materials

The T. japonica extract (TJ) used in the main experiment was provided by Bio Port Korea Inc. (Busan, Korea). The whole fruit of TJ grown in China was used as a raw material; 20% ethyl alcohol was added 10 times (v/v), extracted at 80 °C for 6 h, and concentrated under reduced pressure by using the Rotary Evaporator R-220 (Buchi labortechnik AG, Flasil, Switzerland). After concentration, the concentrate was mixed with maltodextrin in a 1:1 ratio and spray-dried to obtain a light brown powder. The TJ was sealed and kept at −20 °C until use.
High-glucose Dulbecco’s Modified Eagle Medium, newborn calf serum, fetal bovine serum (FBS), non-essential amino acids, penicillin/streptomycin, sodium pyruvate, and L-glutamine were purchased from Hyclone (Logan, UT, USA). 3-isobutyl-1-methylxanthine (IBMX), insulin, and dexamethasone were purchased from Sigma-Aldrich (St. Louis, MO, USA). Green tea extract catechin was purchased from Nature Story (Seoul, Korea).

2.2. Cell Culture and Treatments

The 3T3-L1 cell line used in this study was purchased from the American Type Culture Collection (Rockville, MD, USA). The cells were incubated, cultured, and differentiated according to our conventional protocols [19]. The cells were seeded at a density of 2 × 10⁵ cells/well into a 6-well plate. When cells are in a 100% confluent state, the medium was changed to a differentiation medium containing 10% FBS with an adipogenic cocktail (1 μM dexamethasone, 10 μg/mL insulin, and 0.5 mM IBMX). A total of 3 days after that day, the existing medium was replaced with a new medium containing only insulin (10 μg/mL), and after another 3 days, it was replaced with a new medium containing only 10% FBS. The information of group in this study was as follows: normal control (NC, no treatment), differentiation control (DC), positive control 1 (catechin 100 μg/mL, PC1), positive control 2 (catechin 200 μg/mL, PC2), and TJ (10, 50, 100, and 200 μg/mL). The cells were treated with TJ daily during the differentiation period (9 days) in the adipogenesis experiment set and treated only the last 3 days in the lipolysis experiment set according to our previously established protocol [19,20].

2.3. Water Soluble Tetrazolium Salt (WST) Assay

The WST assay was performed for testing the cell viability using an EZ-Cytox kit (Daeil Lab Service, Seoul, Korea) according to our previous method [19]. The cells were seeded at a density of 1 × 10⁴ cells/well into a 96-well plate. After the cells were attached to the bottom of the plate, TJ samples were added to each well at a concentration of 0–1000 μg/mL for 24 h. After 24 h, 20 μL/200 μL of EZ-Cytox reagent was added to each well and incubated for 3 h. After gently shaking the plate, the optical density (OD) was measured at 450 nm (ELISA reader; Bio-Rad Laboratories, Hercules, CA, USA).

2.4. Western Blotting

After completion of the 3T3-L1 differentiation experiments, the cells were harvested and homogenized with CelLyticTM MT Cell Lysis Reagent (Sigma-Aldrich, St. Louis, MO, USA) containing the HaltTM Protease and Phosphatase Inhibitor Cocktail (Thermo Fisher Scientific, Rockford, IL, USA). All processes, such as protein quantification, loading, and transfer, were performed according to our conventional methods [19]. The primary antibody information was as follows: phosphorylated mitogen-activated protein kinase (p-MAPK/MAPK; 1:1000; Cell Signaling Technology, Beverly, MA, USA), phosphorylated cAMP response element-binding protein (p-CREB/CREB; 1:500; Cell Signaling Technology, Danvers, MA, USA), C/EBPβ (1:500; Cell Signaling Technology), PPAR-γ (1:500; Cell Signaling Technology), C/EBPα (1:500; Cell Signaling Technology), FABP4 (1:200; Abcam, Cambridge, MA, USA), leptin (1:1000; Abcam), glucose 6-phosphatase (G6Pase; 1:1000; Abcam), PCK (1:1000, Abcam), G6PDH (1:1000, Cell Signaling Technology), citrate synthase (1:1000, Cell Signaling Technology), phospho-AMP-activated protein kinase (p-AMPK/AMPK; 1:500; Cell Signaling Technology), sterol regulatory element-binding protein-1c (SREBP1c; 1:500; Abcam), p-ACC/ACC (1:400; Cell Signaling Technology), fatty acid synthase (FAS; 1:1000; Cell Signaling Technology), lipoprotein lipase (LPL; 1:1000; Abcam), UCP1 (1:1000, Cell Signaling Technology), PKA (1:500, Sigma-Aldrich), phosphodiesterase 3B (PDE3B; 1:500, Abcam), perilipin A (1:250, Cell Signaling Technology), ATGL (1:1000, Cell Signaling Technology), phosphorylated hormone-sensitive lipase (p-HSL/HSL; 1:1000, Cell Signaling Technology), CPT1A (1:1000, LSBio, Seattle, WA, USA), and actin (1:1000; Bethyl, Montgomery, TX, USA). As the secondary antibody, anti-rabbit, anti-mouse, or anti-goat IgG HRP-conjugated secondary antibodies (1:2000; Bethyl) were used. The membrane exposure was performed using EzWestLumi plus and Ez-Capture II equipment (ATTO, Tokyo, Japan), and analysis was also performed using ATTO’s CS Analyzer 3.0 software.

2.5. Enzyme-Linked Immunosorbent Assay (ELISA)

The cyclic-adenosine monophosphate (cAMP) level in differentiated 3T3-L1 cells was measured using a cAMP ELISA kit (Cell Biolabs Inc., San Diego, CA, USA). The TG and FA levels were measured using each Quantification Colorimetric Kit (Biovision Inc., Milpitas, CA, USA). All experiments were conducted according to the respective manufacturer’s protocols and our conventional methods.

2.6. Oil Red O Staining

The staining protocols related to lipid accumulation followed our conventional methods [19]. After completion of the 3T3-L1 cell differentiation, the cells on the plate were washed with Dulbecco’s phosphate-buffered saline and fixed with 10% formalin. After drying the cells with 60% isopropanol, the lipids of the cells were stained with Oil Red O working solution for 2 h, and then the stained cells were washed with distilled water and photographed. The level of lipid accumulation was determined by eluting the Oil Red O dye that had stained the lipids using 100% isopropanol and measuring the OD value at 520 nm.

2.7. Glycerol Release Assay

For the measurement of the free glycerol, a TG decomposition product, the glycerol phosphate oxidase (GPO)-TRINDER enzyme reaction protocol was used [19]. After completion of the 3T3-L1 cell differentiation, the free glycerol reagent (Sigma-Aldrich) was mixed with the cultured medium. After incubation, the OD value was measured at 540 nm. Glycerol standard solution (Sigma-Aldrich) was used to analyze the glycerol content by substituting the results of the OD value into the standard curve.

2.8. Statistical Analysis

All experiment data were expressed as mean ± standard deviation (SD). The significance of each experimental group was determined using one-way analysis of variance and Duncan’s multiple range test with SPSS Statistics 22.0 software (SPSS Inc., Chicago, IL, USA). Statistical significance was considered to be at the p < 0.05 level.

3. Results

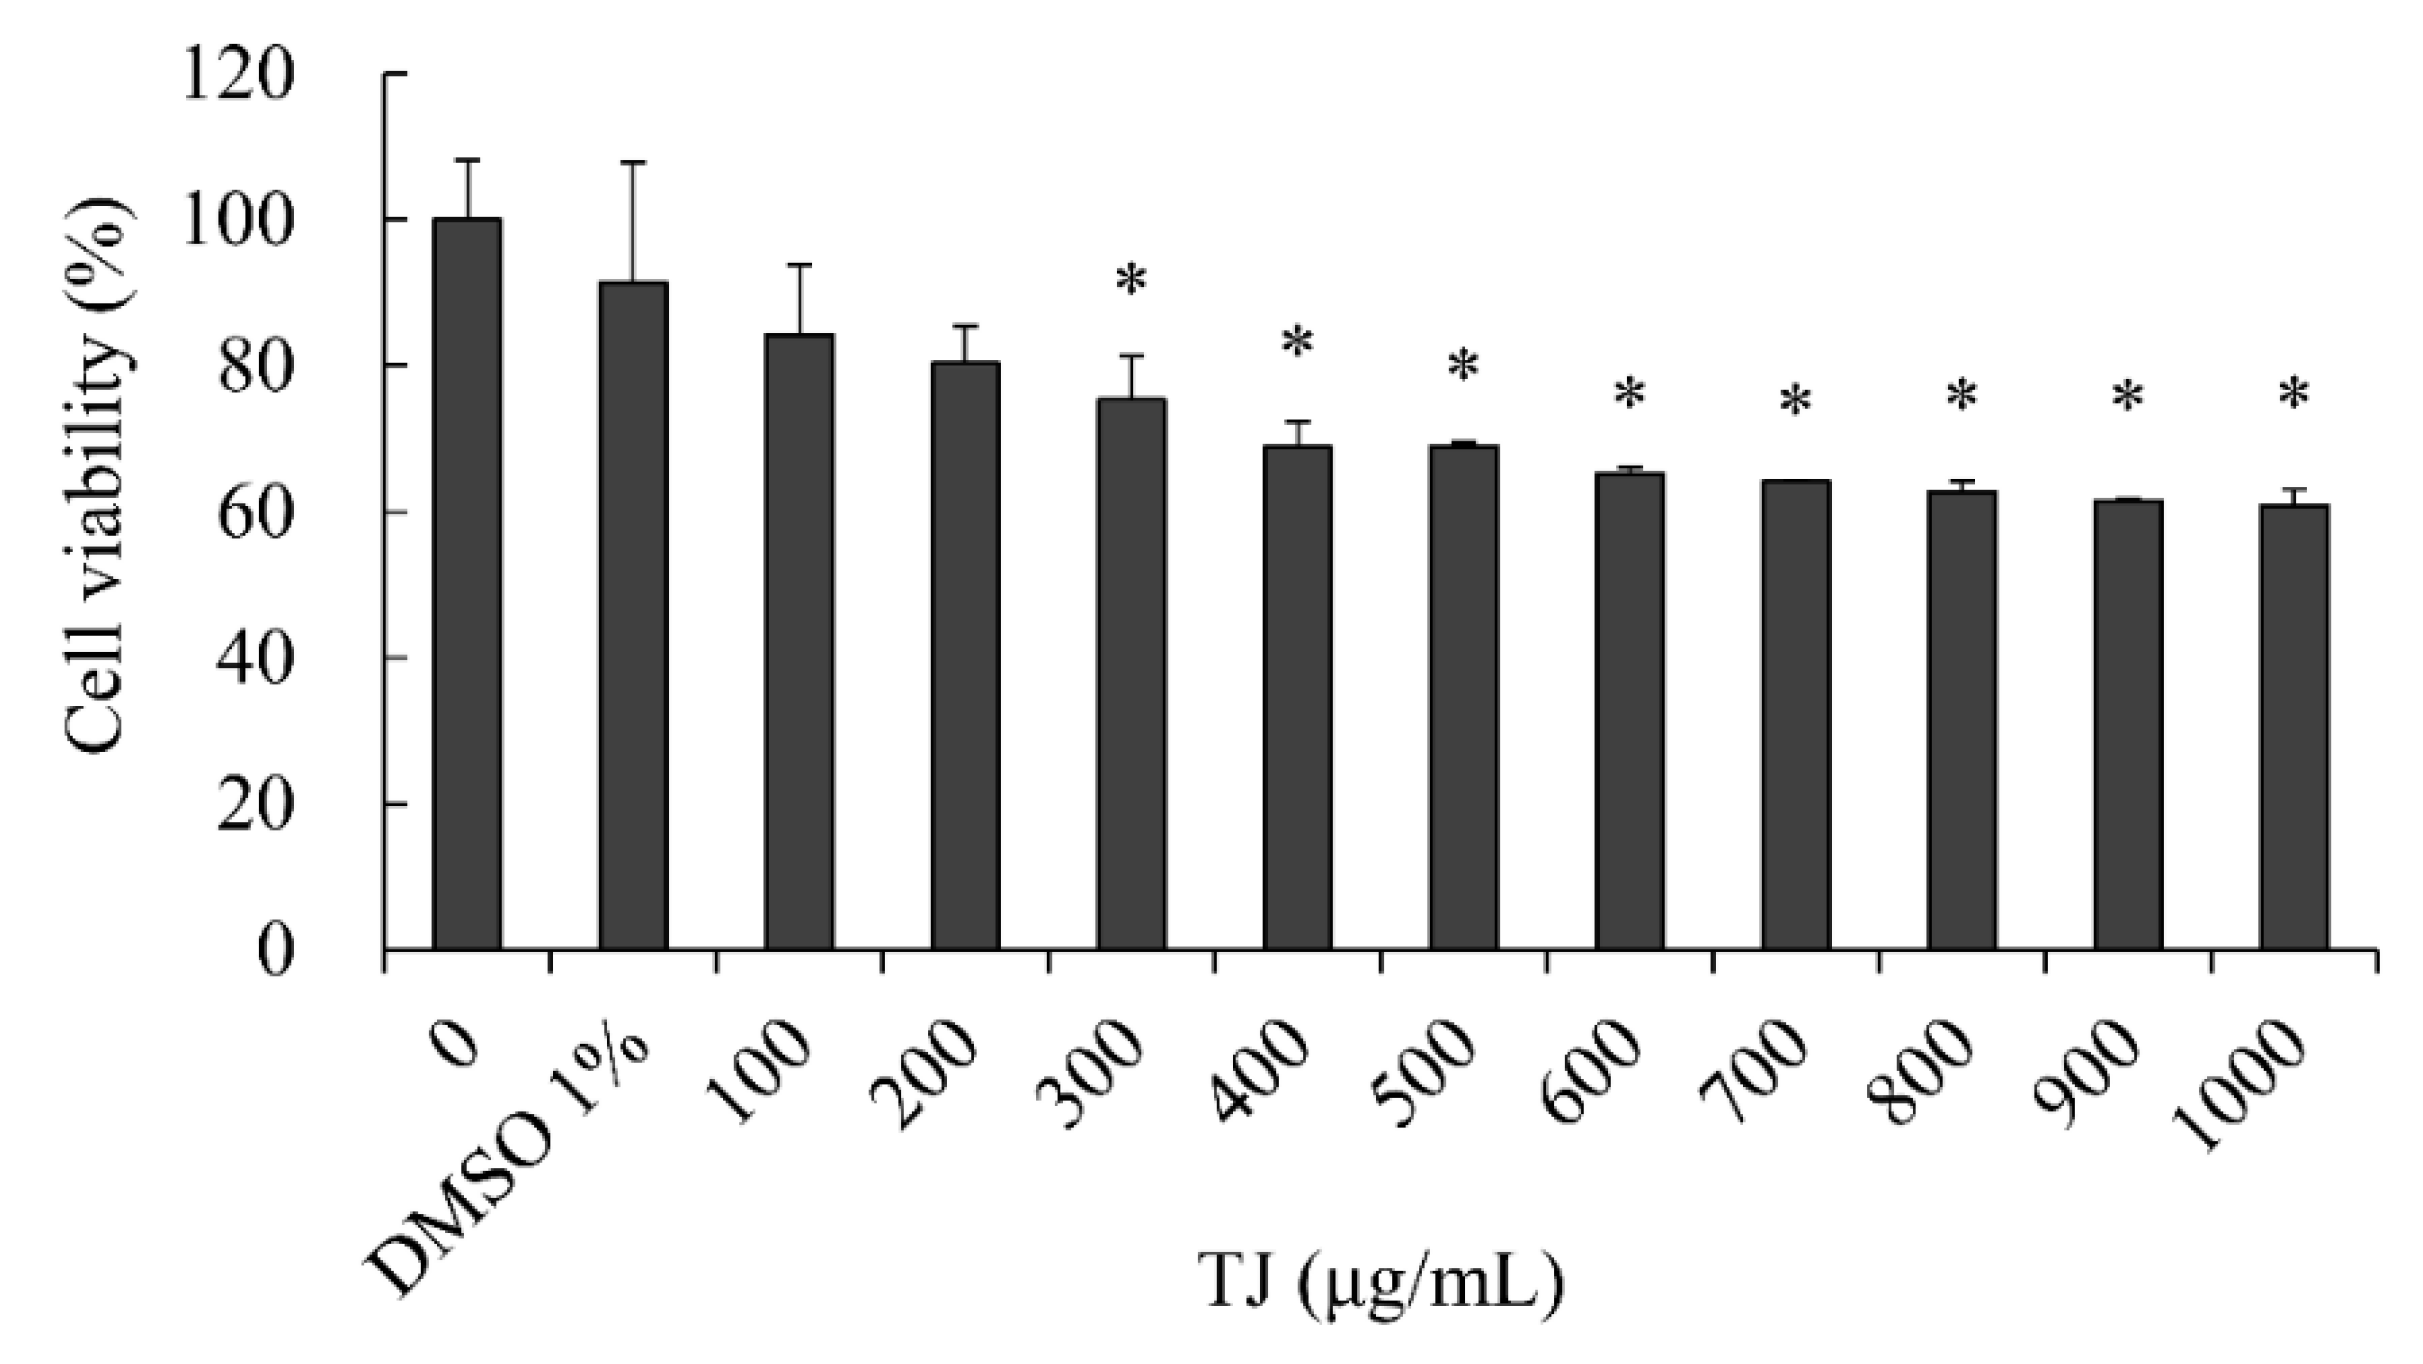
3.1. Effects of TJ on Cell Viability in 3T3-L1 Cells

As a result of the cell viability test for 3T3-L1 cells of TJ (0–1000 μg/mL), at least 80% cell viability was observed in concentrations up to 200 μg/mL. In the main experiment, TJ was applied within the range where cytotoxicity was not observed (Figure 1).

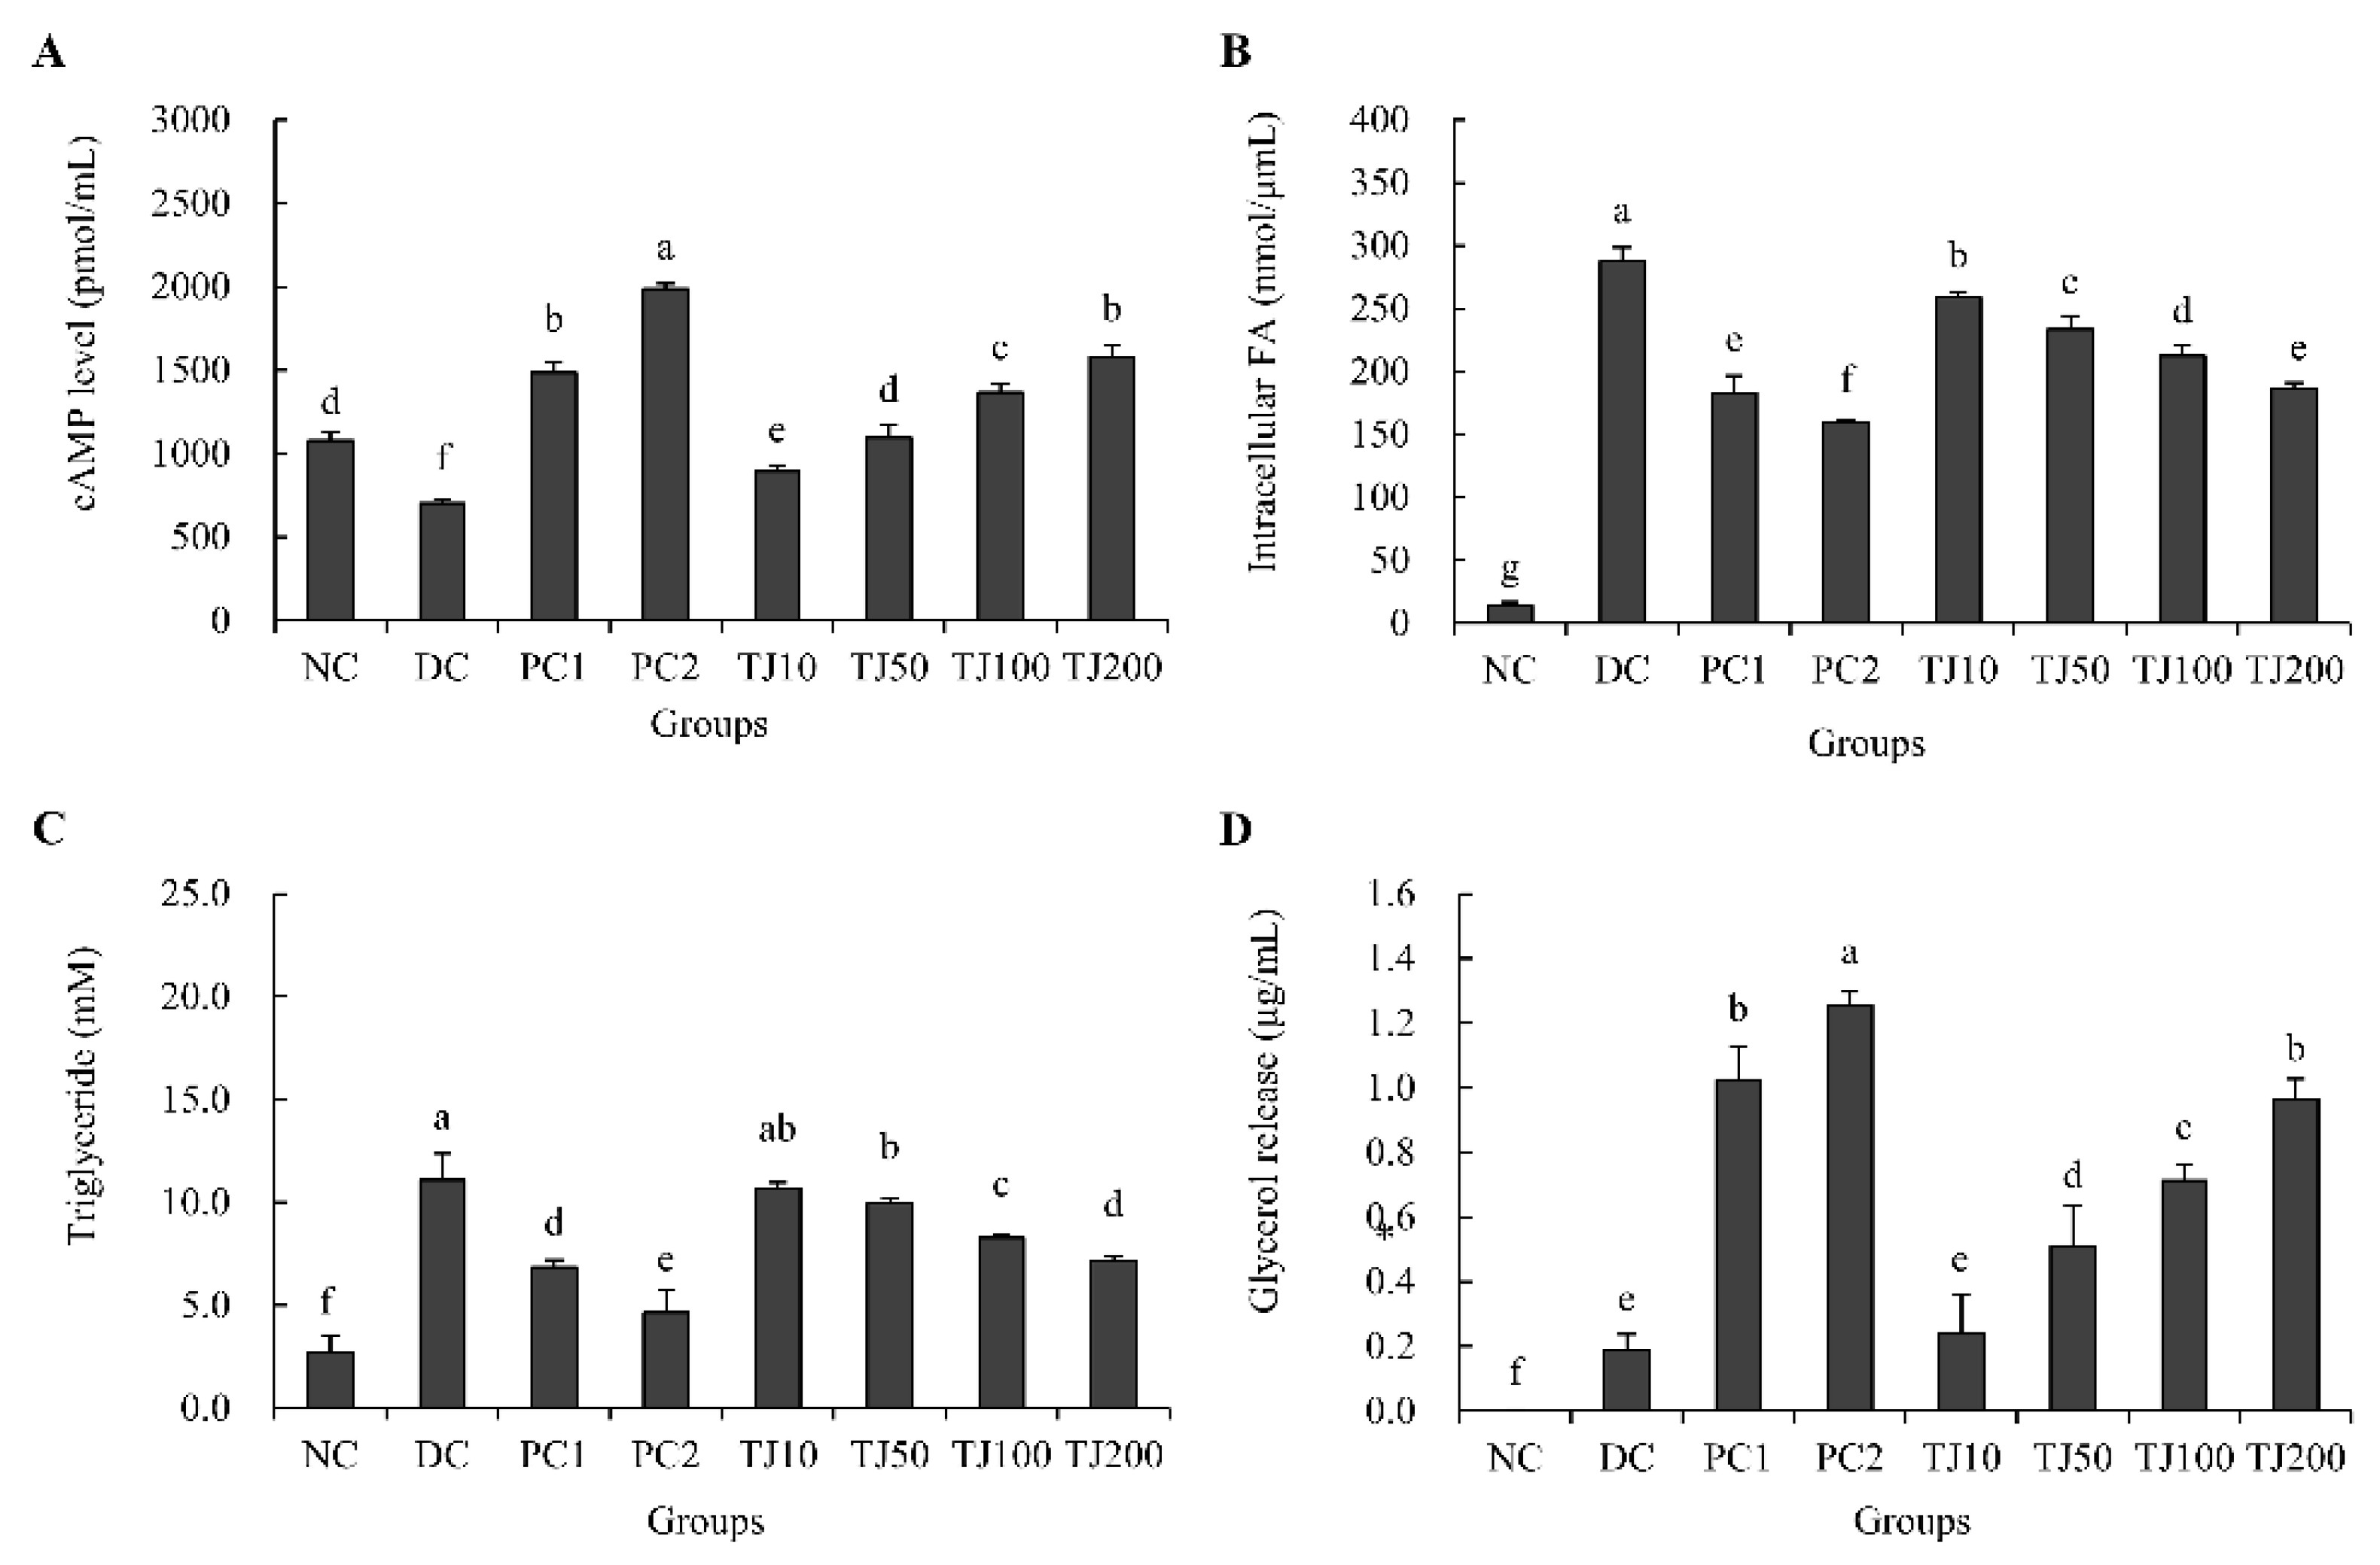
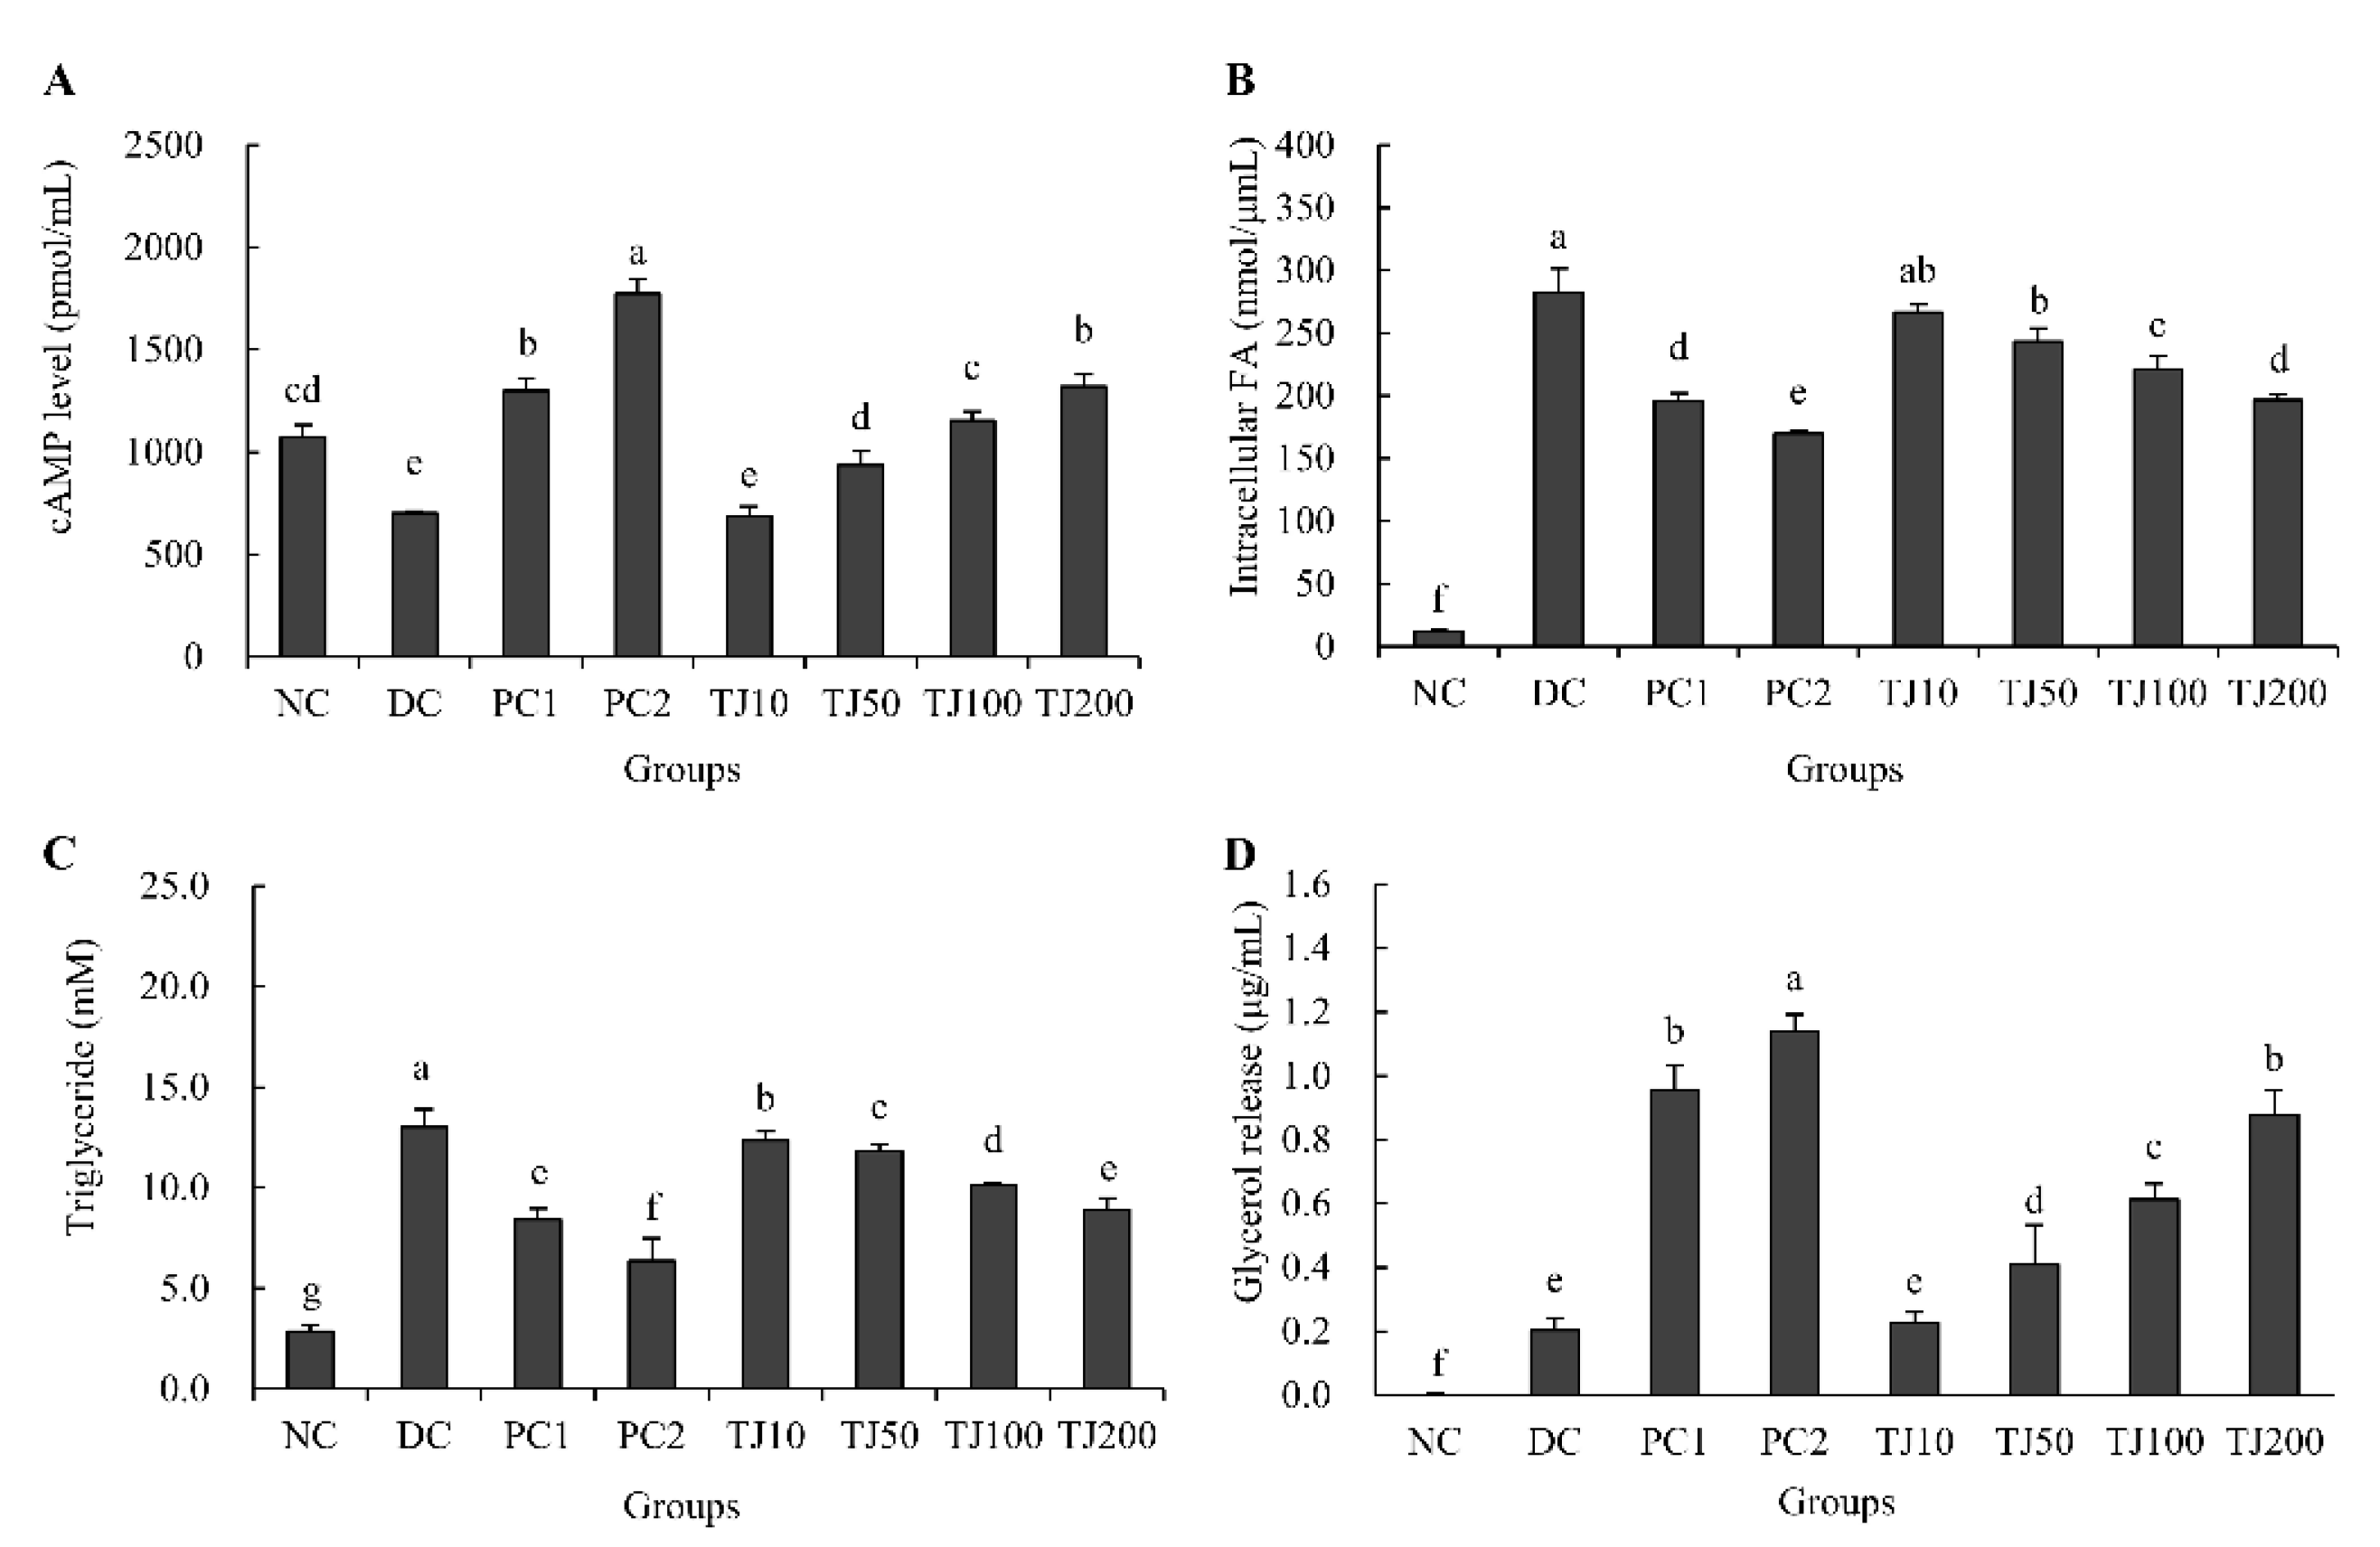
3.2. The Effects of the TJ in the cAMP Level, Intracellular FA, TG, and Glycerol Release Related to the Adipogenesis Mechanism in Differentiated 3T3-L1 Cells

As a result of measuring the level of cAMP acting on the process of inhibiting adipogenesis in differentiated 3T3-L1 cells, we confirmed that in the DC group (701.7 ± 26.5 pmol/mL), there were significant differences compared to that of the NC group (1077.0 ± 48.5 pmol/mL). Moreover, PC1 (1484.7 ± 66.9 pmol/mL), PC2 (1987.7 ± 30.8 pmol/mL), and TJ groups (10: 892.0 ± 35.4 pmol/mL, 50: 1095.0 ± 81.1 pmol/mL, 100: 1367.7 ± 50.5 pmol/mL, 200: 1581.3 ± 65.4 pmol/mL, respectively) showed significant increases compared to that of the DC group (Figure 2A). The intracellular FA levels of PC1 (183.0 ± 13.6 nmol/μL), PC2 (159.9 ± 2.0 nmol/μL), and TJ groups (10: 258.9 ± 4.1 nmol/μL, 50: 233.4 ± 10.4 nmol/μL, 100: 212.6 ± 8.5 nmol/μL, 200: 186.6 ± 4.5 nmol/μL, respectively) significantly decreased compared to that of the DC group (287.7 ± 11.1 nmol/μL) (Figure 2B). As a result of testing the TG content, we found that the level of the DC group (11.1 ± 1.3 mM) significantly increased compared to that of the NC group (2.7 ± 0.8 mM). On the other hand, in the PC1 (6.8 ± 0.3 mM), PC2(4.7 ± 1.1 mM), and TJ groups (10: 10.7 ± 0.3 mM, 50: 9.9 ± 0.3 mM, 100: 8.3 ± 0.1 mM, 200: 7.1 ± 0.2 mM, respectively), it significantly decreased relative to that of the DC group (Figure 2C). Upon testing the glycerol release, we found that in the PC1 (1.02 ± 0.10 μg/mL), PC2 (1.25 ± 0.04 μg/mL), and TJ groups (10: 0.24 ± 0.12 μg/mL, 50: 0.51 ± 0.13 μg/mL, 100: 0.71 ± 0.05 μg/mL, 200: 0.96 ± 0.06 μg/mL, respectively), it significantly increased relative to that of the DC group (0.19 ± 0.05 μg/mL) (Figure 2D).

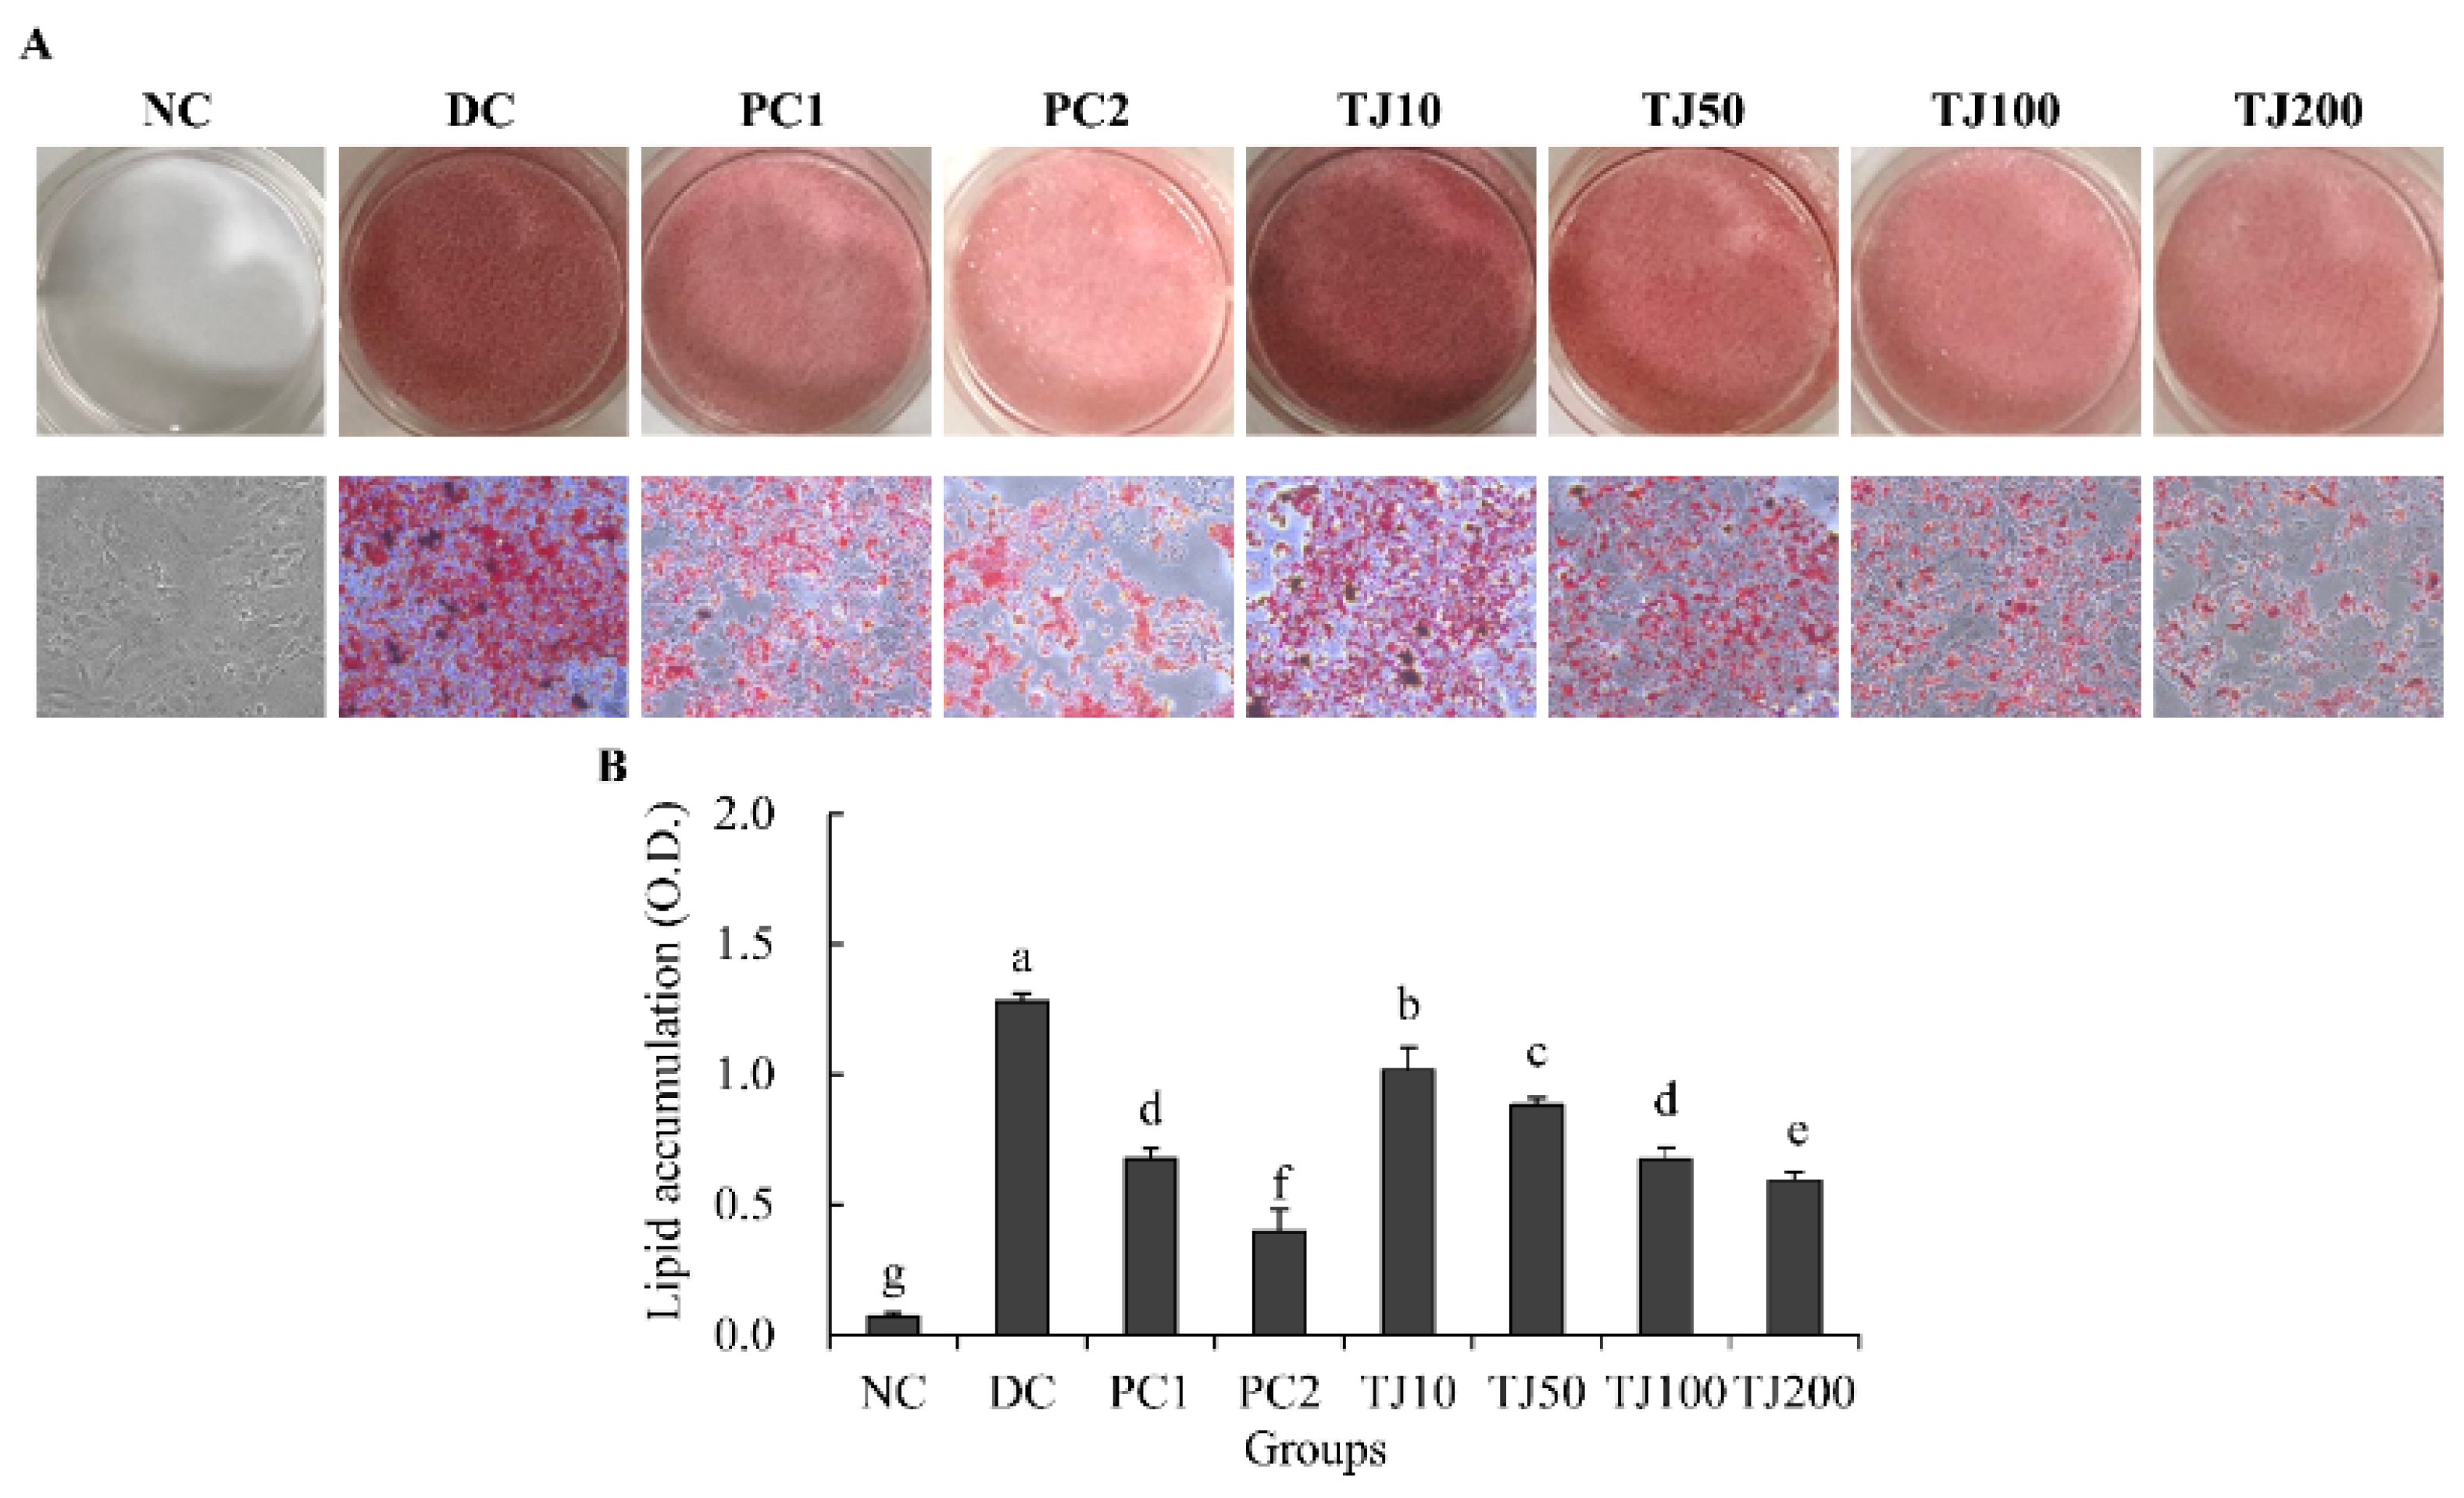
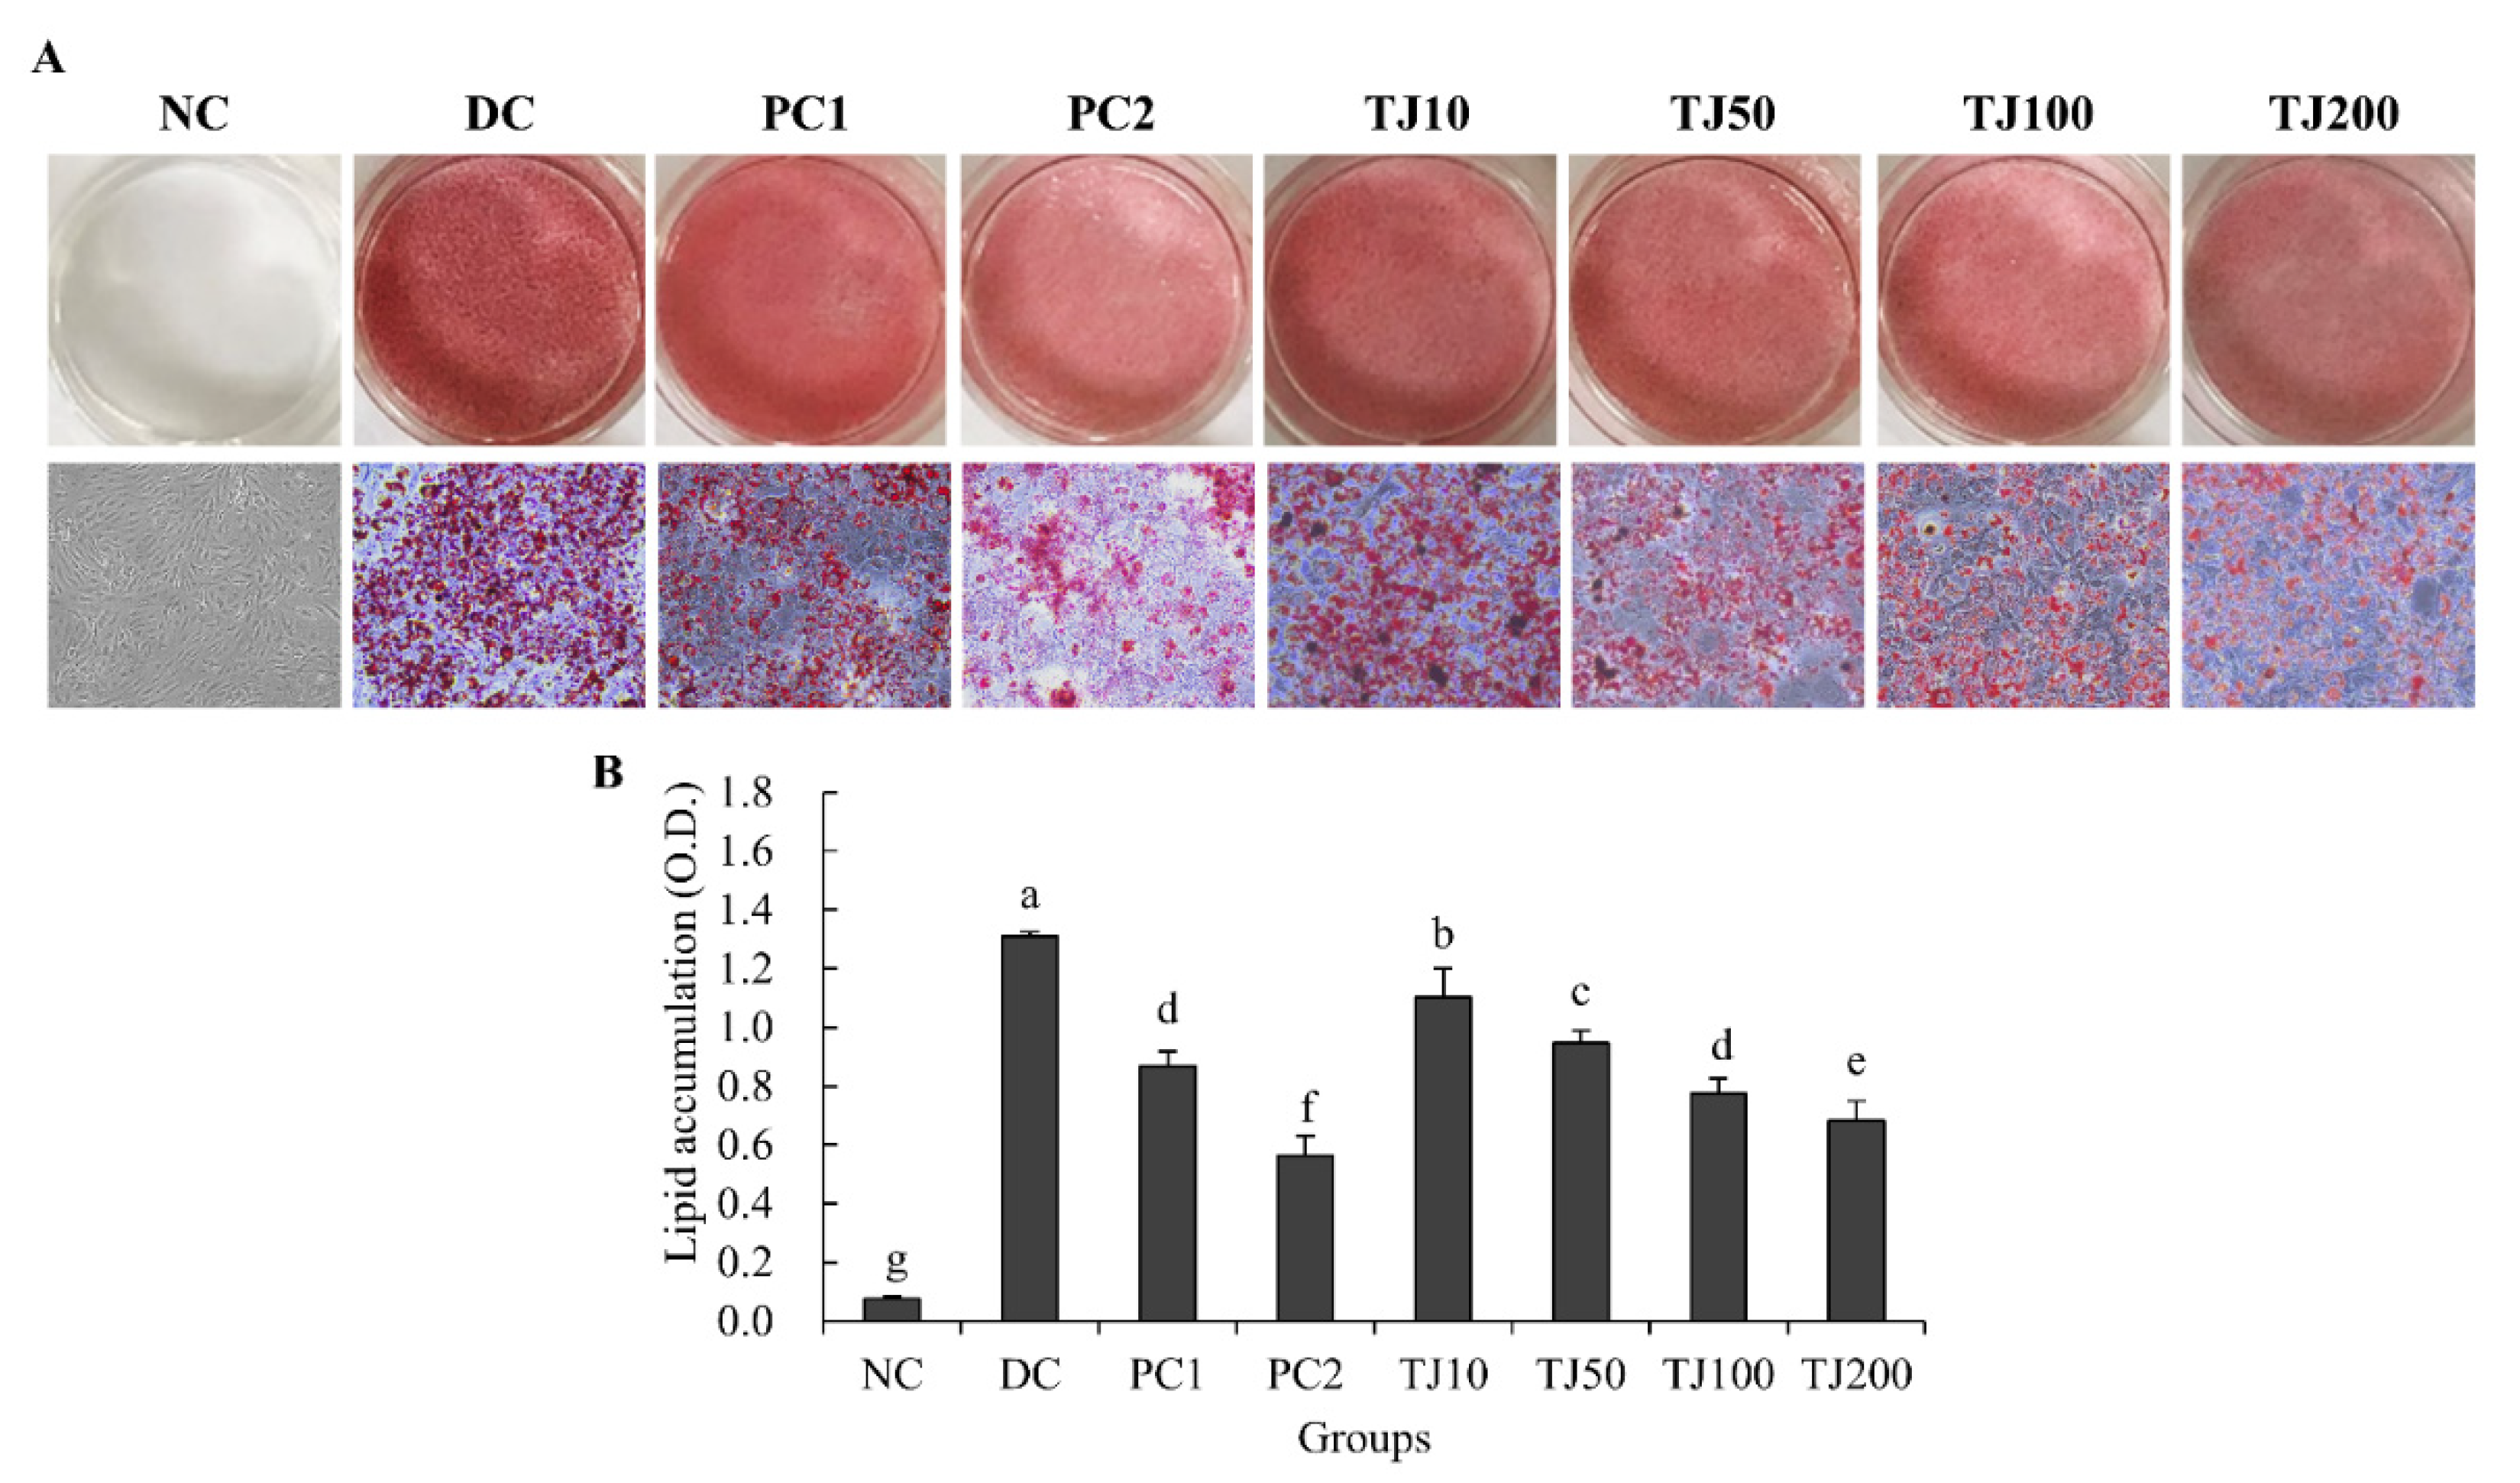
3.3. The TJ Inhibited the Lipid Accumulation Related to the Adipogenesis Mechanism in Differentiated 3T3-L1 Cells

As a result of measuring the lipid accumulation on the process of inhibiting adipogenesis in differentiated 3T3-L1 cells by conducting Oil Red O staining, we confirmed that the OD value of the DC group (1.28 ± 0.03) significantly increased relative to that of the NC group (0.07 ± 0.02). Furthermore, the result of the PC1 (0.68 ± 0.04), PC2 (0.40 ± 0.09), and TJ groups (10: 1.02 ± 0.09, 50: 0.88 ± 0.03, 100: 0.67 ± 0.05, 200: 0.59 ± 0.03) significantly decreased in a dose-dependent manner relative to the DC group (Figure 3A,B).

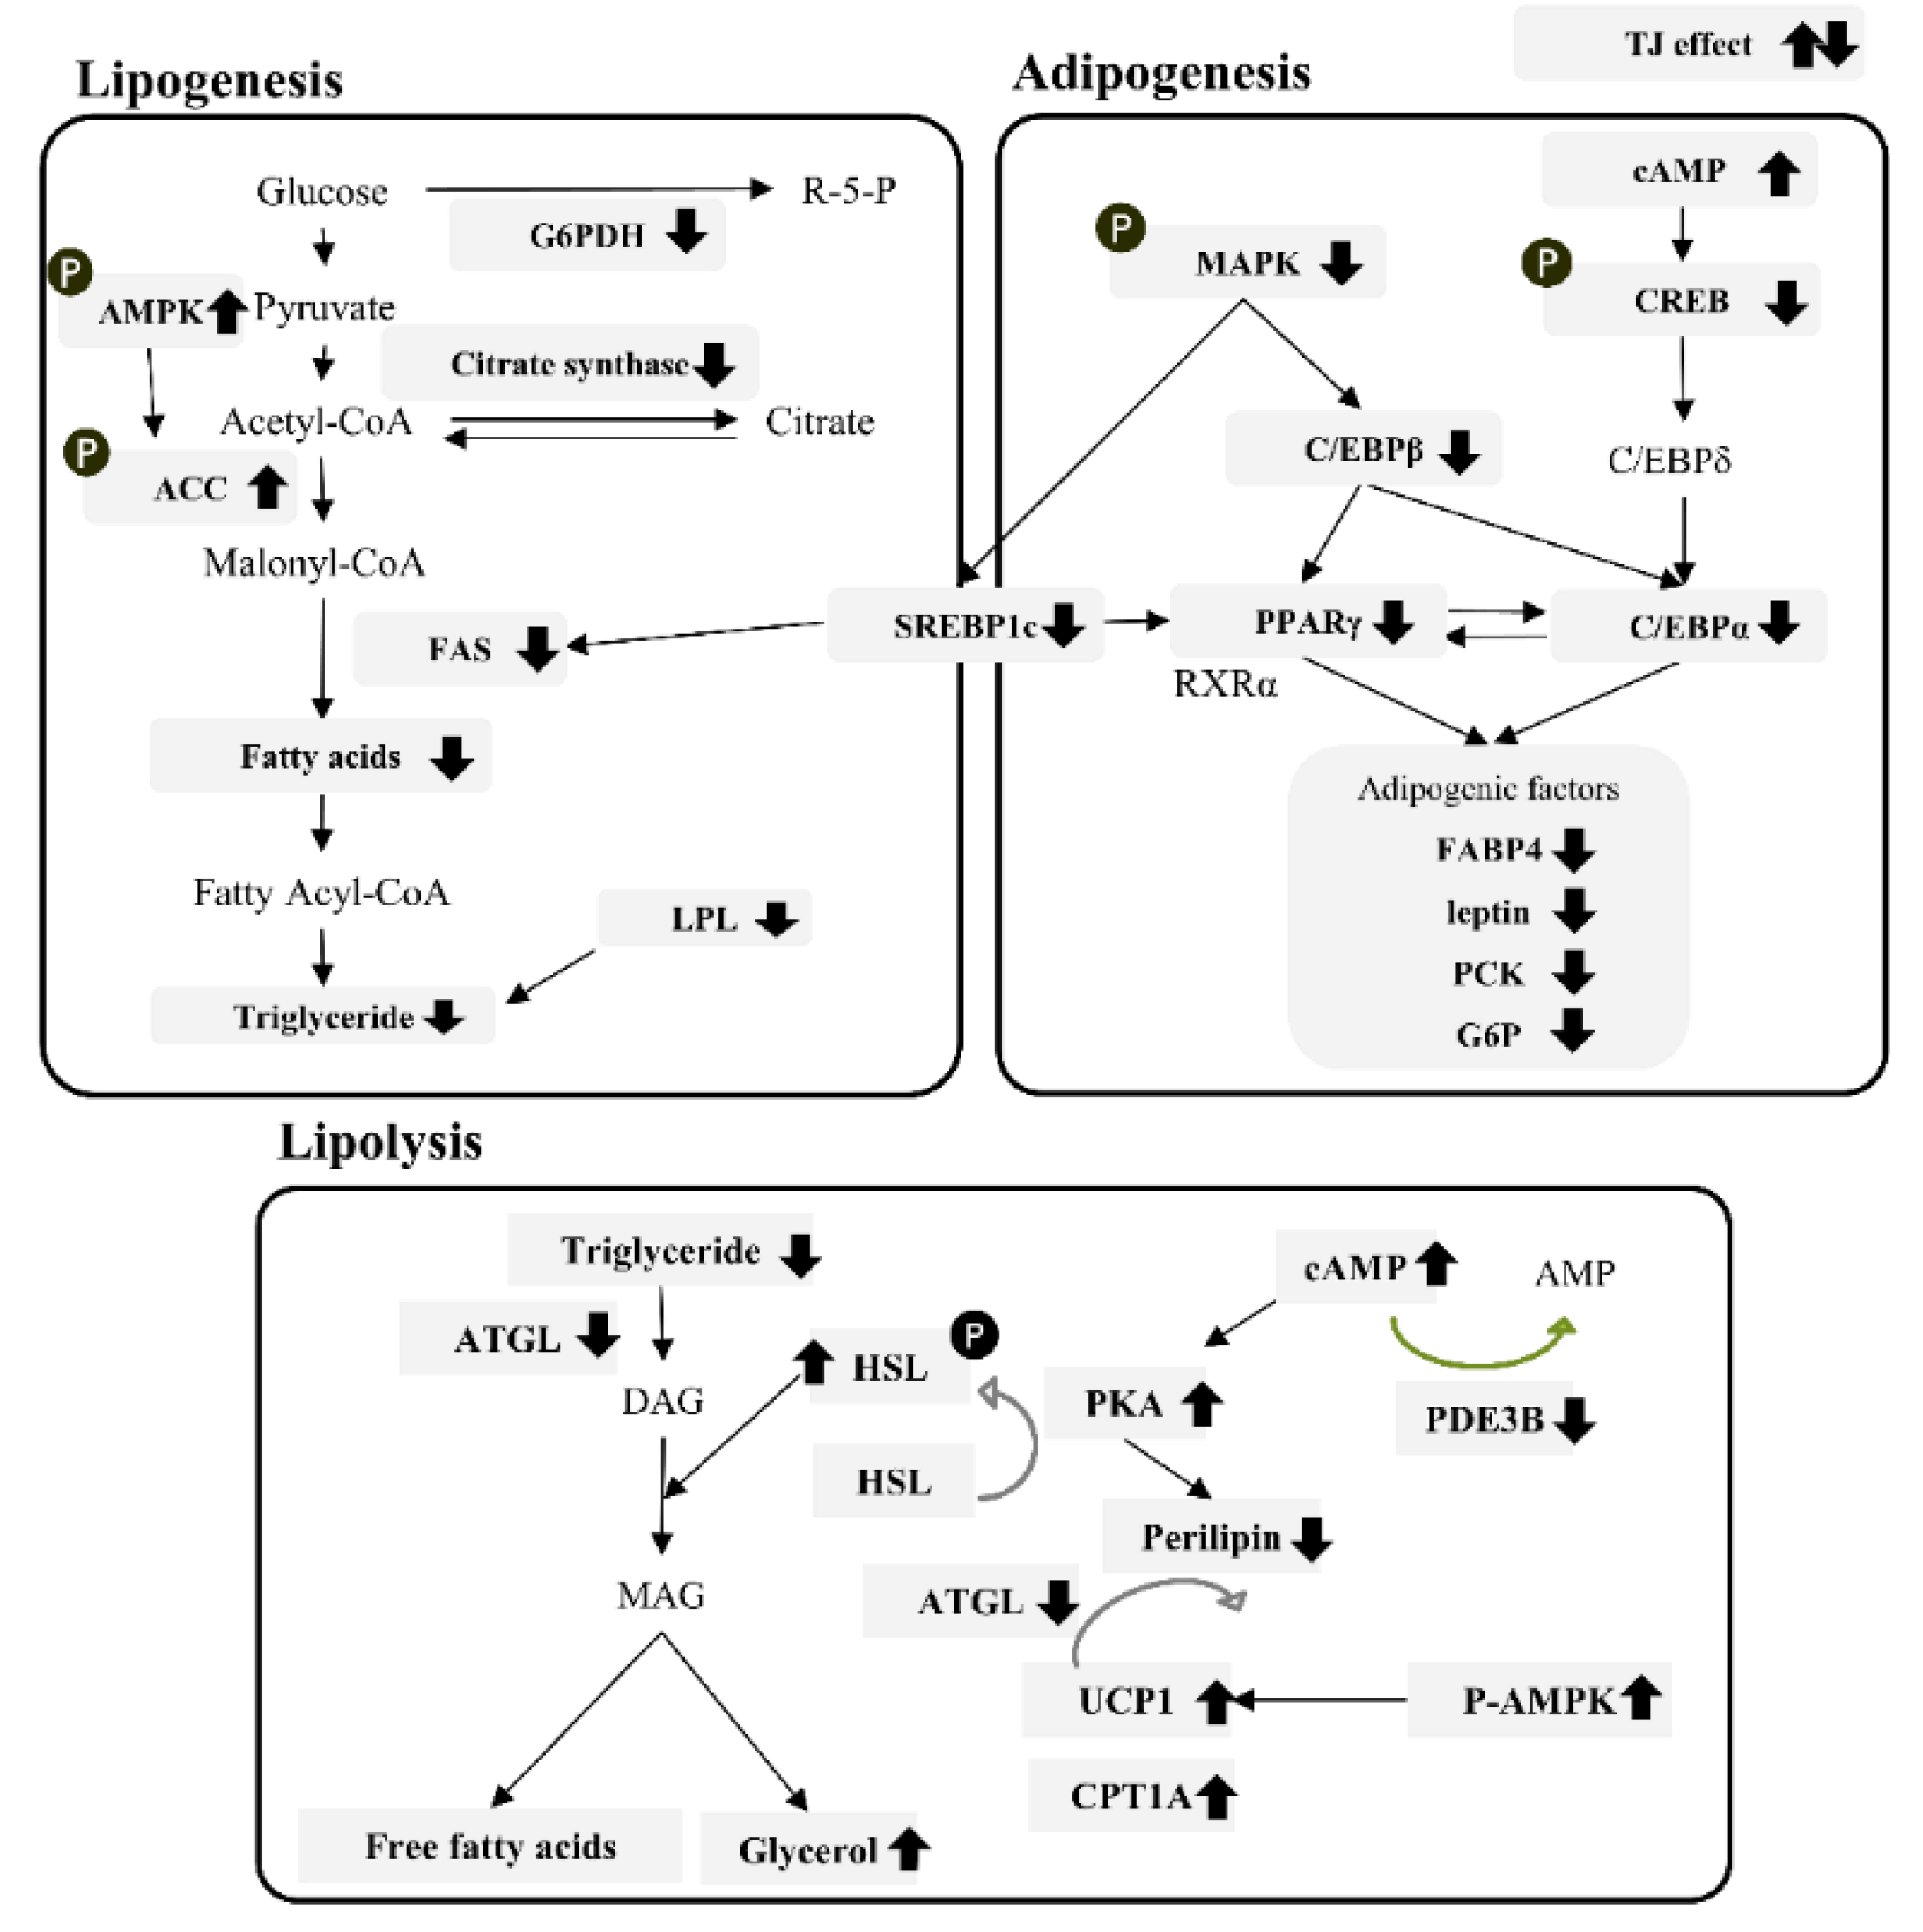
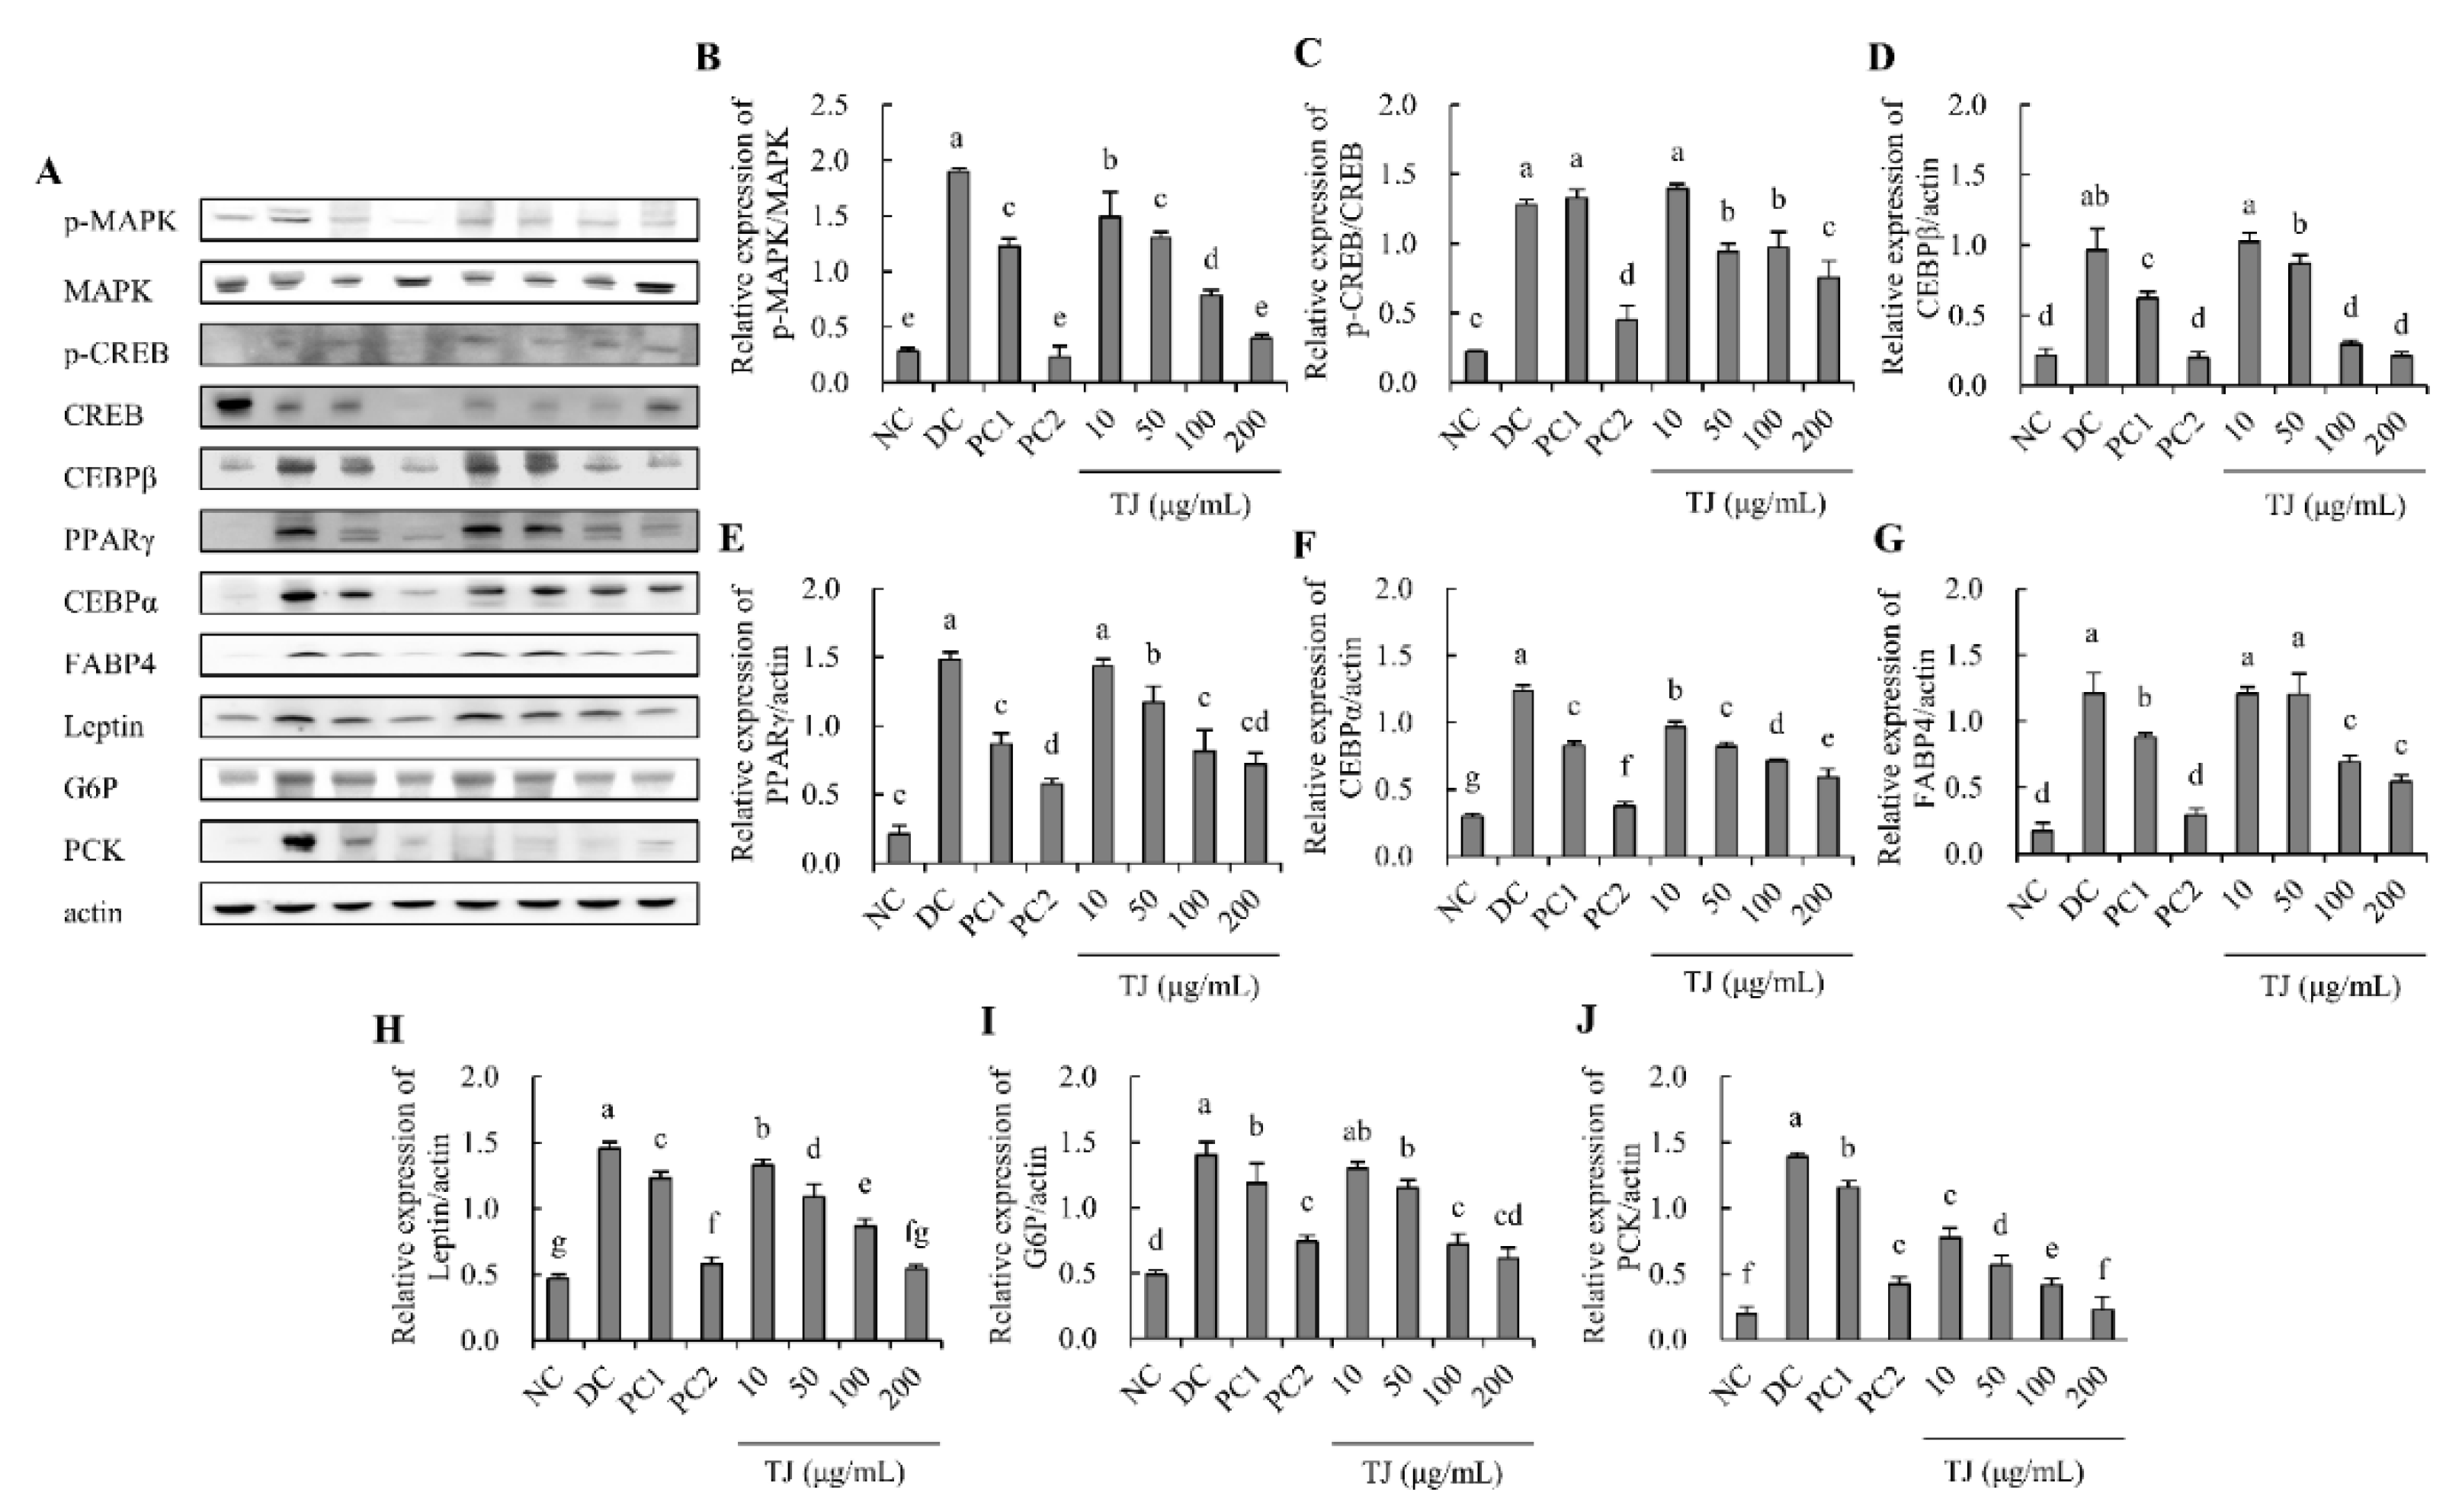
3.4. The TJ Regulated the Protein Expression Levels Related to the Adipogenesis Mechanism in Differentiated 3T3-L1 Cells

Upon measuring the protein expression level related to the mechanism of suppressing adipogenesis, the phospho-MAPK/MAPK ratio was significantly reduced in the TJ 10, 50, 100, and 200 μg/mL groups (1.49 ± 0.23, 1.30 ± 0.06, 0.78 ± 0.06, and 0.40 ± 0.03, respectively) in a dose-dependent manner relative to that of the DC group (1.90 ± 0.03) (Figure 4A,B). The phospho-CREB/CREB ratio was significantly reduced in the TJ 10, 50, 100, and 200 μg/mL groups (1.40 ± 0.03, 0.94 ± 0.06, 0.97 ± 0.11, and 0.75 ± 0.12, respectively) in a dose-dependent manner relative to that of the DC group (1.28 ± 0.03) (Figure 4A,C). The C/EBPβ/actin ratio was significantly reduced in the TJ 10, 50, 100, and 200 μg/mL groups (1.02 ± 0.06, 0.87 ± 0.06, 0.29 ± 0.03 and 0.21 ± 0.03, respectively) in a dose-dependent manner relative to that of the DC group (0.96 ± 0.15) (Figure 4A,D). The PPARγ/actin ratio was significantly reduced in the TJ 10, 50, 100, and 200 μg/mL groups (1.43 ± 0.05, 1.17 ± 0.12, 0.81 ± 0.15, and 0.72 ± 0.08, respectively) in a dose-dependent manner relative to that of the DC group (1.48 ± 0.05) (Figure 4A,E). The C/EBPα/actin ratio was significantly reduced in the TJ 10, 50, 100, and 200 μg/mL groups (0.97 ± 0.04, 0.82 ± 0.03, 0.71 ± 0.02, and 0.59 ± 0.06, respectively) in a dose-dependent manner relative to that of the DC group (1.23 ± 0.05) (Figure 4A,F). The FABP4/actin ratio was significantly reduced in the TJ 10, 50, 100, and 200 μg/mL groups (1.21 ± 0.05, 1.20 ± 0.15, 0.69 ± 0.05, and 0.54 ± 0.05, respectively) in a dose-dependent manner relative to that of the DC group (1.21 ± 0.15) (Figure 4A,G). The leptin/actin ratio was significantly reduced in the TJ 10, 50, 100, and 200 μg/mL groups (1.33 ± 0.05, 1.09 ± 0.10, 0.87 ± 0.05, and 0.54 ± 0.03, respectively) in a dose-dependent manner relative to that of the DC group (1.46 ± 0.05) (Figure 4A,H). The G6P/actin ratio was significantly reduced in the TJ 10, 50, 100, and 200 μg/mL groups (1.30 ± 0.05, 1.15 ± 0.06, 0.72 ± 0.08, and 0.61 ± 0.08, respectively) in a dose-dependent manner relative to that of the DC group (1.40 ± 0.10) (Figure 4A,I). The PCK/actin ratio was significantly reduced in the TJ 10, 50, 100, and 200 μg/mL groups (0.77 ± 0.07, 0.57 ± 0.07, 0.41 ± 0.05, and 0.22 ± 0.10, respectively) in a dose-dependent manner relative to that of the DC group (1.39 ± 0.03) (Figure 4A,J).

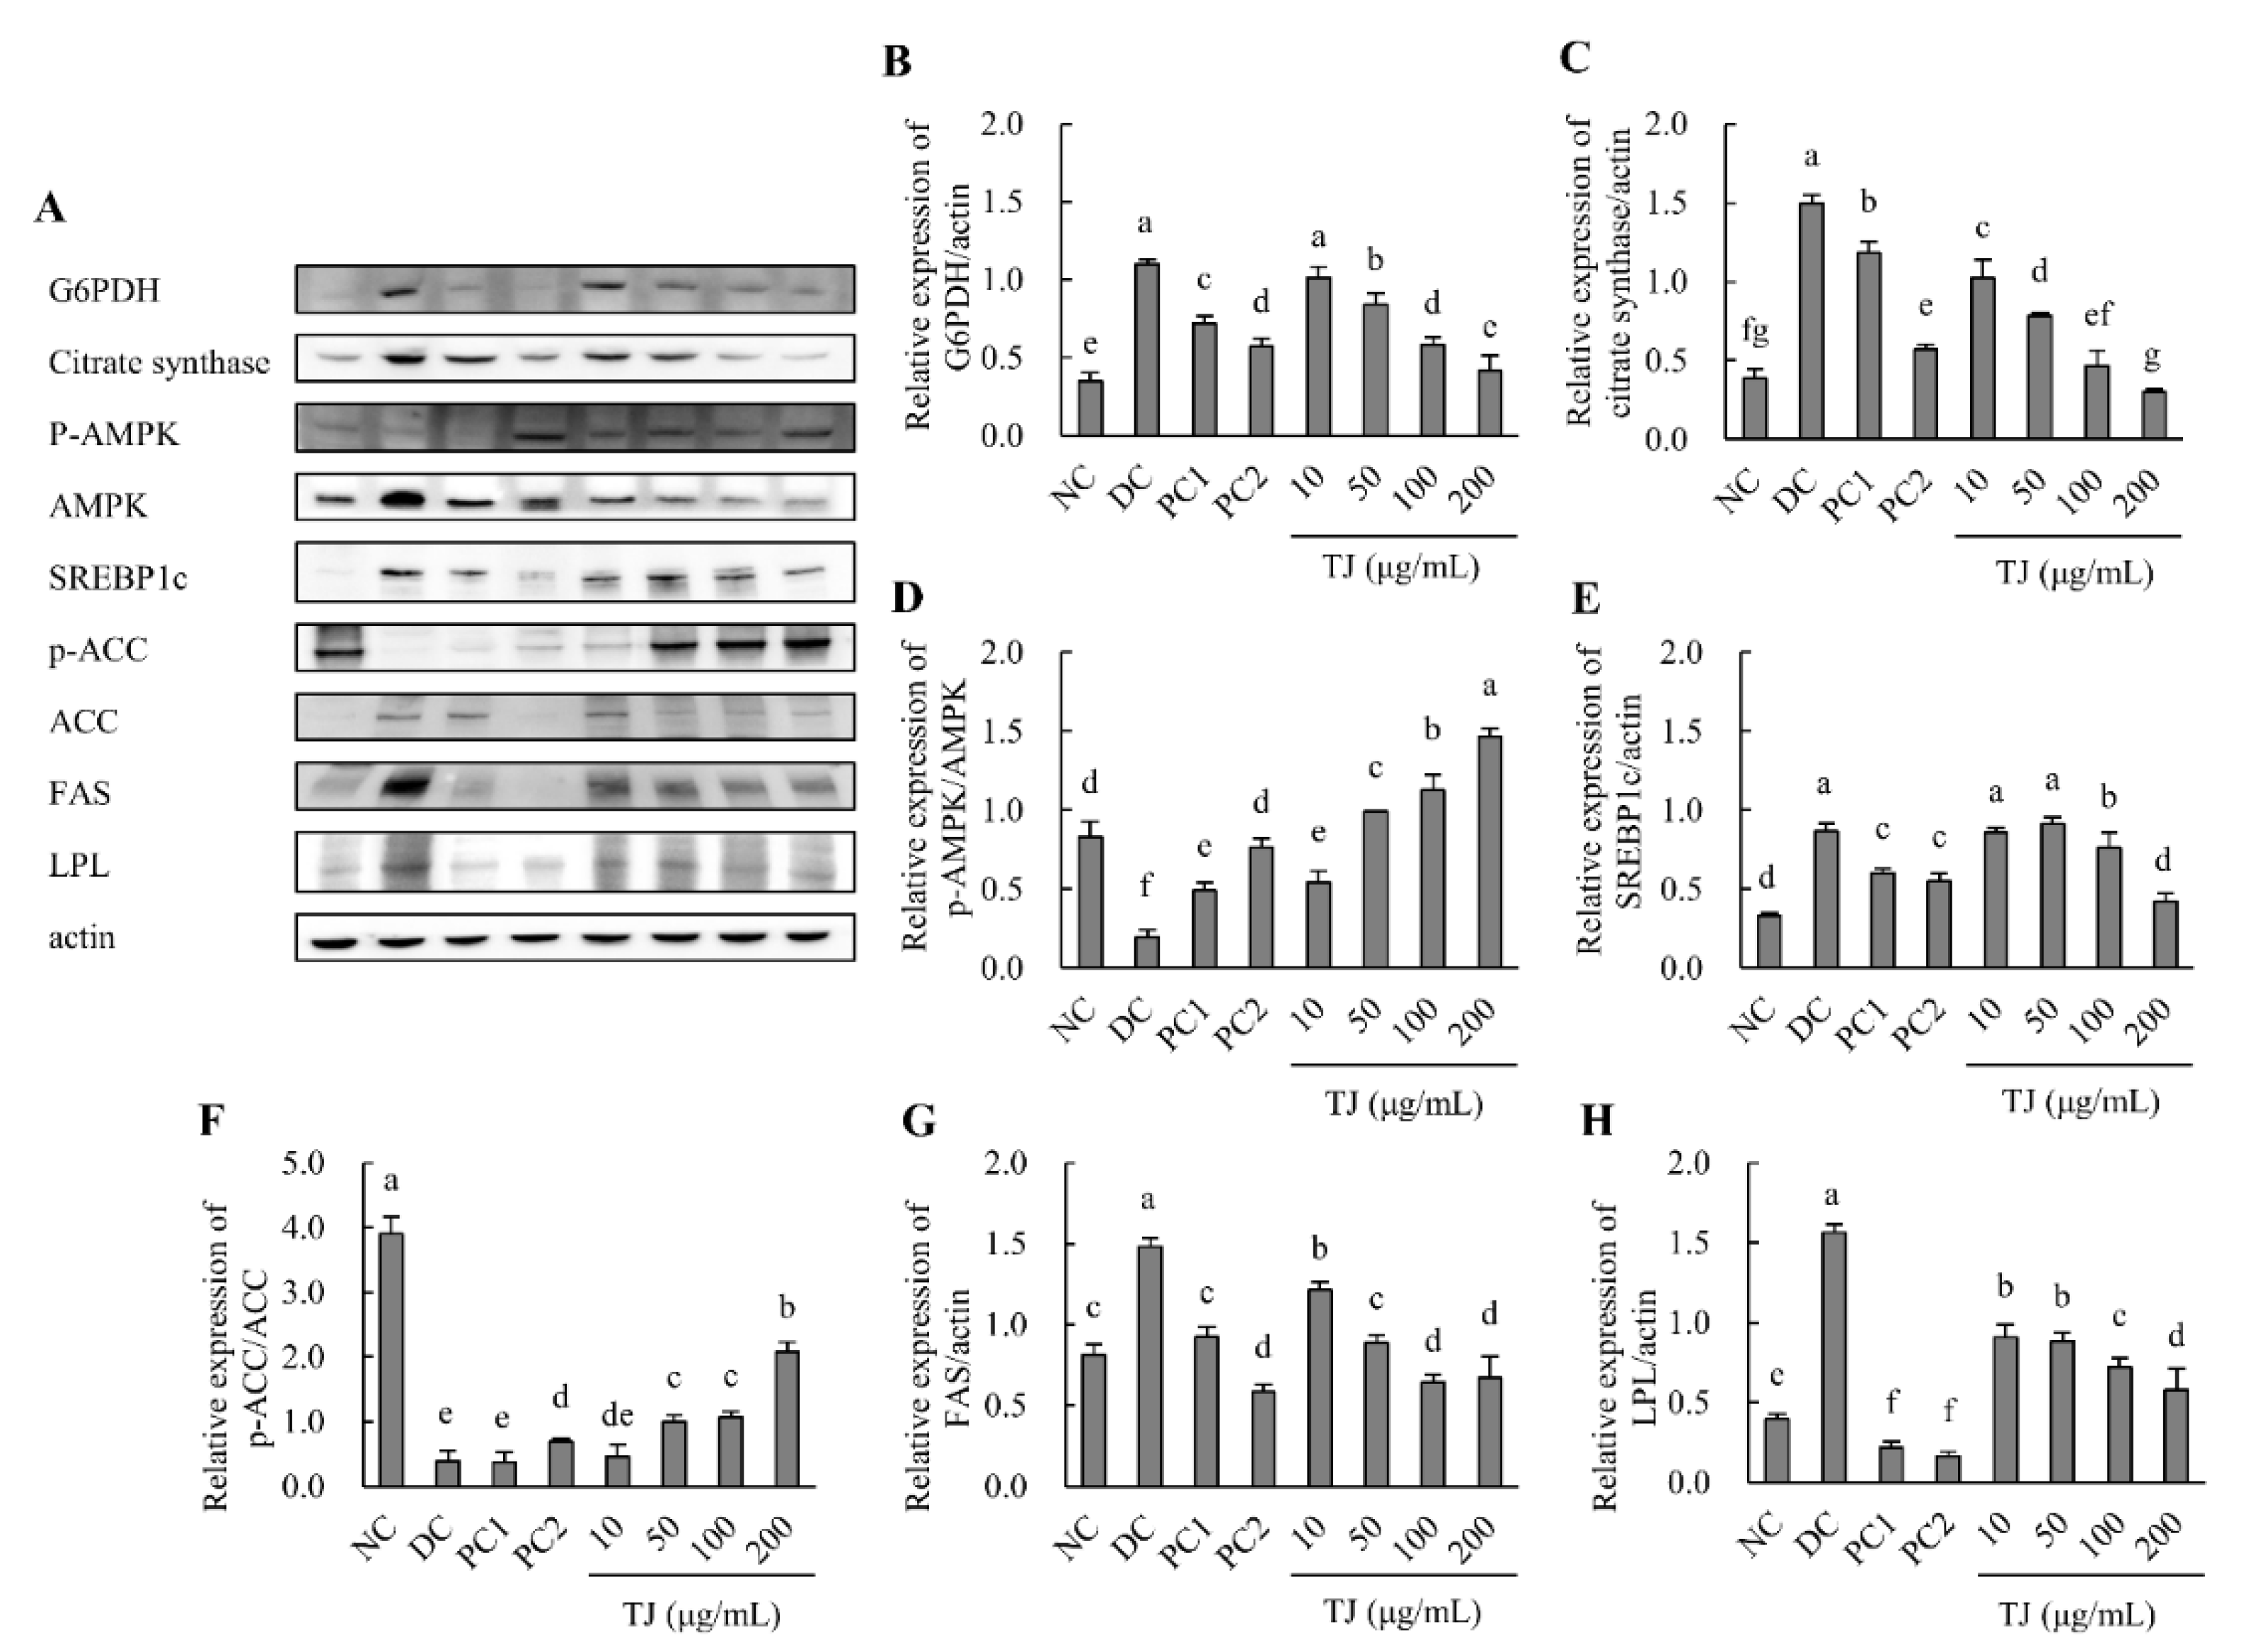
3.5. The TJ Regulated the Protein Expression Levels Related to the Lipogenesis Mechanism in Differentiated 3T3-L1 Cells

Upon measuring the protein expression level related to the mechanism of suppressing lipogenesis, the G6PDH/actin ratio was significantly reduced in the TJ 10, 50, 100, and 200 μg/mL groups (1.01 ± 0.10, 0.84 ± 0.04, 0.58 ± 0.05, and 0.41 ± 0.04, respectively) in a dose-dependent manner relative to that of the DC group (1.10 ± 0.05) (Figure 5A,B). The citrate synthase/actin ratio was significantly reduced in the TJ 10, 50, 100, and 200 μg/mL groups (1.02 ± 0.12, 0.78 ± 0.02, 0.47 ± 0.10, and 0.30 ± 0.02, respectively) in a dose-dependent manner relative to that of the DC group (1.50 ± 0.05) (Figure 5A,C). The phopho-AMPK/AMPK ratio was significantly increased in the TJ 10, 50, 100, and 200 μg/mL groups (0.54 ± 0.07, 0.99 ± 0.01, 1.13 ± 0.10 and 1.47 ± 0.05, respectively) in a dose-dependent manner relative to that of the DC group (0.20 ± 0.05) (Figure 5A,D). The SREBP1c/actin ratio was significantly reduced in the TJ 10, 50, 100, and 200 μg/mL groups (0.86 ± 0.03, 0.91 ± 0.04, 0.76 ± 0.10, and 0.42 ± 0.05, respectively) in a dose-dependent manner relative to that of the DC group (0.87 ± 0.05) (Figure 5A,E). The phospho-ACC/ACC ratio was significantly increased in the TJ 10, 50, 100, and 200 μg/mL groups (0.46 ± 0.17, 1.00 ± 0.10, 1.07 ± 0.09, and 2.08 ± 0.15, respectively) in a dose-dependent manner relative to that of the DC group (0.39 ± 0.15) (Figure 5A,F). The FAS/actin ratio was significantly reduced in the TJ 10, 50, 100, and 200 μg/mL groups (1.22 ± 0.05, 0.89 ± 0.05, 0.64 ± 0.05, and 0.67 ± 0.13, respectively) in a dose-dependent manner relative to that of the DC group (1.48 ± 0.05) (Figure 5A,G). The LPL/actin ratio was significantly reduced in the TJ 10, 50, 100, and 200 μg/mL groups (0.91 ± 0.08, 0.88 ± 0.05, 0.72 ± 0.06, and 0.58 ± 0.14, respectively) in a dose-dependent manner relative to that of the DC group (1.56 ± 0.05) (Figure 5A,H).

3.6. The Effects of the TJ in the cAMP Level, Intracellular FA, TG, and Glycerol Release Related to the Lipolysis Mechanism in Differentiated 3T3-L1 Cells

As a result of measuring the level of cAMP acting on the process of lipolysis in differentiated 3T3-L1 cells, we confirmed that in the DC group (701.7 ± 10.0 pmol/mL), there were significant differences compared to that of the NC group (1071.7 ± 60.4 pmol/mL). Moreover, PC1 (1299.7 ± 63.5 pmol/mL), PC2 (1775.0 ± 69.1 pmol/mL), and TJ groups (10: 685.7 ± 50.0 pmol/mL, 50: 936.0 ± 67.4 pmol/mL, 100: 1153.3 ± 45.4 pmol/mL, 200: 1320.3 ± 58.1 pmol/mL, respectively) showed significant increases compared to that of the DC group (Figure 6A). The intracellular FA levels of PC1 (282.1 ± 19.2 nmol/μL), PC2 (170.0 ± 2.1 nmol/μL), and TJ groups (10: 266.5 ± 6.1 nmol/μL, 50: 243.3 ± 10.5 nmol/μL, 100: 220.8 ± 10.9 nmol/μL, 200: 196.5 ± 4.5 nmol/μL, respectively) significantly decreased compared to that of the DC group (282.1 ± 19.2 nmol/μL) (Figure 6B). As a result of testing the TG content, we found that the level of the DC group (13.0 ± 0.9 mM) significantly increased compared to that of the NC group (2.9 ± 0.3 mM). On the other hand, in the PC1 (8.4 ± 0.5 mM), PC2(6.4 ± 1.1 mM), and TJ groups (10: 12.4 ± 0.4 mM, 50: 11.8 ± 0.4 mM, 100: 10.1 ± 0.1 mM, 200: 8.9 ± 0.6 mM, respectively), they significantly decreased relative to that of the DC group (Figure 6C). Upon testing the glycerol release, we found that in the PC1 (0.96 ± 0.08 μg/mL), PC2 (1.14 ± 0.05 μg/mL), and TJ groups (10: 0.23 ± 0.03 μg/mL, 50: 0.41 ± 0.13 μg/mL, 100: 0.61 ± 0.05 μg/mL, 200: 0.88 ± 0.08 μg/mL, respectively), they significantly increased relative to that of the DC group (0.20 ± 0.04 μg/mL) (Figure 6D).

3.7. The TJ Inhibited the Lipid Accumulation Related to the Lipolysis Mechanism in Differentiated 3T3-L1 Cells

As a result of measuring the lipid accumulation on the process of lipolysis in differentiated 3T3-L1 cells by conducting Oil Red O staining, we confirmed that the OD value of the DC group (1.31 ± 0.02) significantly increased relative to that of the NC group (0.07 ± 0.01). Furthermore, the result of the PC1 (0.87 ± 0.05), PC2 (0.56 ± 0.07), and TJ groups (10: 1.10 ± 0.10, 50: 0.95 ± 0.04, 100: 0.77 ± 0.05, 200: 0.68 ± 0.07) significantly decreased in a dose-dependent manner relative to the DC group (Figure 7A,B).

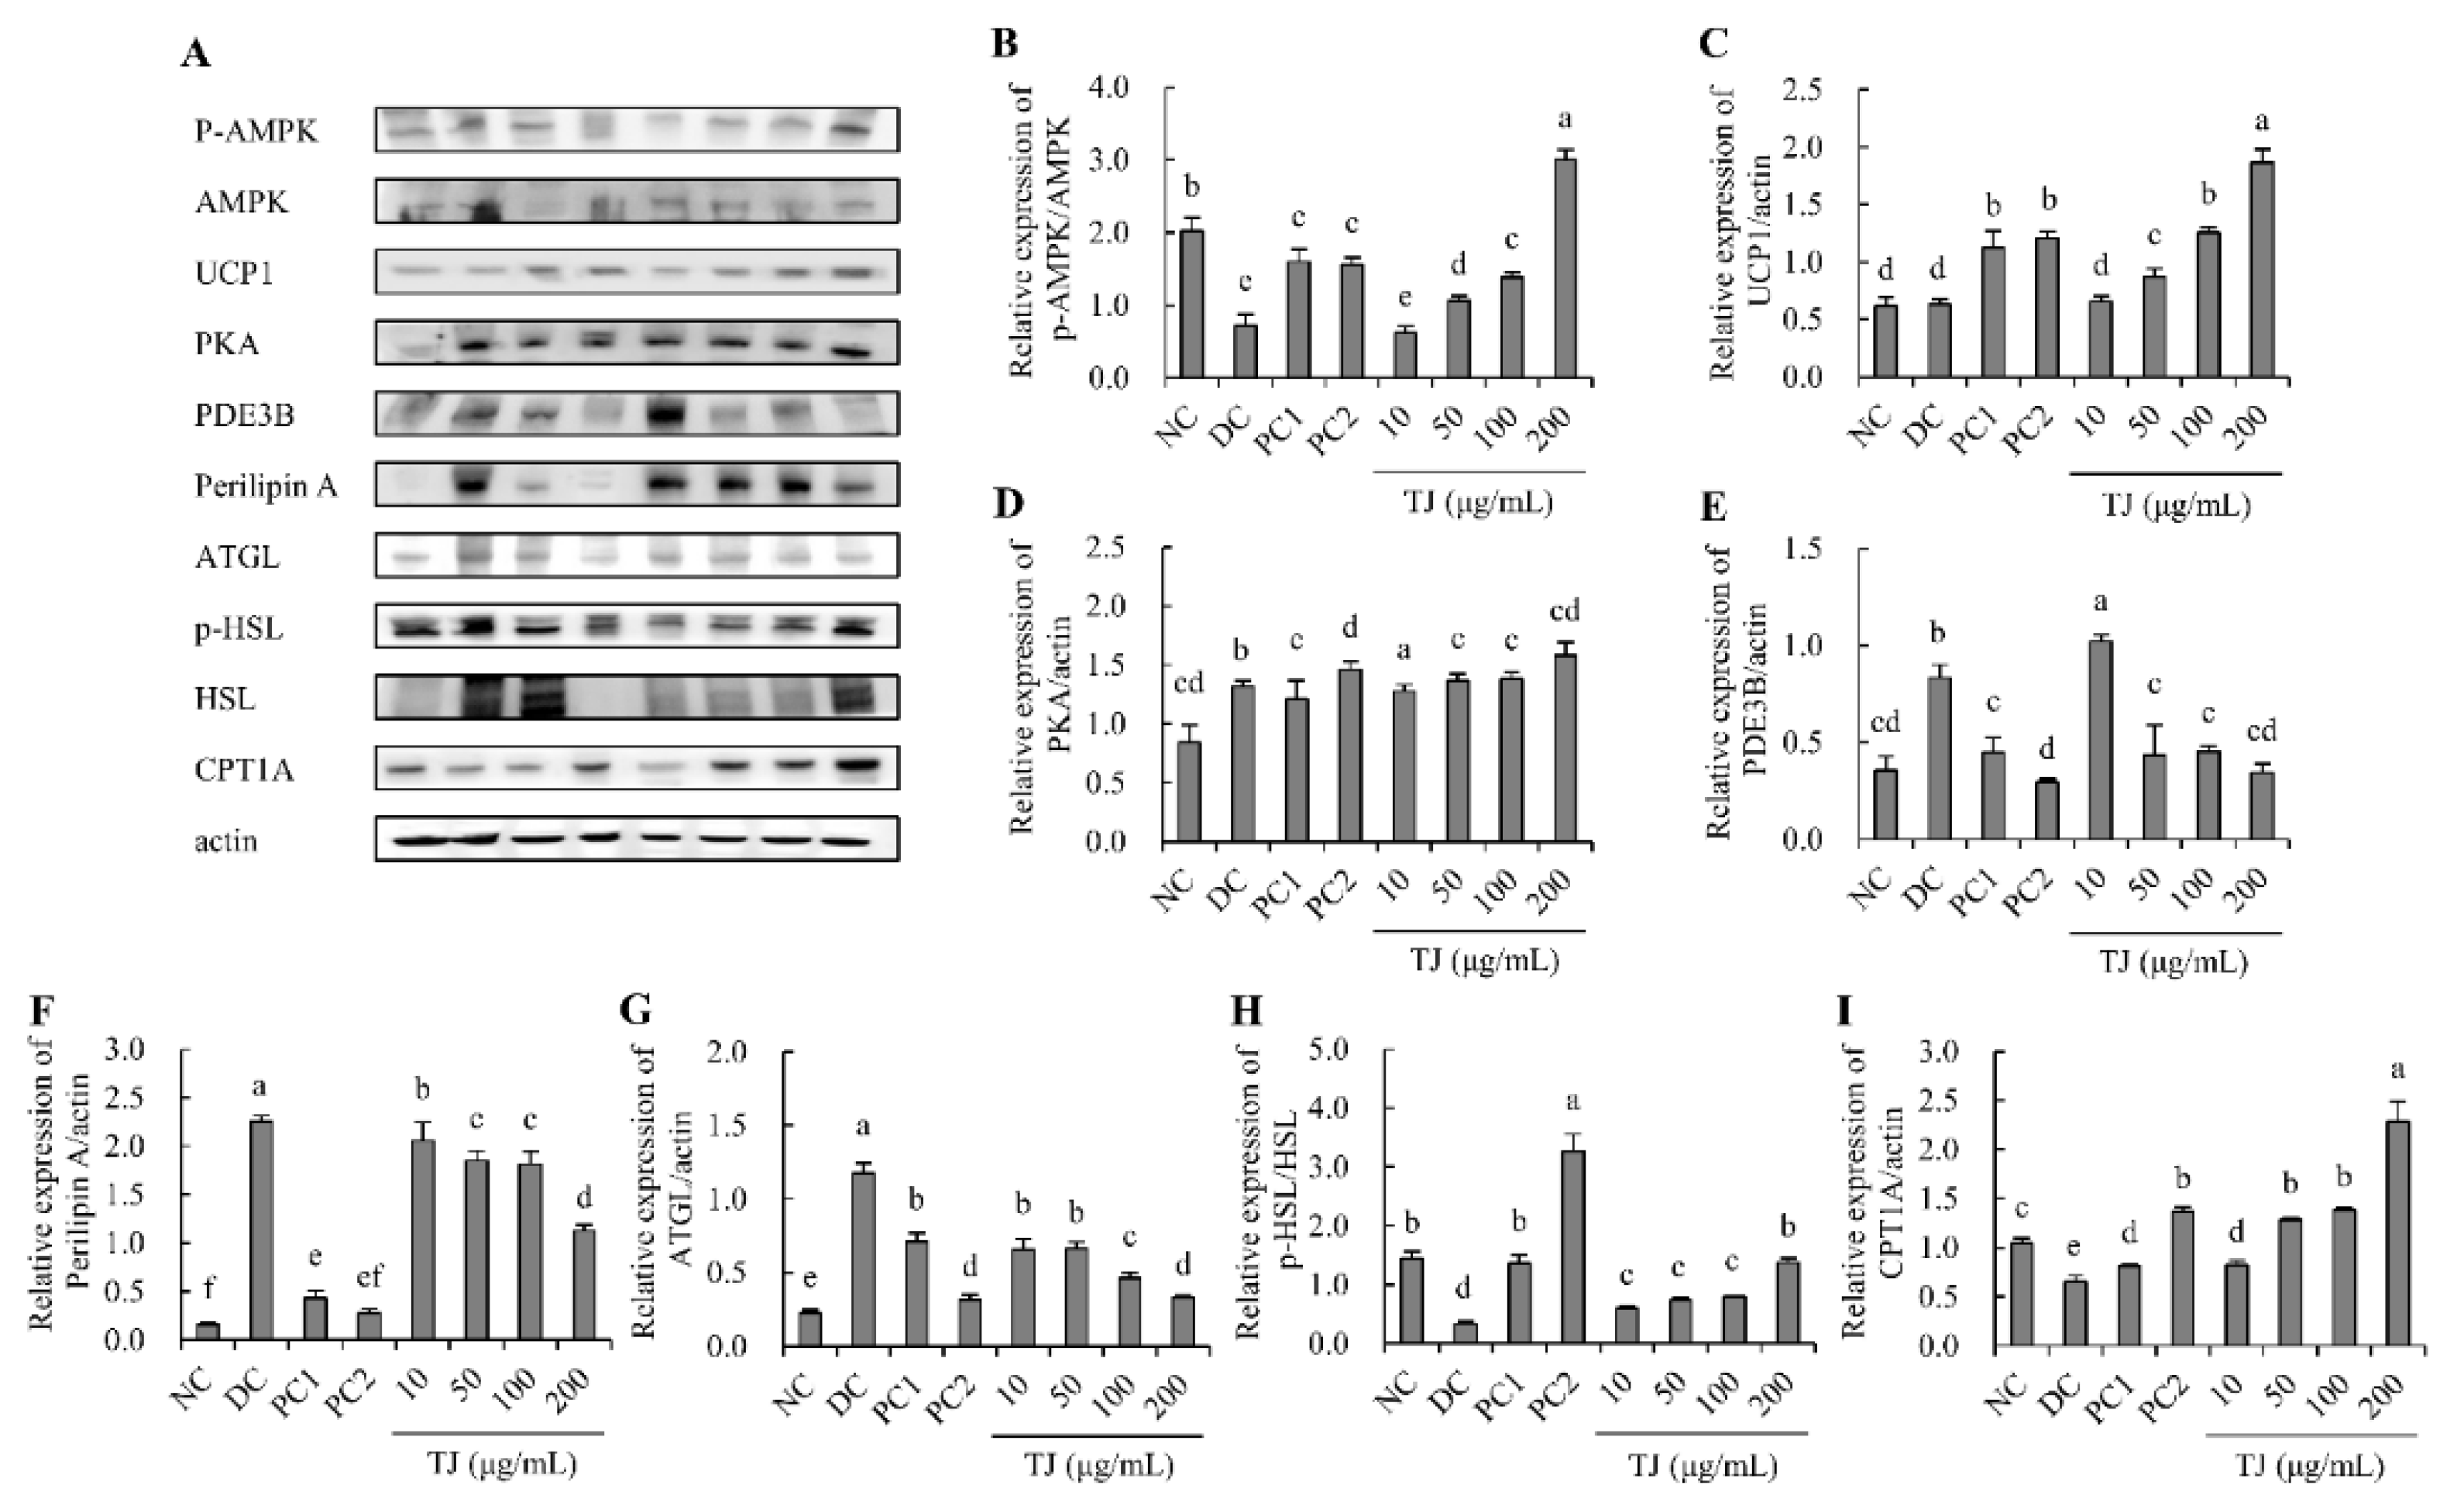
3.8. The TJ Regulated the Protein Expression Levels Related to the Lipolysis Mechanism in Differentiated 3T3-L1 Cells

Upon measuring the protein expression level related to the mechanism of lipolysis, the phospho-AMPK/AMPK ratio was significantly increased in the TJ 10, 50, 100, and 200 μg/mL groups (0.62 ± 0.09, 1.07 ± 0.06, 1.38 ± 0.08 and 3.00 ± 0.14, respectively) in a dose-dependent manner relative to that of the DC group (0.72 ± 0.15) (Figure 8A,B). The UCP1/actin ratio was significantly increased in the TJ 10, 50, 100, and 200 μg/mL groups (0.65 ± 0.05, 0.87 ± 0.07, 1.25 ± 0.05 and 1.87 ± 0.11, respectively) in a dose-dependent manner relative to that of the DC group (0.63 ± 0.05) (Figure 8A,C). The PKA/actin ratio was significantly increased in the TJ 10, 50, 100, and 200 μg/mL groups (1.28 ± 0.05, 1.36 ± 0.06, 1.38 ± 0.06, and 1.58 ± 0.11, respectively) relative to that of the DC group (0.32 ± 0.05) (Figure 8A,D). The PDE3B/actin ratio was significantly reduced in the TJ 50, 100, and 200 μg/mL groups (0.43 ± 0.16, 0.45 ± 0.03 and 0.34 ± 0.05, respectively) in a dose-dependent manner relative to that of the DC group (0.83 ± 0.07) (Figure 8A,E). The perilipin A/actin ratio was significantly decreased in the TJ 10, 50, 100, and 200 μg/mL groups (2.06 ± 0.19, 1.85 ± 0.10, 1.81 ± 0.13, and 1.13 ± 0.06, respectively) relative to that of the DC group (2.25 ± 0.06) (Figure 8A,F). The ATGL/actin ratio was significantly reduced in the TJ 10, 50, 100, and 200 μg/mL groups (0.66 ± 0.07, 0.66 ± 0.05, 0.46 ± 0.04 and 0.33 ± 0.02, respectively) in a dose-dependent manner relative to that of the DC group (1.17 ± 0.07) (Figure 8A,G). The phopho-HSL/HSL ratio was significantly increased in the TJ 10, 50, 100, and 200 μg/mL groups (0.60 ± 0.04, 0.74 ± 0.05, 0.79 ± 0.02, and 1.38 ± 0.07, respectively) relative to that of the DC group (0.33 ± 0.04) (Figure 8A,H). The CPT1A/actin ratio was significantly increased in the TJ 10, 50, 100, and 200 μg/mL groups (0.82 ± 0.05, 1.28 ± 0.02, 1.38 ± 0.02, and 2.28 ± 0.21, respectively) relative to that of the DC group (0.65 ± 0.06) (Figure 8A,I).

4. Discussion

Excessive fat accumulation in the body leads to a disease we call ‘obesity’, which is affected by changes in various economic, lifestyle, and nutritional conditions, and can be exposed to obesity and related diseases in all life cycles [21,22]. In addition, in the recent health functional food market, demand and interest in weight control foods for a healthy and ideal body is peaking. To satisfy these demands, research on the development of various natural materials that suppress fat accumulation or help in weight control is actively conducted [23,24,25]. TJ is a plant that is widely distributed in Asian countries and some Western countries and has been widely used for medicinal purposes [26]. In addition, according to a recent investigation, active substances such as polyphenols, trapain, 1,2,3,6-tetra-O-galloyl-β-d-glucopyranose, and eugeniin were found in TJ [16]. In particular, the antidiabetic effect of TJ was prominent among several studies [27], and the result of controlling glucose metabolism is expected to be effective in the prevention or treatment of obesity. In our preliminary study, we confirmed the presence of ellagic acid in a component analysis test of TJ (data not shown). Ellagic acid is a dimeric derivative of gallic acid that is found in woody plants, nuts, grapes, and berries [28]. It is reported to exhibit key biological activities such as radical scavenging, chemoprevention, and antiviral [29]. Our study aimed to determine whether TJ exerts effects on the adipogenesis, lipogenesis, and lipolysis mechanisms of differentiated 3T3-L1 cells. Prior to this experiment, we conducted a cell viability test. 3T3-L1 cells treated with TJ were confirmed to be non-toxic up to the maximum concentration (200 μg/mL) used in the main experiment. Furthermore, we used green tea catechin as a positive control in this experiment. Green tea is one of the most popular teas in Asia and is known as a drink useful for weight control [30]. One of its active ingredients, catechin, has been reported as a substance that promotes fat oxidation, regulates body composition, and inhibits fat synthesis in the 3T3-L1 cell model [31].
To clarify the effect of the TJ on the adipogenesis and lipogenesis mechanisms during the differentiation period of adipocytes, we confirmed the expression and activity levels of adipogenesis- and lipogenesis-related proteins. Adipogenesis is the progress by which the differentiation of 3T3-L1 cells (preadipocytes) matures into adipocytes [32]. It begins with a reduction in cAMP levels and activation of CREB, which stimulates the expression of transcription factors such as PPARγ and C/EBPa [33]. Adipogenesis is regulated by these transcription factors that are also called the master regulators in the final step of differentiation [34]. PPARγ, called a ligand-activated transcription factor, can induce the expression of C/EBPa, which in turn mediates the expression levels of adipogenesis-related genes, including adiponectin, FABP4, G6Pase, and leptin [35,36]. In our previous study, we confirmed that the activity of cAMP and MAPK decreased in the adipogenesis-induced model, and the expression levels of C/EBPβ, C/EBPa, and PPARγ increased when adipocytes were differentiated [20]. In the present study, TJ increased cAMP activity and decreased the protein levels of CREB, C/EBPβ, C/EBPa, and PPARγ compared to the differentiation induction group. Due to this, the protein levels of FABP4, leptin, and G6Pase were also regulated.
In the lipogenesis mechanism, SREBP1c with various functions plays a crucial role. It stimulates ligands for nuclear receptors and PPARγ and regulates FA synthesis by activating lipogenesis-related factors, including ACC and FAS [37,38,39]. ACC is the rate-limiting enzyme in de novo FA synthesis and has been reported to be the enzyme responsible for the production of malonyl-CoA [40,41]. It has been reported that AMPK acts as an energy sensor that regulates lipid metabolism in cells, and the active form suppresses adipogenesis by down-regulating the expression of SREBP1c [42,43]. In addition, LPL is also an important factor in lipogenesis metabolism because it is also involved in FA synthesis and lipoprotein metabolism [44]. In the present study, TJ decreased the expression of SREBP1c by activating AMPK compared to the control group. In addition, it induced the activity of ACC and decreased the protein expression of FAS and LPL, thereby reducing the intracellular FA level. These results also affected the reduction in lipid accumulation, leading to a decrease in TG.
In the lipolysis mechanism, cAMP levels are regulated by the expression of PDE3B, and the PDE3 gene forms encode the PDE3A and 3B forms that act in the process of decomposing cAMP to 5′AMP. PDE3B is expressed in insulin-sensitive cells, such as hepatocytes, pancreatic β-cells, while adipocytes play a key role in glycogenolysis and lipolysis mechanisms. Lipolysis is mainly stimulated by the activation of the cAMP-PKA pathway, and since a decrease in the expression of PDE3B is related to a decrease in the hydrolysis of cAMP, the cAMP-PKA pathway can be stimulated [12,45]. In the next step, HSL and perilipin are phosphorylated by activation of PKA. This step is related to the efficiency of lipolysis: HSL migrates from the cytoplasm to the lipid droplets and activates this step, which ultimately affects the hydrolysis of TG [11,13,46]. Perilipin exists in the form of surrounding lipid droplets and can protect TG from several lipolytic enzymes [13,47]. It has been reported that an absence or decrease in the level of perilipin promotes basal lipolysis [46,47]. As a result of confirming the effect of TJ on the lipolysis mechanism using our established experimental model, TJ treatment increased cAMP levels and decreased the expression of PDE3B compared to the differentiation control group. In addition, TJ reduced the expression of ATGL, increased the expression levels of PKA, activated AMPK and HSL phosphorylation, and decreased the perilipin in the adipocytes. Furthermore, TJ reduced the intracellular FA content compared to that of the differentiation control group. This led to the reduction in TG content, and glycerol release was finally induced to promote lipolysis.
In our study, we evaluated the anti-obesity effect of Chinese TJ (extracted with 20% ethyl alcohol), which had not been attempted before, by various mechanisms. Although there have been reports of previously known adipogenesis inhibitory effects of TJ [15], we expected that the efficacy would be different depending on the country of origin and extraction process, and in order to open the possibility of future development as a health functional food, we evaluated the maximum effective dose within the range of non-toxicity. Although there were limitations to the markers showing effects at high concentrations, we differentiated them by identifying various factors of the mechanism extending to the previously unreported lipogenesis inhibitory activity and lipolysis activity of TJ. In addition, as a result of the comparison with green tea catechin, some markers showed similar effects at the same concentration (200 μg/mL), and in the case of other markers, a limitation was found that did not show as much effect as catechin. However, it will continue to be tested through additional studies on TJ, and we intend to leave the possibility open even to clinical studies.

5. Conclusions

In conclusion, TJ regulated the expression of adipogenesis-related proteins by reducing the expression of transcription factors at the cellular level. In the lipogenesis models, related factors in the lipogenesis mechanism were regulated through SREBP1c and acetyl-CoA, while TG and FA production, as well as glycerol release, were also finally regulated. Notably, TJ not only regulated the expression levels of AMPK and ATGL in the lipolysis mechanism but also activated the cAMP-PKA pathway to regulate protein levels, leading to degradation of TG (Figure A1). Given that the effect of TJ on adipogenesis, lipogenesis, and lipolysis mechanisms in vitro have been substantiated, we expect that it will be developed as a natural agent to prevent obesity.

Author Contributions

Conceptualization, S.-J.P. and J.L.; methodology, S.-J.P. and M.L.; validation, K.-Y.K., S.S. and M.-W.C.; formal analysis, S.-J.P., M.L. and E.-J.H.; writing—original draft, S.-J.P.; writing—review and editing, S.-J.P., S.S., M.-W.C. and J.L.; visualization, S.-J.P., M.L. and E.-J.H.; supervision, S.-J.P., K.-Y.K. and J.L. All authors have read and agreed to the published version of the manuscript.

Funding

This work was supported by the Technology Development Program (S2870418), funded by the Ministry of SMEs and Startups (MSS, Korea).

Institutional Review Board Statement

Not applicable.

Informed Consent Statement

Not applicable.

Conflicts of Interest

The authors declare no conflict of interest.

Appendix A

Figure A1. Effects of TJ on adipogenesis, lipogenesis, and lipolysis mechanisms of 3T3-L1 adipocytes.
Applsci 12 00290 g0a1

References

  1. Lavie, C.J.; Pandey, A.; Lau, D.H.; Alpert, M.A.; Sander, P. Obesity and atrial fibrillation prevalence, pathogenesis, and prognosis: Effects of weight loss and exercise. J. Am. Coll. Cardiol. 2017, 70, 2022–2035. [Google Scholar] [CrossRef] [PubMed]
  2. Taylor, V.H.; Forhan, M.; Vigod, S.N.; Mclntyre, R.S.; Morrison, K.M. The impact of obesity on quality of life. Best Pract. Res. Clin. Endocrinol. Metab. 2013, 27, 139–146. [Google Scholar] [CrossRef] [PubMed]
  3. Nepali, S.; Cha, J.-Y.; Ki, H.-H.; Lee, H.-Y.; Kim, Y.-H.; Kim, D.-K.; Song, B.-J.; Lee, Y.-M. Chrysanthemum indicum inhibits adipogenesis and activates the AMPK pathway in high-fat-diet-induced obese mice. Am. J. Chin. Med. 2018, 46, 119–136. [Google Scholar] [CrossRef]
  4. Kanneganti, T.-D.; Dixit, V.D. Immunological complications of obesity. Nut. Immunol. 2012, 13, 707–712. [Google Scholar] [CrossRef] [PubMed]
  5. Deutsch, A.; Feng, D.; Pessin, J.E.; Shinoda, K. The impact of single-cell genomics on adipose tissue research. Int. J. Mol. Sci. 2020, 21, 4773. [Google Scholar] [CrossRef] [PubMed]
  6. Wolins, N.E.; Quaynor, B.K.; Skinner, J.R.; Tzekov, A.; Park, C.; Choi, K.; Bickel, P.E. OP9 mouse stromal cells rapidly differentiate into adipocytes. Characterization of a useful new model of adipogenesis. J. Lipid Res. 2006, 47, 450–460. [Google Scholar] [CrossRef] [Green Version]
  7. Jemai, R.; Drira, R.; Makni, M.; Fetoui, H.; Sakamoto, K. Colocynth (Citrullus colocynthis) seed extracts attenuate adipogenesis by down-regulating PPARγ/SREBP-1c and C/EBPα in 3T3-L1 cells. Food. Biosci. 2020, 33, 100491. [Google Scholar] [CrossRef]
  8. White, U.A.; Stephens, J.M. Transcriptional factors that promote formation of white adipose tissue. Mol. Cell Endocrinol. 2010, 318, 10–14. [Google Scholar] [CrossRef] [Green Version]
  9. Menezes-Garcia, Z.; Oliveira, M.C.; Lima, R.L.; Soriani, F.M.; Cisalpino, D.; Botion, L.M.; Teixeira, M.M.; Souza, D.; Ferreira, A.V.M. Lack of platelet-activating factor receptor protects mice against diet-induced adipose inflammation and insulin-resistance despite fat pad expansion. Obesity 2014, 22, 663–672. [Google Scholar] [CrossRef]
  10. Park, S.J.; Kim, N.; Yoo, G.; Kim, S.-N.; K, H.-J.; Jung, K.; Oh, D.-C.; Lee, Y.-H.; Kim, S.H. Phenolics and neolignans isolated from the fruits of Juglans mandshurica, Maxim. And their effects on lipolysis in adipocytes. Phytochemistry 2017, 137, 87–93. [Google Scholar] [CrossRef] [PubMed]
  11. Koster, J.D.; Nelli, R.K.; Strieder-Barboza, C.; Souza, J.D.; Lock, A.L.; Contreras, G.A. The contribution of hormone sensitive lipase to adipose tissue lipolysis and its regulation by insulin in periparturient dairy cows. Sci. Rep. 2018, 8, 13378. [Google Scholar] [CrossRef]
  12. Rahn Landstrӧm, T.; Mei, J.; Karlsson, M.; Manganiello, V.; Degerman, E. Down-regulation of cyclic-nucleotide phosphodiesterase 3B in 3T3-L1 adipocytes induced by tumor necrosis factor alpha and cAMP. Biochem. J. 2000, 346, 337–343. [Google Scholar] [CrossRef] [PubMed] [Green Version]
  13. Carmen, G.Y.; Victor, S.M. Signaling mechanisms regulating lipolysis. Cell. Signal. 2006, 18, 401–408. [Google Scholar] [CrossRef]
  14. Suriyagoda, L.; Arima, S.; Suzuki, A.; Hoque, M.A. Variation in growth and yield performance of seventeen water chestnut accessions (Trapa spp.) collected from Asia and Europe. Plant. Prod. Sci. 2007, 10, 372–379. [Google Scholar] [CrossRef] [Green Version]
  15. Kim, M.J.; Im, K.R.; Yoon, K.-S. Trapa japonica Flerov extract attenuates lipid accumulation through downregulation of adipogenic transcription factors in 3T3-L1 cells. Am. J. Mol. Biol. 2015, 5, 32–41. [Google Scholar] [CrossRef] [Green Version]
  16. Yasuda, M.; Yasutake, K.; Hino, M.; Ohwatari, H.; Ohmagari, N.; Takedomi, K.; Tanaka, T.; Nonaka, G. Inhibitory effects of polyphenols from water chestnut (Trapa japonica) husk on glycolytic enzymes and postprandial blood glucose elevation in mice. Food. Chem. 2014, 165, 42–49. [Google Scholar] [CrossRef] [Green Version]
  17. Kim, Y.S.; Hwang, J.W.; Han, Y.K.; Kwon, H.J.; Hong, H.; Kim, E.H.; Moon, S.H.; Jeon, B.T.; Park, P.J. Antioxidant activity and protective effects of Trapa japonica pericarp extracts against tert-butylhydroperoxide-induced oxidative damage in chang cells. Food. Chem. Toxicol. 2014, 64, 49–56. [Google Scholar] [CrossRef]
  18. Zhan, G.; Pan, L.; Tu, K.; Jiao, S. Antitumor, antioxidant, and nitrite scavenging effects of chines water chestnut (Eleocharis dulcis) peel flavonoids. J. Food. Sci. 2016, 81, H2578–H2586. [Google Scholar] [CrossRef] [PubMed]
  19. Park, S.-J.; Lee, M.; Oh, D.H.; Kim, J.L.; Park, M.-R.; Kim, T.G.; Kim, O.-K.; Lee, J. Emblica officinalis and Hordeum vulgare L. mixture regulates lipolytic activity in differentiatied 3T3-L1 cells. J. Med. Food. 2021, 24, 172–179. [Google Scholar] [CrossRef]
  20. Park, S.-J.; Kim, D.; Kim, J.-L.; Park, M.-R.; Kim, T.G.; Kim, O.-K.; Nam, D.-E. Indian gooseberry and Barley sprout mixture inhibits aipogenesis and lipogenesis activity in 3T3-L1 adipocytes. Appl. Sci. 2002, 10, 9078. [Google Scholar] [CrossRef]
  21. Speliotes, E.K.; Willer, C.J.; Berndt, S.I. Association analyses of 249,796 individuals reveal 18 new loci associated with body mass index. Nat. Genet. 2010, 42, 937–948. [Google Scholar] [CrossRef] [Green Version]
  22. Chu, D.-T.; Nguyet, N.T.M.; Dinh, T.C.; Lien, N.V.T.; Nguyen, K.-H.; Ngoc, V.T.N.; Tao, Y.; Son, L.H.; Le, D.-H.; Nga, V.B.; et al. An update on physical health and economic consequences of overweight and obesity. Diabetes Metab. Syndr. 2018, 12, 1095–1100. [Google Scholar] [CrossRef] [Green Version]
  23. Lee, M.-S.; Kim, C.-T.; Kim, I.-H.; Kim, Y. Inhibitory effects of green tea catechin on the lipid accumulation in 3T3-L1 adipocytes. Phytother. Res. 2009, 23, 1088–1091. [Google Scholar] [CrossRef]
  24. Adesanya, O.A.; Senuga, T.O.; Oyenike, M.A.; Adam, M.A.; Adeoye, A.O.; Shittu, L.A.J. Effects of ethanolic extract of Irvingia gabonensis on the liver of progesterone induced obesity in female Swiss mice. Res. J. Health Sci. 2019, 7, 302–311. [Google Scholar] [CrossRef]
  25. Choi, J. Who cares for nutrition information at a restaurant? Foo-related lifestyles and their association to nutrition information conscious behaviors. Brit. Food J. 2016, 118, 1625–1640. [Google Scholar] [CrossRef]
  26. Bargale, M.; Smawarkar, N.J.; Sharma, Y.K. Mineralogical composition of water chestnut as compared to sweet potato. Indian J. Nutr. Diet. 1987, 24, 78–82. [Google Scholar]
  27. Kang, M.J.; Lee, S.K.; Song, J.H.; Kim, M.E.; Kim, M.J.; Jang, J.S.; Lee, J.H.; Kim, J.I. Water chestnut (Trapa japonica Flerov.) exerts inhibitory effect on postprandial glycemic response in rats and free radical scavenging activity in vitro. Food. Sci. Biotechnol. 2019, 18, 808–812. [Google Scholar]
  28. Talcott, S.T.; Lee, J.-H. Ellagic acid and flavonoid antioxidant content of muscadine wine and juice. J. Agric. Food Chem. 2002, 50, 3186–3192. [Google Scholar] [CrossRef] [PubMed]
  29. Xu, Y.-M.; Deng, J.-Z.; Ma, J.; Chen, S.-N.; Marchall, R.; Jones, S.H.; Johnson, R.K.; Hecht, S.M. DNA damaging activity of ellagic acid derivatives. Bioorg. Med. Chem. 2003, 11, 1593–1596. [Google Scholar] [CrossRef]
  30. Zeng, J.-L.; Li, Z.-H.; Wang, Z.-C.; Zhang, H.-L. Green tea consumption and risk of pancreatic cancer: A meta-analysis. Nutrients 2014, 6, 4640–4650. [Google Scholar] [CrossRef] [Green Version]
  31. Zhu, X.; Yang, L.; Xu, F.; Lin, L.; Zheng, G. Combination therapy with catechins and caffeine inhibits fat accumulation in 3T3-L1 cells. Exp. Ther. Med. 2017, 13, 688–694. [Google Scholar] [CrossRef] [PubMed] [Green Version]
  32. Lee, D.-R.; Lee, Y.-S.; Choi, B.-K.; Lee, H.J.; Park, S.-B.; Kim, T.-M.; Oh, H.J.; Yang, S.H.; Suh, J.-W. Root extracts of adenophora triphylla var. japonica improve obesity in 3T3-L1 adipocytes and high-fat diet-induced obese mice. Asian Pac. J. Trop. Med. 2015, 8, 898–906. [Google Scholar] [CrossRef] [PubMed] [Green Version]
  33. Fox, K.E.; Colton, L.A.; Erickson, P.F.; Friedman, J.E.; Cha, H.C.; Keller, P.; MacDougald, O.A.; Klemm, D.J. Regulation of cyclin D1 and wnt10b gene expression by cAMP-responsive element-binding protein during early adipogenesis involves differential promotor methylation. J. Biol. Chem. 2008, 283, 35096–35105. [Google Scholar] [CrossRef] [PubMed] [Green Version]
  34. Vidal-Puig, A.; Jimenez-Liñan, M.; Lowell, B.B.; Hamann, A.; Hu, E.; Spiegelman, B.; Flier, J.S.; Moller, D.E. Regulation of PPAR gamma gene expression by nutrition and obesity in rodents. J. Clin. Investig. 1996, 97, 2553. [Google Scholar] [CrossRef] [Green Version]
  35. Yi, X.; Wu, P.; Liu, J.; Gong, Y.; Xu, X.; Li, W. Identification of the potential key genes for adipogenesis from human mesenchymal stem cells by RNA-Seq. J. Cell Physiol. 2019, 234, 20217–20227. [Google Scholar] [CrossRef]
  36. Li, W.; Rong, Y.; Bao, L.; Nie, B.; Ren, G.; Zheng, C.; Amin, R.; Arnold, R.D.; Jeganathan, R.B.; Huggins, K.W. Suppression of adipocyte differentiation and lipid accumulation by stearidonic acid (SDA) in 3T3-L1 cells. Lipid Health Dis. 2017, 16, 181. [Google Scholar] [CrossRef] [Green Version]
  37. Lee, Y.-S.; Cha, B.-Y.; Choi, S.-S.; Choi, B.-K.; Yonezawa, T.; Teruya, T.; Nagai, K.; Woo, J.-T. Nobiletin improves obesity and insulin resistance in high-fat diet-induced obese mice. J. Nutr. Biochem. 2014, 24, 156–162. [Google Scholar] [CrossRef] [PubMed]
  38. Browning, J.D.; Horton, J.D. Molecular mediators of hepatic steatosis and liver injury. J. Clin. Investig. 2004, 114, 147. [Google Scholar] [CrossRef] [Green Version]
  39. Foretz, M.; Pacot, C.; Dugail, I.; Lemarchand, P.; Guichard, C.; Lièpvre, X.I.; Berthelier-Lubrana, C.; Spiegelman, B.; Kim, J.B.; Ferré, P.; et al. ADD1/SREBP-1c is required in the activation of hepatic lipogenic geneexpression by glucose. Mol. Cell Biol. 1999, 19, 3760–3768. [Google Scholar] [CrossRef] [Green Version]
  40. Molenear, A.; Mao, J.; Oden, K.; Seyfert, H.M. All three promoters of the acetyl-coenzyme A-carboxylase ALPA-encoding gene are expressed in mammary epithelial cells of ruminants. J. Histochem. Cytochem. 2003, 51, 1073–1081. [Google Scholar] [CrossRef] [Green Version]
  41. Smith, S. The animal fatty acid synthase: One gen, one polypeptide, seven enzymes. FASEB J. 1994, 8, 1248–1259. [Google Scholar] [CrossRef] [PubMed]
  42. Jang, J.; Jung, Y.; Seo, S.J.; Kim, S.-M.; Shim, Y.J.; Cho, S.H.; Chung, S.-I.; Yoon, Y. Berberine activates AMPK to suppress proteolytic processing, nuclear translocation and target DNA binding of SREBP-1c in 3T3-L1 adipocytes. Mol. Med. Rep. 2017, 15, 4139–4147. [Google Scholar] [CrossRef] [PubMed] [Green Version]
  43. Choi, B.-K.; Park, S.-B.; Lee, D.-R.; Lee, H.J.; Jin, Y.-Y.; Yang, S.H.; Suh, J.-W. Green coffee bean extract improves obesity by decreasing body fat in high-fat diet induced obese mice. Asian Pac. J. Trop. Med. 2016, 9, 635–643. [Google Scholar] [CrossRef] [PubMed] [Green Version]
  44. Blomquist, C.; Chorell, E.; Ryberg, M.; Mellberg, C.; Worrsjö, E.; Makoveichuk, E.; Larsson, C.; Lindahl, B.; Olivecrona, G.; Olsson, T. Decreased lipogenesis-promoting factors in adiose tissue in postmenopausal women with overweight on a Paleolithic-type diet. Eur. J. Nutr. 2018, 57, 2877–2886. [Google Scholar] [CrossRef] [Green Version]
  45. Blancon-Rivero, J.; Xavier, F.E. Therapeutic potential of phosphodiesterase inhibitors for endothelial dysfunction-related diseases. Curr. Phar. Des. 2020, 26, 3633–3651. [Google Scholar] [CrossRef]
  46. Jiang, B.; Yang, Y.; Jin, H.; Shang, W.; Zhou, L. Qian, L.; Chen, M. Astragaloside IV attenuates lipolysis and improves insulin resistance induced by TNFalpha in 3T3-L1 adipocytes. Phytother. Res. 2008, 22, 1434–1439. [Google Scholar] [CrossRef] [PubMed]
  47. Sztalryd, C.; Brasaemle, D.L. The perilipin family of lipid droplet proteins: Gatekeepers of intracellular lipolysis. Biochim. Biophys. Acta Mol. Cell Biol. Lipids 2017, 1862, 1221–1232. [Google Scholar] [CrossRef]
Figure 1. Effects of the TJ on cell viability in 3T3-L1 cells. TJ (0–1000 μg/mL). The data are shown as mean ± standard deviation (SD; n = 3). * = means significant differences from the controls were evaluated using student’s t-test: * p < 0.05. TJ, Trapa japonica Flerov extract.
Applsci 12 00290 g001
Figure 2. The effects of the TJ in the cAMP level (A), intracellular FA (B), TG (C), and glycerol release (D) related to the adipogenesis mechanism in differentiated 3T3-L1 cells. NC, normal control; DC, differentiated control; PC1, catechin 100 μg/mL; PC2, catechin 200 μg/mL; TJ (10, 50, 100, or 200 μg/mL). The data are shown as mean ± standard deviation (SD; n = 3), and statistical analyses were conducted by Duncan’s multiple range tests after one-way ANOVA. Each lowercase alphabet indicates within-figure differing significance (p < 0.05).
Applsci 12 00290 g002
Figure 3. Effects of the TJ on lipid accumulation related to adipogenesis mechanism in 3T3-L1 adipocytes: (A) Oil Red O staining and (B) optical density of lipid accumulation. NC, normal control; DC, differentiated control; PC1, catechin 100 μg/mL; PC2, catechin 200 μg/mL; TJ (10, 50, 100, or 200 μg/mL). The data are shown as mean ± standard deviation (SD; n = 3), and statistical analyses were conducted by Duncan’s multiple range tests after one-way ANOVA. Each lowercase alphabet indicates within-figure differing significance (p < 0.05).
Applsci 12 00290 g003
Figure 4. Effects of the TJ on adipogenesis-related proteins in 3T3-L1 cells: (A) Western blot showing the expression levels of the proteins, (B) p-MAPK/MAPK, (C) p-CREB/CREB, (D) CEBPβ/actin, (E) PPARγ/actin, (F) CEBPα/actin, (G) FABP4/actin, (H) leptin/actin, (I) G6P/actin, and (J) PCK/actin. NC, normal control; DC, differentiated control; PC1, catechin 100 μg/mL; PC2, catechin 200 μg/mL; TJ (10, 50, 100, or 200 μg/mL). The data are shown as mean ± standard deviation (SD; n = 3), and statistical analyses were conducted by Duncan’s multiple range tests after one-way ANOVA. Each lowercase alphabet indicates within-figure differing significance (p < 0.05).
Applsci 12 00290 g004
Figure 5. Effects of the TJ on lipogenesis-related proteins in 3T3-L1 cells: (A) Western blot showing the expression levels of the proteins, (B) G6PDH/actin, (C) citrate synthase/actin, (D) p-AMPK/AMPK, (E) SREBP1c/actin, (F) p-ACC/ACC, (G) FAS/actin, and (H) LPL/actin. NC, normal control; DC, differentiated control; PC1, catechin 100 μg/mL; PC2, catechin 200 μg/mL; TJ (10, 50, 100, or 200 μg/mL). The data are shown as mean ± standard deviation (SD; n = 3), and statistical analyses were conducted by Duncan’s multiple range tests after one-way ANOVA. Each lowercase alphabet indicates within-figure differing significance (p < 0.05).
Applsci 12 00290 g005
Figure 6. The effects of the TJ in the cAMP level (A), intracellular FA (B), TG (C), and glycerol release (D) related to the lipolysis mechanism in differentiated 3T3-L1 cells. NC, normal control; DC, differentiated control; PC1, catechin 100 μg/mL; PC2, catechin 200 μg/mL; TJ (10, 50, 100, or 200 μg/mL). The data are shown as mean ± standard deviation (SD; n = 3), and statistical analyses were conducted by Duncan’s multiple range tests after one-way ANOVA. Each lowercase alphabet indicates within-figure differing significance (p < 0.05).
Applsci 12 00290 g006
Figure 7. Effects of the TJ on lipid accumulation related to lipolysis mechanism in 3T3-L1 adipocytes: (A) Oil Red O staining and (B) optical density of lipid accumulation. NC, normal control; DC, differentiated control; PC1, catechin 100 μg/mL; PC2, catechin 200 μg/mL; TJ (10, 50, 100, or 200 μg/mL). The data are shown as mean ± standard deviation (SD; n = 3), and statistical analyses were conducted by Duncan’s multiple range tests after one-way ANOVA. Each lowercase alphabet indicates within-figure differing significance (p < 0.05).
Applsci 12 00290 g007
Figure 8. Effects of the TJ on lipolysis-related proteins in 3T3-L1 cells: (A) Western blot showing the expression levels of the proteins, (B) p-AMPK/AMPK, (C) UCP1/actin, (D) PKA/actin, (E) PDE3B/actin, (F) perilipin A/actin, (G) ATGL/actin, (H) p-HSL/HSL and (I) CPT1A/actin. NC, normal control; DC, differentiated control; PC1, catechin 100 μg/mL; PC2, catechin 200 μg/mL; TJ (10, 50, 100, or 200 μg/mL). The data are shown as mean ± standard deviation (SD; n = 3), and statistical analyses were conducted by Duncan’s multiple range tests after one-way ANOVA. Each lowercase alphabet indicates within-figure differing significance (p < 0.05).
Applsci 12 00290 g008
Publisher’s Note: MDPI stays neutral with regard to jurisdictional claims in published maps and institutional affiliations.

