Article

A Scalable Solution to Detect Behavior Changes of Elderly People Living Alone

Department of Computer and Information Technology, University “Dunarea de Jos” of Galati, 800146 Galati, Romania
*
Author to whom correspondence should be addressed.
Appl. Sci. 2022, 12(1), 235; https://doi.org/10.3390/app12010235
Submission received: 16 November 2021 / Revised: 6 December 2021 / Accepted: 22 December 2021 / Published: 27 December 2021

Abstract

:
As the world population is ageing rapidly and old age comes with multiple health issues, the need for medical services is likely to increase in a couple of decades beyond the limits of the medical systems of almost any country. In response to this trend, a variety of technologies have been developed with the aim of helping older people live independently as long as possible and reduce the burden on caregivers. In this paper, we propose a solution to encode the information about the activity of the monitored person, captured by a set of binary sensors, in the form of activity maps that reflect not only the intensity, but also the spatial distribution of the activity between a set of behaviorally meaningful places. Then, we propose a method for automatic analysis of the activity maps in order to detect deviations from the previously recorded routine. We have tested the method on two public activity recognition datasets and found that the proposed solution is not only feasible, but also has several important advantages (it is low cost, scalable, adaptable, requires little expert knowledge for setup and protects the privacy of the monitored persons) that make it applicable on a large scale, including for people with low socio-economic status.

1. Introduction

The world population is ageing rapidly. People aged 65 years or older are now the fastest growing age group, and some projections [1] indicate that, in 2050, the number of persons aged 65 and over will surpass two billion (16% of the world’s population, up from 9% in 2019). In the same time horizon, the number of persons aged 80 years or over is expected to triple (426 million in 2050, up from 143 million in 2019). As old age comes with a variety of health issues (cardiovascular diseases, dementia, frailty, and many others) this demographic shift is likely to increase the need of medical services beyond the limits of the medical systems of almost any country. Most elderly prefer to age in place [2], i.e., to spend their last years in their own homes retaining a certain level of independence, rather than go to nursing homes, or other residential care centers. This proved to be the right option, as a large share of the total COVID-19 deaths occurred in nursing homes (as much as 40% in New York City [3]).
On the other hand, the exponential advances witnessed in the past decades in all technological fields fueled the hope that new assistive technologies will lead to the development of effective solutions to help elderly people live independently in their homes. The term assistive technology designates
“any device or system that allows individuals to perform tasks they would otherwise be unable to do or increases the ease and safety with which tasks can be performed”.
[4]
The simplest setup that allows the patients to receive medical consultations using standard videoconference equipment, remote monitoring of certain medical devices (e.g., pacemakers, implantable loop recorders, etc.), and other medical services without the need to go to a medical clinic is telemedicine (see Ref. [5] for a discussion on the formal definitions of telemedicine and related terms telehealth and telecare). This setup allows the medical staff to increase the number of patients served, and the patients to access with ease the services of multiple medical specialists directly from home.
On another level of complexity of the assistive technology, when “a home or dwelling [is equipped] with a set of networked sensors and devices that extend the functionality of the home by adding [artificial] intelligence, automation, control, contextual awareness, adaptability, and functionality both remotely and locally, in the pursuit of improving the health and wellbeing of its occupants and assisting in the delivery of healthcare services” [6], it is called a smart home.
We should note that the definition of smart home cited above (from Ref. [6]) is not complete. Some smart homes are designed for optimizing the energy consumption (as in Ref. [7]), while others are designed with a focus on environmental sustainability [8]. Comprehensive reviews of the literature on smart homes and their applications are available in Refs. [9,10,11].
The concept of Ambient Assisted Living (AAL) is wider than that of smart home at least from the perspective of the place where the assistance occurs: while in smart homes the assistive technology is specific for indoor use and its deployment is limited to the residential space, AAL applications go beyond the home or dwelling of the users and seek to provide assistance and monitoring also in public spaces, shopping centers, public transportation, in the work environments, and in outdoor spaces (see Refs. [12,13] for a review of the state of the art in AAL).
In what concerns the specific functions and actions of the assistive technology, Demiris & Hensel in Ref. [14] identified the following categories:
-
Physiological monitoring, by collecting and analyzing data about certain physiological parameters like pulse rate, blood pressure, respiration, level of oxygen in the bloodstream, temperature, blood sugar level, etc. This type of application typically relies on wearable or implantable sensors (see Refs. [15,16]).
-
Monitoring potential environmental hazards using dedicated equipment (e.g., gas leaks or fire).
-
Intrusion detection. Special intrusion detection systems are commercially available, equipped with passive infrared (PIR) motion detectors, glass break detectors, magnetic door contacts, and video surveillance cameras.
-
Sensory and cognitive assistance. This type of technology aims to compensate the sensory or memory loss, e.g., by using hearing aids and reminders about taking the medication. Some of these systems are also capable to provide verbal instructions on performing certain tasks, or orientation suggestions (see Ref. [17] for an extensive review on reminder systems).
-
Monitoring the level of social interactions by collecting data about the frequency and duration of the phone calls, the number of visitors received, and participation of the users in social activities ([18]). The assistive technology can go beyond the simple monitoring and, in certain applications, aims to facilitate social interactions of the monitored persons by including equipment that mediate the virtual meetings with friends or family, or the participation in group activities (e.g., through games, as in Ref. [19]).
-
Detection of emergencies (e.g., falls). A comprehensive review of the existing solutions for fall detection is available in Ref. [20].
-
Functional monitoring. This research direction includes a wide variety of applications for monitoring the activities of daily life (ADL) and detection of behavior changes or abnormal activity patterns. Some of these applications are reviewed in Refs [21,22,23].
From the above list, of particular interest are the applications for ADL (long term) monitoring and detection of behavior changes, because many of the age-related pathologies have an insidious evolution over extended periods of time. Behavior changes, especially when they impact the daily activities of the elderly, usually indicate health issues, and may serve as clues for the early detection of a silent pathology. This is one of the reasons that explain the substantial number of articles published on this topic–for example, a simple search in the Web of Science for papers having the keyword “behavior changes” in the topic returns over 625,000 results (216,000 in the last 5 years).
Despite this wealth of literature, it seems that there is still work to do until the results of the research in ADL recognition will be included in a practical solution applicable on a large scale ([24]).
More specifically, Pavel et al. in Ref. [25] formulate a series of requirements for ADL monitoring systems, among which:
-
Economic Feasibility. These systems should be affordable for persons with lower socioeconomic status (SES).
-
Scalability. Monitoring systems should be designed so that they can be easily replicated in large series.
-
Unobtrusiveness. Ideally, the monitoring systems should be totally transparent for the users.
-
Continuity of sensing. The systems should be capable to collect and process data continuously over extended periods of time.
-
Usability. Such systems should be easy to install and require minimum maintenance to operate.
-
Adaptability. The monitoring systems should be easily adaptable to any individual regardless of her/his living environment.
-
A good trade-off between high sensitivity and a small number of false alarms.
-
Privacy and security. These systems should protect the privacy of the users and caregivers and have a clear and transparent policy regarding the usage of personal data.
Another study ([26]) found that, from the perspective of the users’ acceptance of the monitoring systems, the most principal factors that tend to hinder the adoption of the assistive technologies are the concerns about the loss of privacy and autonomy, along with the feelings of social isolation and stigma.
Considering the above requirements and constraints, it appears that the sensors most suitable for ADL monitoring are the binary sensors (e.g., Passive Infrared–PIR motion detectors, magnetic contacts, water flow sensors, etc.). They are inexpensive, easy to install and replace, low-maintenance, do not pose privacy concerns, and require minimal computation (see Ref. [9] for a comparison with other sensors). On the negative side, they provide very simple and limited information, and the data processing algorithms must compensate this drawback.
In this context, the objective of the present study is to propose a solution for long term ADL monitoring and detection of behavior changes, based exclusively on binary sensors, which is low cost, scalable, adaptable, and protects the privacy of the users.
The contributions of this research can be summarized as follows:
  • We propose an abstracted model of the residential living space, reduced to a collection of Behaviorally Meaningful Places (BMPs), represented as points located symmetrically in a generic Cartesian space. By eliminating all the details regarding the surface of the living space, the type and position of the furniture and appliances, and the specific locations of the sensors, this model creates a common ground for monitoring the ADL in almost any residential environment.
  • We describe a method to encode the sensor data in the form of a series of activity maps that embed information about the intensity and the spatial distribution of the activities.
  • We show that the respective activity maps can be automatically analyzed to detect changes in the behavior of the monitored persons, by comparing the activity map of the current time slice with the data previously recorded in a reference time interval.
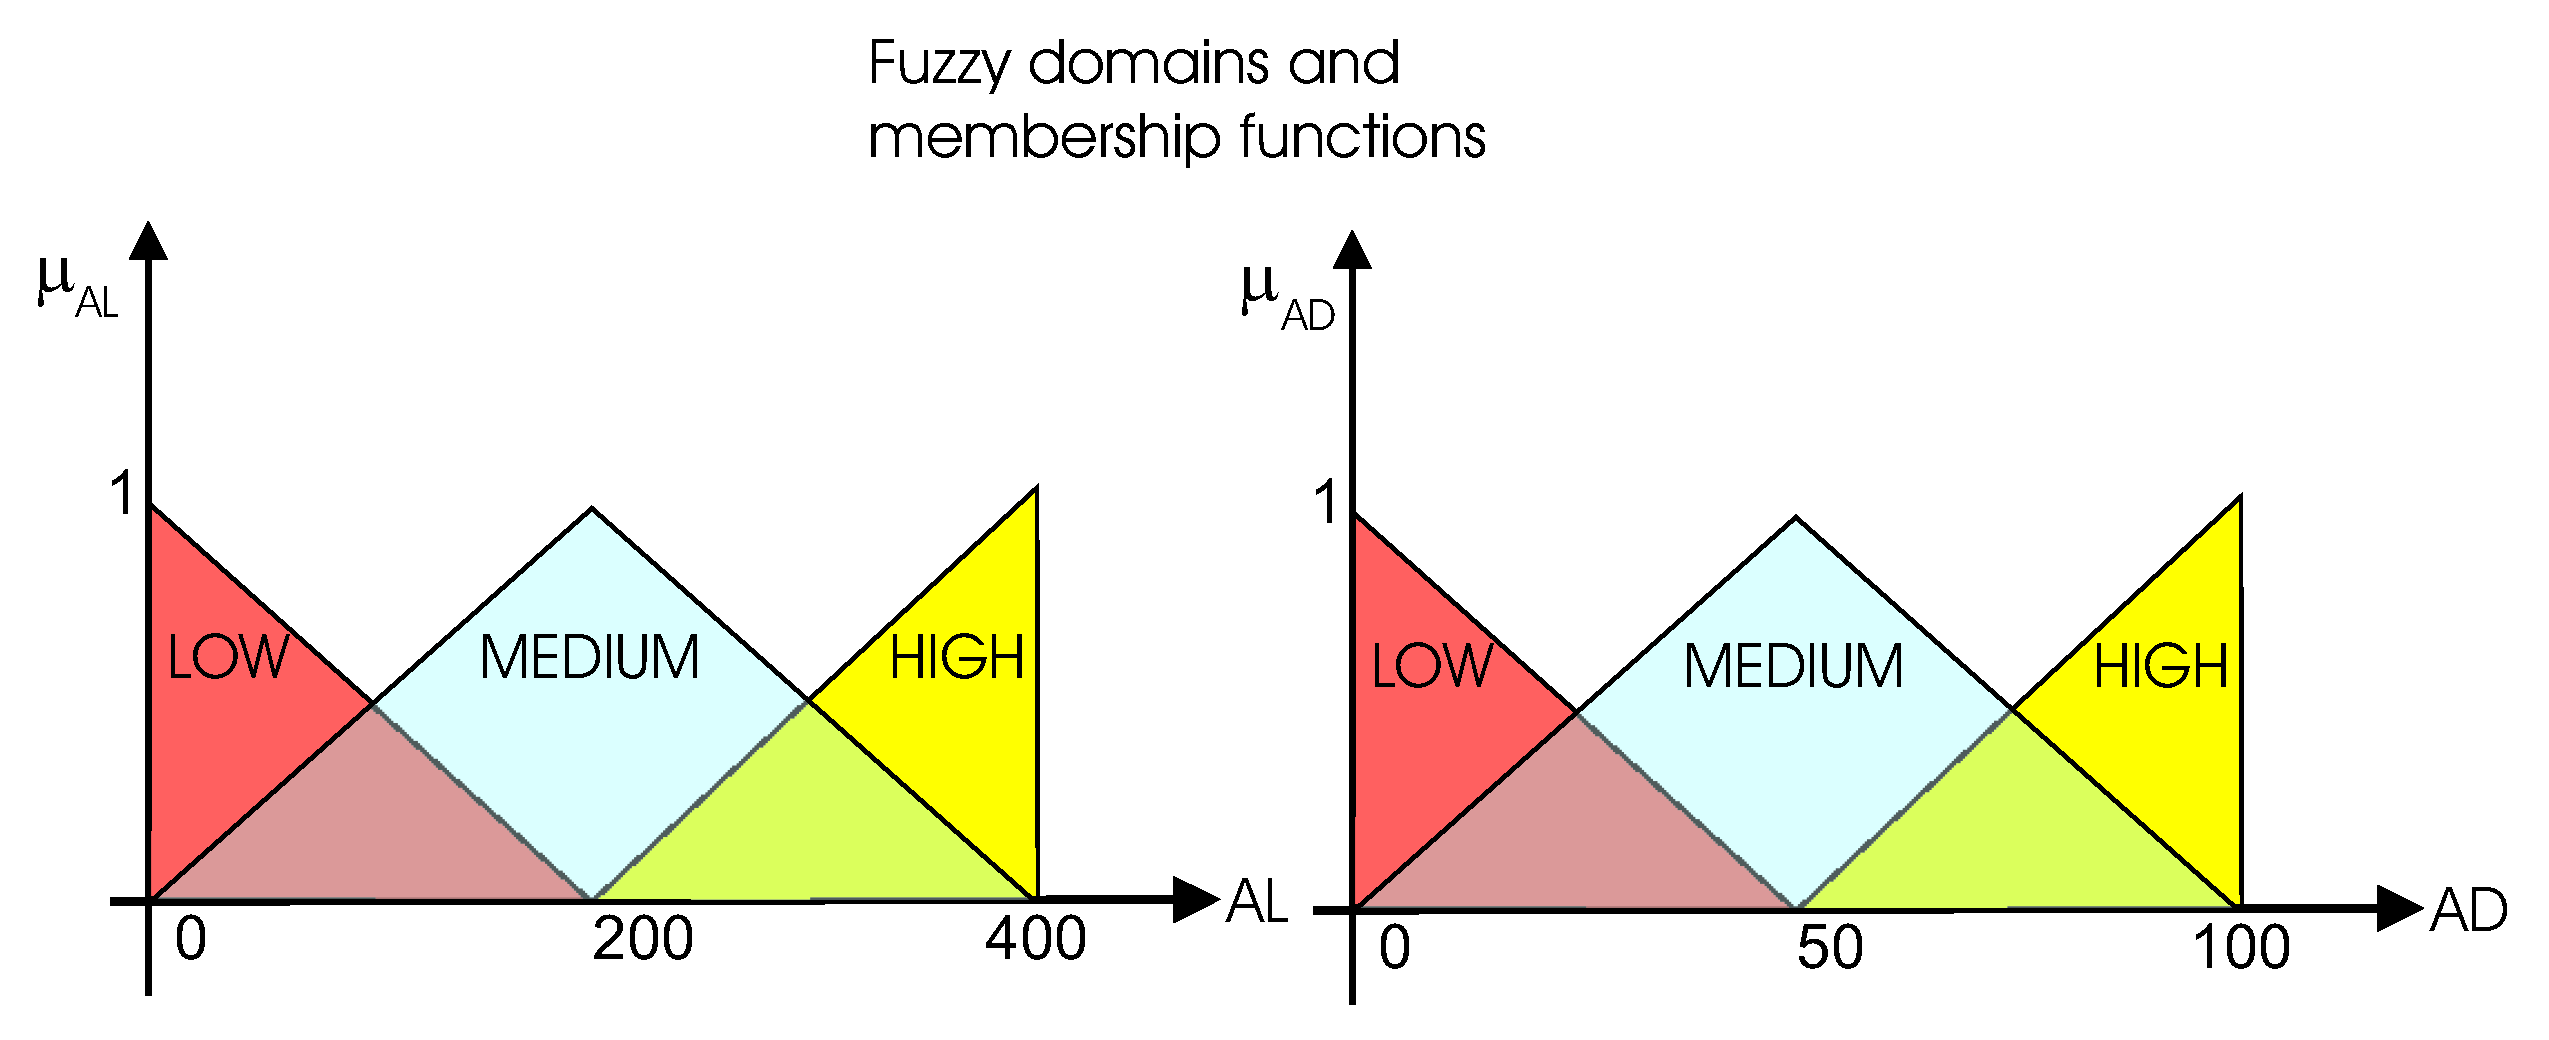
  • We propose a method to reduce the number of false alerts based on fuzzy logic.
The next section is a brief review of the closely related work found in the literature with a focus on the solutions based on binary sensors. Section 3 contains the detailed description of the method, and Section 4 presents the results obtained by applying the proposed method on two public datasets. Finally, Section 5 is reserved for discussion, and Section 6 presents the conclusions.

2. Related Work

Automatic detection of anomalies in human behavior is a challenging task because the behavior of every individual is influenced by age, gender, education, cultural habits, etc., and characterized by a unique spatio-temporal distribution of activities. Further challenges in detecting activity patterns are posed by contingent factors like:
-
Parallel or interleaved execution of certain activities (e.g., a person may cook dinner, watch TV, and answer the phone at the same time).
-
Periodic variations. The structure of the ADLs may be subject to weekly, monthly, or seasonal variations (e.g., sleep hours may be different during winter and summer).
-
False starts. Sometimes people start an activity and suddenly abandon it for unexpected reasons.
Moreover, the environment where people live is also extremely diverse, which leads to a great diversity in what concerns the type and number of sensors used for monitoring, and their spatial distribution. Therefore, we believe that the main challenge for the research on this topic is not to find solutions with high accuracy of the detection (such solutions already exist), but to design monitoring systems easily adaptable for any individual and for any living environment. The present work is an attempt to contribute to the progress of the research in this particular direction.
As shown in Refs. [27,28], three main strategies have been described in the literature to solve the problem of detecting anomalies of the human behavior (see Figure 1):
In the Activity Recognition Strategy, depending on the granularity of the desired output, we find solutions focused on: point anomalies (where each activity is recognized and evaluated individually, then classified as normal or abnormal), collective anomalies (where groups of activities are evaluated together, e.g., the morning routine), and contextual anomalies (where the individual activities are evaluated under a particular context, e.g., a certain medical condition of the monitored person). The typical structure of a system for detecting abnormal behavior according to the Activity Recognition Strategy is shown in Figure 2.
In this approach, the normal behavior is defined as patterns of activities (identified, for example, by clustering, as in Ref. [29]), and the deviations from these patterns are reported as abnormalities. An intuitive example, illustrating the detection of abnormal eating behavior by finding clusters in a bidimensional dataset is shown in Figure 3.
In the Discriminating Strategy it is assumed that the training set contains data about abnormal events previously recorded, and the detection of abnormalities can be reduced to a binary classification problem. Since annotated datasets that capture abnormal behavior are seldom available, the training for the abnormal class is done with synthetically generated data, as in Ref. [30].
Finally, the Profiling Strategy consists in comparing the observed data with a previously created model of normality. This approach is used in Ref [31], where the normal behavior is modelled in a Bayesian formulation using concepts like ‘sensor activation likelihood’, ‘sensor sequence likelihood’, and ‘sensor event duration likelihood’.
Another taxonomy of the existing approaches for detecting abnormal human activities is proposed in Ref. [32], as follows:
-
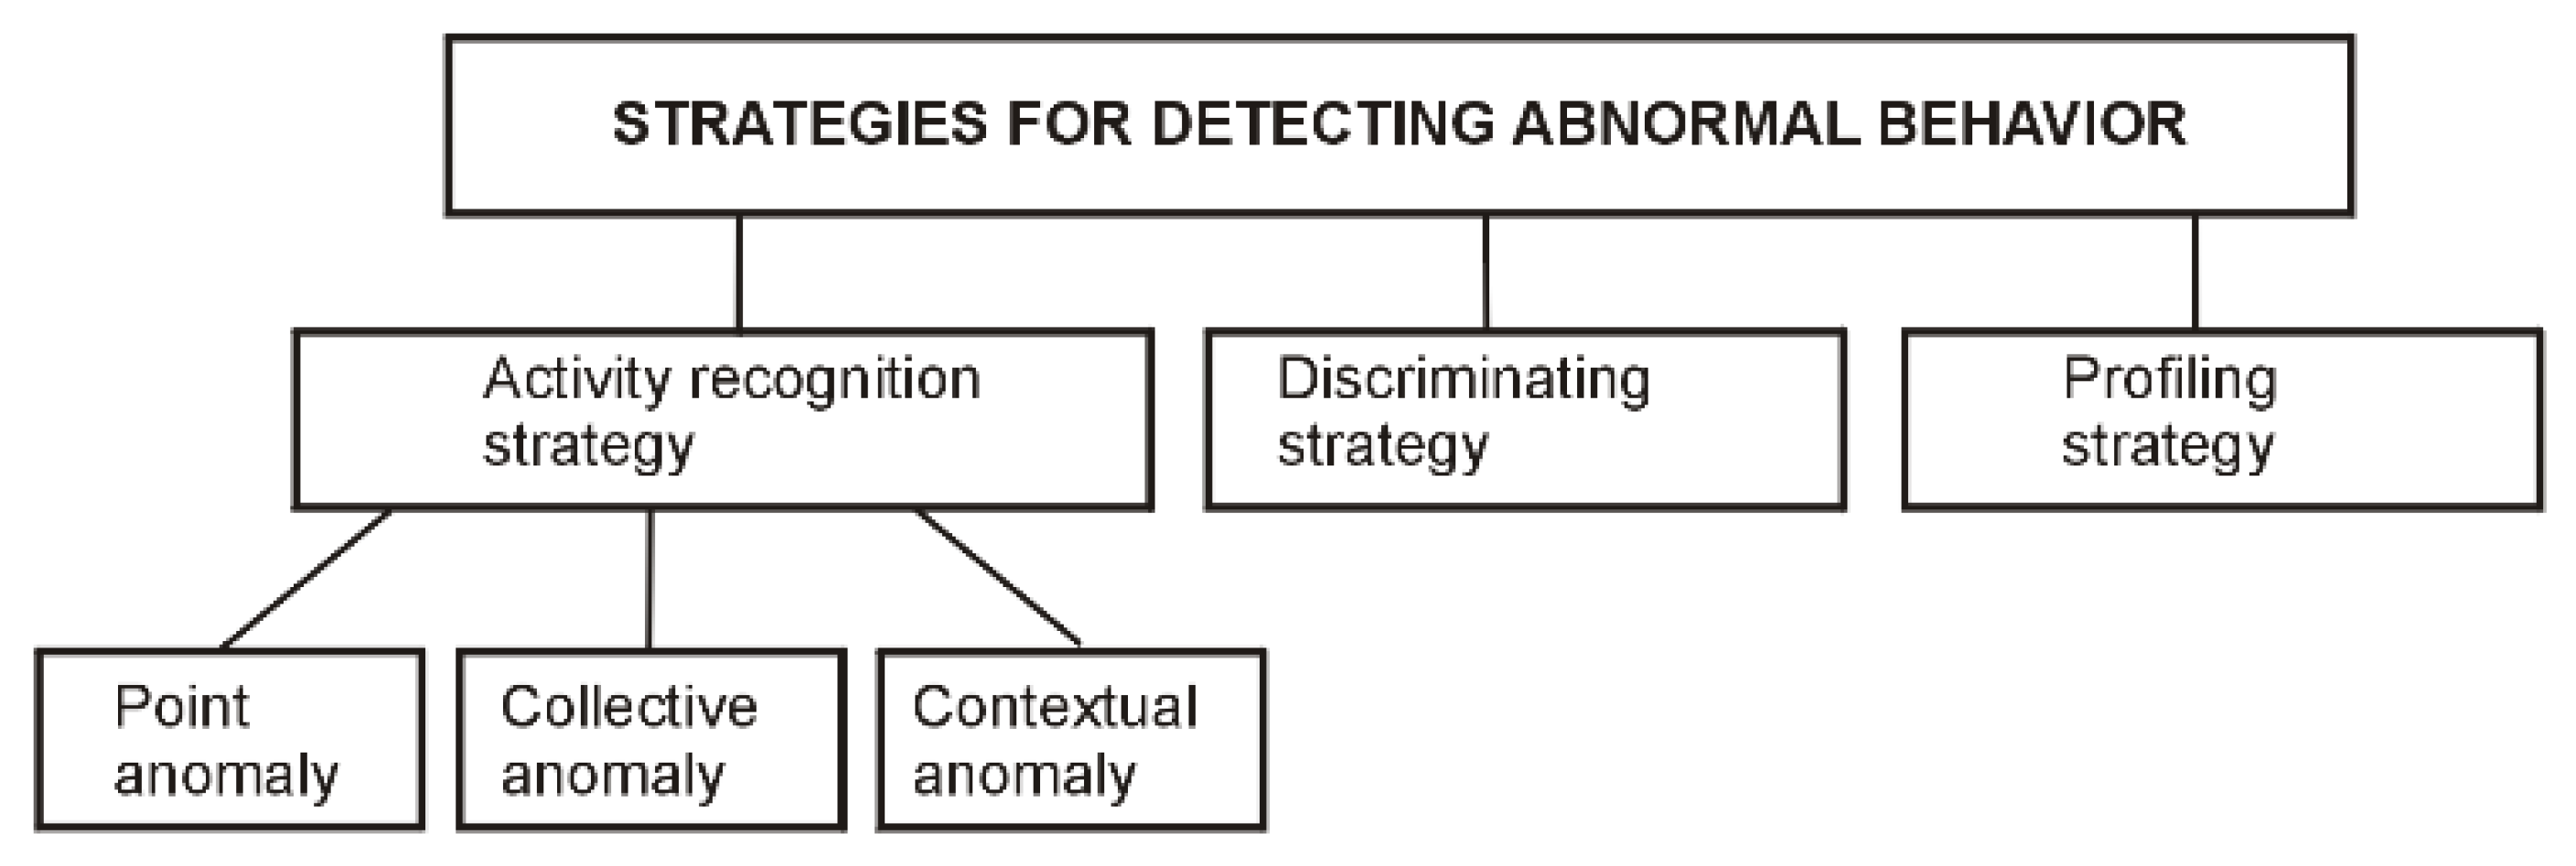
Score-based approaches. These solutions involve periodic assessment of the monitored persons from the perspective of possible health conditions that may affect their ADL routine. The clinical expert that conducts the assessment assigns scores for the mobility, cognitive status and other health aspects. The assistive technology is then programmed to map these scores to the data collected from the sensors during the respective period of assessment, with the aim to predict future health scores starting from the sensors data. This strategy is used in Ref. [33].
-
Classification approaches. These are entirely similar to the discriminating strategy described above.
-
Outlier detection approaches assume that the training data define the normal behavior and compare subsequent ADL data with the baseline defined in the training phase. Significant deviations from this baseline (outliers) are considered abnormal behavior. This approach is used in Ref. [34].
Though the solution proposed in the present study does not fit exactly into any of the categories described above, there are multiple similarities with previously published works. For example, the concept of activity map was used in Ref. [35] as a visual representation of the intensity of ADLs over time, for the use of a human expert. The solutions based on this type of activity maps use exclusively the temporal features of the sensor data and search for patterns in the frequency and the sequential order of sensor firings, thus missing important behavioral clues that derive from the spatial context of the activities.
This limitation is eliminated in Ref. [36], where the activity maps are visual images indicating the time spent in certain locations. Though the resulting maps are richer in information about the users’ behavior, this work does not propose a method to process this information for automatic anomaly detection.
A different approach is proposed in Refs. [37,38], where indoor localization systems and digital pheromones are used to create a visual map of the living environment. These maps embed traces that reflect the motion of the monitored persons, and it is assumed that the normal behavior is encoded in a set of preferred motion routes.
The work described in Ref. [39] also use virtual pheromones to create activity maps, with the difference that the pheromone sources are attached to the sensors in known locations. Every time a sensor is triggered by the activity of the user, the pheromone source releases a fixed amount of pheromones, which diffuse in space and evaporate with time. Thus, the images reflecting the distribution of the pheromones over the living space contain both information about the intensity of the activity of the inhabitant and about the place where the activity occurred. Behavior patterns are then identified by comparing the pheromone-based activity maps using a similarity measure.
The idea of an abstraction layer to overcome the variability of the spatial distribution of the sensors is introduced in Ref. [40] in the form of “labels” indicating the location, attached to the sensor events.
Finally, the idea of using fuzzy reasoning to estimate the deviations from the ADLs routine appears in Ref. [41]. Here, the monitored person’s daily routine is extracted from data about the usage of household appliances and deviations from this routine are detected by means of a set of fuzzy rules.
Unlike most of the existing studies on detecting behavior changes, the solution proposed in the present work does not use machine learning. We start by creating an abstraction of the living environment in the form of a set of behaviorally meaningful places, located symmetrically in a generic Cartesian space. Then, we use the data provided by a set of binary sensors to create activity maps that embed information about the intensity and the spatial distribution of the activities of the monitored person. Finally, we use the information about the relative weights of the BMPs in the structure of the activities to detect deviations from the activity routine, following a method described in the next section.

3. Method and Datasets

3.1. Assumptions

To improve the acceptance of the technology and to guarantee the privacy of the monitored persons we assumed that all the sensors used for monitoring are PIR motion detectors, magnetic door contacts, or any other sensors with binary output (e.g., pressure sensors, water flow sensors etc.). This type of sensors are already present in many residential spaces as components of the widely used intrusion detection systems, thus they are known as unobtrusive and are easier to accept by the users.
We also assumed that the monitored person lives alone, so that most of the time there is only one inhabitant in the home.

3.2. Description of the Proposed Method

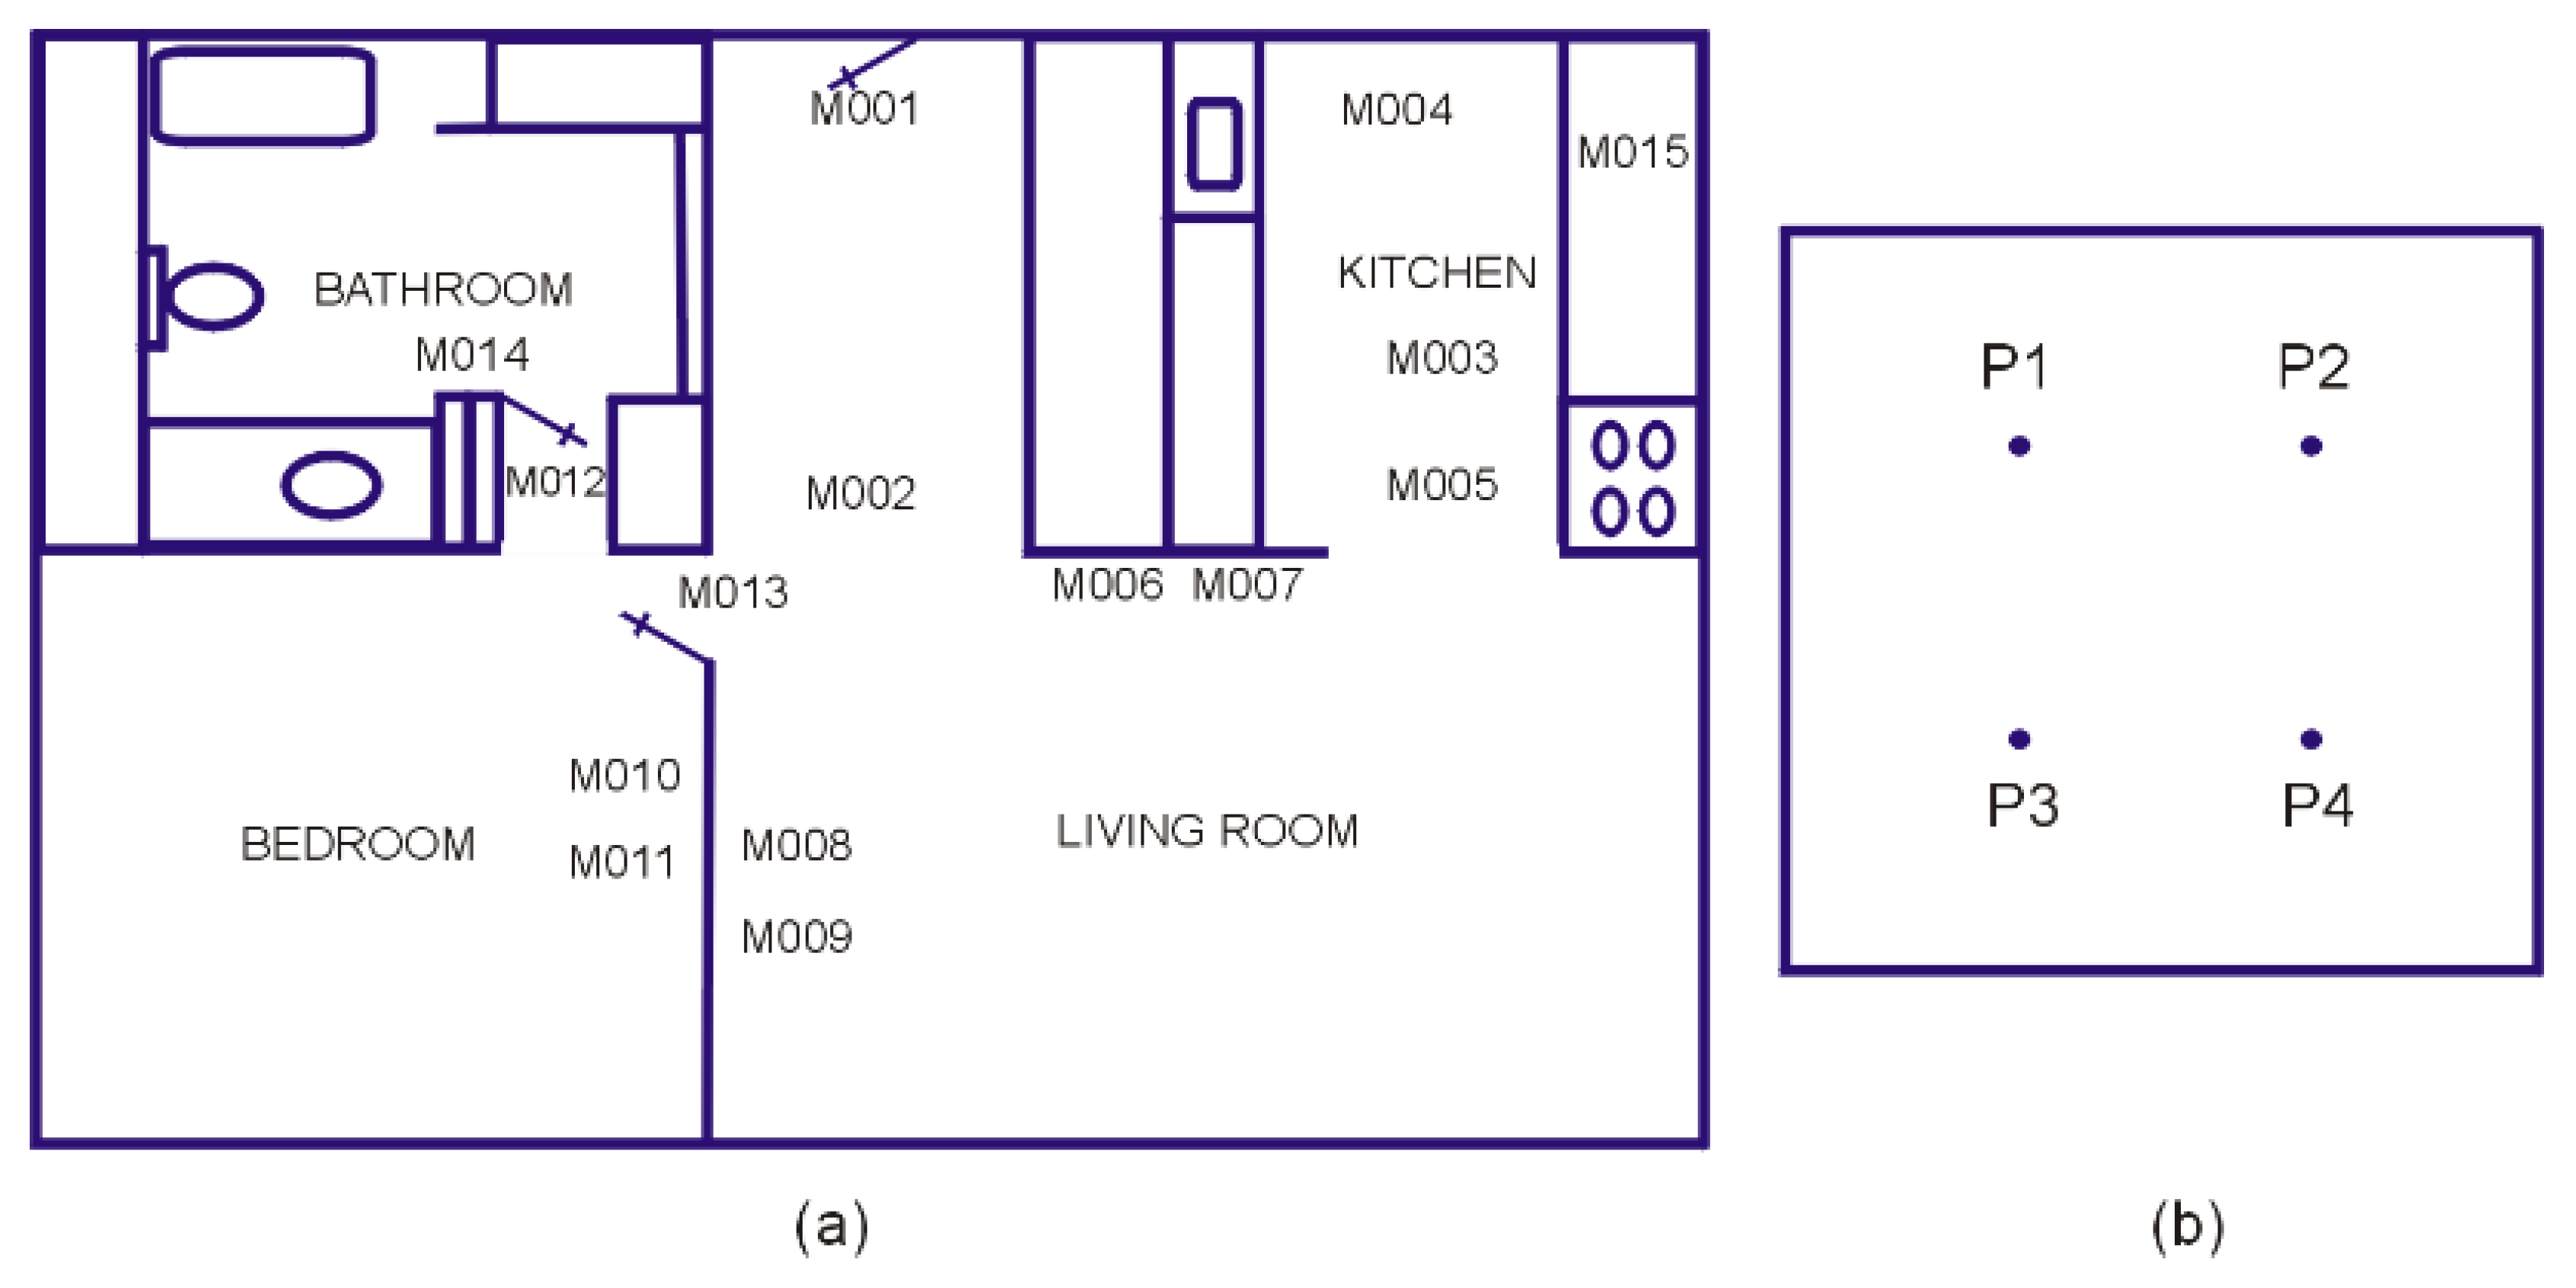
3.2.1. An Abstraction of the Living Space

In Ref. [42] it is argued that, with respect to human activity, we should make a distinction between locations and places: “places are locations that carry some meaning to user and to which the user can potentially attach some (meaningful) semantics”. People do not just happen to be in certain places—their presence in the respective place and the amount of time they spend there are the result of decisions, based on needs, preferences, habits, or values. Normally, the meaning people attach to certain places has nothing to do with details like the surface of the room, the position of the furniture, the existence and location of certain appliances, etc. Hence, from the perspective of an observer of the behavior of a person in his/her living environment, all these details are unimportant. Starting from this idea, in our previous work ([43]), we proposed an abstraction of the residential living space as a collection of Behaviorally Meaningful Places (BMPs): living room, bedroom, kitchen, and bathroom represented as points located symmetrically in a generic 2D Cartesian space.
Figure 4 shows an example of the result of abstraction of a particular residential space.
Assuming that all the sensors have binary output, for the sensor deployment depicted in Figure 4a it is possible to associate the sensor events with the BMPs as follows:
{ P 1 } = { M 010 } { M 011 } { M 013 } { P 2 } = { M 003 } { M 004 } { M 005 } { M 015 } { P 3 } = { M 012 } { M 014 } { P 4 } = { M 001 } { M 002 } { M 006 } { M 007 } { M 008 } { M 009 }
where {Pi} is the set of sensor events describing the activity in the place Pi and {Mj} is the set of events generated by the motion detector Mj.

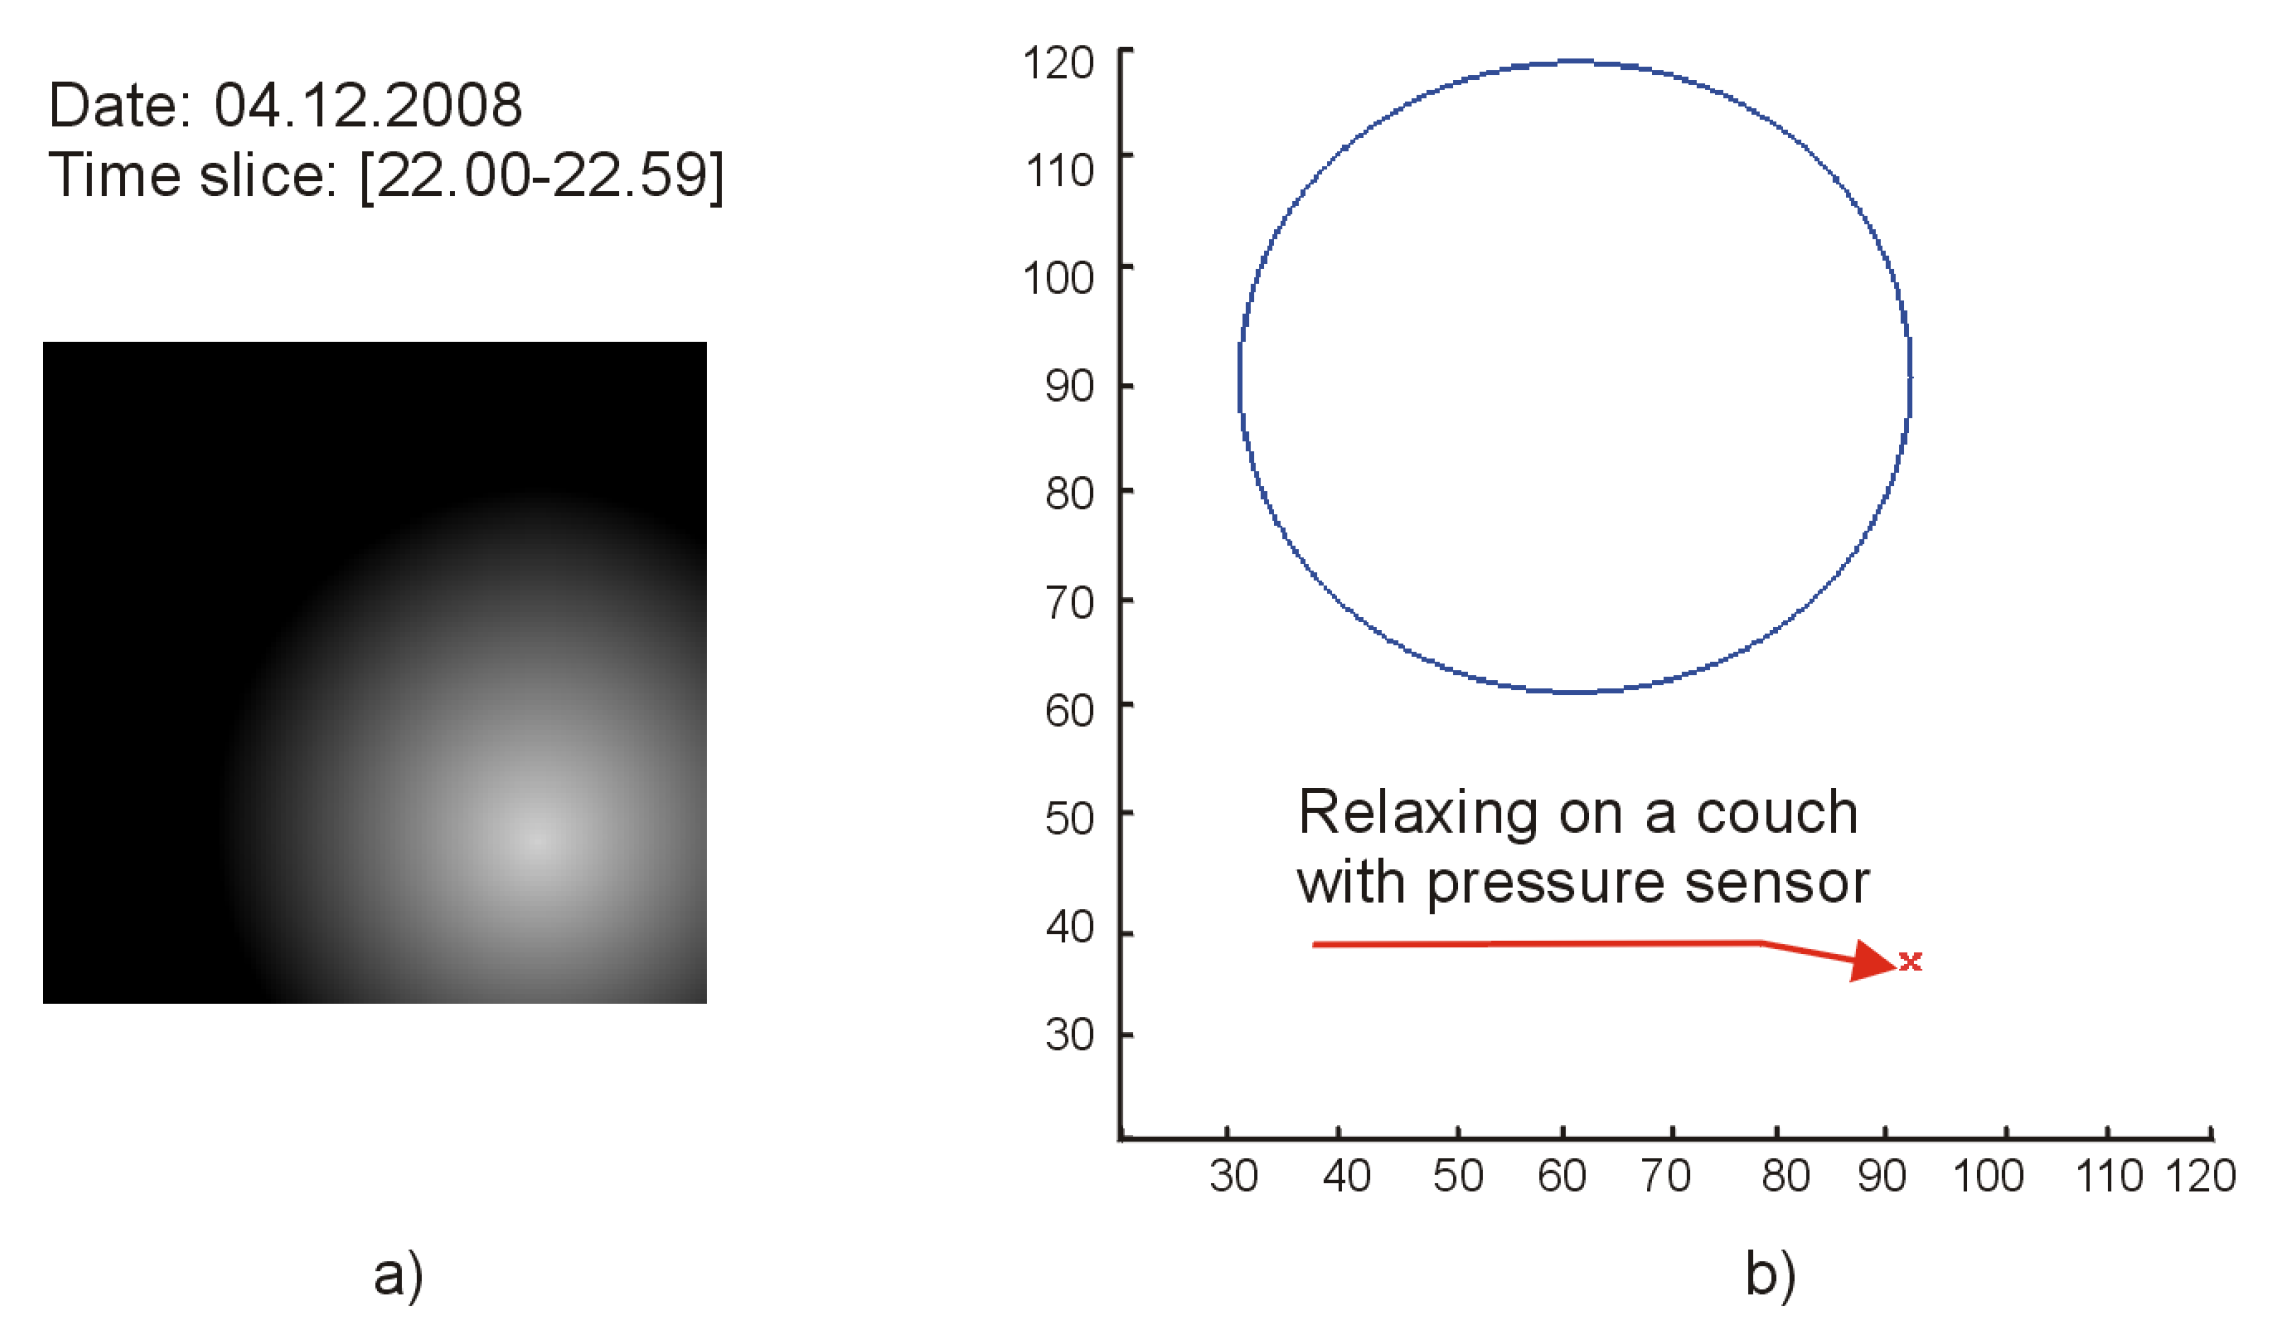
3.2.2. Creating Activity Maps Starting from the Sensor Data

In one of our previous works ([44]), we defined the concept of virtual pheromones as “traces created by the agents not in the environment, but in a representation thereof—A map”. Just like natural pheromones, virtual pheromones diffuse in space (see Figure 5a):
p ( x ) = { P ( 1 x σ ) f o r   x σ 0 f o r   x > σ
where p(x) is the intensity of the pheromones sensed at the distance x from the source, P is a scalar describing the intensity of the pheromones at the source, and σ is a positive constant that defines the maximum diffusion distance.
If multiple sources of pheromone are active (see Figure 5b), their aggregated effect due to the superposition is:
P R = k = 1 N P k ( 1 d k σ )
where Pk is the intensity of the source Sk and dk is the distance from the current point to the source Sk.
Finally, the virtual pheromones evaporate, i.e., the intensity of the pheromone traces diminishes with time, so that old traces eventually disappear.
By placing in each of the BMPs, P1–P4, pheromone sources that release a fixed amount of virtual pheromone whenever a sensor event is reported in the respective place, and integrating the intensities of virtual pheromones over a certain time interval (e.g., one hour), we obtained activity maps for the respective time slices, as shown in Figure 6.
This type of activity map has the advantage that it reflects not just the intensity but also the spatial distribution of the activities, and the relative weights of the behaviorally meaningful places in the general structure of the ADL.

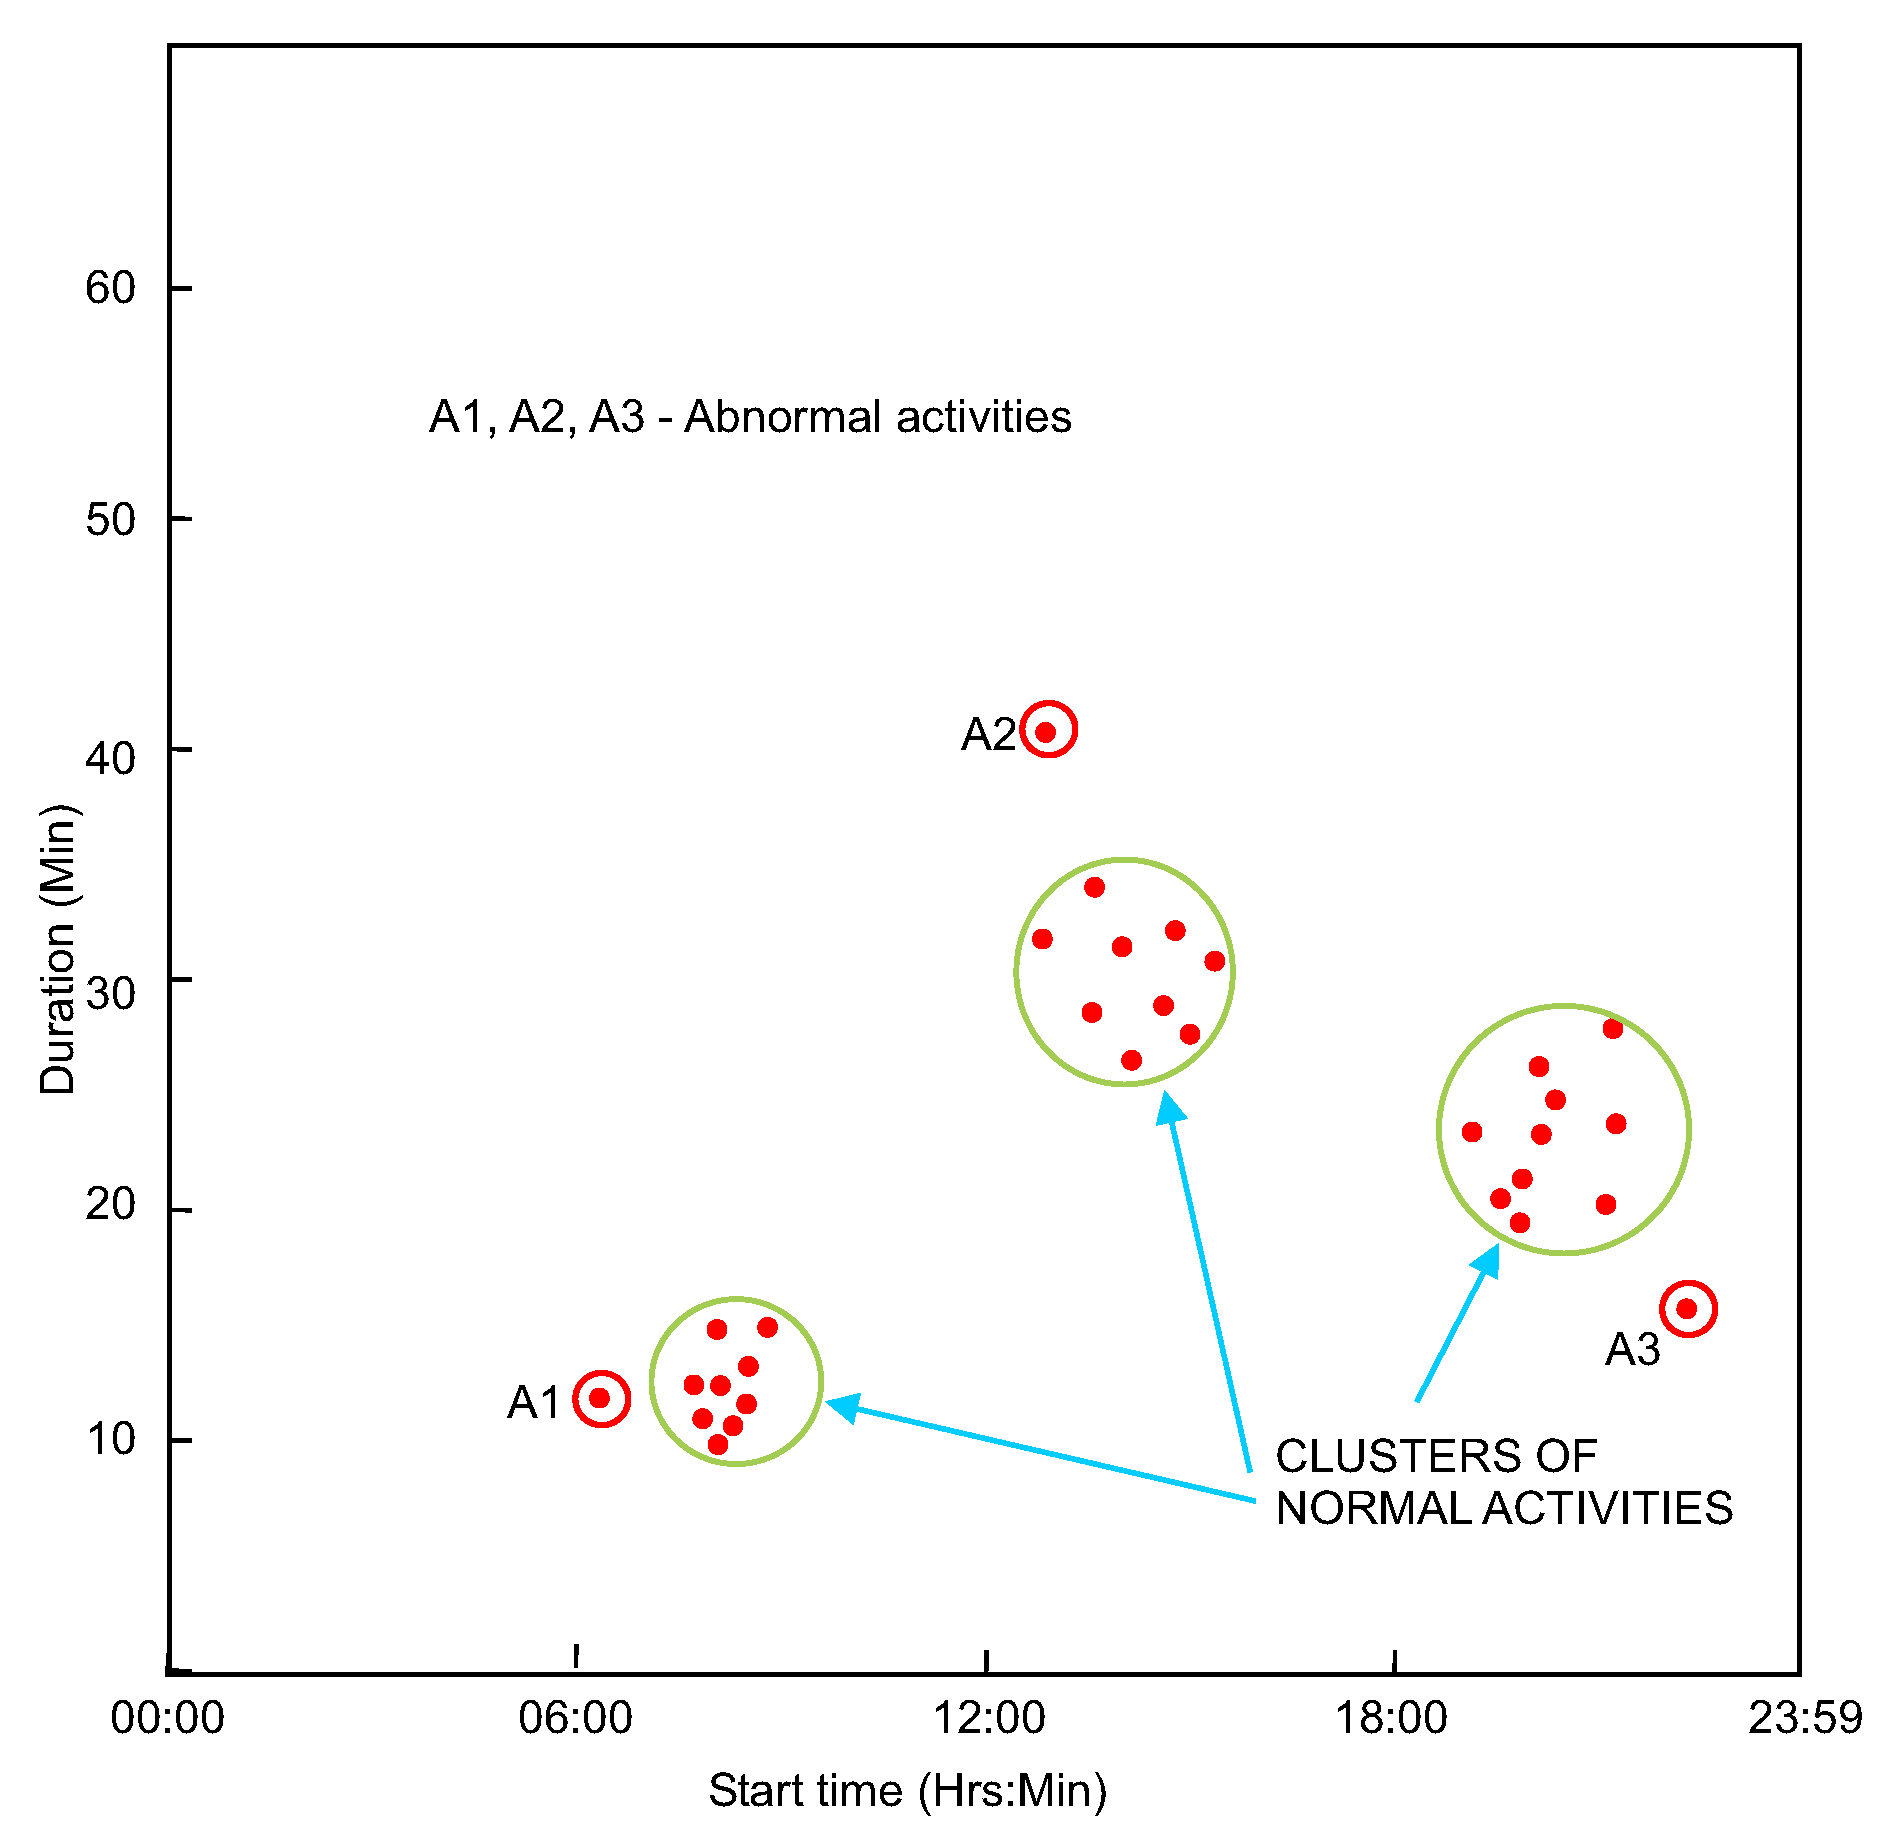
3.2.3. Detection of Abnormal Behavior

Due to the symmetrical placement of P1-P4 in the abstracted space, the information about the relative weights of the BMPs in the general structure of activities is encoded in the position of the centroid of the image representing the activity map.
Starting from this observation, we propose the following method to detect time intervals with unusual/atypical activity (see Figure 7):
Step 1: Manually select an interval (e.g., a week) from the past, with known normal activity. Using the sensor data, build activity maps for each one hour time slice, for all the days in the reference interval. The total number of activity maps for the reference interval will be: Number_of_time_slices_per_day × Number_of_days.
Step 2: Compute and plot the centroids of the images containing the activity maps for each time slice, across the entire reference interval.
Step 3: Find the smallest bounding circle (SBC) C(xc,yc,R) that encompasses the centroid points of the activity maps for the reference interval, where (xc,yc) are the coordinates of the center, and R is the radius. (There are 24 such circles for the reference interval, one for each one hour time slice.) In this study, we have used the algorithm described in Ref. [45] to determine the SBC.
Step 4: Build activity maps starting from the sensor data recorded in the past hour. For each new activity map, compute the centroid (xi,yi) of the respective image, along with two additional parameters, as follows:
The overall activity level for the respective time slice:
A L = i = 1 4 | { P i } |
where { P i } is the set of events reported by the sensors, associated with the place Pi, and | { P i } | is the cardinal of this set.
The measure of the activity deviation (AD) is a function of the Euclidean distance between the current centroid (xi,yi) and center of the reference SBC (xc,yc).
A D = ( x i 2 x c 2 ) + ( y i 2 y c 2 ) R
With this measure, activity maps with A D 0 are considered to reflect normal activity, while those with A D > 0 are reported as unusual or deviant activity (see Figure 7d), after an additional validity check described in the next subsection.

3.3. Filtering False Alerts

In real life, there are situations when quite normal activities (e.g., cleaning the house, spending more time in the kitchen to cook a special dinner, receiving visitors, etc.) are reflected by the sensors as deviations from the long term activity patterns. To prevent the system from generating false alerts in these situations, we have used a method to estimate the probability of the alert, based on fuzzy logic, starting from the values of AL and AD, computed with (1) and (2). Since false alerts are usually associated with higher activity levels, while health issues are reflected by a decrease of the activity level, we have considered a set of rules of the following type:
IF (the activity level (AL) is HIGH) AND (the activity deviation (AD) is HIGH), THEN (the probability of a false alert (PFA) is HIGH).
The entire rule-base is shown in Table 1.
We have used the Sugeno fuzzy inference method, described in Ref. [46], with three fuzzy domains: LOW (L), MEDIUM (M), and HIGH (H), and triangular membership functions, as shown in Figure 8.
For each rule in Table 1, the truth value of the antecedent is:
Z i = min ( μ A L , μ A D )
Since PFA is a probability, the output domain is the interval [0,1], so we can choose the constant values, called singletons (Si), for the output fuzzy domains in this range, e.g., SLOW = 0, SMEDIUM = 0.5, SHIGH = 1.
With these notations, the crisp value of the PFA is computed with (7):
PFA = i = 1 9 Z i S i i = 1 9 Z i
The value of PFA computed this way is compared with an empirically determined threshold and the alert is only reported if the PFA is lower than the threshold. To minimize the number of false alerts, the value of this threshold should be tunable for each participant. The process of tuning starts by choosing a relatively high value for the threshold (e.g., 70%), then iteratively decrement this value until the number of false alerts drops to a value close to zero.

3.4. Datasets

To verify the validity of the proposed method, we have used two publicly available activity recognition datasets, namely CASAS HH126 (Center for Advanced Studies in Adaptive Systems [47]) and Kasteren House C ([48]). Both these testbeds are equipped exclusively with binary sensors.
The HH126 testbed has only passive infrared (PIR) motion detectors, with binary output. The locations of sensors are marked as M001-M015 on the floor plan of this house, shown in Figure 5a.
For this spatial distribution of the sensors the correspondence between the BMPs and the sensors for HH126 is described by (1).
For Kasteren House C, the correspondence between BMPs and sensors is defined by the following equations:
{ P 1 } = { S 05 } { S 29 } { S 39 } { P 2 } = { S 07 } { S 13 } { S 18 } { S 20 } { S 21 } { S 22 } { S 23 } { S 27 } { S 30 } { P 3 } = { S 08 } { S 10 } { S 11 } { S 16 } { S 25 } { S 35 } { S 38 } { P 4 } = { S 06 } { S 15 } { S 28 } { S 36 }
where {Sk} is the set of events generated by the sensor Sk.
After some simple preprocessing on the raw sensor data (details in Ref. [43]), we have organized the sensor data into arrays sized 24 × 4–one array for each day of monitoring. The 24 rows of these arrays contained the cumulative data for one hour intervals in the format:
[ | { P 1 } | ,   | { P 2 } | ,   | { P 3 } | ,   | { P 4 } | ]  
where | { P i } | is the cardinal of the set {Pi}.
The dataset for CASAS HH126 is not annotated, but it has an interesting feature that proved to be useful for this study: a number of 6 sensors from the total of 15 (namely: M002, M005, M006, M008, M014, M015) were added on 18 April 2014, after the recording started. Since all the sensors have equal importance, the increase of the number of sensors is equivalent—from the perspective of the activity monitoring system—to an increase of the general level of activity. This variation should be easily detected with the proposed method.
The Kasteren House C dataset is much shorter (only 18 days from 20 November 2008 to 7 December 2008), but it is fully annotated. This allows a better selection of the reference interval, and also allowed us to manually select moments with unusual activities (e.g., getting a snack in the middle of the night) in order to verify the algorithm. A drawback of the Kasteren House C testbed is that, unlike CASAS HH126, which contains only motion detectors, it contains three pressure sensors installed under the bedroom beds and the living room couch. These sensors are triggered at the slightest motion and produce long series of events that can be wrongfully interpreted as high levels of activity during the night sleep or resting times. We tried to mitigate the influence of these sensors in the preprocessing phase by counting only the first event reported in a series and ignoring all the other events from the respective sensors for the next 10 min, but even with this adjustment they still produced a number of false alerts.

4. Results

4.1. Results with the CASAS HH126 Dataset

In order to capture the moment when new sensors were added to the testbed (18 April 2014), we have selected as reference interval for comparison ten days between 1.04.2014 and 10.04.2014. Then, we compared the activity maps for 5 days before 18.04.2014 (12, 13, 14, 15, and 16 April 2014) with the reference interval, expecting to find that the activity recorded in these days was entirely consistent with the reference interval. Similarly, for another 5 days interval after 18.04.2014 (21, 22, 23, 24, and 25 April), we expected the comparison to indicate a clear deviation from the pattern of activity defined by the reference interval. The results of these comparisons for the time slice [7.00 am–7.59 am] are shown in Figure 9.
Moreover, since the newly added sensors were unevenly distributed between the BMPs (3 in the living room, 2 in the kitchen and 1 in the bathroom—the bedroom did not receive any new sensor) we expected the deviations from the reference interval to be clearly visible in the morning and afternoon hours, and less visible during the evening and night hours. The results for the time slice (17.00–17.59) are shown in Figure 10.

4.2. Results with the Kasteren House C Dataset

Since this dataset is annotated, we could select the reference interval according to an objective criterion: we searched for seven consecutive days having the lowest standard deviation of the duration of sleep, and this way we set the week from 24 to 30 November as reference for comparisons. Then, we manually picked from the annotated list of activities several time slices with obviously atypical activities, like getting a snack past midnight, or having breakfast at 11.00 am, and compared the respective activity maps with the corresponding time slice from the reference interval. The algorithm correctly identified all the unusual activities. Figure 11 shows how the system identified the time slice (00.00 am–00.59 am) from 6 December 2008, as an unusual moment for a snack.
Figure 12 shows a situation when the system reported a false alert due to the pressure sensor located under the couch in the living room.

5. Discussion

The present study is a continuation of our previous work presented in Ref. [43]. Compared to the previous version, the current solution eliminates the need of a similarity measure to detect deviations from the ADL routine. This reduces the computational load and no longer requires expert knowledge to read the output of the behavior deviation detector. In fact, the entire system requires truly little expert knowledge only for defining the reference interval and assigning the sensors to BMPs. With a proper design of the software user interface, even these tasks can be executed by middle skilled workers, or—in many cases—by the users themselves.
We compared the proposed solution with those described in three other studies from the perspective of the criteria defined in Ref. [25]. The evaluation was made by considering the following factors;
-
The complexity of the solution;
-
The amount and level of the expert knowledge needed for the implementation and installation;
-
The type of sensors used;
-
The vulnerability to sensor faults;
-
The availability of training datasets.
The results are presented in Table 2.
Unlike most other solutions for detecting behavior deviations in smart homes, the proposed method is much simpler because it does not use machine learning, and it does not attempt to recognize and classify specific ADLs. This greatly reduces the complexity of the entire system, requiring lower processing power and, by eliminating the need of annotated datasets for the initial training it reduces the effort for installation and setup.
The abstraction of the living space makes the proposed solution easily adaptable to almost any dwelling and sensor deployment.
The problem of faulty sensors is not trivial in ADL monitoring and can be a major issue for the systems based on machine learning. In our previous work ([43]) we demonstrated that, assuming a certain redundancy in the distribution of sensors, which is quite feasible with low-cost sensors, a system based on this type of activity map can still operate with one or two sensors completely deactivated. This is important because most of the existing solutions are vulnerable to sensor faults.
The presence of a mechanism to reduce the number of false alerts is another useful feature that can improve the overall performance of the proposed system.
Finally, we have considered the feasibility of the idea of implementing a peer-to-peer (P2P) monitoring system, consisting of a network of smart homes, each equipped with a local monitoring system designed according to the method described in this work. Synthetic information about the activity of the monitored persons is shared in a simple format with the network peers, along with alerts about unusual activity, when detected. If all the peers share information about their behavior patterns, the system allows them to monitor each other’s activity and ask for assistance if deviations from the routine are detected. Details on the structure of such a system are presented in Appendix A.
Of course, it can be argued that, since the local monitoring system can be designed to work entirely automatically, there is no need to involve the peers in monitoring. It is true. The presence of some peers with limited skills at operating digital equipment does not improve the performance of the system in detecting deviations of the ADL. However, knowing that there are human observers in the system might bring the users a valuable psychological benefit, and might mitigate the feelings of abandon, loneliness, and depression that are frequent among the elderly people living alone ([49]). It is likely that, after some time of mutual monitoring, some of the participants will want to meet each other and extend the area of mutual support. Moreover, if the members of a P2P monitoring group are acquaintances, or live in the same neighborhood, they can take direct actions to support a peer who needs assistance.
The main limitation of our method is that it does not consider the intervals when the monitored persons are away from home, and this can lead to false alerts. However, this issue can be easily solved with a simple magnetic door contact at the main entrance and an additional software filter for false alerts (e.g., by using the algorithm described in Ref. [40]).
Further work is needed for the adjustment of the time slices used for building the activity maps—the one-hour intervals were arbitrarily chosen and may not be optimal. In practice, it may be useful to consider longer time slices and uneven in length (e.g., early morning from 6.00 am to 9.00 am, morning hours from 9.00 am to 1.00 pm, afternoon from 1.00 pm to 6.00 pm, evening from 6.00 pm to 11.00 pm, and nighttime from 11.00 pm to 6.00 am).

6. Conclusions

Though at this stage of the research it is not possible to compute a quantitative measure of the performances in terms of accuracy, sensitivity, specificity, etc. (see Ref. [50]) we believe that the proposed solution matches all the qualitative requirements formulated by Pavel et al. in Ref. [25]: it is low-cost, totally unobtrusive, scalable, adaptable to almost any residential space, and guarantees the privacy and security of the users’ data. It requires little expert knowledge to set up, is easy to use, and requires minimum maintenance. It appears that it is a viable candidate for large-scale replication and is one of the few existing solutions that can be made available for people with low socio-economic status.

Author Contributions

Conceptualization, I.S. and C.S.; methodology, I.S.; software, C.S.; validation, E.P. and A.C.; writing—initial draft preparation, I.S.; writing—review and editing, E.P. and A.C.; All authors contributed to the final version of the manuscript. All authors have read and agreed to the published version of the manuscript.

Funding

This research received no external funding.

Institutional Review Board Statement

Not applicable.

Informed Consent Statement

Not applicable.

Conflicts of Interest

The authors declare no conflict of interest.

Appendix A

The structure of a peer to peer monitoring system for detecting behavior changes.

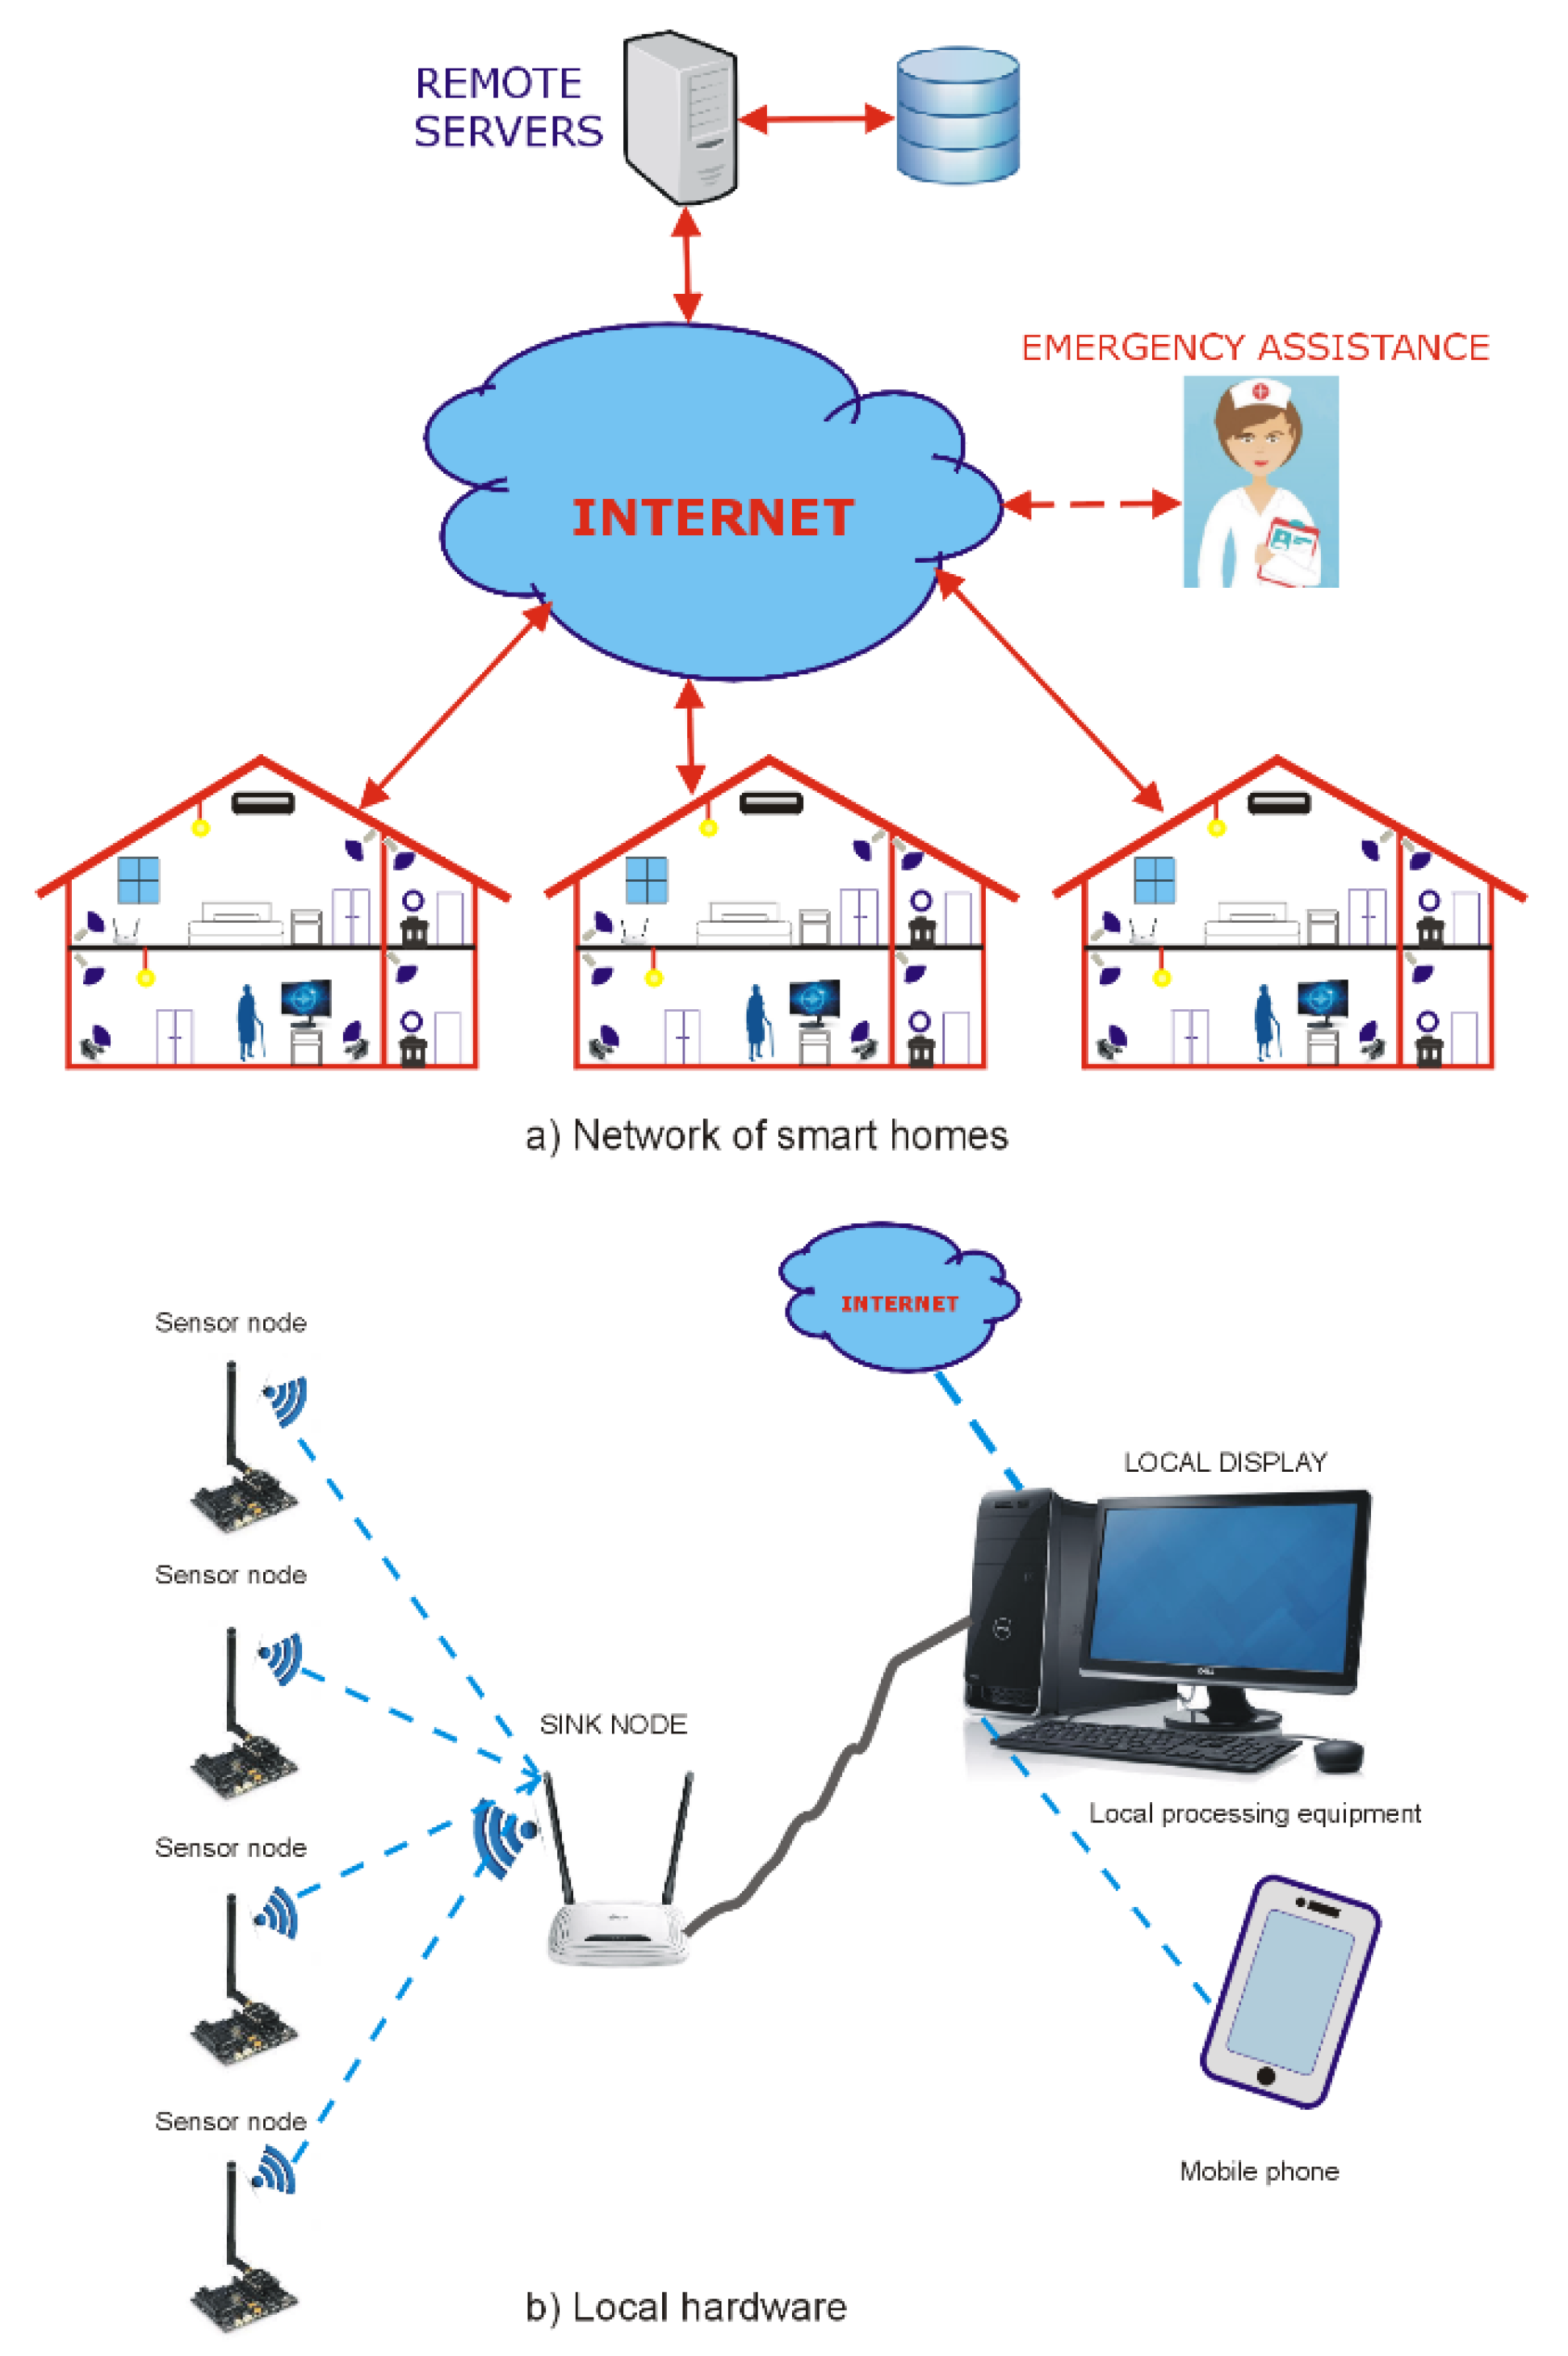
Appendix A.1. Hardware

The structure of the network and the local hardware needed for the implementation of the system are shown in Figure A1.
Figure A1. (a) The structure of the proposed system, wherein the assistive technology deployed in a network of smart homes is capable to unobtrusively monitor the ADL of the inhabitants in order to detect deviations from the long term activity routine and share the monitoring information across the network in a simple form, so that the peers could easily notice anomalies and request assistance if necessary. (b) Hardware equipment deployed in each smart home.
Applsci 12 00235 g0a1

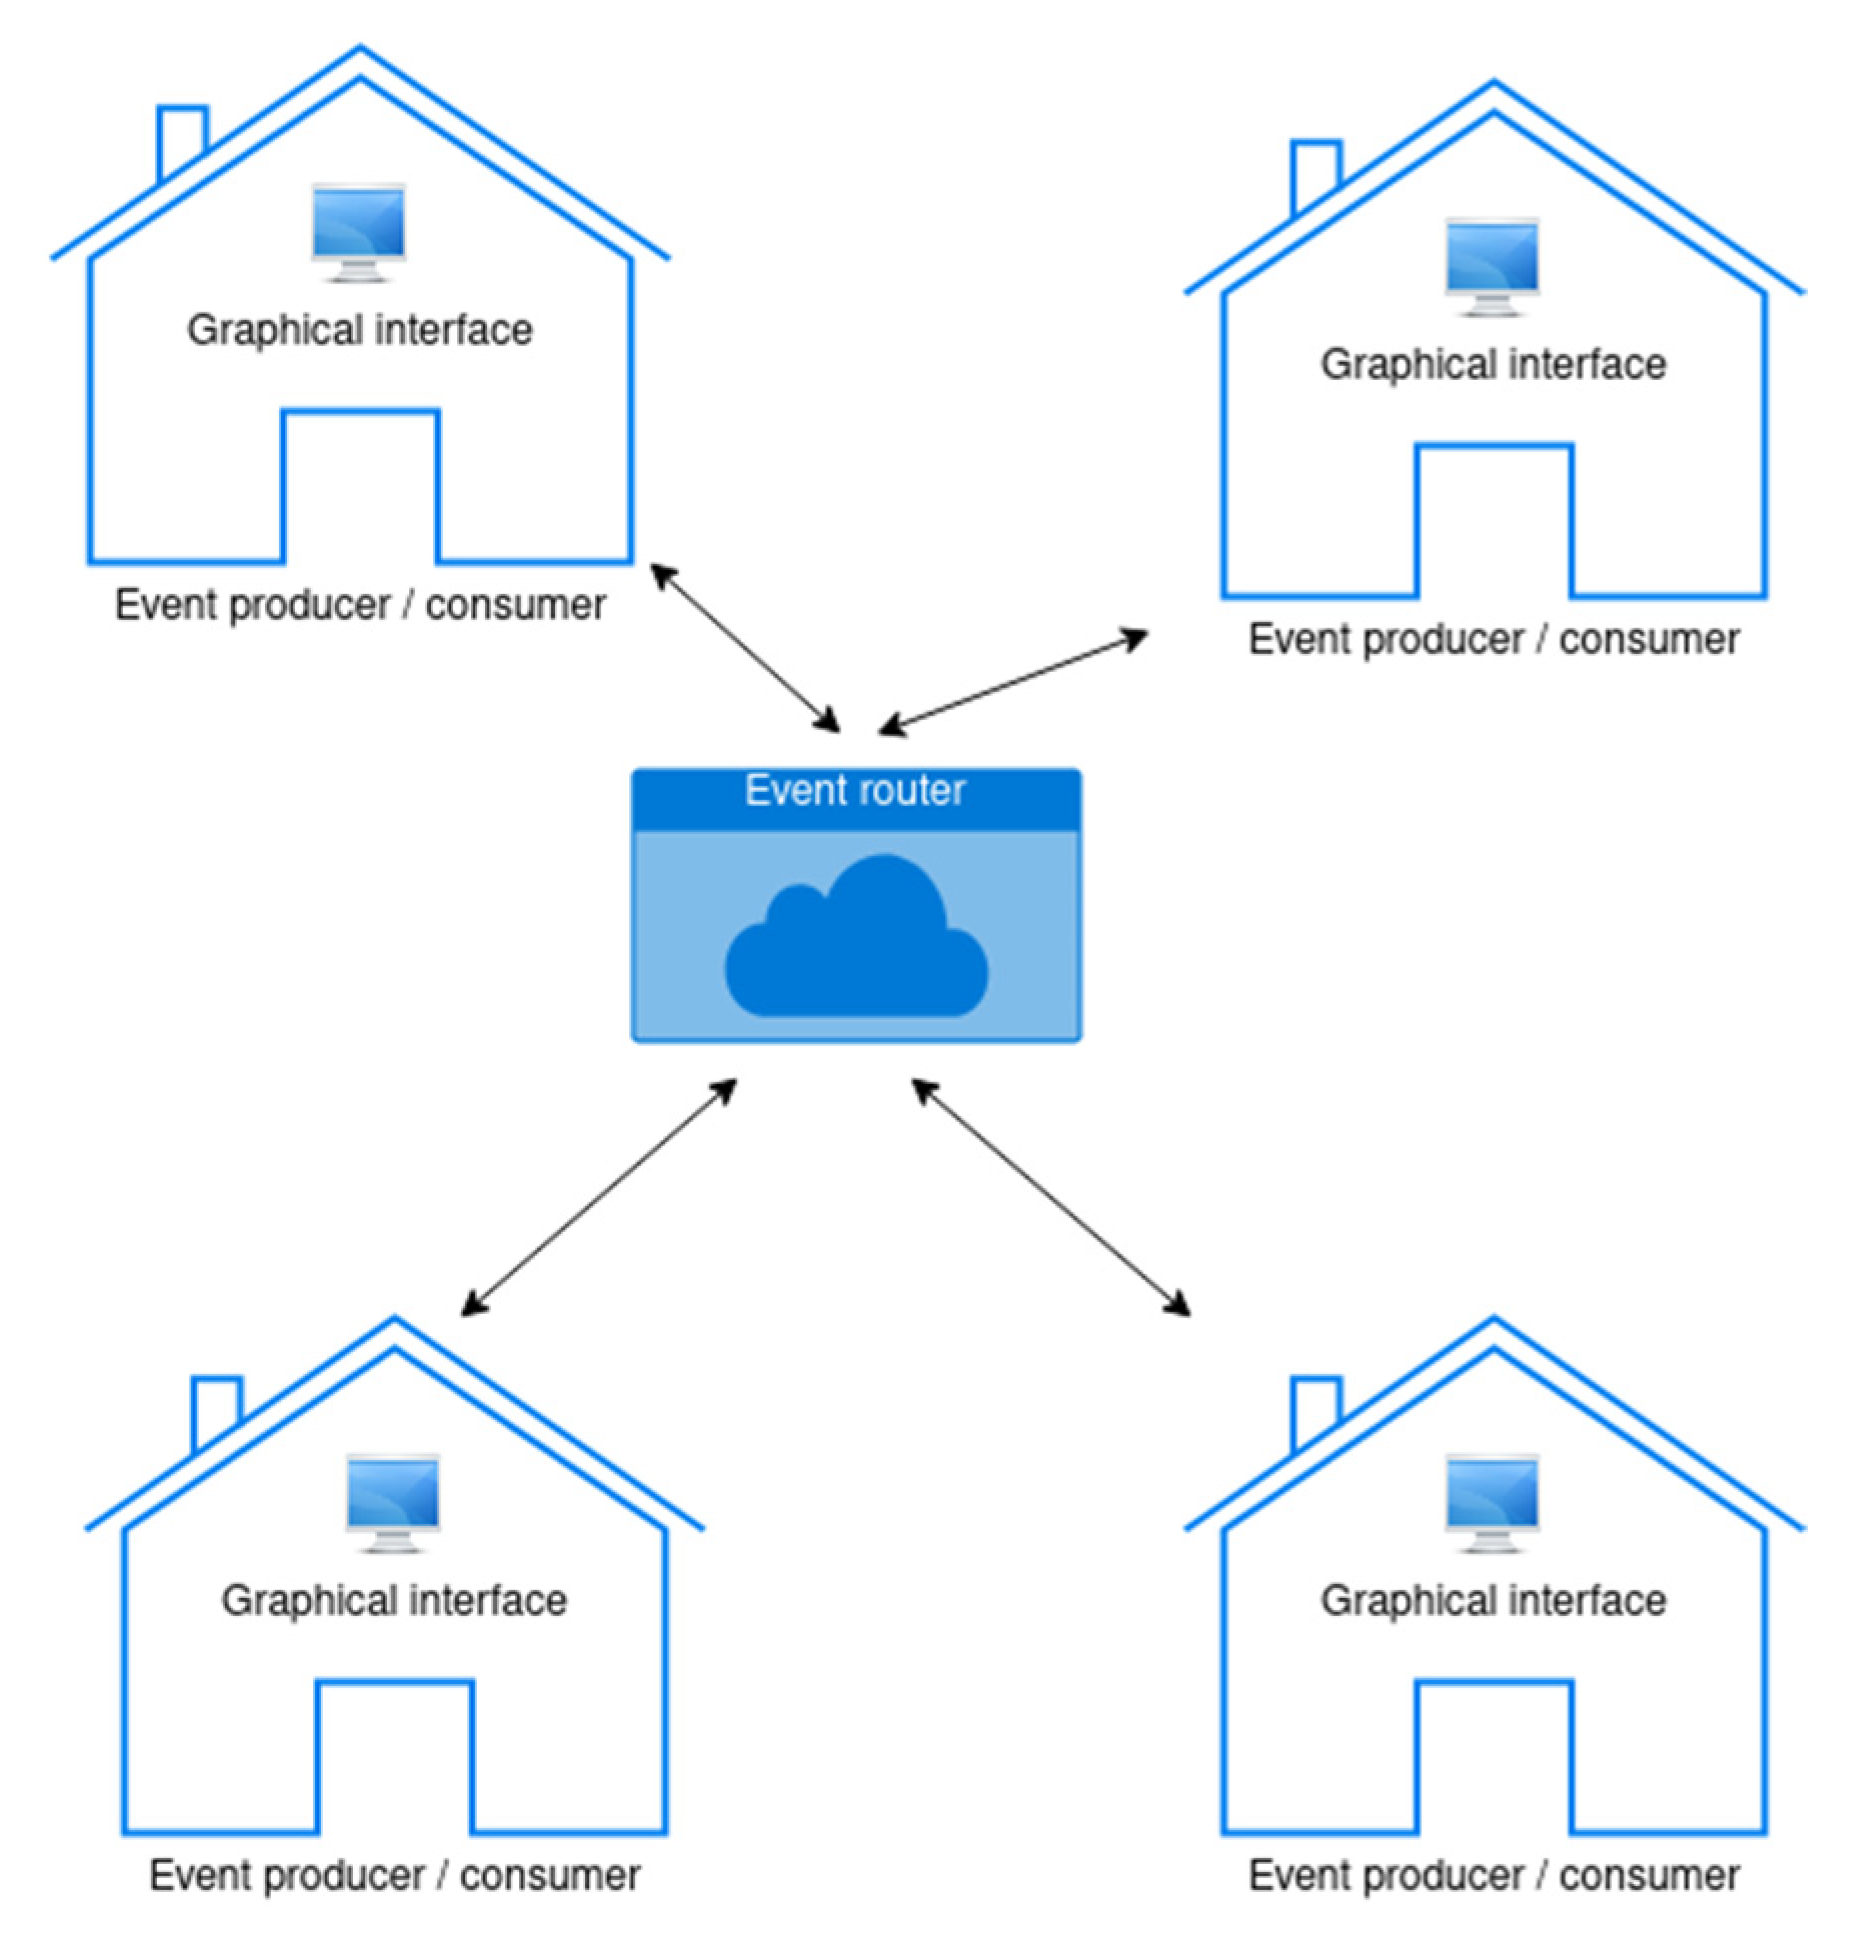
Appendix A.2. Requirements for the Software Components of the System

The software application used for monitoring should be easy to use and require only a limited knowledge of how to operate digital equipment in general. We suggest a hybrid approach, with the option to use either a mobile application (most elderly people possess smartphones), or a web application that can be accessed from anywhere, using a computer that might already be present in the household, or a more specialized piece of hardware with a touchscreen for even simpler interaction.
The graphical user interface (GUI) would be part of a framework that would handle the integration of the presented algorithm with the sensors and coordinate communication between the connected households.
This framework can be designed as a traditional client-server application, where the business logic resides on the server (backend) and the data is visualized in the frontend.
The backend would be built on top of an event-driven architecture since real-time situational awareness is required. It consists of an event router (also known as an event bus) and several event producers and consumers (see Figure A2). In this application, each participating household would be an event producer and consumer at the same time.
Figure A2. An illustration of the event producer/consumer paradigm.
Applsci 12 00235 g0a2
We would specifically use the Publish/Subscribe model because it allows automatic transmission of events to all (or a subset of) subscribers. Subscribing to the event stream would require little to no interaction, as each participant can be pre-configured to join the default event stream.
Since the data is exchanged over the network in binary format, the messages could contain any type of information relevant for the consumers, including images, or plain text.
For security reasons, the information about the identity of the peers should be stored on the remote server and made available only to authorized caregivers for emergency situations.
The system should be able to define and configure smaller groups, each containing 4–5 households for easier monitoring. Ideally, all the configuration and maintenance operations could be executed remotely. For example, a group could allow automatic subscription based on a group identifier that could be designed to encode valuable information, such as the identity and the address of the users, or some other arbitrary information that the administrator of the framework uses to group households. Proximity to each other could represent an important criterion, but other metrics could also be used, such as the age or some medical condition of the participants.
The system should be able to serve a large number of monitoring groups of participants. The only limitation would be the processing power of the event router, i.e., the servers that run the backend application. Ideally, such a system would run in a cloud provider that can easily handle quick scaling.
The frontend application should be designed to display the relevant information for the other peers enrolled in the system, with a focus on the simplicity of the presentation. The main screen of the GUI would contain the profile pictures of the members of the monitoring group, along with an image showing their current monitoring status. This can be a simple emoticon on a color-coded background (e.g., a smiling face on a green background if the monitoring status is normal, a neutral face on a yellow background for alerts rejected by the alert filtering module, and a sad face on a red background to indicate alerts) or can be an image like the one shown in Figure 7d.
It also should include the option to request assistance for either themselves or for a peer whose monitoring unit generated an alert.

References

  1. United Nations, Department of Economic and Social Affairs, Population Division. World Population Prospects 2019: Ten Key Findings. Available online: https://population.un.org/wpp/Publications/Files/WPP2019_10KeyFindings.pdf (accessed on 23 October 2021).
  2. Wiles, J.L.; Leibing, A.; Guberman, N.; Reeve, J.; Allen, R.E. The Meaning of “Aging in Place” to Older People. Gerontologist 2012, 52, 357–366. [Google Scholar] [CrossRef] [PubMed]
  3. Dean, A.; Venkataramani, A.; Kimmel, S. Mortality Rates From COVID-19 Are Lower In Unionized Nursing Homes: Study Examines Mortality Rates in New York Nursing Homes. Health Aff. 2020, 39, 1993–2001. [Google Scholar] [CrossRef] [PubMed]
  4. Andrews, G.; Faulkner, D.; Andrews, M. A Glossary of Terms for Community Health Care and Services for Older Persons; WHO Document; WHO Centre for Health Development: Kobe, Japan, 2004. [Google Scholar]
  5. Stowe, S.; Harding, S. Telecare, Telehealth and Telemedicine. Eur. Geriatr. Med. 2010, 1, 193–197. [Google Scholar] [CrossRef]
  6. Bennett, J.; Rokas, O.; Chen, L. Healthcare in the Smart Home: A Study of Past, Present and Future. Sustainability 2017, 9, 840. [Google Scholar] [CrossRef] [Green Version]
  7. Ullah, I.; Kim, D. An Improved Optimization Function for Maximizing User Comfort with Minimum Energy Consumption in Smart Homes. Energies 2017, 10, 1818. [Google Scholar] [CrossRef] [Green Version]
  8. Blumendorf, M. Building Sustainable Smart Homes. In Proceedings of the 1st International Conference on Information and Communication Technologies for Sustainability, Zürich, Switzerland, 14–16 February 2013; pp. 151–158. [Google Scholar]
  9. Ni, Q.; García Hernando, A.; de la Cruz, I. The Elderly’s Independent Living in Smart Homes: A Characterization of Activities and Sensing Infrastructure Survey to Facilitate Services Development. Sensors 2015, 15, 11312–11362. [Google Scholar] [CrossRef]
  10. Majumder, S.; Aghayi, E.; Noferesti, M.; Memarzadeh-Tehran, H.; Mondal, T.; Pang, Z.; Deen, M. Smart Homes for Elderly Healthcare—Recent Advances and Research Challenges. Sensors 2017, 17, 2496. [Google Scholar] [CrossRef] [Green Version]
  11. Maswadi, K.; Ghani, N.B.A.; Hamid, S.B. Systematic Literature Review of Smart Home Monitoring Technologies Based on IoT for the Elderly. IEEE Access 2020, 8, 92244–92261. [Google Scholar] [CrossRef]
  12. Cicirelli, G.; Marani, R.; Petitti, A.; Milella, A.; D’Orazio, T. Ambient Assisted Living: A Review of Technologies, Methodologies and Future Perspectives for Healthy Aging of Population. Sensors 2021, 21, 3549. [Google Scholar] [CrossRef]
  13. Calvaresi, D.; Cesarini, D.; Sernani, P.; Marinoni, M.; Dragoni, A.F.; Sturm, A. Exploring the Ambient Assisted Living Domain: A Systematic Review. J. Ambient. Intell. Humaniz. Comput. 2017, 8, 239–257. [Google Scholar] [CrossRef]
  14. Demiris, G.; Hensel, B.K. Technologies for an Aging Society: A Systematic Review of “Smart Home” Applications. Yearb. Med. Inform. 2008, 17, 33–40. [Google Scholar]
  15. Majumder, S.; Mondal, T.; Deen, M. Wearable Sensors for Remote Health Monitoring. Sensors 2017, 17, 130. [Google Scholar] [CrossRef]
  16. Darwish, A.; Hassanien, A.E. Wearable and Implantable Wireless Sensor Network Solutions for Healthcare Monitoring. Sensors 2011, 11, 5561–5595. [Google Scholar] [CrossRef] [Green Version]
  17. Tokunaga, S.; Horiuchi, H.; Takatsuka, H.; Saiki, S.; Matsumoto, S.; Nakamura, M.; Yasuda, K. Towards Personalized and Context-Aware Reminder Service for People with Dementia. In Proceedings of the 2016 International Joint Conference on Neural Networks (IJCNN), Vancouver, BC, Canada, 24–29 July 2016; pp. 2946–2953. [Google Scholar] [CrossRef]
  18. Matic, A.; Osmani, V.; Mayora, O. Trade-Offs in Monitoring Social Interactions. IEEE Commun. Mag. 2013, 51, 114–121. [Google Scholar] [CrossRef]
  19. Gamberini, L.; Raya, M.A.; Barresi, G.; Fabregat, M.; Ibanez, F.; Prontu, L. Cognition, Technology and Games for the Elderly: An Introduction to ELDERGAMES Project. PsychNology J. 2006, 4, 285–308. [Google Scholar]
  20. Wang, Z.; Ramamoorthy, V.; Gal, U.; Guez, A. Possible Life Saver: A Review on Human Fall Detection Technology. Robotics 2020, 9, 55. [Google Scholar] [CrossRef]
  21. Wang, Z.; Yang, Z.; Dong, T. A Review of Wearable Technologies for Elderly Care That Can Accurately Track Indoor Position, Recognize Physical Activities and Monitor Vital Signs in Real Time. Sensors 2017, 17, 341. [Google Scholar] [CrossRef] [Green Version]
  22. Li, R.; Lu, B.; McDonald-Maier, K.D. Cognitive Assisted Living Ambient System: A Survey. Digital Communications and Networks 2015, 1, 229–252. [Google Scholar] [CrossRef] [Green Version]
  23. Peetoom, K.K.B.; Lexis, M.A.S.; Joore, M.; Dirksen, C.D.; De Witte, L.P. Literature Review on Monitoring Technologies, and Their Outcomes in Independently Living Elderly People. Disabil. Rehabil. Assist. Technol. 2015, 10, 271–294. [Google Scholar] [CrossRef] [PubMed]
  24. Debes, C.; Merentitis, A.; Sukhanov, S.; Niessen, M.; Frangiadakis, N.; Bauer, A. Monitoring Activities of Daily Living in Smart Homes: Understanding Human Behavior. IEEE Signal Process. Mag. 2016, 33, 81–94. [Google Scholar] [CrossRef]
  25. Pavel, M.; Jimison, H.B.; Wactlar, H.D.; Hayes, T.L.; Barkis, W.; Skapik, J.; Kaye, J. The Role of Technology and Engineering Models in Transforming Healthcare. IEEE Rev. Biomed. Eng. 2013, 6, 156–177. [Google Scholar] [CrossRef] [PubMed]
  26. Pirzada, P.; Wilde, A.; Doherty, G.H.; Harris-Birtill, D. Ethics and Acceptance of Smart Homes for Older Adults. Inform. Health Soc. Care 2021, 1–28. [Google Scholar] [CrossRef] [PubMed]
  27. Bakar, U.A.B.U.A.; Ghayvat, H.; Hasanm, S.F.; Mukhopadhyay, S.C. Activity and Anomaly Detection in Smart Home: A Survey. In Next Generation Sensors and Systems; Mukhopadhyay, S.C., Ed.; Smart Sensors, Measurement and Instrumentation; Springer International Publishing: Cham, Switzerland, 2016; Volume 16, pp. 191–220. ISBN 978-3-319-21670-6. [Google Scholar]
  28. Zekri, D.; Delot, T.; Thilliez, M.; Lecomte, S.; Desertot, M. A Framework for Detecting and Analyzing Behavior Changes of Elderly People over Time Using Learning Techniques. Sensors 2020, 20, 7112. [Google Scholar] [CrossRef] [PubMed]
  29. Lotfi, A.; Langensiepen, C.; Mahmoud, S.M.; Akhlaghinia, M.J. Smart Homes for the Elderly Dementia Sufferers: Identification and Prediction of Abnormal Behaviour. J. Ambient. Intell. Humaniz. Comput. 2012, 3, 205–218. [Google Scholar] [CrossRef]
  30. Arifoglu, D.; Bouchachia, A. Detection of Abnormal Behaviour for Dementia Sufferers Using Convolutional Neural Networks. Artif. Intell. Med. 2019, 94, 88–95. [Google Scholar] [CrossRef] [PubMed]
  31. Ordóñez, F.J.; de Toledo, P.; Sanchis, A. Sensor-Based Bayesian Detection of Anomalous Living Patterns in a Home Setting. Pers. Ubiquit. Comput. 2015, 19, 259–270. [Google Scholar] [CrossRef]
  32. Yahaya, S.W.; Lotfi, A.; Mahmud, M. Detecting Anomaly and Its Sources in Activities of Daily Living. SN Comput. Sci. 2021, 2, 14. [Google Scholar] [CrossRef]
  33. Alberdi Aramendi, A.; Weakley, A.; Aztiria Goenaga, A.; Schmitter-Edgecombe, M.; Cook, D.J. Automatic Assessment of Functional Health Decline in Older Adults Based on Smart Home Data. J. Biomed. Inform. 2018, 81, 119–130. [Google Scholar] [CrossRef]
  34. Fahad, L.G.; Rajarajan, M. Anomalies Detection in Smart-Home Activities. In Proceedings of the 2015 IEEE 14th International Conference on Machine Learning and Applications (ICMLA), Miami, FL, USA, 9–11 December 2015; pp. 419–422. [Google Scholar]
  35. Sprint, G.; Cook, D.; Fritz, R.; Schmitter-Edgecombe, M. Detecting Health and Behavior Change by Analyzing Smart Home Sensor Data. In Proceedings of the 2016 IEEE International Conference on Smart Computing (SMARTCOMP), St. Louis, MO, USA, 18–20 May 2016; pp. 1–4. [Google Scholar]
  36. Kealy, A.; McDaid, K.; Loane, J.; Walsh, L.; Doyle, J. Derivation of Night Time Behaviour Metrics Using Ambient Sensors. In Proceedings of the ICTs for Improving Patients Rehabilitation Research Techniques, Venice, Italy, 5–8 May 2013. [Google Scholar]
  37. Barsocchi, P.; Cimino, M.G.C.A.; Ferro, E.; Lazzeri, A.; Palumbo, F.; Vaglini, G. Monitoring Elderly Behavior via Indoor Position-Based Stigmergy. Pervasive Mob. Comput. 2015, 23, 26–42. [Google Scholar] [CrossRef]
  38. Tan, Z.; Xu, L.; Zhong, W.; Guo, X.; Wang, G. Online Activity Recognition and Daily Habit Modeling for Solitary Elderly through Indoor Position-Based Stigmergy. Eng. Appl. Artif. Intell. 2018, 76, 214–225. [Google Scholar] [CrossRef]
  39. Palumbo, F.; La Rosa, D.; Ferro, E. Stigmergy-based long-term monitoring of indoor users mobility in ambient assisted living environments: The DOREMI project approach. In Proceedings of the BT—2nd Italian Workshop on Artificial Intelligence for Ambient Assisted Living (AI*AAL @ AI*IA 2016), Genova, Italy, 28 November 2016; Volume 1803, pp. 18–32. [Google Scholar]
  40. Aran, O.; Sanchez-Cortes, D.; Do, M.-T.; Gatica-Perez, D. Anomaly Detection in Elderly Daily Behavior in Ambient Sensing Environments. In Human Behavior Understanding; Chetouani, M., Cohn, J., Salah, A.A., Eds.; Lecture Notes in Computer Science; Springer International Publishing: Cham, Switzerland, 2016; Volume 9997, pp. 51–67. ISBN 978-3-319-46842-6. [Google Scholar]
  41. Pazhoumand-Dar, H.; Armstrong, L.J.; Tripathy, A.K. Detecting Deviations from Activities of Daily Living Routines Using Kinect Depth Maps and Power Consumption Data. J. Ambient. Intell Human Comput 2020, 11, 1727–1747. [Google Scholar] [CrossRef]
  42. Nurmi, P.; Koolwaaij, J. Identifying meaningful locations. In Proceedings of the 2006 Third Annual International Conference on Mobile and Ubiquitous Systems: Networking & Services, San Jose, CA, USA, 17–21 July 2006; pp. 1–8. [Google Scholar] [CrossRef]
  43. Susnea, I.; Dumitriu, L.; Talmaciu, M.; Pecheanu, E.; Munteanu, D. Unobtrusive Monitoring the Daily Activity Routine of Elderly People Living Alone, with Low-Cost Binary Sensors. Sensors 2019, 19, 2264. [Google Scholar] [CrossRef] [PubMed] [Green Version]
  44. Susnea, I. Engineering Human Stigmergy. Int. J. Comput. Commun. Control. 2015, 10, 420–427. [Google Scholar] [CrossRef] [Green Version]
  45. MATLAB Central File Exchange. John D’Errico A Suite of Minimal Bounding Objects. Available online: https://www.mathworks.com/matlabcentral/fileexchange/34767-a-suite-of-minimal-bounding-objects (accessed on 24 September 2021).
  46. Sugeno, M. Industrial Applications of Fuzzy Control; Elsevier Science Inc.: Amsterdam, The Netherlands, 1985. [Google Scholar]
  47. CASAS Activity Recognition Datasets. Available online: https://data.casas.wsu.edu/download/ (accessed on 24 September 2021).
  48. Kasteren Activity Recognition Datasets. Available online: https://sites.google.com/site/tim0306/datasets (accessed on 21 February 2019).
  49. Naslund, J.A.; Aschbrenner, K.A.; Marsch, L.A.; Bartels, S.J. The Future of Mental Health Care: Peer-to-Peer Support and Social Media. Epidemiol. Psychiatr. Sci. 2016, 25, 113–122. [Google Scholar] [CrossRef] [Green Version]
  50. Hosim, M.; Sulaiman, M.N. A Review on Evaluation Metrics for Data Classification Evaluations. IJDKP 2015, 5, 1–11. [Google Scholar] [CrossRef]
Figure 1. An overview of the existing strategies for detecting abnormal behavior (based on Refs. [27,28]).
Applsci 12 00235 g001
Figure 2. Typical structure of a system for detecting abnormal behavior based on the Activity Recognition Strategy.
Applsci 12 00235 g002
Figure 3. An example of defining normal eating habits and finding deviating behaviors by clustering a bidimensional dataset (start time and duration of meals). Abnormal activities A1, A2, A3 are outliers with respect to the clusters.
Applsci 12 00235 g003
Figure 4. An illustration of the abstraction of a residential space: (a) the actual floor plan with the locations of the motion detectors Mk and (b) the map of the generic 2D space indicating the locations of the behaviorally meaningful places P1-P4 (P1-bedroom, P2-Kitchen, P3-bathroom, P4-living room).
Applsci 12 00235 g004
Figure 5. (a) Grayscale image (128 × 128 pixels) illustrating the process of spatial diffusion from a single pheromone source placed in P4. (b) A similar image illustrating the superposition of the effects of two pheromone sources placed in P1 and P4. The intensity of the pheromone is encoded in shades of gray, where black corresponds to locations with no pheromone at all, and white corresponds to locations with maximum intensity of pheromones.
Applsci 12 00235 g005
Figure 6. A fragment of an activity map for 6 days.
Applsci 12 00235 g006
Figure 7. The proposed method to detect deviations from the previously recorded activity patterns: (a) Choose a reference interval (e.g., 7–12 days) with normal activity and create activity maps for each one hour time slice; (b) Plot the centroid points of the activity maps for each time slice across the reference interval; (c) Find the smallest circle that bounds the centroid points for the reference interval. The area delimited by this circle defines normal or typical activity patterns; (d) Check if the centroid of the current activity maps falls inside the normal activity area.
Applsci 12 00235 g007
Figure 8. Fuzzy domains (LOW, MEDIUM, HIGH) and membership functions (µ) for AL and AD, used to compute the probability of false alerts (PFA).
Applsci 12 00235 g008
Figure 9. CASAS HH-126 dataset: Plot of the centroids of the activity maps for the time slice (07.00 a.m.–07.59 a.m.). (a) Five days before 18 April 2014 (b) Five days after 18 April 2014. The circle is the SBC of the centroids of the activity maps created for the same time slice during the reference interval (1 February–10 April 2014).
Applsci 12 00235 g009
Figure 10. CASAS HH-126 dataset: Plot of the centroids of the activity maps for the time slice (17.00–17.59). (a) Five days before 18 April 2014 (b) Five days after 18 April 2014. The circle is the SBC of the centroids of the activity maps created for the same time slice during the reference interval (1 February–10 April 2014).
Applsci 12 00235 g010
Figure 11. Kasteren House C dataset: An illustration of how the system identified the time slice [00.00 a.m.–00.59 a.m.] from 6 December 2008, as an unusual moment for a snack. (a) the activity map for the respective time slice (b) plot of the centroid of the activity map vs. the SBC of the centroids for the corresponding time slices of the reference interval.
Applsci 12 00235 g011
Figure 12. Kasteren House C dataset: An illustration of a false alert, due to a pressure sensor that reports a high level of activity when the user was actually relaxing on a couch. (a) the activity map (b) the plot of the centroid of the activity map vs. the SBC of the centroids for the corresponding time slices of the reference interval.
Applsci 12 00235 g012
Table 1. The rule base of the fuzzy inference system for filtering false alerts.
Activity Level (AL)Activity Deviation (AD)Probability of False Alerts (PFA)
LOWLOWMEDIUM
LOWMEDIUMLOW
LOWHIGHLOW
MEDIUMLOWMEDIUM
MEDIUMMEDIUMMEDIUM
MEDIUMHIGHLOW
HIGHLOWHIGH
HIGHMEDIUMHIGH
HIGHHIGHHIGH
Table 2. Comparison of the proposed solution with other related work.
Criterion\StudyZekri et al.
Ref. [28]
Aran et al.
Ref [40]
Pazhoumand
et al.
Ref. [41]
This Work
Complexity/CostHighHighHighLow
ScalabilityLowLowLowHigh
UnobtrusivenesHighHighHighHigh
UsabilityLowMediumMediumHigh
AdaptabilityLowMediumMediumHigh
Publisher’s Note: MDPI stays neutral with regard to jurisdictional claims in published maps and institutional affiliations.

