Article

Comparison of the Conventional Approach and Augmented Reality on the Purchase and Selection of Food Products

1
Department of Art Studies, University North, Trg dr. Žarka Dolinara 1, 48000 Koprivnica, Croatia
2
Department for Multimedia, University North, Trg dr. Žarka Dolinara 1, 48000 Koprivnica, Croatia
3
Department for Packaging, Recycling and Environmental Protection, University North, Trg dr. Žarka Dolinara 1, 48000 Koprivnica, Croatia
4
Faculty of Graphic Arts, University of Zagreb, Getaldićeva ulica 2, 10000 Zagreb, Croatia
*
Author to whom correspondence should be addressed.
Appl. Sci. 2022, 12(1), 218; https://doi.org/10.3390/app12010218
Submission received: 11 September 2021 / Revised: 21 December 2021 / Accepted: 23 December 2021 / Published: 27 December 2021
(This article belongs to the Section Food Science and Technology)

Abstract

:
Packaging is seen as an integral part of the product and it has an important role in attracting consumers’ attention. The role of packaging is to create an expected reaction from the consumers, which affects their perception and choice of products in the buying process. The motivation for the research and writing of this paper was to find out which factors influence the purchase of chocolate the most. The research was done with the purpose of showing whether the same food products have a certain advantage in the process of choosing when presented to a potential consumer on two different media (analog and digital). The paper presents research on how the selected attributes and packaging elements, as well as the application of augmented reality (AR), affect the selection and purchase of one of the most popular food products. According to the obtained results, “Packaging appearance”, “Product Price”, “Brand preference” and “Product advertising” have the strongest influence on customers. The conclusion is that, in the process of choosing the chocolate packaging presented in this research, there is not much difference that depends on the medium those chocolates are presented on.

1. Introduction

Many different ways of classifying attributes and packaging elements that influence product selection and purchase can be found in the scientific literature. Packaging plays a major role in communicating the brand personality by means of several structural and graphic elements [1]. According to Smith & Taylor [2], there are six variables that producers and designers must take into consideration when creating efficient packaging: form, size, color, graphics, material and flavor. Vila & Ampuero [3] classify package elements into two blocks: graphic elements (color, typography, shapes used and images) and structural elements (form, container size, and materials). Similarly, Rettie & Brewer [4] classify packaging elements into two groups: verbal (for example, brand slogans) and visual (visual appeal, picture, etc.) elements. Likewise, Silayoi & Speece classify packaging elements into two categories: visual elements (graphics, color, shape and size) and informational elements (information provided and technology). Visual elements on packaging transmit information that affects a consumer’s emotions, while verbal elements transmit information that affects a consumer’s cognitive orientation [5].
An analysis of the available literature confirms that packaging could be treated as a set of different elements which have a role to communicate with the customer [6,7]. The type of message that is being sent to the customer depends on those elements. Taking into consideration previous research as well as all the elements and attributes of packaging that influence customer behavior in the process of buying, the elements can generally be divided into three groups: visual, informative and structural.
Packaging is crucial, as it is the first thing a customer sees before making a final purchasing decision [8]. Specific packaging elements send different information about the product to the customer and can, therefore, influence the customer’s choice and decision to purchase. The visual elements on the packaging are there with the purpose of making a product easier to spot in a bundle of similar products from different manufacturers, and in that way, it is possible to manipulate the consumer. It is the designer’s packaging appearance that convinces the customer to buy that exact product. In his work, Underwood explores how packaging influences the creation of brand identity communication [9]. Additionally, Underwood & Klein prove in their research that consumers use packaging as an external mark that helps them make a conclusion about the product properties [7].
This research focuses only on visual and informative elements in graphic design (color, typography, graphics, and textual product information), while structural elements and technical packaging attributes are not the subjects of this research. Wu shows the influence of food package design on brand marketing in his research. Furthermore, he expounds the brand influencing factors as those that are different from elements of visual communication, such as patterning, color, format, font, material [10]. It is determined that packaging materials have the strongest influence on consumers’ purchasing intentions, followed by color, font style, packaging design, and printed information [11]. Rad et al. came to a conclusion that all elements in chocolate packaging graphic design have a positive and significant impact on increasing chocolate sales [12]. Likewise, Demo et al. explore what relevant features customers see in chocolates when buying them. They offer a useful starting point from which further theoretical and empirical research of customer relationship management, branding strategies, brand loyalty, and brand experience in the chocolate market can be built [13]. The aim of this paper is to investigate which specific parts of the packaging product affect the choice of chocolate. The paper also investigates the influence of display on different media and its effect on choosing a product, which is something that has not been previously investigated.
Color is treated as a useful packaging element. Color is an element that can make a brand distinctive compared to all other competing brands. Consumers evaluate the color of packaging used via the product link. According to consumers, this means that there are some colors that can be used for each product category while all the remaining colors are a misfit for that particular product category. According to Keller, color is an essential component of packaging since consumers expect a certain type of color for particular products. Companies use different colors for emphasizing different moods. For instance, black is used for power, blue for trust, red for energy, green for balance, organic or fresh [14]. Kauppinen-Räisänen explores in her work a little-known issue of packaging color functions, specifically how colors help capture consumers’ attention and affect perceptions at the point of purchase [15].
Graphics not only help marketers in making their product unique, but they also help them in highlighting their brand name more effectively by maintaining the product’s individuality and identity on the shelves [2]. Information conveyed by verbal elements is helpful in initiating or boosting the consumer’s thought process [5]. Visual elements on packaging are a useful tool in influencing motions in the target market. Marketers can use a lot of visual elements on packaging when a product is associated with a category that requires low customer involvement and customers do not want to waste their efforts in searching for different products. In addition to the basic packaging factors and elements, the quality of printing can also have a significant impact on the perception of a product [16]. This paper analyzes the influence of three types of printing substrates on the quality of reproduction.
Chocolate is generally an acceptable product regardless of age group and it is used as a subject in many studies. Chocolate is also one of the popular gifts among people and for that reason, it was selected as the research subject. Packaging is the first impression of a chocolate product on a consumer and it influences the consumer’s selection and purchase of a product.
Much research focuses on three separate groups of packaging elements in chocolate: visual, informative and structural elements. Kovač et al. research a group of visual elements on food packaging (i.e., strawberry chocolate packaging) in order to analyze the power of packaging to capture attention [17]. It is established that graphics, patterns and colors have a significant impact on the choices of chocolate packaging. Maleki et al. analyze the influence of two design variables of chocolate packaging: material and graphics. They analyze the impression they leave on consumers and their willingness to buy [18]. It is determined that packaging material has the strongest influence on consumer purchase intentions followed by packaging color, font style, packaging design and printed information. Gunaratne et al. study the effect of packaging properties on the visual perception of chocolate consumers [19]. The objective of this research is to evaluate the effect of chocolate packaging design on consumers’ sensory liking and willingness to purchase.
Similar research on chocolate products was previously conducted with the aim of determining the impact of chocolate packaging and brand on the purchasing decisions of children and their parents [20]. Underwood et al. investigate in their work empirical results from a virtual reality simulation and conclude that packaging pictures increase shoppers’ attention for the brand. However, occurring attention was present only for low familiarity brands [21].
Rebollar et al. analyze the influence that certain aspects of packaging design have on consumers’ expectations of a series of sensory and non-sensory attributes and on willingness to buy a certain food product [22]. In their research Da Rosa et al. investigate the way that the shape and color of packaging together with product categories together influence product selection [23]. Silayoi and Speece show the importance of packaging design and its role as a channel for consumer communication and product branding [24]. In their research, Ahmad et al. conclude that the packaging colors are the most important and significant features when purchasing a product [25]. Kuo et al. also investigate what effect certain color combinations have on purchasing food products [26]. Li researches in his work the way to use new technologies and new methods in order to design interactive visual communication packaging design for the product [27].
The main research goals are listed below:
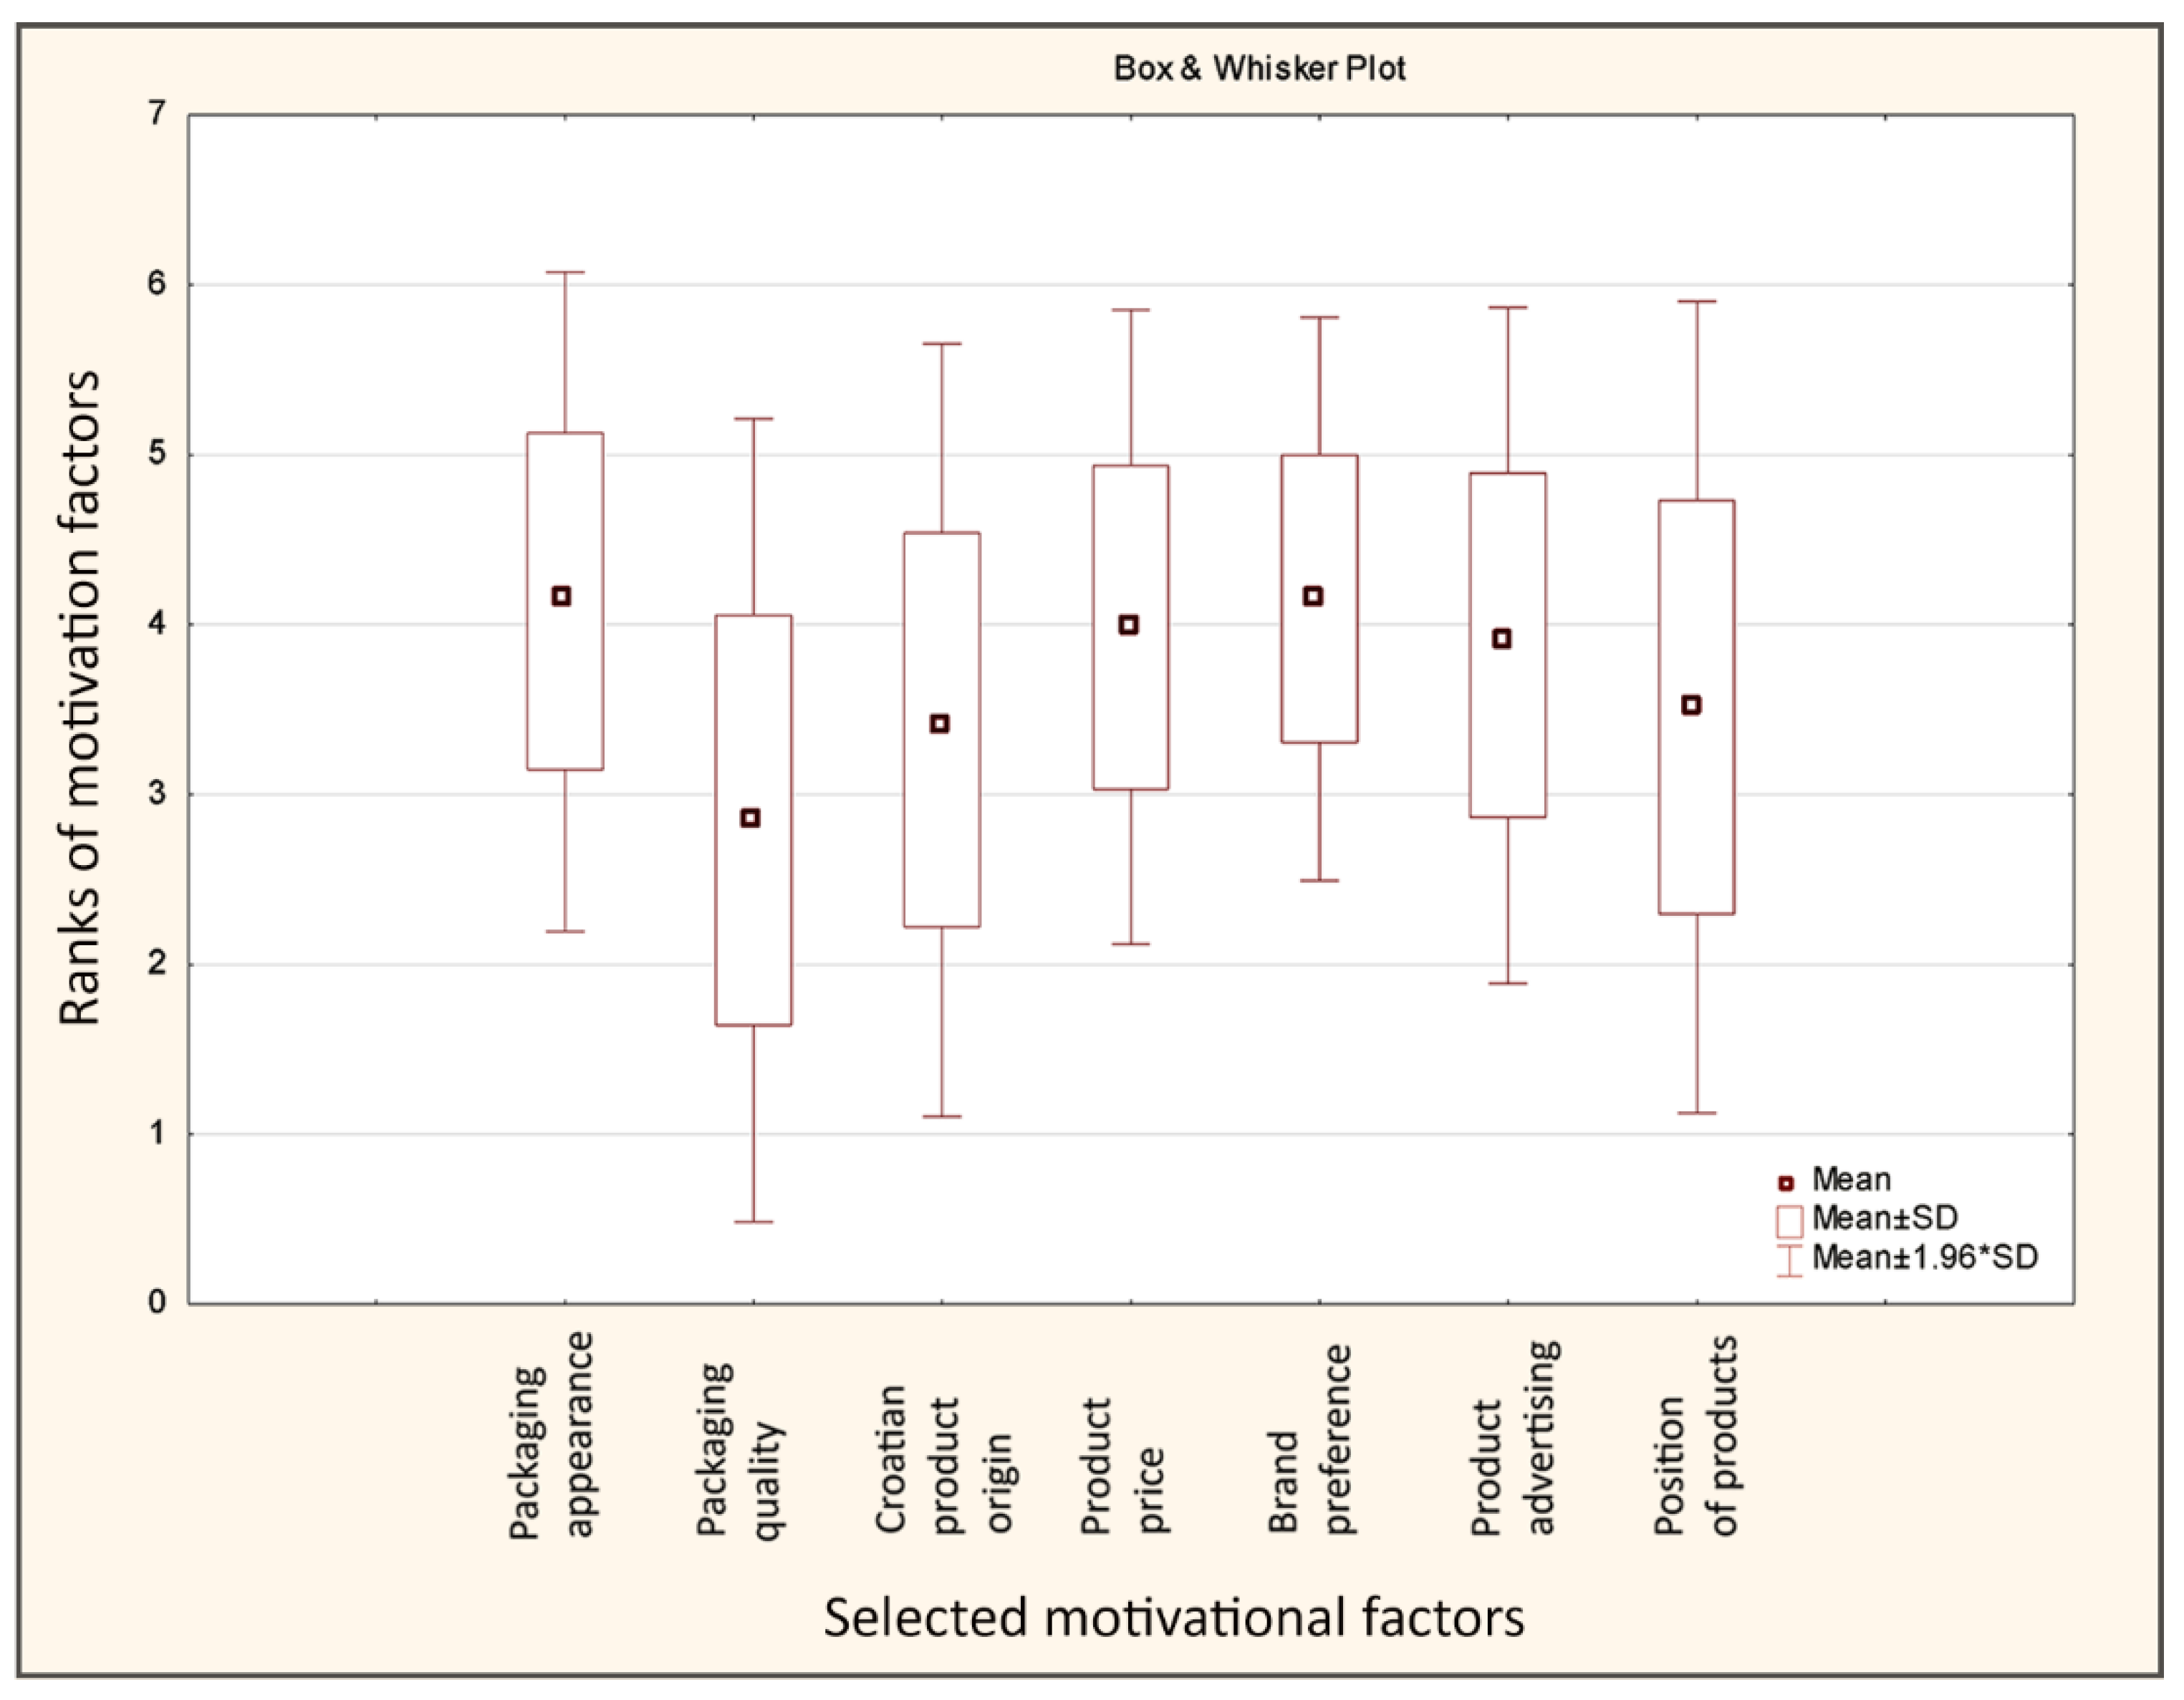
  • examine the influence of basic features on packaging, and its promotion, on the decision to purchase a food product (Packaging appearance, quality of packaging, origin of the product, product price, Brand preference, advertising of a food product, product placement on shelves).
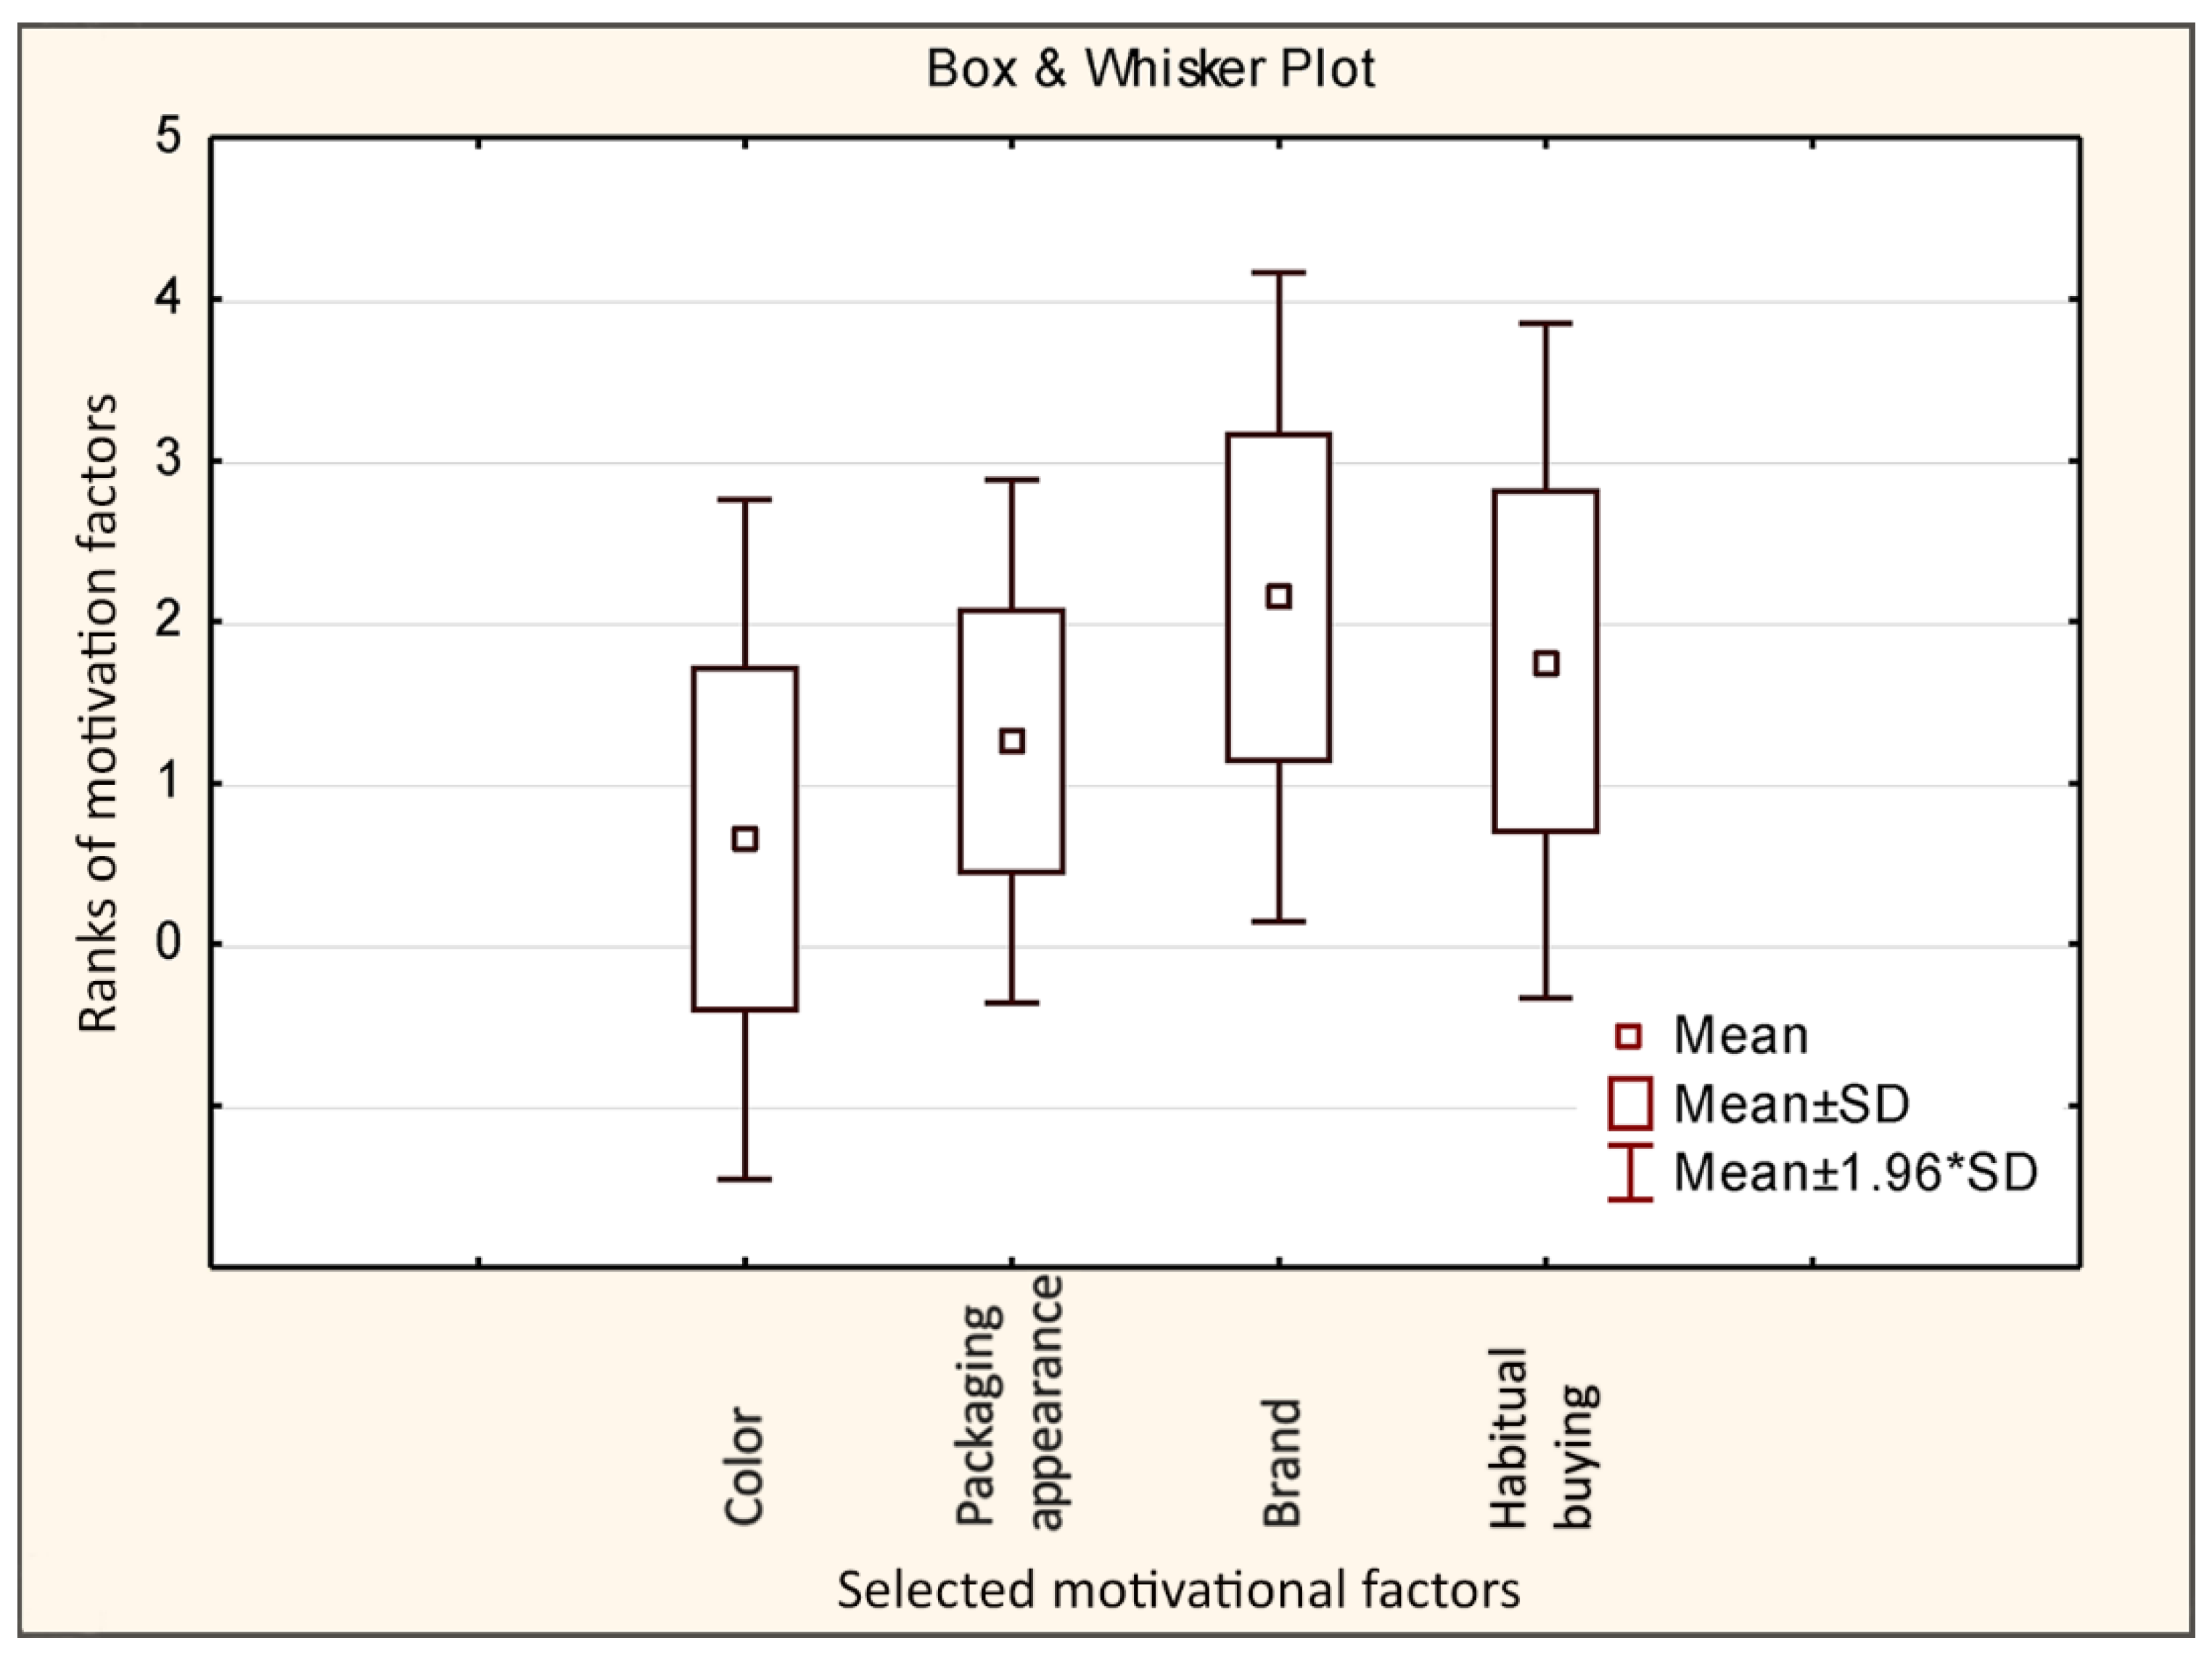
  • determine the motivational factor which most affects the purchase of food products offered to the respondents via analog media (brand, Habitual buying, Packaging appearance and dominant color).
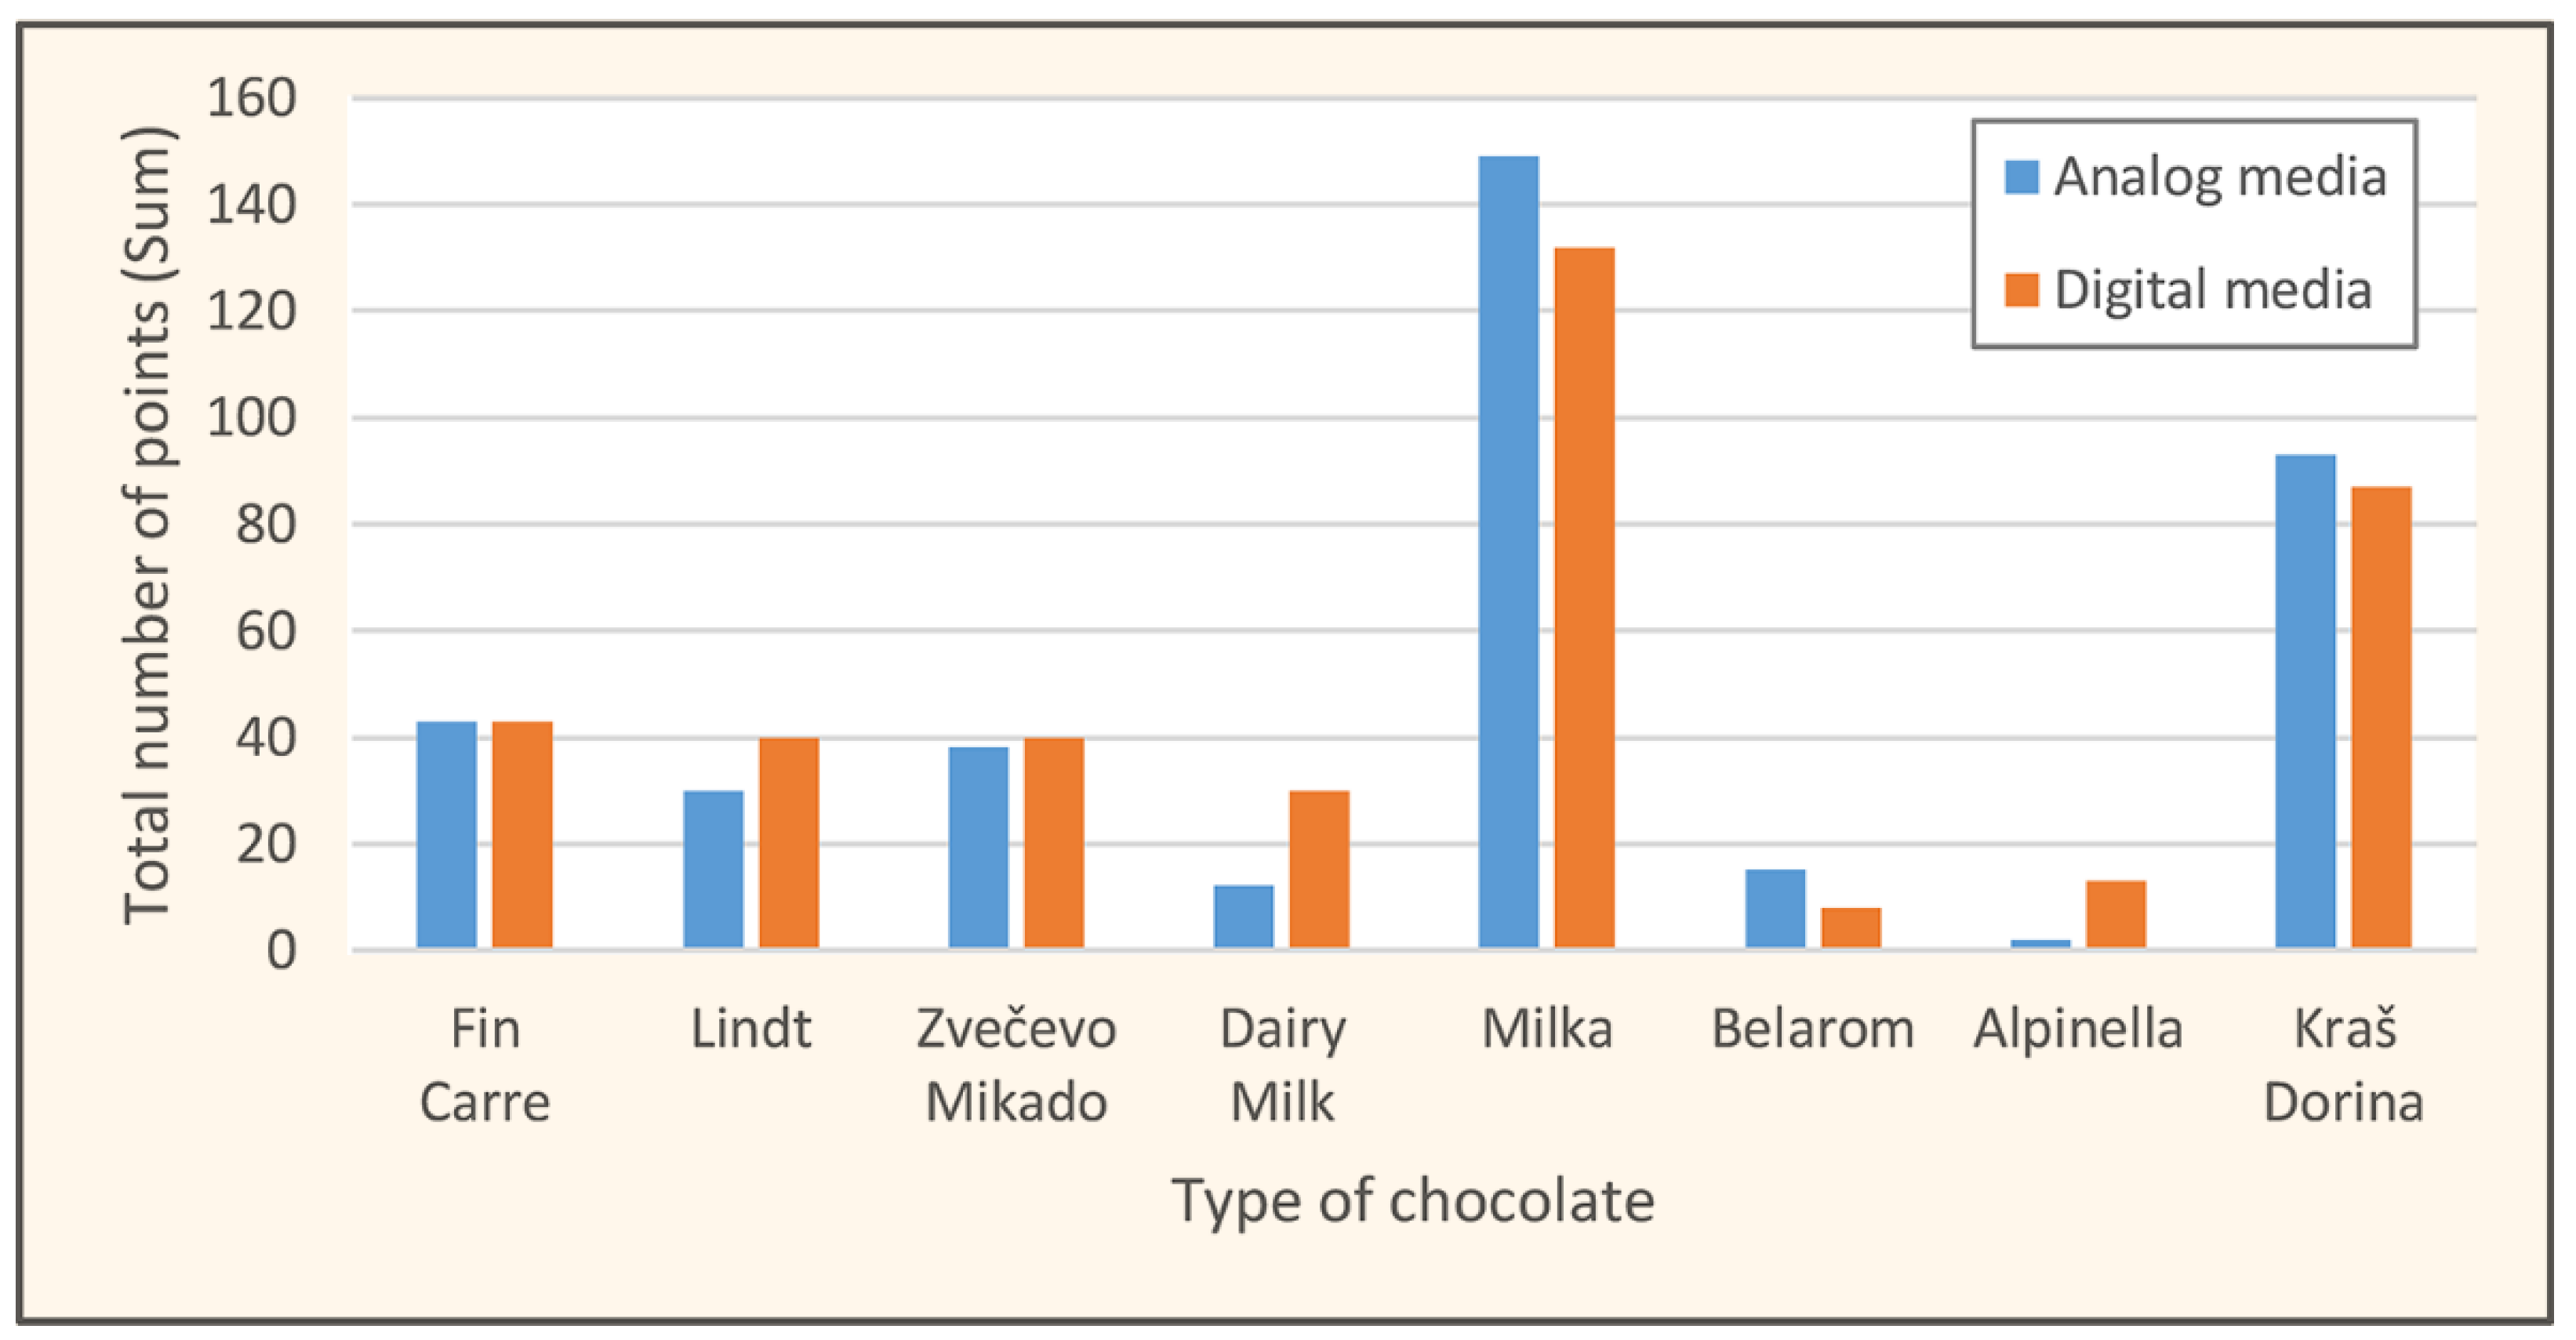
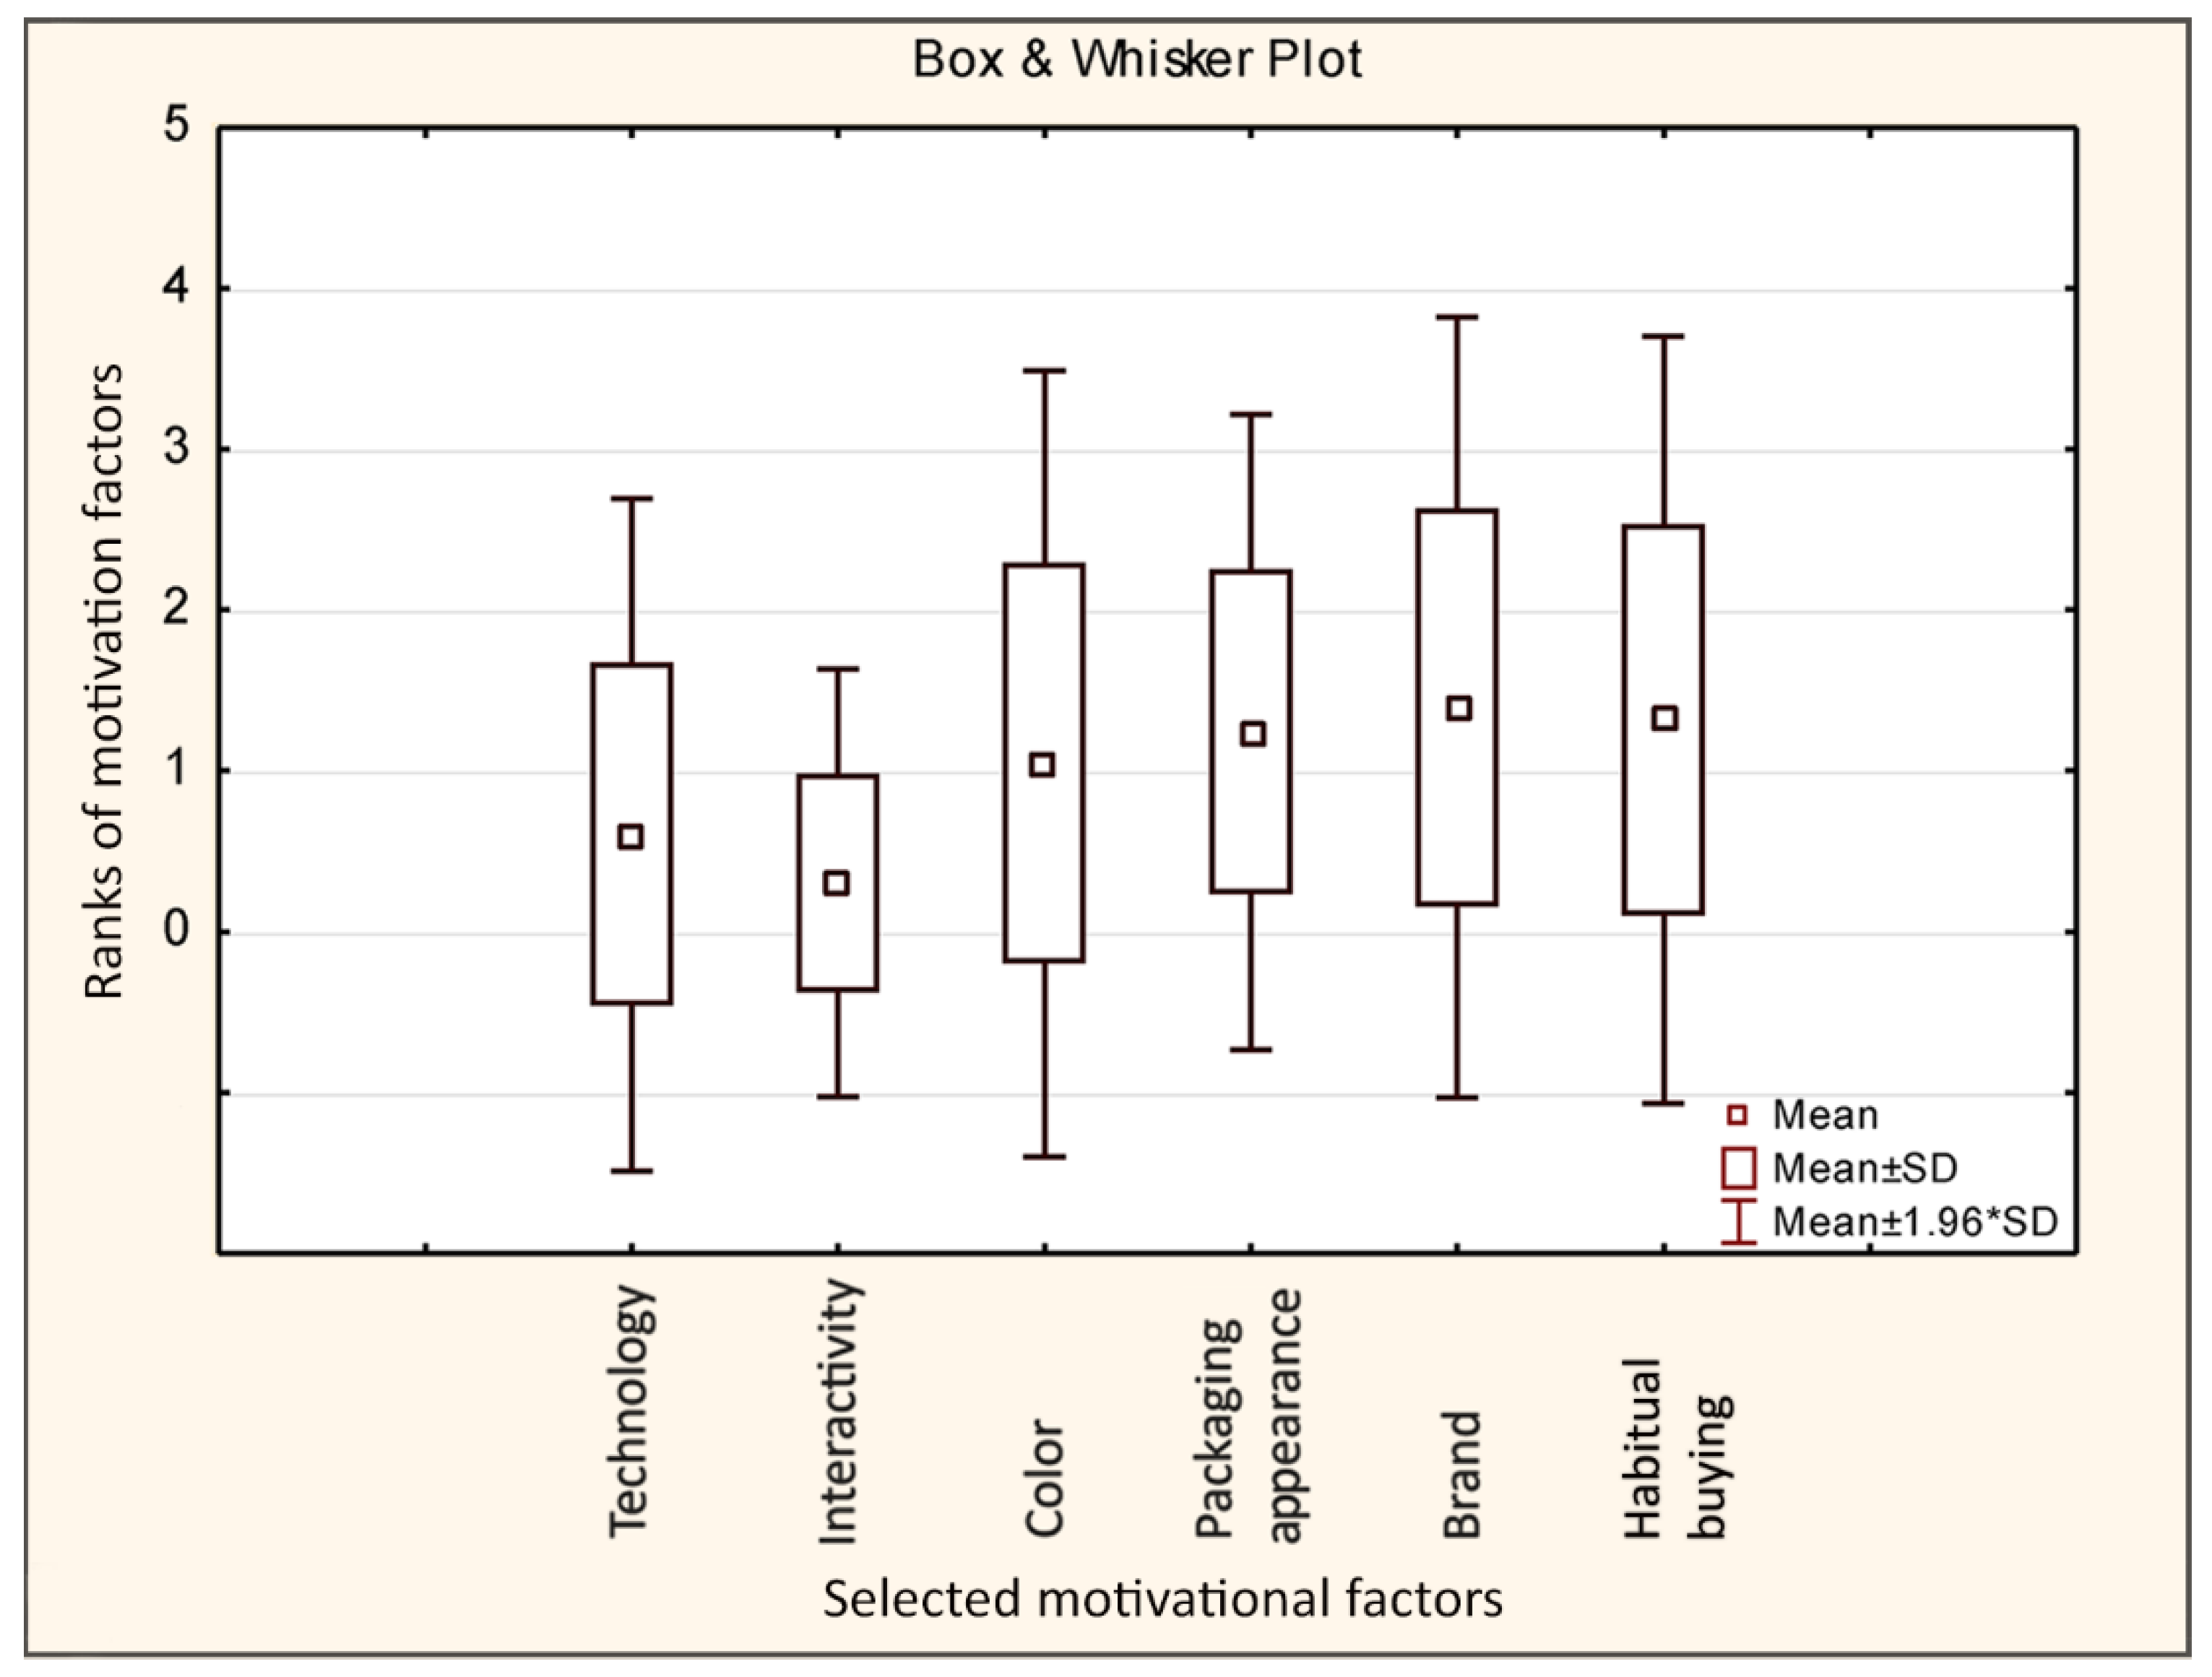
  • compare a conventional approach of presenting a chocolate product using printed packaging against the approach that uses the application of augmented reality and digital technology.
Wang’s study was conducted with the goal of creating a theoretical framework and showing a correlation between consumers and visual food packaging. The following variables were included in the study: perceived product quality, product value, and brand preference [28]. On the basis of the above-mentioned study, this study was planned with several limitations. The limitation of the study was the fact that the respondents are students of one particular technical field. Additionally, product packaging was shown on analog media (imprint) and not on actual physical packaging. Based on this research, the following goal is to see what impact other food and non-food products presented on two different media would have on consumers’ selection of a product. In addition, future research could be extended to a wider population. Additional variables, such as time constraints, could be introduced.

2. Methodology and Experiment

First year undergraduate students, from the Department of Multimedia, Design and Application at University North, took part in the research. The total number of respondents was 66, out of which 52.3% were male and 47.7% were female. All respondents belonged to the 21–27-year-old group. All respondents took a test used for detecting defective color vision. Only those who met the test criteria were able to participate in further research. Previous findings show no apparent difference in how men and women perceive product packaging [29]. The analysis of the results was divided into three main categories: the analysis of the factors that influence the purchase of food products, the analysis of factors that influence the choice of products in analog or conventionally printed packaging, and digital media, i.e., augmented reality. All data were statistically analyzed using STATISTICA 13 software (Stat Software, Tulsa, OK, USA). A significance level of p < 0.05 was chosen for all statistical tests conducted in the research, as this is a standard used in this type of research. The study involved n = 66 subjects, as previously mentioned. A similar study with identical statistical methods was conducted in South Africa. Its aim was to determine the influence of the chocolate packaging color on the purchase of a chocolate product [30]. Another study was conducted which investigated how packaging colors affect the expectations of sweetness, bitterness, fruitiness, melting, and liking for chocolates in Brazil and France [31].
Respondents first chose a chocolate product by using a questionnaire with the analog template and were later instructed to look at the digital AR visuals using the tablets. They were asked to select a product again. Flyers (retail catalogs) are still greatly used to advertise most of today’s products, while digital media is used to a lesser extent. Therefore, the consumer first sees most of the products on analog media.

2.1. Instrument Design—Questionnaire

A questionnaire was created for the purpose of this research. It consists of closed-ended questions that are divided into two parts. The full questionnaire can be found in Appendix A.
The first part of the questionnaire contains the questions on what affects the user when choosing and purchasing a food product. The respondents rate the claims related to the appearance and quality of packaging, origin and price of the product, as well as the brand influence, advertising and finally, the position of the product on store shelves in accordance with the Likert scale ranging from 1 to 5.
The second part of the questionnaire refers to the selection of eight types of chocolates presented on analog and digital media using AR. Further, the respondents determine which factor most influenced the previous selection. On the analog display, the following factors were examined: color, packaging appearance, product brand, habitual buying. On the other hand, on the digital AR display, there are two more factors added: display technology and interactivity. The answers to the questions range from one to three (“First choice”, “Second choice” and “Third choice”). Using a simple ranking method, respondents determine the order of three products (A, B and C) according to their preferences from a larger group of products, starting with the products they want the most [32]. The simple ranking technique has the advantage of being easy to use, but it does not reveal the feelings or preferences of respondents for each product separately. The method of simply ranking three products was acceptable for this experiment because there were not too many products offered (eight products were offered in the experiment). In this part of the questionnaire, the respondents give an answer based on analog templates and the application of AR technology on a tablet.
The questionnaire was created via the Google Forms system and published under a special URL link available only at the time of the research. The safeguard measure against filling out the questionnaire for a second time and filling in answers outside the experiment period was created using an option embedded in Google Forms system. This option registered user activity only when the questionnaire was open.

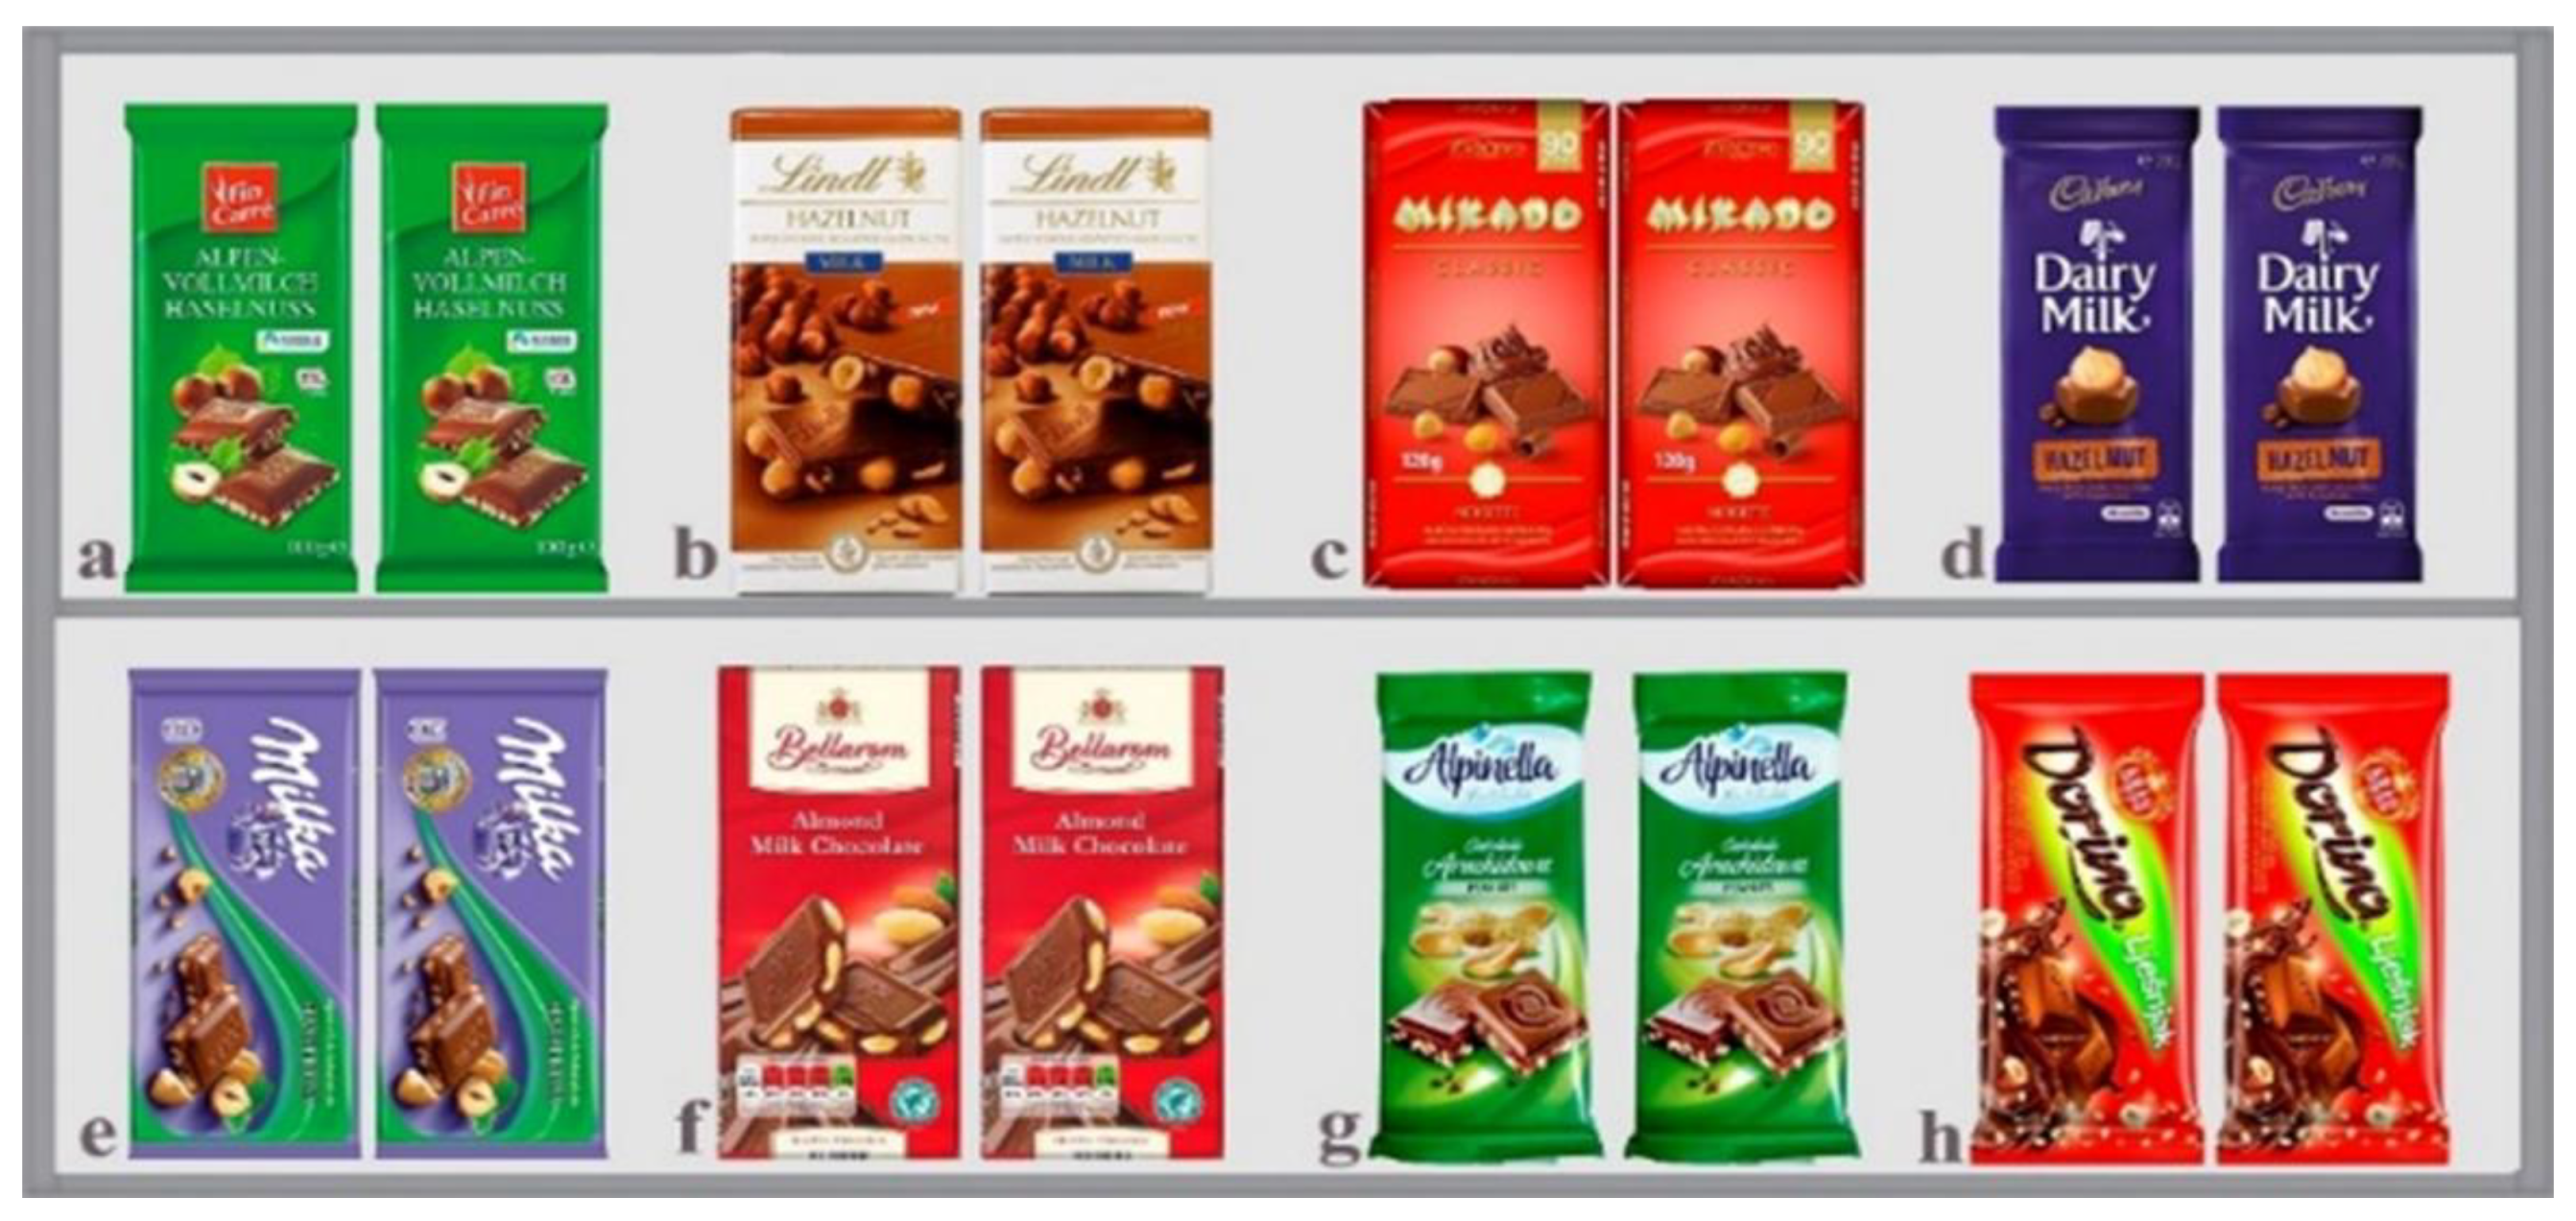
2.2. Instrument Design—Analog Visuals

For the purposes of research, evaluation visuals containing food products (chocolate), the same ones found on store shelves, were created using the Illustrator CC program. The visual template was reproduced using Canon Image Press C 600 i, a calibrated machine for electro photographic digital printing which works on a toner powder principle. Coated paper for artistic printing (kunstdruck matt, weight 240 g/m2), 32 × 45 format, was used as a printing base. Prior to printing, the printing medium was conditioned in a room for 48 h in the prescribed standard ambient conditions (temperature 23 °C and relative humidity of 55%). The test sample contained a total of eight evaluated products (chocolate) with the corresponding numberings that were specified during the selection: (a) Fin Carre, (b) Lindt, (c) Zvečevo Mikado, (d) Dairy Milk, (e) Milka, (f) Bellar, (g) Alpinella, (h) Kraš Dorina (Figure 1).

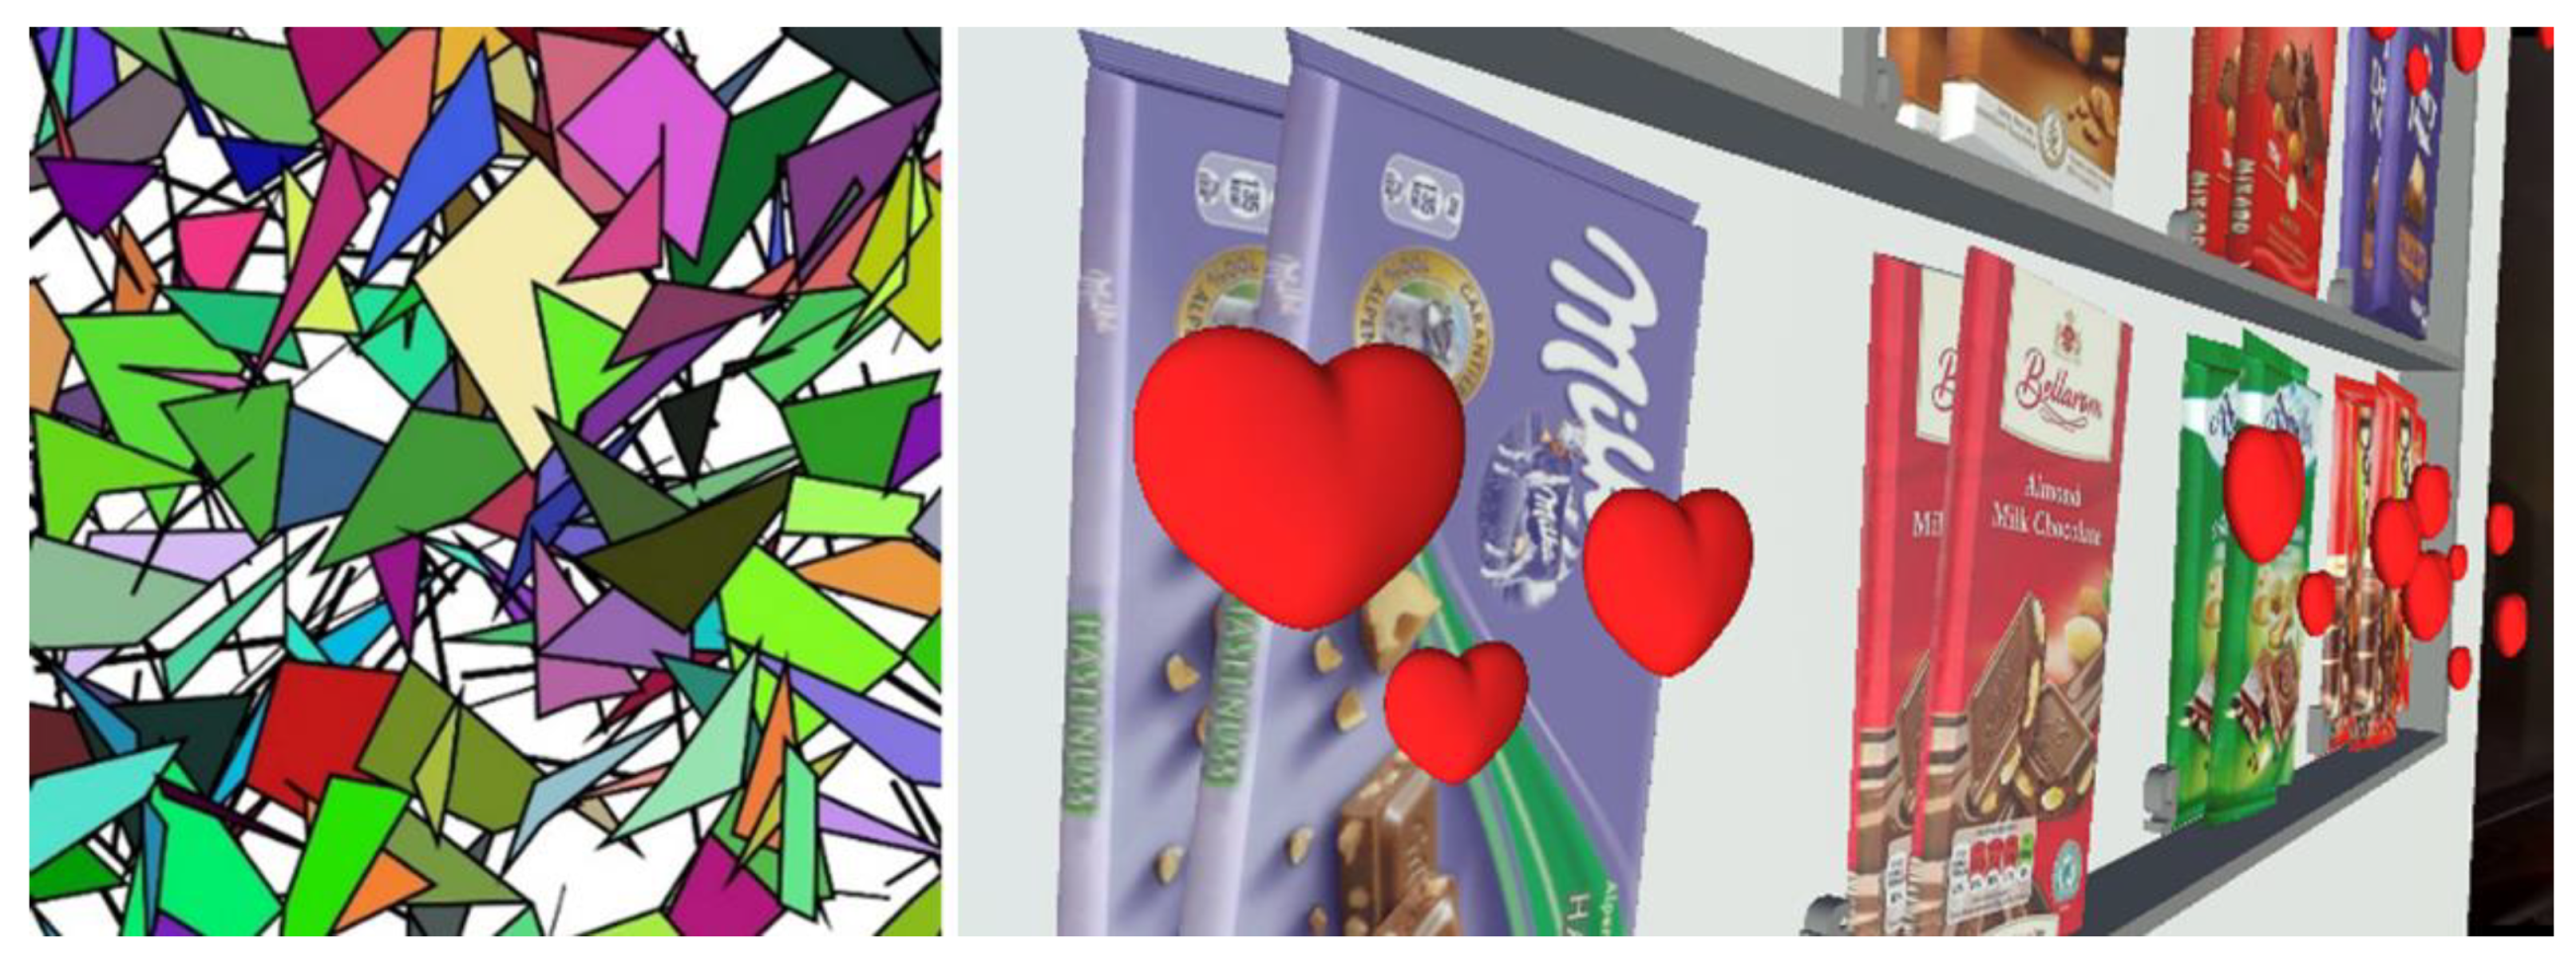
2.3. Instrument Design—Digital Visuals

Through the interoperable Unity 2018.3 platform and Android Studio, a software solution was created in .apk file form and was installed on 15 Android tablets. Samsung Galaxy Tab A tablets with a 10.1-inch screen diagonal were used in the research. The tablet screen resolution is 1200 × 1920 pixels, density 224 ppi. The operating system for which the AR application was created is Android 8.1.
The mentioned application was linked using Vuforia technology with a specially created marker that serves as a trigger to start digital visualization on the tablet screen. A marker could be any image that, through Vuforia or a similar application, turns into a cloud of dots that make up a particular pattern. When the tablet’s camera scanned the marker, the program recognized the dot cloud pattern and automatically launched the digital vision of the product across the tablet’s full screen. Uniform or repetitive patterns should be avoided, and for this reason, the analog product template was not used as a marker, primarily due to the rectangular shape of all eight product visuals.

2.4. Sample Evaluation

An Internet browser with a questionnaire was launched on respondents’ workstations. Analog templates classically made, in print, were valued under standard CIE lighting D50 (5000 K) so that the respondents in all groups had the same color experience on the visual. The experiment was conducted in accordance with standard ISO 3664:2009 observation conditions which define the observation conditions for graphic technology and professional photography, a viewing angle of 10° and a respondent distance of 60 cm, obtained according to the formula [33].
tg V A 2 = H / 2 D
where VA is the viewing angle, H is the size of the test sample, and D is the distance of the respondent [34,35].
Respondents did not have prior access to templates. They were instructed to independently complete a questionnaire up to the part that ended with ranking the product on an analog template. Once the answers were collected, students were instructed, in the second part of the questionnaire, to use the tablet and scan the marker located on the back of the template. By scanning the 2D marker, the tablet displayed a digital AR visual with additional information that was not visible on the analog template. AR elements were heart-shaped in order to stimulate positive emotions in respondents, and at the same time not to avert attention from the product itself. The heart symbol was chosen because of its universality and subliminal emotional meaning. Additionally, in this way respondent’s attention stayed on the packaging, which was the main intention. There was an option that would give respondents the possibility to open every package of chocolate and reveal its inner design. However, that would mean that users distanced themselves from the overall package design. Therefore, 3D chocolates and hearts were chosen for this experiment. Additional AR elements did not cover some more important elements of the packaging design (brand name, chocolate image). It was made sure that key product information was clearly visible, as well as the product layout on the analog template. In this example, augmented reality provided the user with an interactive three-dimensional view of the initial 2D visual on a template, where the respondents were able to view products from all angles, rotate them, and study them in a more natural way than on an analog template. The appearance of the marker and the tablet display is shown in Figure 2.

3. Results and Discussion

3.1. Analysis of Factors Influencing the Purchase of Food Products

The aim of the statistical analysis is to determine the influence of a particular factor (statistical variable) on the selection and purchase of a particular food product. Waheed et al. conclude that the results indicate a significant effect of product packaging on consumers’ purchase intentions [11]. In their research, Maleki et al. conclude that packaging material influences some of the components of sensory expectations, brand attitude, quality and price perception, while graphic design influences most of those. Willingness to buy is more related to the packaging graphic design than to the material [18]. The majority of research dealing with the impact of packaging on product purchases comes to the conclusion that color has a major impact on the product selection itself [15,17,23,26]. This research was extended to other variables (apart from color, which had a great influence on product selection) that could also influence product selection. The impact of seven variables were analyzed: Packaging appearance, Packaging quality, Croatian product origin, Product price, Brand preference, Product advertising and Position of products on shelves. The respondents (n = 66) had the task of evaluating seven selected variables with repeated grades from the Likert scale ranging from 1 to 5. Below is a Box & Whisker results chart, which clearly shows the results of a survey questionnaire on motivational factors for the purchase of food products.
The difference of the arithmetic mean between the first four ranked variables is 0.27, which means that there is no variable that has a significantly greater impact on the selection and purchase of products (Figure 3). According to analysis, the variables “Brand preference” with the arithmetic mean of 4.15 and “Packaging appearance” with the arithmetic mean of 4.14 had a slightly greater influence on the selection and purchase of food products. Although the product price is ranked third (mean = 3.99), it also had a significant impact on the purchase of the product, which means that customers aim to make the most favorable purchase. Research showed that “Packaging quality” had the least impact on the purchase, holding the arithmetic mean of 2.84. A little unexpectedly, “Croatian product origin” as a four-ranked variable had a slightly smaller impact on product purchase. Therefore, a single deciding factor for product selection and purchase could not be pointed out. The appearance of packaging as a visual connection factor between the customer and the product proves to be an important factor that consumers pay attention to when buying. However, customers consider other factors, such as brand and price, which are often decisive in selecting a product.
The variable “Packaging appearance” had a frequency of 30 respondents and achieved the maximum mode 5 value. The variables “Packaging quality” and “Croatian product origin” achieved the lowest mode 3.
Kolmogorov–Smirnov test showed that the data was not normally distributed in any of the variables (p < 0.05). For the purpose of the research, a non-parametric Friedmann ANOVA was performed for dependent samples with repeated measurements. The aim of the conducted tests was to identify the pairs of observed variables, which have statistically significant differences. The ANOVA chi-square amounted to 80.948 with 6 degrees of freedom, with a statistical significance of p = 0.000 according to the Friedmann test. The mentioned indicators clearly point to the existence of statistically significant differences between the grades of the observed variables.

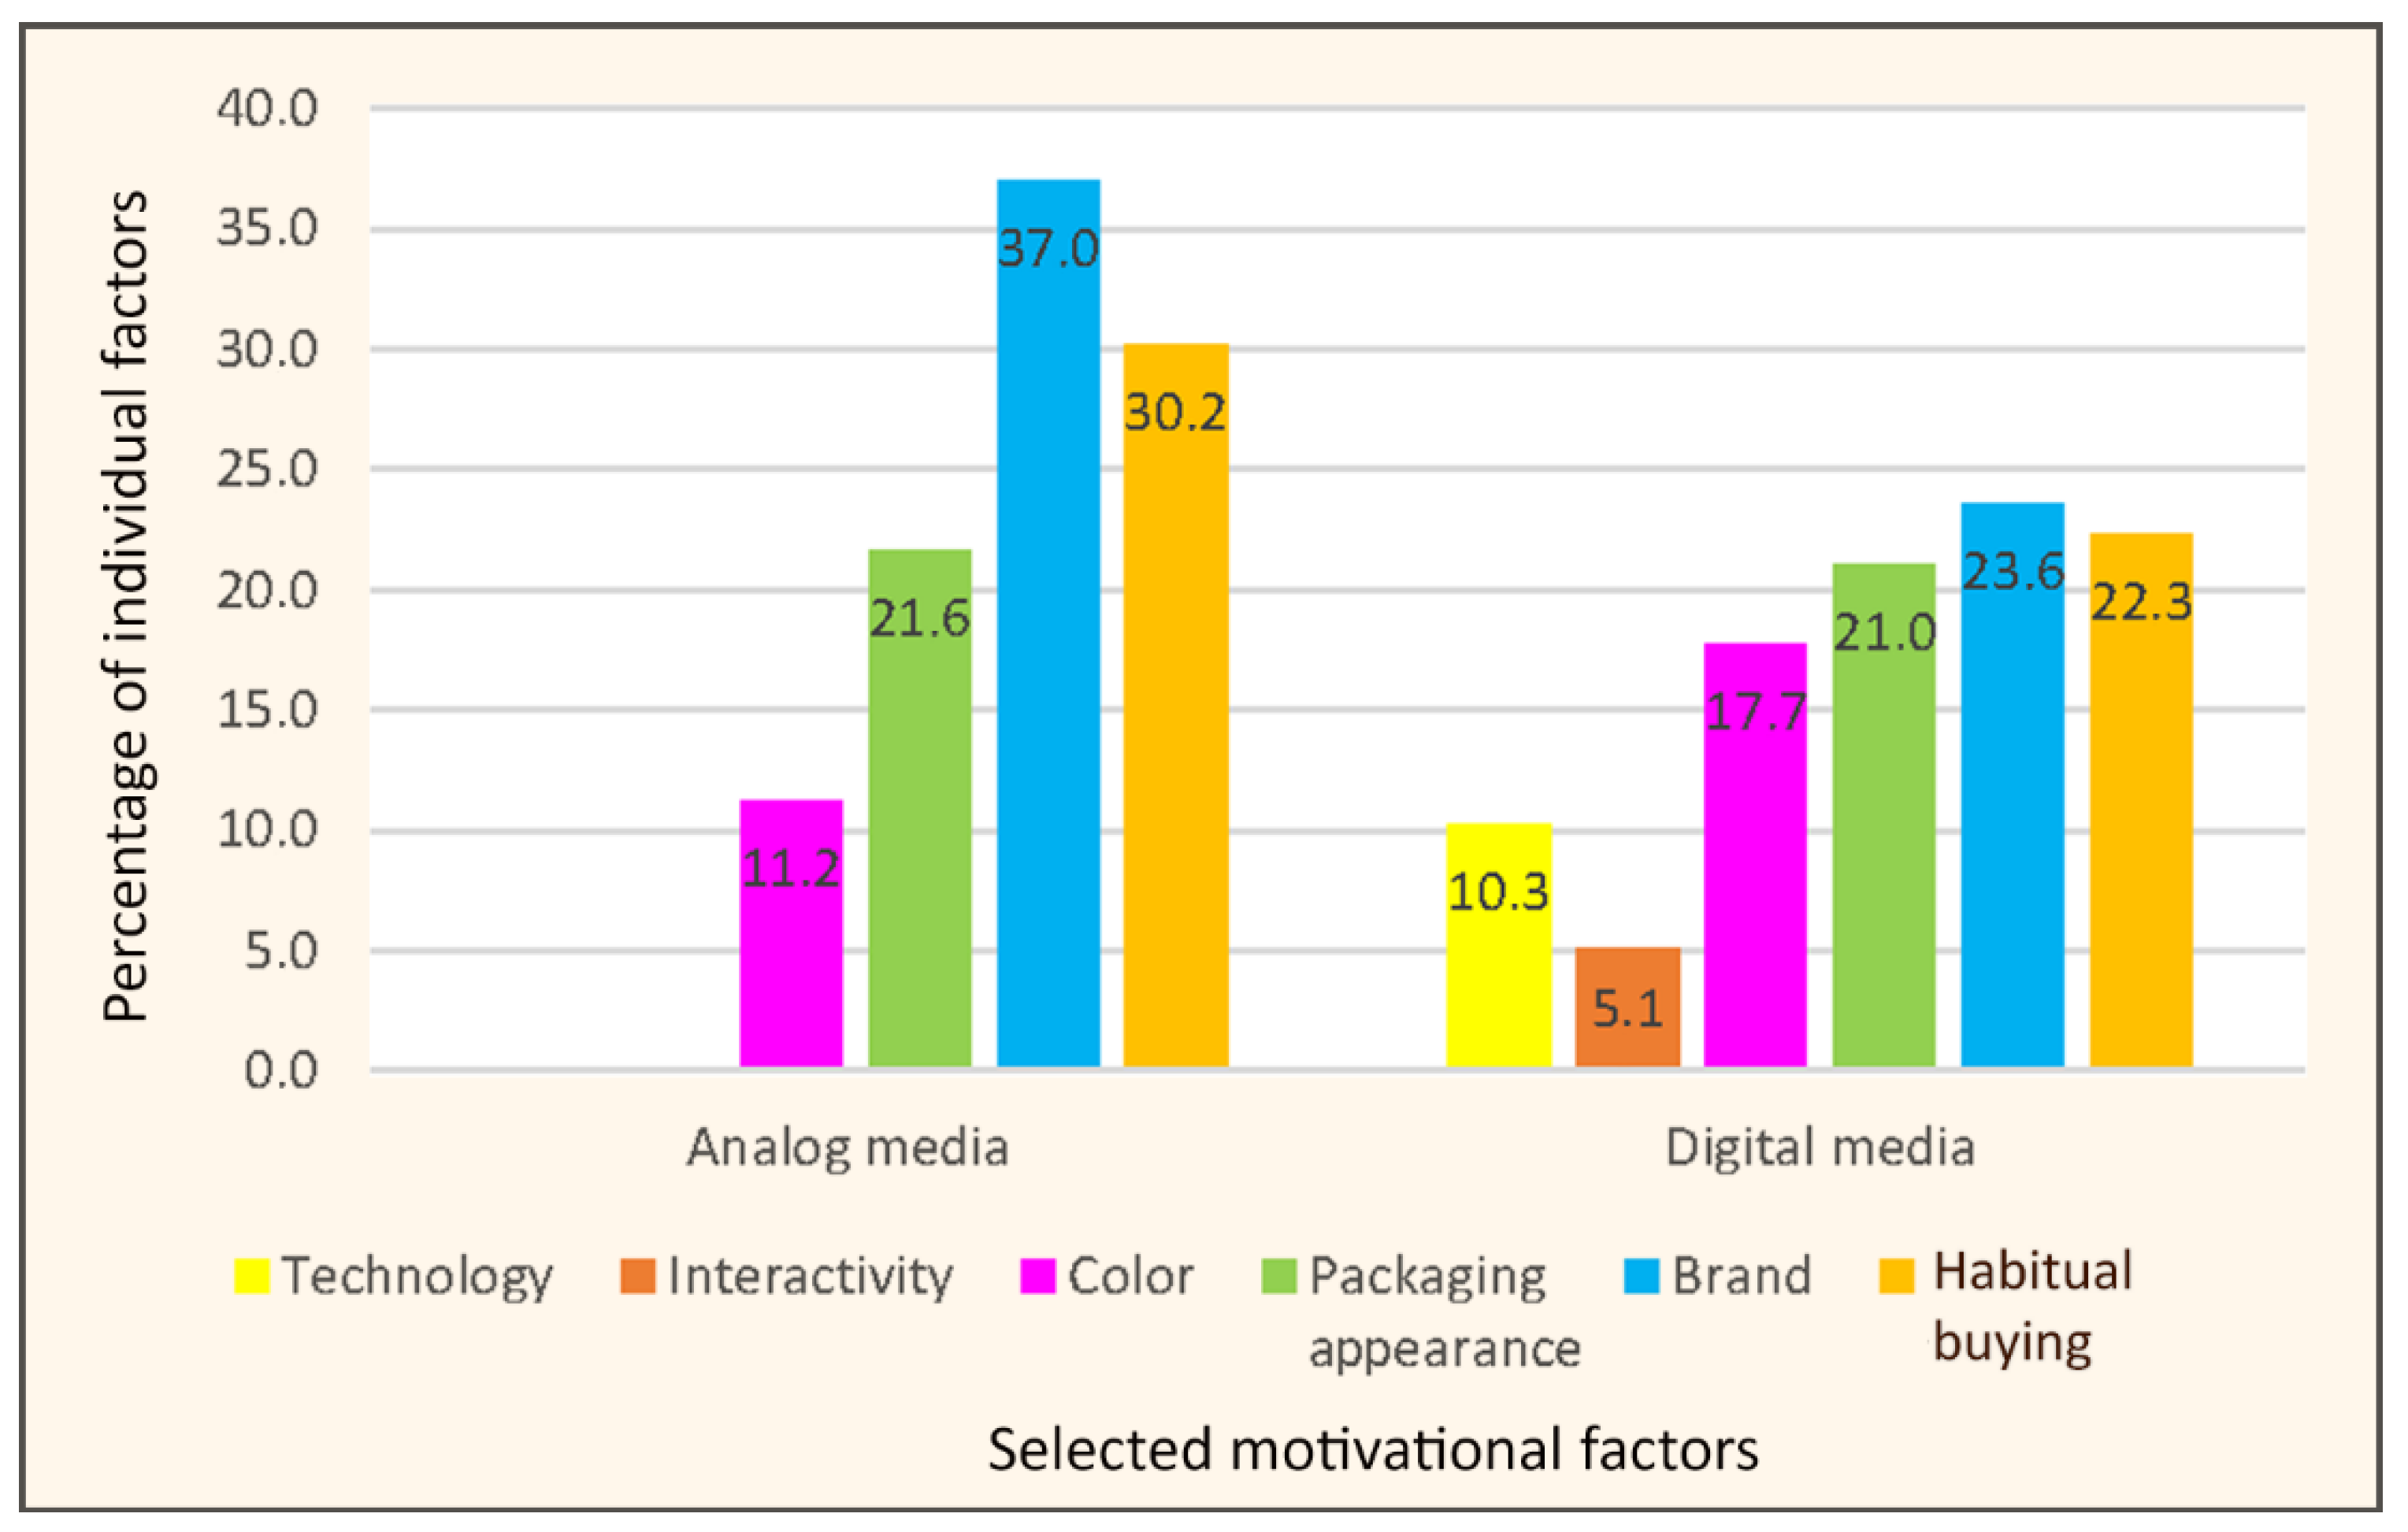
3.2. Comparison of Chocolate Choices on Analog and Digital Media

This paper presents an experiment that consisted of choices made by respondents of identical food products (chocolate) on two different media: the analog print media (which is a conventional approach) and the digital media (i.e., augmented reality). Descriptive statistics ANOVA and the Kolmogorov–Smirnov test used for checking the normality of the data were implemented. The aim was to determine if the media exerted any influence on the choice of chocolate.
The respondents (n = 66) were given the task to make the first, the second and the third choice among eight offered products, first on the analog and afterward on the digital media. In similar research on a younger population (11–27-year-old respondents) authors explored how information and visual aesthetics of chocolate packaging influenced product selection. The results showed that an attractive package design was of paramount significance in the first instance when purchasing chocolate bars. The important factors which affected the buying decision were ‘Information’ and ‘Visual aesthetics’ [36]. For the purpose of statistical tests, points were awarded based on the results. A food product that was the respondent’s first choice was awarded 3 points, the second choice was awarded 2 points, and the third choice was awarded 1 point. The products that were not chosen by the respondent were awarded 0 points. Chocolates were indexed for better clarity and visibility: (a) Fin Carre, (b) Lindt, (c) Zvečevo Mikado, (d) Dairy Milk, (e) Milka, (f) Bellarom, (g) Alpinella, (h) Kraš Dorina.
The individual variable in the graph is shown with the total number of points obtained, i.e., the sum of points obtained based on respondents’ ranking (Figure 4). The results clearly show that the Milka chocolate, with a sum of 149 points awarded to it, is convincingly the most desirable chocolate chosen by the respondents based on the packaging shown on the analog media. The amount of its arithmetic mean is very high (2.257). The median of this variable amounts to the maximum amount. Furthermore, 41 respondents (out of 66) marked Milka chocolate as their first choice. Following Milka chocolate, the highest number of points was awarded to Kraš Dorina chocolate (mean = 1.409, sum = 93 points). Therefore, this chocolate was the respondents’ second choice 24 times in total. The Fin Carre chocolate was ranked third and followed by Bellarom and Alpinella chocolates.
The values of the variances and standard deviations were expectedly high given the way in which points were awarded. The results of the Kolmogorov–Smirnov test showed that no variable was normally distributed. Furthermore, descriptive statistics of respondents’ choice results on digital media were carried out. Results of the descriptive statistics showed that even in the case of digital media, Milka chocolate was the most desirable food product chosen by the respondents (Sum = 132). Exactly half of the respondents (33 out of 66 respondents) made Milka chocolate their first choice. Kraš Dorina chocolate was ranked below Milka chocolate with a value of a points sum 87. The Fin Carre chocolate was ranked third, with a point sum of 43.
As the variables were not normally distributed, non-parametric Wilcoxon tests for dependent samples were carried out. The aim was to compare the values of the chocolate choice results and their distribution on analog and digital media.
The results of Wilcoxon tests confirmed that with the level of significance (p < 0.050), there were generally no statistically significant differences in the choice of chocolate on the analog and digital media (Table 1). Statistically significant differences were found in only two cases, namely for Dairy Milk chocolate with the empirical p-test value of p = 0.023 < 0.050 and Alpinella chocolate with the empirical p-test value of p = 0.028 < 0.050. As for the remaining chocolates, Wilcoxon tests showed that there were no statistically significant differences in the distributions of choices with respect to different media. It is important to note that both types of chocolates in which no statistically significant differences were found among their values were also the ones that were not highly ranked by respondents. The obtained results clearly indicate that, in the respondents’ case, the media does not influence the choice of the food product.

3.2.1. Analysis of Factors Influencing the Choice of Chocolate on Analog and Digital Media

The first part of this chapter gives an analysis of selected factors (statistical variables) that influenced the choice of a chocolate product on analog media. The experiment was conducted in such a way that the subjects chose three factors that motivated their purchase the most. The respondents chose in the following order: the first choice (3 points awarded), the second choice (2 points awarded) and the third choice (1 point awarded). If no factor was selected, 0 points were awarded. The influences of the factors (Color, Packaging appearance, Brand and Habitual buying) for chocolates offered were researched on printed media. A detailed descriptive statistical analysis of respondents’ answers was made. The respondents had to choose motivational factors.
In order to determine the statistically significant differences between samples, a non-parametric Friedmann ANOVA was performed for dependent samples with repeated measurements. The ANOVA chi-square amounted to 50.366 with 3 degrees of freedom, with the statistical significance of the Friedmann test being p = 0.000 < 0.050. Results suggested the existence of influencing factor pairs that are statistically significantly different, with a significance level of p = 0.050.
Therefore, a further statistical analysis was performed in order to identify those pairs of variables whose values have statistically significant differences. For this purpose, Wilcoxon pairwise comparison tests were performed for dependent samples. The test indicated the statistical significance of the Wilcoxon test.
All groups had statistically significant differences (p < 0.05). This brought to the conclusion that the motivational factors which influence the purchase of chocolate products offered to the respondents through the analog media have the following order: 1. Brand, 2. Habitual buying, 3. Packaging appearance, and 4. Packaging Color (Figure 5).
Statistical analysis showed that Product Brand was the greatest motivational factor in the choice of chocolates on analog media. The arithmetic mean of this variable amounted to 2.151, while the median amounted to 2 (Figure 5). About half of the respondents believe that brand motivated them the most when buying a food product. The second motivational factor was Habitual buying, whose arithmetic mean amounted to 1.757, with a median of 2. The result showed that approximately one-third of the respondents were mostly motivated by habits when purchasing a food product. Packaging appearance as the motivational factor stood at the third place. The arithmetic mean of the mentioned variable amounted to 1.257 with a median of 1. Packaging appearance was ranked third among the offered motivational factors, with slightly less than half of the respondents choosing that factor. The worst ranked motivational factor was Color, with an arithmetic mean of 0.651 and a median of 0. Two-thirds of the respondents did not choose color as one of the three motivating factors that influenced most of their choice of a food product.
The second part of this chapter lists the factors (statistical variables) that influenced customer motivation in a situation where the chocolates were offered on digital media (tablet). In that case, respondents were offered six answers in the questionnaire (Technology, Interactivity, Color, Packaging appearance, Brand and Habitual buying) from which they had to choose three. It was done in such a way that the order was important. Scoring was done on the same principle as in the case of analog media by awarding 3, 2, or 1 point depending on ranking. A descriptive statistical analysis was performed on the obtained sample.
According to the results of the descriptive statistical analyzes, all variables had values ranging from 0 to 3. Variances and standard deviations had the expected, slightly higher, values.
The Kolmogorov–Smirnov test showed that all observed variables deviated from the normal distribution law. The observed variables were not normally distributed, which is why a non-parametric Friedmann ANOVA was performed to compare the samples. To be more precise, the hypothesis that all factors have an equal impact on food product buyers was tested, in comparison with the alternative hypothesis that not all the factors have an equal impact on customers.
Friedmann’s chi-square was 43.188 with 5 degrees of freedom and the statistical significance of the Friedmann test was p = 0.000 < 0.050. Results suggested that there were variable pairs whose medians had a statistically significant difference. There were pairs of factors that did not affect customers’ food choices equally.
Therefore, a further statistical analysis was performed in order to identify those pairs of variables that were statistically significantly different. For this purpose, Wilcoxon pairwise comparison tests were performed for dependent samples.
Wilcoxon tests indicated the existence of statistically significant median differences between the two groups of variables. Technology and Interactivity in one group of variables, while Color, Packaging appearance, Brand, and Habitual buying were in the other group. There were no statistically significant differences between the variables of Technology and Interactivity (p < 0.05). It should not be concluded that one of these two variables would have a stronger impact on chocolate customers’ motivation. Moreover, there were no statistically significant differences (considering the impact on customer motivation to purchase chocolate) between the variable pairs from the group that included the variables of Color, Packaging appearance, Brand and Habitual buying (p < 0.05).
Furthermore, it was determined that all variable pairs from different groups statistically significantly differ (p < 0.05). Therefore, it could be concluded that the variables of Color, Packaging appearance, Brand and Habitual buying, as a rule, have a stronger influence on the motivation of chocolate customers than Technology and Interactivity variables do (Figure 6).
“Product Brand” was a strong motivational factor in choosing chocolate when the product was offered on the digital media (Figure 6). The arithmetic mean of this variable amounted to 1.393, while the median value amounted to 2, which also presented a high value. The arithmetic mean of the variable “Habitual buying“ amounted to 1.318, with a median of 1. The “Packaging appearance” variable stood at third place among motivational factors, its arithmetic mean amounted to 1.242 with a median of 1. The arithmetic mean of the “Color“ variable amounted to 1 with a median value of 0. The motivational factor Technology stood at fifth place, with an arithmetic mean of 0.606. The Technology variable mode amounted to 0, with a frequency mode of 47. This means that over 70% of the respondents did not recognize this variable as a factor that motivated them to purchase a food product. Finally, the motivational factor of “Interactivity” has the weakest influence, with an arithmetic mean of 0.303. The mode of this variable amounted to 0, with a 52 frequency mode. Therefore, over 75% of the respondents did not recognize “Interactivity” as a factor that motivated them to purchase a food product.

3.2.2. Comparison of Motivational Factors on Different Media Using the Correlation Analysis

Firstly, a comparison of motivational factors was presented using percentage values relative to the total number of points for analog and digital media. Based on this, it could be seen how the existing four variables (Color, Packaging appearance, Brand, Habitual buying) changed the value by adding two new variables (Technology, Interactivity) to the evaluation of all the motivational factors on digital media (Figure 7).
Brand was the motivating factor influencing the purchase of a product the most on analog media with 142 points (37% of total points). Another factor was the variable Habitual buying with 116 points (30.2% of total points) (Figure 7). The results were in line with the choice of chocolates on analog media. The most points on that media were awarded to Milka and Kraš Dorina chocolates, which are generally popular chocolate brands among consumers. The color that usually attracts a potential buyer did not play a significant role in choosing chocolates (11.2% of total points).
The ranks of motivating factors that influence the purchase of chocolate on digital media were mostly identical to those on analog media. The top three ranked motivational factors had an almost identical result. The variable Brand had 92 points (23.6% of the total points), Habitual buying 87 points (22.3%), and Packaging appearance 82 points (21%) (Figure 7). Somewhat unexpectedly, the variables Technology (40 points) and Interactivity (20 points), being the main characteristics of digital media, did not represent significant motivating factors when choosing a chocolate on a tablet. These results also showed that the added value of a product that could affect its purchase was not achieved by presenting the product on digital media.
By switching from analog to digital media, the variables Brand and Habitual buying got a significantly smaller share at the expense of the newly added variables Technology and Interactivity. This suggested that augmented reality with new product perception capabilities still does not have a large impact on purchases of a product. The data from the graph showed that the same motivating factors affected the chocolate buyer, regardless of the type of medium through which the product was offered.
Friedmann’s ANOVA and Wilcoxon tests showed that the key motivating factors when buying food products through digital media were also those factors that influenced the purchase of analog media. Therefore, the motivation to purchase a chocolate is not significantly determined by the medium through which the food chocolate is being offered.
In order to further confirm the previous conclusion, a nonparametric correlation analysis of the variables of Color, Appearance, Brand and Habitual buying for both media was performed, with the help of Spearman’s rank correlation coefficients (Table 2). The results of the research clearly indicated that the motivational factors that influence the chocolate choice did not depend on the media.
A weak positive correlation can be found in the variable Color on both media with Spearman’s correlation coefficient of 0.302, which was statistically significant p = 0.013 < 0.050). Spearman’s correlation coefficient of 0.435, which was statistically significant (p = 0.000 < 0.050), was determined between the Brand variables on analog and digital media.
According to this indicator, there was a real significant correlation in Brand variables on both media. The mean positive correlation was determined on the variables Habitual buying on both media, with Spearman’s correlation coefficient of ρ = 0.561. The previous coefficient was statistically significant with an empirical p-value of p = 0.000 < 0.050. In that case, there was also a real, statistically significant positive correlation between the variables. There was no statistically significant difference between the variables of Packaging appearance on both media, as indicated by the empirical p-value of p = 0.109 > 0.050. Studies in which the same product (chocolate) was presented on two different media with variables used in this study have not been investigated in other papers. Therefore, the results of this research can help food manufacturers bring their products closer to customers by applying certain variables. That could encourage the customers to choose their product.

4. Conclusions

The results of the Friedmann test clearly showed that there were statistically significant differences between the scores of the variable pairs. According to the obtained results, “Packaging appearance”, “Product Price”, “Brand preference” and “Product advertising” had the strongest influence on customers. There were no statistically significant differences between the pairs of previously mentioned variables. The remaining three variables had a weaker impact on the customer’s decision to purchase a food product.
In the second part, there was research on the media’s influence on the purchase of a food product. It was determined that there were no statistically significant differences in the choice of eight different chocolates offered to the customers on analog and digital media, with a significance level of p = 0.05. Wilcoxon’s tests showed that customer choices did not differ in as many as six of the most popular chocolates, while in the two least selected chocolates, they did differ. From the presented results of the chi-square tests, it was clear that the choice of chocolates did not depend on the media (analog and digital) that the chocolates are being offered on.
The third part of the research determined that the same motivating factors affected the buyer of food products, regardless of the medium on which the product was offered. Non-parametric Friedmann tests were performed specifically for the analog and for the digital media, which determined statistically significant differences between the variables, viewed medially. Therefore, additional Wilcoxon tests were conducted. It was determined that in the case of the analog media, the intensity of motivational factors’ influence had the following order: 1. Brand, 2. Habitual buying, 3. Packaging appearance, and 4. Packaging Color. All aforementioned motivational factors contained statistically significant differences. On the digital media, these four factors did not statistically significantly differ, but they were in a group of variables with a greater impact than the variables “Technology” and “Interactivity”. From the obtained results, it can be concluded that the same group containing four motivational factors influenced the motivation of customers in the case of analog and digital media to the greatest extent.
It was determined that there were statistically significant, positive correlations of ranks between as many as three motivational factors on the analog and digital media. Therefore, the motivational factors that stimulate customers to buy food products do not differ significantly depending on the medium in which the products are offered. The results from this research can help designers see which factors they can use when designing packaging and branding products to highlight their product from others and also promote the sale of those products.
This research gives an answer to the question of how a customer reacts when a product is presented to him on an analog or digital medium. It also shows whether there are differences in the perception of chocolates as products as well as which factors affect the purchase of these products the most. In future research, the reverse order could be used in the presentation of a food product, first digital and then analog. Additionally, different food products could be used.

Author Contributions

Data curation, D.V.; Investigation, A.B.; Methodology, K.H.; Visualization, I.B. All authors have read and agreed to the published version of the manuscript.

Funding

This research received no external funding.

Institutional Review Board Statement

Not applicable.

Informed Consent Statement

Not applicable.

Conflicts of Interest

The authors declare no conflict of interest.

Appendix A

Appendix A contains the full questionnaire for this experiment which was tested on respondents (18–27 years old) who enrolled in the first year of the undergraduate study of Multimedia, Design and Application at University North, Varaždin, Croatia.
Survey: The impact of packaging and ICT on the selection and purchase of food products
Gender:MF
Age:18–2021–2324–2627+
Favorite color: ________________
Read the text of the questionnaire carefully. Choose from 1 to 5 the impact of individual factors on the selection and purchase of food:
PART ONE OF THE SURVEY
(1 = Strongly disagree… 5 = Strongly agree)
1. Packaging appearance affects the choice and purchase of a food product.
12345
2. Quality packaging is a guarantee of a quality food product.
12345
3. Croatian origin of the product influences the selection and purchase of a food product.
12345
4. The price of the product affects the selection and purchase of the food product.
12345
5. Brand preference influences the choice and purchase of a food product.
12345
6. Advertising a food product affects its selection and purchase.
12345
7. Product Position/Placement on shelves influences the selection and purchase of a food product.
12345
8. Which information on the food packaging do you pay the most attention to?
  (select and rank 3 answers from those offered) Applsci 12 00218 i001
  (a) List of ingredients and application method
  (b) Date of manufacture and expiry date
  (c) Name of the food product
  (d) Food manufacturer
  (e) Country of origin
9. According to you, what is the deciding factor for choosing and buying a food product? (select and rank 3 answers from those offered)
  (a) Packaging appearance Applsci 12 00218 i002
  (b) Product quality
  (c) Origin of products
  (d) Product price
  (e) Product brand
PART TWO OF THE SURVEY
SEE THE PICTURE ATTACHED: 8 TYPES OF CHOCOLATE
10. Which 3 types of chocolates would you buy?
  (select and rank only 3 products from the attached image)
  (a) Fin Carre Applsci 12 00218 i003
  (b) Lindt
  (c) Zvečevo Mikado
  (d) Dairy Milk
  (e) Milka
  (f) Bellarom
  (g) Alpinella
  (h) Kraš Dorina
11. Which factor influence your previous choice of chocolates from the template the most? (select and rank 3 answers from those offered)
  (a) Color Applsci 12 00218 i004
  (b) Packaging appearance
  (c) Product brand
  (d) Habitual buying
12. What did you first notice on the product packaging? (select and rank 3 answers from those offered)
  (a) Submissive/background—dominant color Applsci 12 00218 i005
  (b) Graphics (picture, illustration)
  (c) Product brand name
  (d) Manufacturer’s logo
SEE THE CONTENT GENERATED ON THE TABLET: 8 TYPES OF CHOCOLATE
13. Which 3 chocolates would you buy based on tablet display?
  (select and rank only 3 products according to tablet display)
  (a) Fin Carre Applsci 12 00218 i006
  (b) Lindt
  (c) Zvečevo Mikado
  (d) Dairy Milk
  (e) Milka
  (f) Bellarom
  (g) Alpinella
  (h) Kraš Dorina
14. Which factor influenced the most your choice of product, based on the tablet display? (select and rank 3 answers from those offered)
  (a) Display technology Applsci 12 00218 i007
  (b) Interactivity
  (c) Color
  (d) Packaging appearance
  (e) Product brand
  (f) Habitual buying
PART THREE OF THE SURVEY
SEE THE PICTURE ATTACHED: PASTA
15. Which underlying color is the most acceptable for pasta packaging? (select and rank only 3 products from the attached image)
  (a) green Applsci 12 00218 i008
  (b) yellow
  (c) red
  (d) gray
  (e) blue
  (f) pink
  (g) orange
  (h) purple
SEE THE PICTURE ATTACHED: CHOCOLATE
16. Which is the most acceptable underlying color for chocolate packaging?
  (select and rank only 3 products from the attached image)
  (a) green Applsci 12 00218 i009
  (b) yellow
  (c) red
  (d) gray
  (e) blue
  (f) pink
  (g) orange
  (h) purple

References

  1. Ampuero, O.; Vila, N. Consumer perceptions of product packaging. J. Consum. Mark. 2006, 23, 100–112. [Google Scholar] [CrossRef]
  2. Smith, P.R.; Taylor, J. Marketing Communications: An Integrated Approach; Kogan Page Publishers: London, UK, 2004. [Google Scholar]
  3. Vila, N.; Ampuero, O. The role of packaging in positioning an orange juice. J. Food Prod. Mark. 2007, 13, 21–48. [Google Scholar] [CrossRef]
  4. Rettie, R.; Brewer, C. The verbal and visual components of package design. J. Prod. Brand Manag. 2000, 9, 56–70. [Google Scholar] [CrossRef] [Green Version]
  5. Silayoi, P.; Speece, M. Packaging and purchase decisions: An exploratory study on the impact of involvement level and time pressure. Br. Food J. 2004, 106, 607–628. [Google Scholar] [CrossRef]
  6. Agariya, A.K.; Johari, A.; Sharma, H.K.; Chandraul, U.; Singh, D. The role of packaging in brand communication. Int. J. Sci. Eng. Res. 2012, 3, 1–13. [Google Scholar]
  7. Underwood, R.L.; Klein, N.M. Packaging as brand communication: Effects of product pictures on consumer responses to the package and brand. J. Mark. Theory Pract. 2002, 10, 58–68. [Google Scholar] [CrossRef]
  8. Rundh, B. The role of packaging within marketing and value creation. Br. Food J. 2016, 118, 2491–2511. [Google Scholar] [CrossRef]
  9. Underwood, R.L. The communicative power of product packaging: Creating brand identity via lived and mediated experience. J. Mark. Theory Pract. 2003, 11, 62–76. [Google Scholar] [CrossRef]
  10. Wu, A. Food packaging design and its application in the brand marketing. Carpathian J. Food Sci. Technol. 2015, 7, 5–15. [Google Scholar]
  11. Waheed, S.; Khan, M.M.; Ahmad, N. Elements of Packaging and Consumer Purchase Intention–A Case of Chocolate Buying Behavior. Market Forces 2018, 13, 97–114. [Google Scholar]
  12. Baghestani Rad, A.; Ghouchani, F.; Mohtashami, A. A Study of the Effects of Packaging on the Increase of Sale of Foods Industry in Chocolate. Int. J. Adv. Stud. Humanit. Soc. Sci. 2016, 5, 300–308. [Google Scholar]
  13. Demo, G.; Coura, K.; Scussel, F.; Azevedo, G. How Do Brazilian Consumers Relate to Chocolate Brands? Validity and Reliability Evidence of the Chocolate Brands Relationship Scale. Sustainability 2021, 13, 5635. [Google Scholar] [CrossRef]
  14. Keller, K.L. Choosing brand elements to build brand equity. In Strategic Brand Management, 3rd ed.; Dorling Kindersley: Delhi, India, 2009; pp. 187–196. [Google Scholar]
  15. Kauppinen-Räisänen, H. Strategic use of colour in brand packaging. Packag. Technol. Sci. 2014, 27, 663–676. [Google Scholar] [CrossRef]
  16. Valdec, D.; Hajdek, K.; Majnarić, I.; Čerepinko, D. Influence of Printing Substrate on Quality of Line and Text Reproduction in Flexography. Appl. Sci. 2021, 11, 7827. [Google Scholar] [CrossRef]
  17. Kovač, A.; Kovačević, D.; Bota, J.; Brozović, M. Consumers’ preferences for visual elements on chocolate packaging. J. Graph. Eng. Des. 2019, 10, 13–18. [Google Scholar] [CrossRef]
  18. Maleki, S.; Amiri Aghdaie, S.F.; Shahin, A.; Ansari, A. Investigating the relationship among the Kansei-based design of chocolate packaging, consumer perception, and willingness to buy. J. Mark. Commun. 2020, 26, 836–855. [Google Scholar] [CrossRef]
  19. Gunaratne, N.M.; Fuentes, S.; Gunaratne, T.M.; Torrico, D.D.; Francis, C.; Ashman, H.; Viejo, C.G.; Dunshea, F.R. Effects of packaging design on sensory liking and willingness to purchase: A study using novel chocolate packaging. Heliyon 2019, 5, e01696. [Google Scholar] [CrossRef] [Green Version]
  20. Taghavi, M.-S.; Seyedsalehi, A. The effect of packaging and brand on children’s and parents’ purchasing decisions and the moderating role of pester power. Br. Food J. 2015, 117, 2017–2038. [Google Scholar] [CrossRef]
  21. Underwood, R.L.; Klein, N.M.; Burke, R.R. Packaging communication: Attentional effects of product imagery. J. Prod. Brand Manag. 2001, 7, 403–422. [Google Scholar] [CrossRef]
  22. Rebollar, R.; Gil, I.; Lidón, I.; Martín, J.; Fernández, M.J.; Rivera, S. How material, visual and verbal cues on packaging influence consumer expectations and willingness to buy: The case of crisps (potato chips) in Spain. Food Res. Int. 2017, 99, 239–246. [Google Scholar] [CrossRef]
  23. Marques da Rosa, V.; Spence, C.; Miletto Tonetto, L. Influences of visual attributes of food packaging on consumer preference and associations with taste and healthiness. Int. J. Consum. Stud. 2019, 43, 210–217. [Google Scholar] [CrossRef]
  24. Silayoi, P.; Speece, M. The importance of packaging attributes: A conjoint analysis approach. Eur. J. Mark. 2007, 41, 1495–1517. [Google Scholar] [CrossRef] [Green Version]
  25. Ahmad, N.; Billoo, M.; Lakhan, A.A. Effect of product packaging in consumer buying decision. J. Bus. Strategy 2012, 6, 1–10. [Google Scholar]
  26. Kuo, L.; Chang, T.; Lai, C. Visual color research of packaging design using sensory factors. Color Res. Appl. 2021, 46, 1106–1118. [Google Scholar] [CrossRef]
  27. Li, Y. Analysis of Visual Communication Packaging Design Based on Interactive Experience; IOP Publishing: Lijiang, China, 2021; Volume 1852, pp. 1–7. [Google Scholar]
  28. Wang, E.S. The influence of visual packaging design on perceived food product quality, value, and Brand preference. Int. J. Retail Distrib. Manag. 2013, 41, 805–816. [Google Scholar] [CrossRef]
  29. Nilsson, J.; Öström, T. Packaging as a Brand Communication Vehicle. Master’s Thesis, Luleå University of Technology, Luleå, Sweden, 2005. [Google Scholar]
  30. Beneke, J.; Floyd, V.; Rono, C.; Sherwood, K. Chocolate, colour and consideration: An exploratory study of consumer response to packaging variation in the South African confectionery sector. Int. J. Mark. Stud. 2015, 7, 55–65. [Google Scholar] [CrossRef] [Green Version]
  31. Baptista, I.; Valentin, D.; Saldaña, E.; Behrens, J. Effects of packaging color on expected flavor, texture, and liking of chocolate in Brazil and France. Int. J. Gastron. Food Sci. 2021, 24, 100340. [Google Scholar] [CrossRef]
  32. Kotler, P.; Keller, K.L. Upravljanje Marketingom, 12. Izdanje (Marketing Management), 12th ed.; Mate d.o.o.: Zagreb, Croatia, 2008; ISBN 953-246-031-4. [Google Scholar]
  33. Ware, C. Information Visualization: Perception for Design; Morgan Kaufmann: Cambridge, MA, USA, 2019. [Google Scholar]
  34. Hajdek, K.; Budimir, I.; Matijević, M.; Mikota, M. A shift in the perception of lightness on image in digital media due to the manifestation of the simultaneous contrast effect. Imaging Sci. J. 2019, 67, 115–122. [Google Scholar] [CrossRef]
  35. Hajdek, K.; Budimir, I.; Matijević, M. A shift of the perceptual attributes of color due to the manifestation of the simultaneous contrast effect on a display. Color Res. Appl. 2020, 45, 671–685. [Google Scholar] [CrossRef]
  36. Shekhar, S.; Raveendran, P. Chocolate packaging cues and first moment of truth: An exploratory study on young consumers’ mind. Manag. Sci. Lett. 2013, 3, 1851–1862. [Google Scholar] [CrossRef]
Figure 1. Template for product evaluation (chocolate): (a) Fin Carre, (b) Lindt, (c) Zvečevo Mikado, (d) Dairy Milk, (e) Milka, (f) Bellar, (g) Alpinella, (h) Kraš Dorina.
Applsci 12 00218 g001
Figure 2. Marker (left) and the layout of an interactive digital visual display in AR application (right).
Applsci 12 00218 g002
Figure 3. Box & Whisker impact chart of selected variables on selection and purchase of food products.
Applsci 12 00218 g003
Figure 4. Graphic representation of product selection distribution frequencies on analog media in relation to digital media.
Applsci 12 00218 g004
Figure 5. Box & Whisker chart of the motivational factors which most effect the purchase of chocolates on analog media.
Applsci 12 00218 g005
Figure 6. Box & Whisker chart of the motivational factors which most effect the purchase of chocolates on digital media.
Applsci 12 00218 g006
Figure 7. Comparison of motivational factors for product selection between analog and digital media in percentage values.
Applsci 12 00218 g007
Table 1. Wilcoxon test of variable pairs’ comparison on analog and digital media.
Variable Pairs
(Analog & Digital Media)
Wilcoxon-Matched Pairs Test-Marked
Tests Are Significant at p < 0.050
Valid NTZp-Value
a: Fin Carre1775.0000.0710.943
b: Lindt1641.5001.3700.170
c: Zvečevo Mikado1233.5000.4310.666
d: Dairy Milk1520.0002.2710.023
e: Milka2055.5001.8470.064
f: Bellarom75.5001.4360.151
g: Alpinella94.0002.1910.028
h: Kraš Dorina25135.5000.7260.467
Legend: N-value, test T-statistics, empirical z-ratio, corresponding empirical p-value.
Table 2. Spearman’s correlation coefficient on analog and digital media.
Variables
(Analog/Digital Media)
Spearman Rank Order Correlations-MD Pairwise
Deleted Marked Correlations Are Significant at p < 0.050
Color ρ = 0.302 / p = 0.013
Packaging appearance ρ = 0.199 / p = 0.109
Brand ρ = 0.435 / p = 0.000
Habitual buying ρ = 0.561 / p = 0.000
Legend: Spearman’s correlation coefficients of the ρ-rank and the empirical Spearman’s coefficient p-value.
Publisher’s Note: MDPI stays neutral with regard to jurisdictional claims in published maps and institutional affiliations.

