Article

Post-Test Numerical Analysis of a Helium-Cooled Breeding Blanket First Wall under LOFA Conditions with the MELCOR Fusion Code

1
Dipartimento di Ingegneria Civile e Industriale, University of Pisa, Largo Lucio Lazzarino, 56122 Pisa, Italy
2
Karlsruhe Institute of Technology, Hermann-von-Helmholtz-Platz 1, 76344 Eggenstein-Leopoldshafen, Germany
*
Author to whom correspondence should be addressed.
Appl. Sci. 2022, 12(1), 187; https://doi.org/10.3390/app12010187
Submission received: 9 November 2021 / Revised: 12 December 2021 / Accepted: 20 December 2021 / Published: 24 December 2021
(This article belongs to the Special Issue Breeding Blanket: Design, Technology and Performance)

Abstract

:
The validation of numerical tools employed in the analysis of incidental transients in a fusion reactor is a topic of main concern. KIT is taking part in this task providing both experimental data and by performing numerical analysis in support of the main codes used for the safety analyses of the Helium Cooled Pebble Bed (HCPB) blanket concept. In recent years, an experimental campaign has been performed in the KIT-HELOKA facility to investigate the behavior of a First Wall Mock-Up (FWMU) under Loss Of Flow Accident (LOFA) conditions. The aim of the experimental campaign was twofold: to check the expected DEMO thermal-hydraulics conditions during normal and off-normal conditions and to provide robust data for code validation. The present work is part of these validation efforts, and it deals with the analysis of the LOFA experimental campaign with the system code MELCOR 1.8.6 for fusion. A best-estimate methodology has been used in support of this analysis to ease the distinction between user’s assumptions and code limitations. The numerical analyses are here described together with their goals, achievements, and lesson learnt.

1. Introduction

Two breeding blanket (BB) concepts are under development for the EU DEMO (Demonstration Power Plant): the Helium Cooled Pebble Bed (HCPB) BB concept and the Water Cooled Lithium Lead (WCLL) BB concept [1]. The HCPB blanket concept is characterized by EUROFER as structural material, the advanced ceramic breeder material based on a mixture of Li4SiO4 and Li2TiO3, and Be12Ti as neutron multiplier material [2].
In recent years, the Karlsruhe Institute of Technology (KIT) has performed several experimental campaigns to qualify the HCPB design and to provide experimental data for code validation studies [1,3]. One of these campaigns involved is a First Wall Mock-Up (FWMU) under different Loss Of Flow Accident (LOFA) conditions [4].
The mock-up consists of a P92 steel plate crossed by 10 U-shaped channels (Figure 1) [5]. The channels are divided into two groups fed by independent headers. The mock-up is heated in the central zone through to a beam gun, and the LOFA event is reproduced closing a valve on the outlet header of five channels (in the remaining five channels, the mass flow rate remains in nominal conditions). Several LOFA scenarios are investigated depending on the percentage of valve opening: valve 60% open, 40% open, 20% open, 10% open, 5% open, and 0% open (full LOFA).
The present paper is part of these validation studies performed at KIT. Some representative tests of the FWMU-LOFA experimental campaign have been reproduced with the MELCOR 1.8.6 for fusion. The code is adopted for the accident analyses for DEMO in-vessel components in EUROfusion [6]. The aim is to assess the capabilities of three aspects of the code:
  • The hydrodynamic model implemented in MELCOR;
  • The capability to reproduce heat transfer phenomena among adjacent heat structures;
  • The fluid-wall heat transfer.
The approach to perform this study is the same adopted for the RELAP5-3D code [4]: mean tests are depicted from the experimental tests carried out, and a best-estimate methodology is used to ease the distinction between user’s effects and code limitations. The adopted best-estimate methodology is the “Best-Estimate Model Calibration and Prediction through Experimental Data Assimilation” methodology [7]. This rigorous methodology is based on the information theory and the Bayes’ theorem, and it requires an accurate model-oriented choice of parameters and responses to provide best-estimated evaluations of the selected parameters and responses. The theoretical details of this methodology can be found in [7], while the Best-estimate for SYstem Codes software (BeSYC) used to apply it is described in [8] (References [4,8] are published in the same Applied Sciences issue. The reader is advised to look at the two papers for further information concerning the LOFA experimental campaign and the software used to apply the best-estimate methodology).

2. Materials and Methods
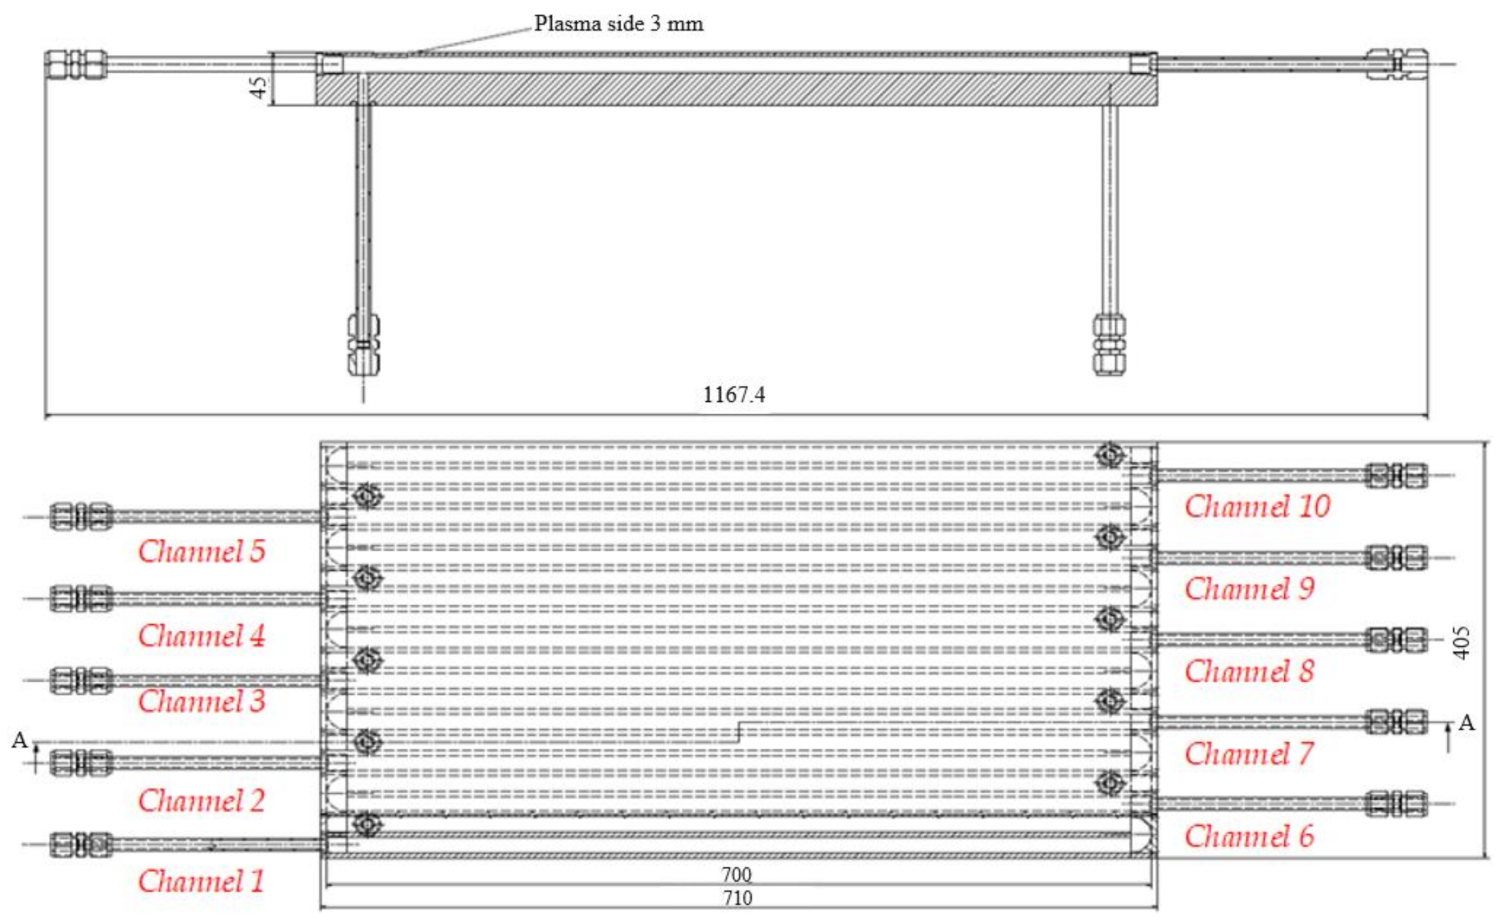
2.1. The Mock-Up

The FWMU is a 710 × 405 × 45 mm plate made of P92 steel crossed by 10 U-shaped cooling channels (Figure 1) [5]. Each channel has a 15 × 15 mm square section with rounded edges (4 mm radius). Two circular nozzles (8 mm diameter and 2 mm thickness) fed each channel: one in horizontal direction and one in the vertical one. A counter-current flow is established through neighbor channels, i.e., if one channel is fed through the horizontal channel, the adjacent one is fed through the vertical nozzle. Steel walls (5 mm thickness) separate the straight parts of the u-tubes and each channel from the neighboring ones. The upper and lower plates are 3 and 27 mm thick, respectively.

2.2. HELOKA-HP Facility

HELOKA-HP is an experimental facility for testing helium-cooled components at high temperature and high pressure. The facility consists of an 8-shaped loop, with a test section on the hot leg side [9]. The test section is enclosed in a cylindrical vessel reproducing DEMO operational vacuum conditions.
A complex piping arrangement (Figure 2) connects the single hot leg of the facility with the 10 channels of the FWMU. Two separated inlet headers are used to split the coolant flow through the two channel groups. In the same way, two different outlet headers collect the helium coming from the FWMU.
Several sensors are installed along the pipes. Inlet coolant temperatures are measured for Channels 3 and 8, whereas outlet coolant temperatures and pressures are measured on Channels 2, 3, 4, 8, and 9 (the temperature sensor on Channel 7 was defective, so it is not considered). Differential pressure sensors are also installed on these channels, providing a measure of the pressure drop occurring across them. Additionally, two flow meters measure the mass flow rate on the two outlet headers. No pressure nor temperature measurements are performed on Channels 1, 5, 6 and 10. A complete description of the facility can be found in [9].

2.3. Pressure Drop Characterization Tests

The FWMU was originally manufactured to test different manufacturing techniques, and then it was repurposed for the LOFA experimental campaign [4]. To evaluate the manufacturing quality, and to get an understanding of the flow behavior through each channel, the FWMU was subjected to several pressure drop characterization tests [10]. The tests were carried out injecting air at different mass flow rates into each one of the ten channels of the FWMU. The air at the inlet was kept at constant temperature (20 °C) and at nearly constant pressure (~6 bar), whilst the mass flow rate was decreased, step by step. Different mass flow rate profiles were employed for each channel and for each entrance direction (horizontal or vertical). The boundary conditions adopted are aimed at reproducing the Reynolds number foreseen in the LOFA experimental campaign.
These tests resulted in a large amount of experimental data that showed an overall good flow behavior, except for Channels 1 and 2. These two channels resulted affected by high pressure losses due to an imperfect construction. This behavior made them unsuitable for the LOFA tests and pushed for a peculiar experimental setup (see next section).

2.4. LOFA Tests

The LOFA experimental campaign was performed with the purpose of evaluating the response of the FW under accidental conditions [4]. The tests were carried out keeping a constant heat flux on top of the FWMU central zone (Channels 3, 4, 7 and 8), while reducing the helium flow through Channels 1–5. The heated channels were selected starting from the outcomes of the pressure drop characterization tests [10]. The reduction was obtained installing a valve on the outlet header of the circuit and modifying its opening degree. Six scenarios were investigated with valve opening of 60%, 40%, 20%, 10%, 5%, and 0% respectively. A valve fully closed at 0% is also called full LOFA. Simultaneously, efforts were made to keep the flow in the circuit feeding Channels 6–10 as stable as possible being the two inlet headers fed by the same circuit.
The experimental campaign investigated two different heat loads: 300 and 330 kW/m2. The heat was provided through an electron beam gun installed outside the cylindrical vacuum tank. The duration of the tests was limited to avoid the increase of the surface temperature above the design limit of 550 °C.
Several repetitions were performed throughout the days to gather a sufficient number of repetitions. The aim was to use these repetitions to investigate only “average” tests in the post-test analysis phase. Further details on the experimental campaign can be found in [4].

2.5. Basic of the Best-Estimate Methodology

In support of the validation work, the “Best-Estimate Model Calibration and Prediction through Experimental Data Assimilation” methodology was applied [7]. This methodology is based on the evaluation of best-estimated “parameters” and “responses” starting from experimental and computational data. The correlations between computed parameters and responses (namely sensitivities) are investigated applying a brute force method with a variation of a single parameter in the order of ±3–5% with respect to the “default” value [11].
The outcome of the methodologies are the best-estimated evaluations of the parameters, the responses, and their uncertainties. The best-estimated uncertainties are contained in variance–covariance matrices also exploiting the influence of each parameter (or response) on the others. These results can be used to write best-estimate code input decks and to perform statistical analyses. The methodology is applied by means of the BeSYC software, which is described in [8].

2.6. MELCOR Models

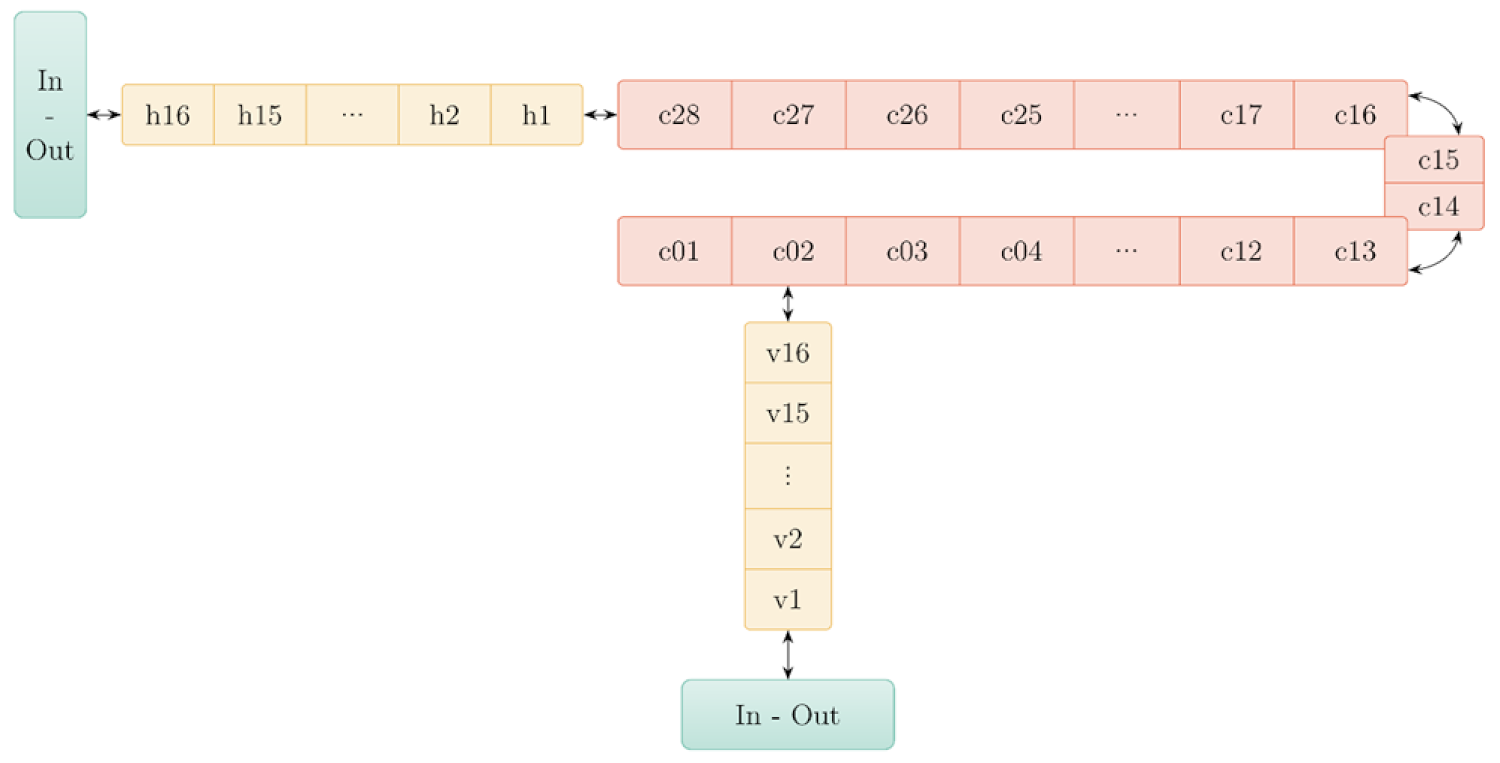
2.6.1. Single-Channel Model

The MELCOR 1.8.6 single-channel model was developed with the aim to reproduce the thermal-hydraulic behavior of a single FWMU channel during the Pressure Drop Characterization Tests. Starting from a geometry-based model, a “doubling” procedure was applied with the purpose to find a discretization having a sufficient low influence on the computed results. The number of control volumes (CVs) was increased progressively until the difference among the pressure drops in two subsequent discretizations was below 1/1000 of the pressure at the outlet. The additional L/D ≥ 1 requirement was applied to avoid too-small Courant time-steps.
The obtained model consisted in 16 volumes for each nozzle and 28 volumes for the square tube (Figure 3). An additional time-independent volume was employed to impose fluid conditions at the inlet, whilst a time-dependent junction was applied at the outlet to set the mass flow rate. Since, in MELCOR, it is possible to specify the time-dependent flow path only in terms of velocities, an appropriate control function (CF) was created to calculate the velocities considering the fluid properties and the mass flow rates at the outlet.
Heat structures (HSs) were added to represent the horizontal and vertical nozzle tubes and the FWMU steel structure. In particular, a total of 97 HSs were employed to simulate the top and bottom plates, the lateral wall and the inner wall separating the straight parts of the square tube. For all the structures, a constant temperature (20 °C) was imposed on the external surface facing the “environment”, whereas a convective boundary condition (with the heat transfer coefficient calculated by MELCOR itself) was applied to the inner surface. Since the P-92 steel is not included in the MELCOR 1.8.6 database for materials, its properties (specific heat, conductivity, and density) were defined as a function of temperature through three different tabular functions (TFs). All the values in the tables are the ones proposed in [4].

2.6.2. Complete Model

The single-channel mode was used as basis to develop the model to simulate the selected LOFA scenarios. The entire FWMU installation and most of the pipes present in the test section of the HELOKA-HP facility were reproduced paying particular attention to the real geometry and dimensions of the system, still trying to minimize the nodalization influence on the results.
The MELCOR model for the entire FWMU installation was the result of the merging of ten single-channel calibrated models. Compared to these single-channel models, only a slight modification in the number of CVs modeling horizontal and vertical nozzles was introduced to have a more accurate representation of their real length. The CVs were initially set in non-equilibrium state, and they were filled with pure Helium as a working fluid. Heat structures were employed to model the steel nozzles as well as the FWMU plate. In particular, HSs for the upper and lower part of the plate (henceforth, Top and Bottom plates, respectively) were arranged in order to have a direct correspondence between upper and lower structures. In addition, more HSs were created to reproduce the walls between the tubes. An adiabatic condition was imposed on the outer side of all the structures, except the ones under direct heat load, whereas convective heat transfer coefficients were evaluated by the code itself on the inner side, employing the Dittus–Boelter correlation. The heat load was considered constant for the duration of each test and homogeneous on the whole heated area.
To compensate for the lack of a conduction model in MELCOR and considering the importance of the heat exchange among neighboring HSs during a LOFA event [4], a conduction model was introduced through control functions to reproduce the temperature distribution of the top plate of FWMU, especially when under heat load. The model was based on the principle that each rectangular heat structure constituting the top plate exchanges heat with four neighbor HSs, one for each side. The exchanged heat was imposed as an internal power source for each structure through a control function, the value of which was defined as the sum of the contribution from the surrounding HSs, as shown in Figure 4.
The piping system was reproduced by means of control volumes and flow paths. Given the presence of temperature, pressure, and flow sensors, it was possible to reduce the portion of the facility to be modeled from the position of the inlet temperature sensors up to the flowmeter at the outlet (Figure 2). These pipes are:
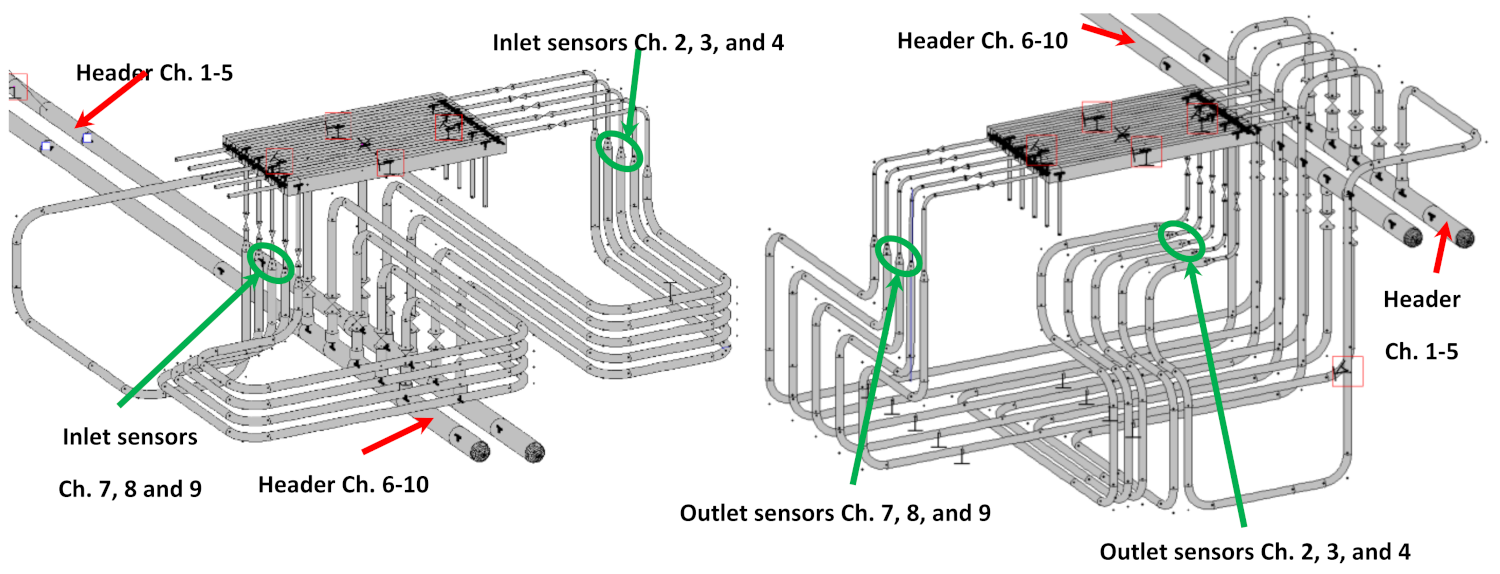
  • The inlet pipes spanning from the inlet temperature/pressure sensors up to the Swagelok connecting them with the FWMU nozzles;
  • The outlet pipes from the FWMU nozzles up to the two outlet headers (one for Channels 1–5, and the other for Channels 6–10;
  • The outlet headers up to the position of the flow meters.
The piping arrangement adopted in the facility makes the outlet headers the sole flow connections between the channels of each branch (the two branches are independent). For all inlet/outlet pipes and for both headers, a “doubling” procedure similar to the one presented for the single-channel model was applied, still considering a maximum influence on the results equivalent to 1/1000 of the lowest pressure in the system.
Inlet conditions of each tube were set through 10 time-dependent volumes, whilst two time-dependent flow paths were modeled in order to impose the mass flow rate for the two circuits cooling the FWMU. Attention was also paid to the correct reproduction of the pressure losses across the pipes: proper form losses coefficients were employed in the bends or in the segments with flow area variations.

3. Results

3.1. Pressure Drop Characterization Tests

The single-channel model was used to reproduce the Pressure Drop Characterization Tests, and the BE methodology was applied to calibrate it. Since the purpose of the characterization tests was the evaluation of the pressure drops across each one of the 10 channels constituting the FWMU, the selected response for the methodology was the pressure difference (Δp) between inlet and outlet. Instead, four parameters were selected for each channel:
  • The loss coefficient in the junction connecting the vertical nozzle to the FWMU channel ( K v );
  • The loss coefficient in the 180° bend ( K b );
  • The loss coefficient in the junction connecting the FWMU channel to the horizontal nozzle ( K h );
  • The surface roughness ( ε ).
The choice to consider each channel independent from the others is pushed from the different behavior shown by each channel in the pressure drop characterization tests. However, albeit independent, the initial parameter values were adopted identical for all the channels, with an exception for Channel 1, for which the default results were too distant from the experimental ones (this discrepancy is linked with the faulty welding described in Section 2.3).
As an outcome of the best-estimate methodology, mean calibrated parameters were obtained (Table 1). As it can be depicted from Table 1, the calibrated surface roughness is identical for each channel, and it is also identical to the initial assumed value. This behavior highlights their small influence on these tests. Instead, the spreading of the K v , K b , and K h values indicate their preeminent influence in shaping the pressure losses through the channels. The different values shown for each channel are a direct reflection of the different pressure losses experimentally shown through the tests.
The results coming from an input deck adopting these values are compared against the experimental data and the initial estimation in Figure 5 (only Channels 3, 4, 7, and 8 in the flow directions relevant for the LOFA transients). As it can be seen, the Best-Estimate runs reproduce the behavior observed in the experimental tests well enough, even though deviations at high air mass flow rates (>32/34 g/s) are shown. Most likely, the reason is to be found in the set of adopted parameter values for each channel. In principle, a high number of sets can be able to match the pressure drops at each given mass flow rate, but finding a set capable to reproduce all of them together is a more complex task. Therefore, the differences at high mass flow rate suggest only that the chosen set—through the best-estimate methodology—is good enough to reproduce the total pressure drop when its behavior is quasi-linear, but that is not sufficient when the pressure drops stray from linearity.

3.2. Pre-Calibrations

As a matter of fact, the calibration of the FWMU is not sufficient for the correct reproduction of the LOFA transients because the complete model consists of more pipes than only the FWMU ones. To overcome this burden, two sets of pre-calibration were performed to calibrate the pressure drops, the surface roughness, and the parameters involved in the heat transfer:
  • the first one considering the thermal–hydraulic conditions characterizing the steady-state at both 300 and 330 kW/m2, without applying any heat load;
  • the second one considering the thermal–hydraulic conditions characterizing the steady-state at both 300 and 330 kW/m2, with the application of the heat load hitting the portion of the top plate.
The first set of calibration addressed the parameters related to the pressure drops (pressure drop coefficients and surface roughness), whereas the second one was mainly devoted to obtaining the best-estimated values for the parameters relevant for the heat exchange between coolant and heat structures, and between the heat structures themselves. Since different aspects are involved in the thermal behavior of the system, the following parameters were selected for the second set of calibrations:
  • Material properties: conductivity, specific heat, and density of the P92 steel;
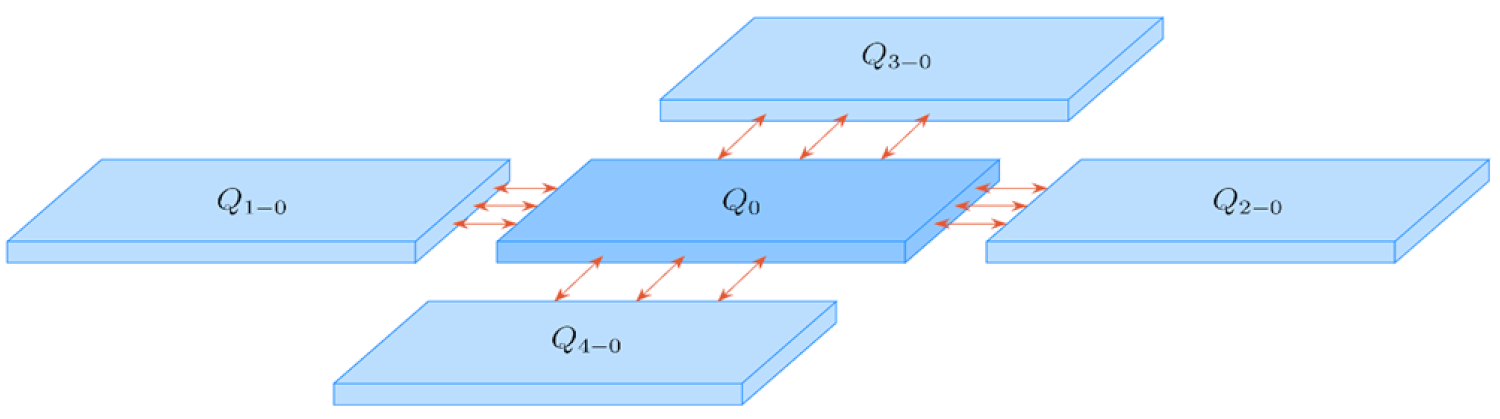
  • Conduction-related parameters: thickness of the heat structures under heat load, exchange areas among HSs, and characteristic length of all the HSs composing the top plate;
  • Convection-related parameters: sensitivity coefficients linked to the Dittus–Boelter formulation embedded.
As responses, the outlet pressures of Channels 2–4 and 7–9 were selected for the calibrations without heat load (the pressure in the other channels was not taken into consideration since no experimental data are available), while the outlet temperatures of Channels 2–4 and 8–9 were adopted for the calibrations with heat load.
A marked improvement was found in the pressure values obtained by MELCOR 1.8.6 after the calibrations with the best-estimate pressures within the uncertainties range of the experimental results for almost all the considered channels. As for the temperature, the results are acceptable considering the nature of the MELCOR code. However, temperatures calculated by MELCOR are lower than the experimental data for all the channels under evaluation (max ΔT = 2–5 K), showing that the code is not able to reproduce the heating coming from the friction. Table 2 shows the comparison between the experimental data and the results achieved from best-estimate code run at the steady-states at 330 kW/m2 (with and without heat load). In total, 103 parameters (more than 1500 terms modified in the input decks) have been calibrated in these pre-calibrations.

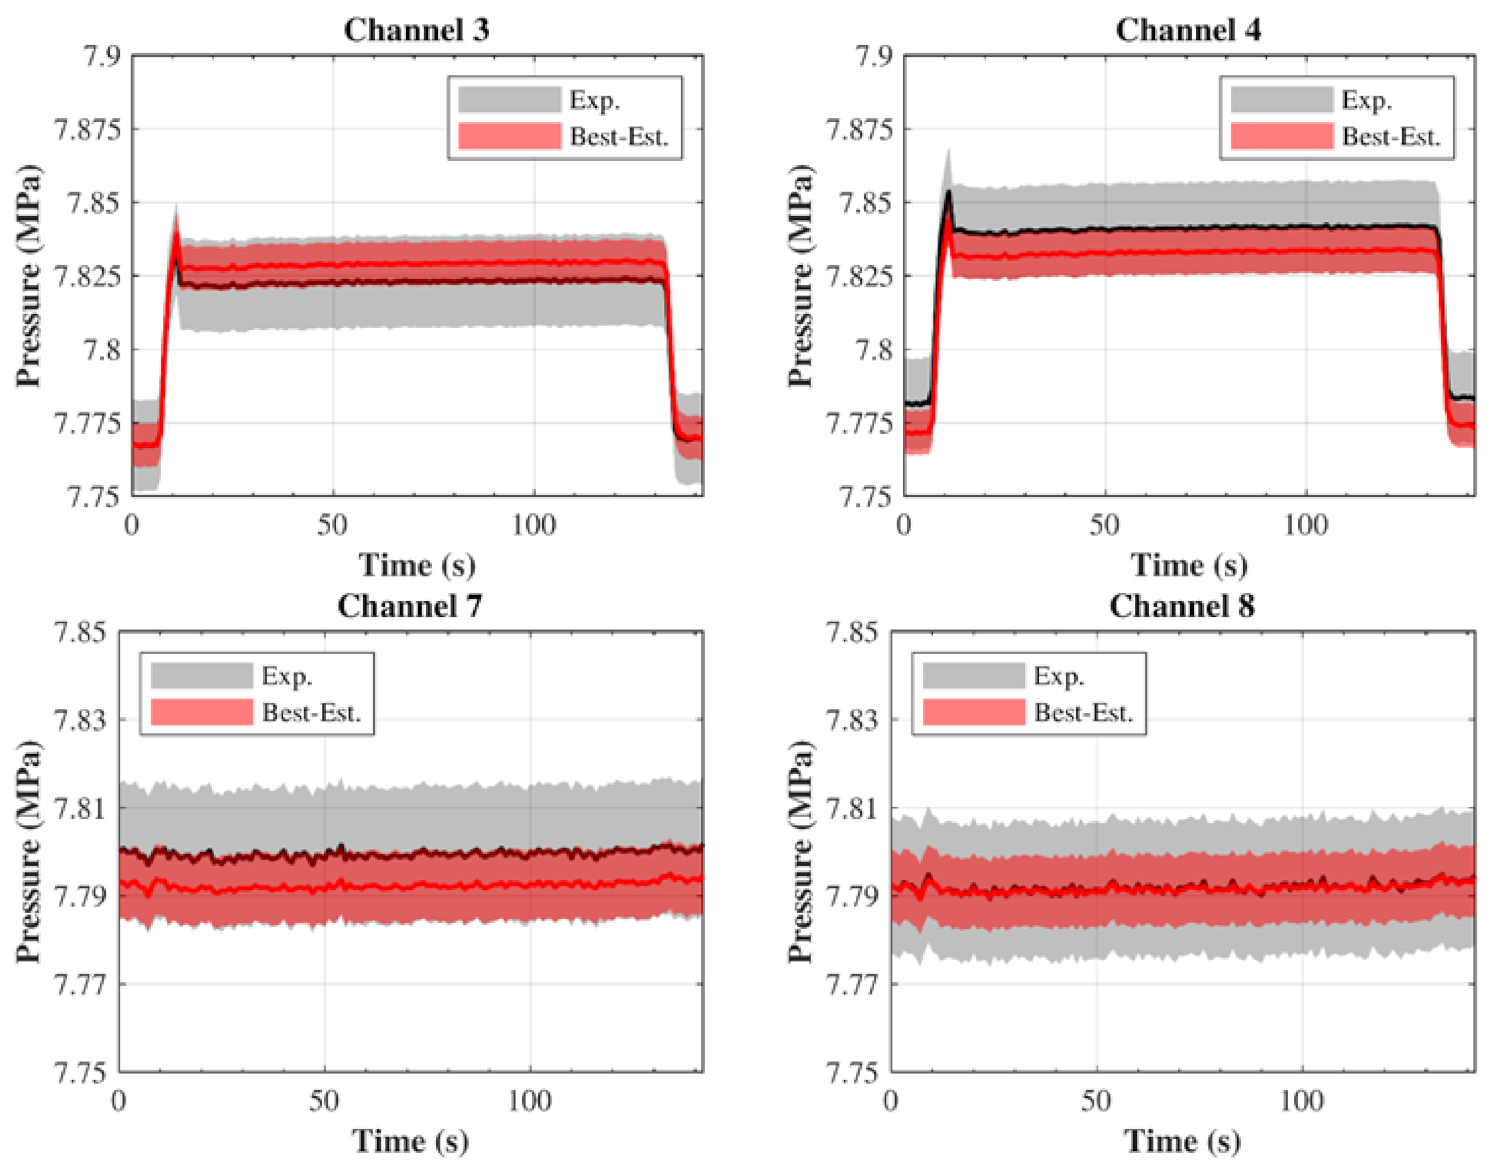
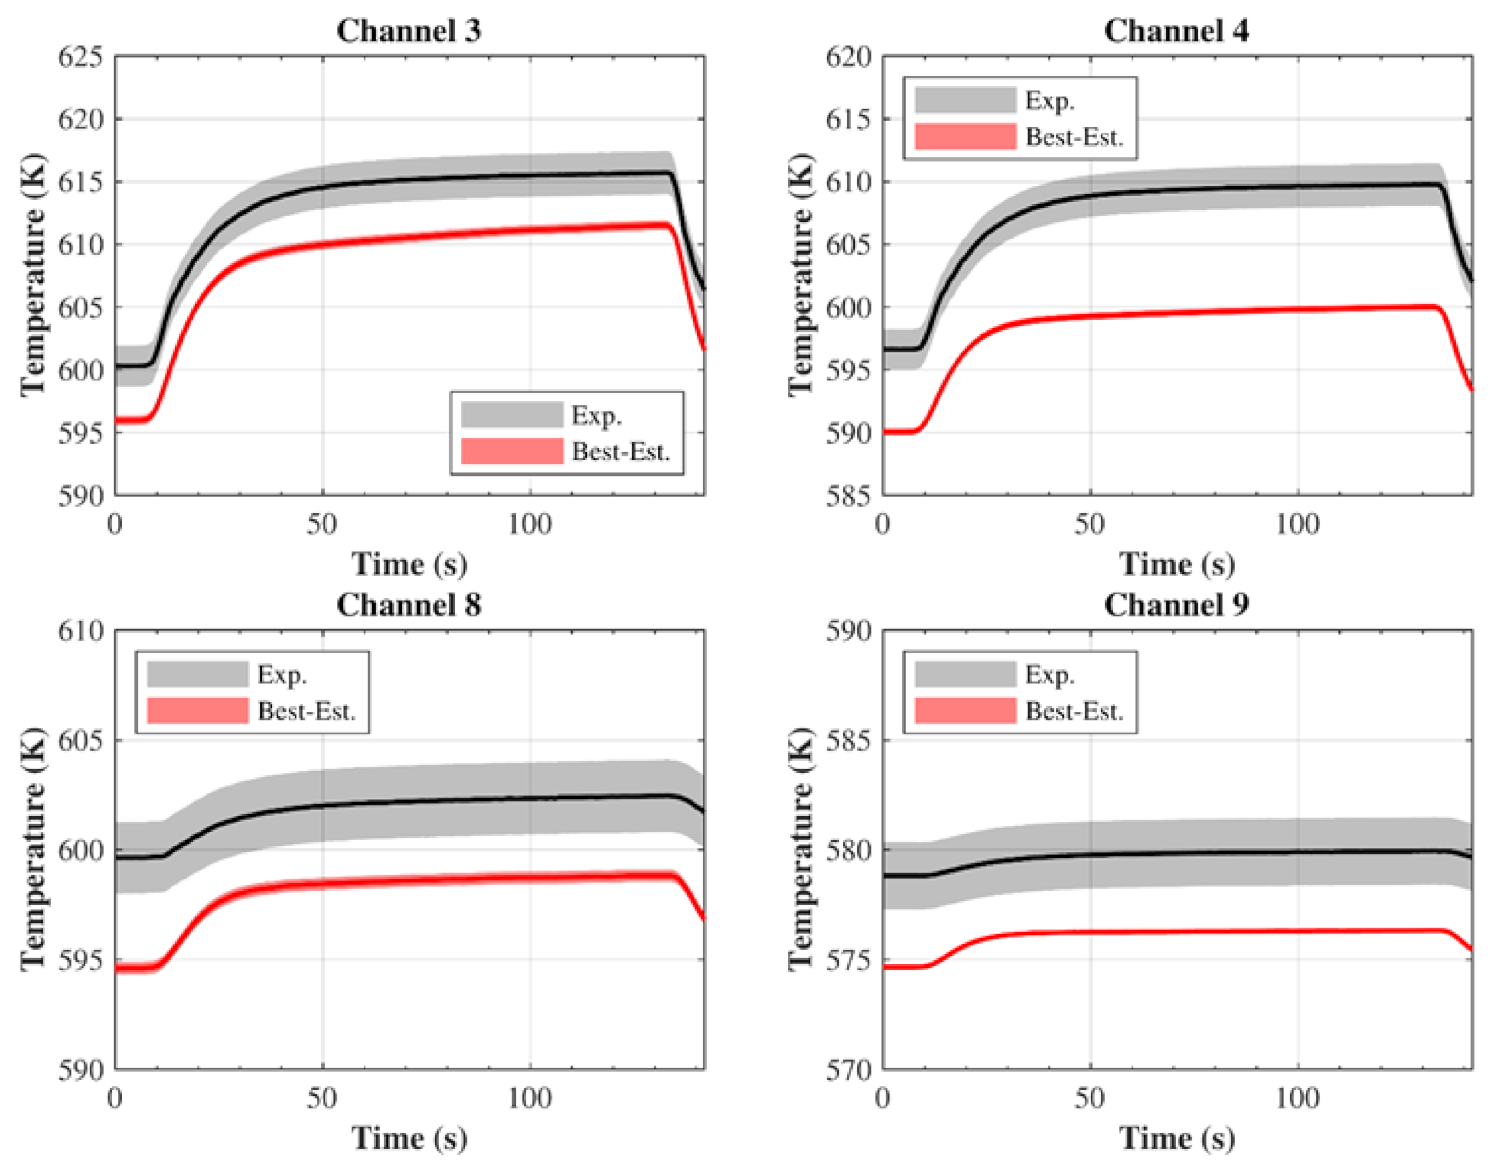
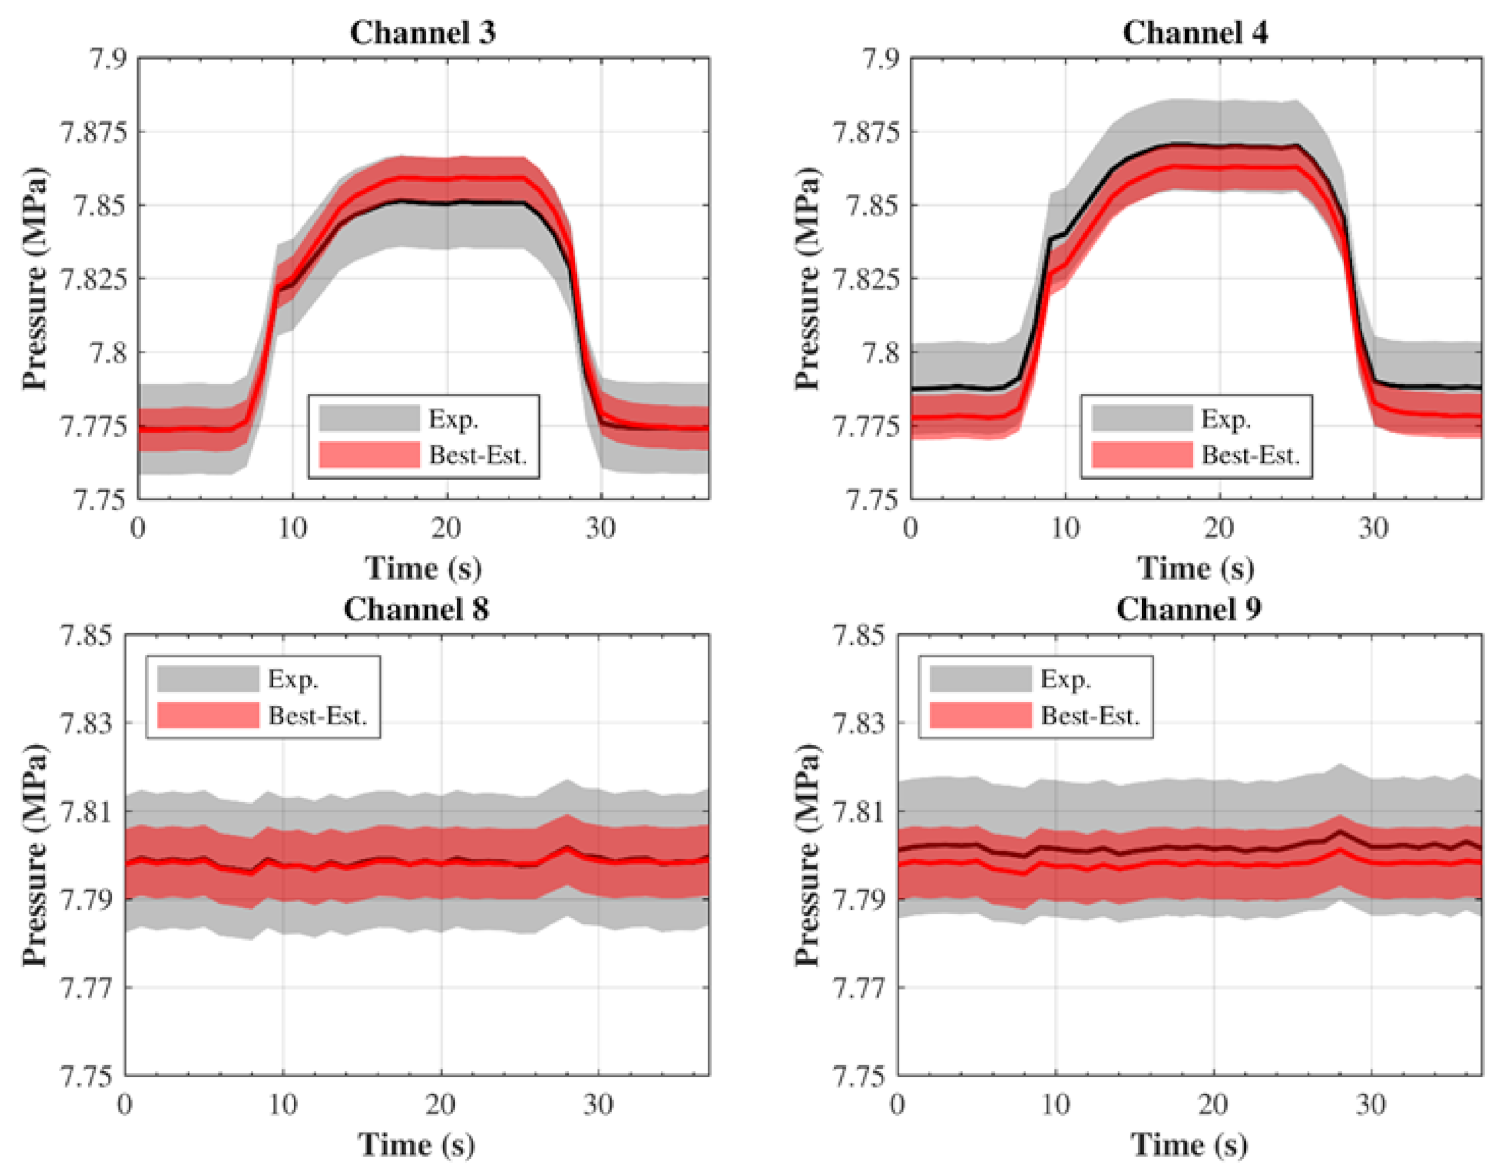
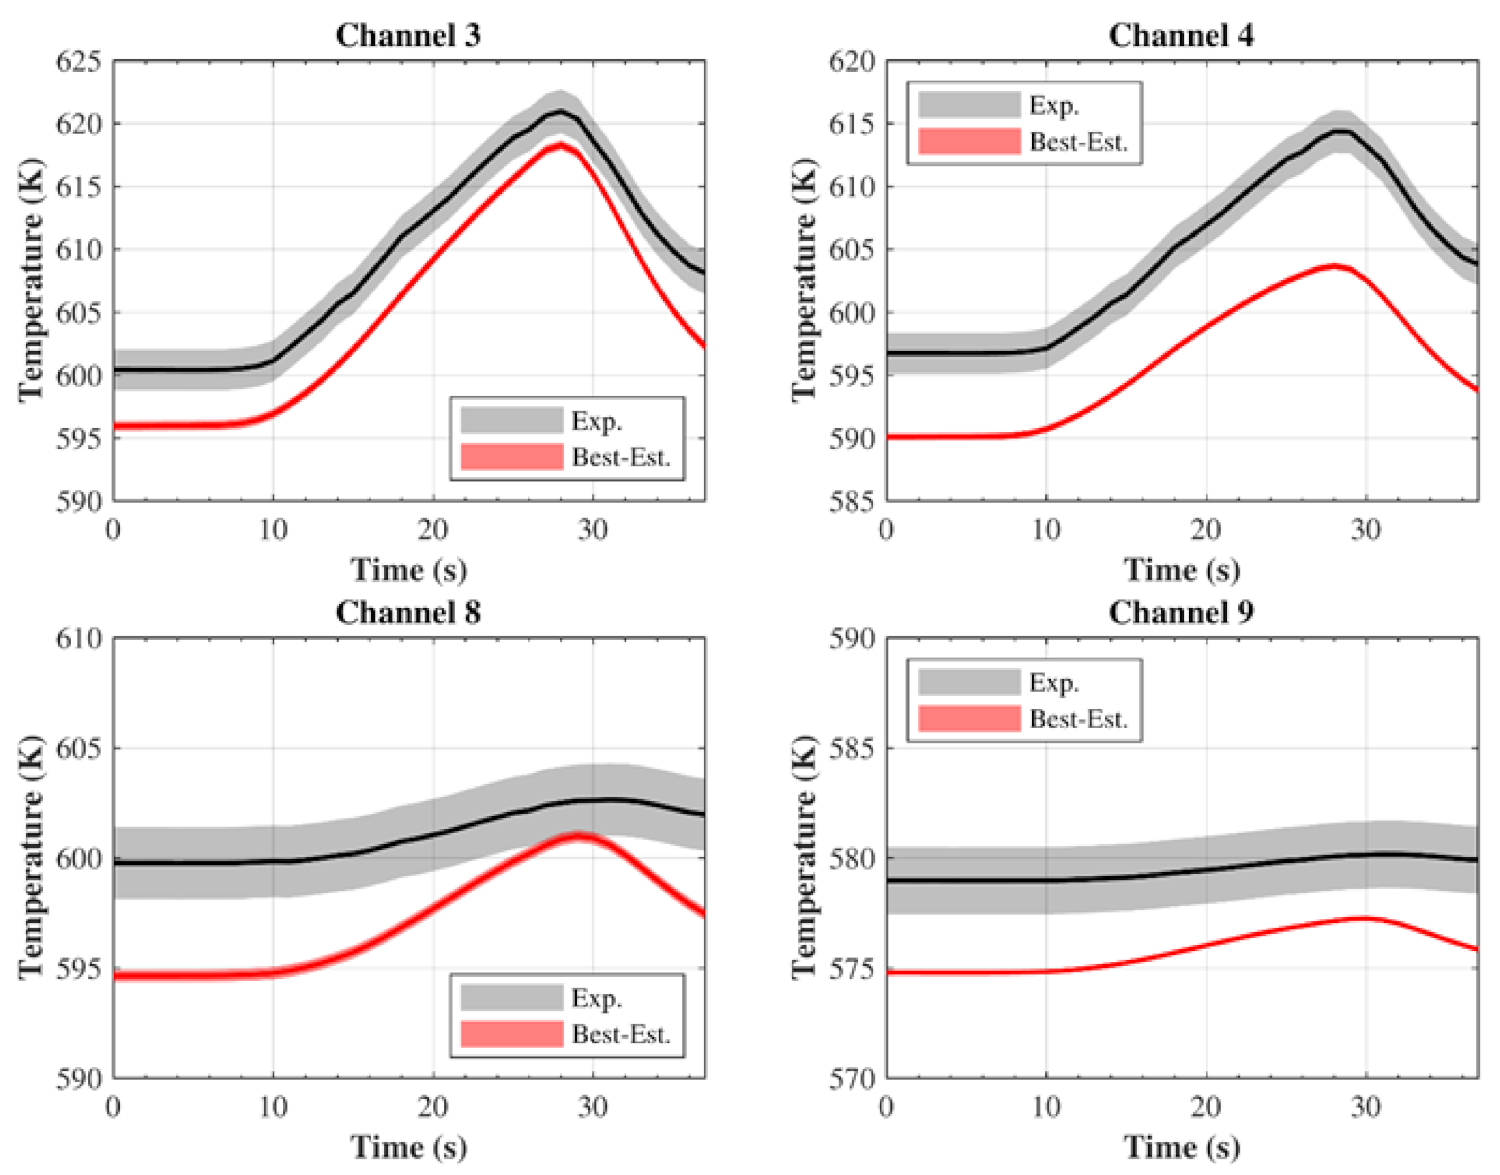
3.3. LOFA Tests with a Sensitivity Matrix Coming from the Pre-Calibrations

The MELCOR 1.8.6 complete model was employed to simulate 11 LOFA scenarios (the same ones investigated with RELAP5-3D [4]):
  • Six cases for the heat load of 300 kW/m2: 0% valve open (full LOFA), 5%, 10%, 20%, 40%, and 60%;
  • Five cases for the heat load of 330 kW/m2: 0% valve open, 5%, 10%, 20%, and 40%.
Each MELCOR input deck was created starting from the parameters obtained from the preliminary calibrations and employing the initial conditions related to each individual scenario. Then, the sensitivities coming from the preliminary calibrations were considered as a good starting point for the subsequent analysis with the best-estimate methodology.
The different scenarios can be divided into three categories:
C1.
LOFAs not approaching the 550 °C limit (40% and 60% valve open). Damages on the surface under heat load may arise if this temperature is exceeded, so 550 °C is used as a safety limit;
C2.
LOFAs approaching the 550 °C limit, but without showing symptoms of back-flows (5%, 10%, and 20% valve open);
C3.
LOFAs approaching the 550 °C limit and showing signs of back-flows (0% valve open).
In contrast to those performed in [4], the “average” tests investigated in the present paper are not created taking into account all the repetitions performed during the different days, but only those performed on a specific day. This reduced set of experiments was chosen being sufficiently representative of the whole experimental campaign.
The comparison between the experimental data and the best-estimate results obtained from the best-estimate methodology for the 40% valve opening scenario at 300 kW/m2—representative for category C1—are shown in Figure 6 (outlet pressure) and Figure 7 (outlet temperature). As it can be observed, the code is able to correctly simulate both the pressure and the temperature trends, but quantitative differences exist in the latter because of the impossibility to reproduce the friction heating. These results show also a small range of uncertainty for the temperatures due to use of a sensitivity matrix obtained in steady-state conditions instead of transient conditions.
The results for the 10% valve opening scenario at 300 kW/m2 are reported in Figure 8 and Figure 9 (scenario representative of the C2 category). In this scenario, the residual coolant flow rate is not sufficient to control the temperature increase, and the tests terminated after a few seconds to comply with the 550 °C safety limit. This scenario is again well-reproduced, but the temperature trends shown by the MELCOR code differ from the experimental ones. These differences are probably linked to the reproduction of the heat transfer among neighbor structures: a too-fast heat exchange among Channels 4 and 8 is established, and the temperature increase is faster (compared to the experimental trends) on Channel 8 (not is LOFA conditions) and slower on Channel 4. The outcome of this behavior is a maximum temperature on Channels 4 roughly 10 °C below than the experimental figure (6–7 °C linked to the friction heating and 3–4 °C related to the heat exchange). By contrast, the temperature in Channel 8 reaches the experimental value at about 29 s, but in a steady-state condition, it was below the experimental value of about 5 °C.
Finally, the results for the 0% valve opening scenario at 300 kW/m2 are shown in Figure 10 and Figure 11 (scenario representative of the C3 category), respectively. This scenario is characterized by the establishment of small back-flows through the channels under LOFA conditions. The effects of this phenomenon are shown on the coolant temperature trend between 16 and 23 s: the temperature increase suddenly stops because the cold coolant is transported back from the outlet header into the mock-up. The coolant in the outlet header is colder than the coolant exiting from Channels 3 and 4, being a mixture of the coolant that crossed also the channels not under heat load (Channels 1, 2, and 5). The establishment of back-flows also turns the outlet temperature sensors into inlet sensors because they start to measure the temperature of the coolant before crossing the mock-up.
The results for this last scenario are again in quite good agreement with the experimental trends, especially concerning the outlet coolant pressure (Figure 10). For the temperature, the same discrepancy found for the 10% valve opening scenario is also present in this scenario (temperature trends different from the experimental ones), but the most important difference is the lack of back-flow in Channel 4 (Figure 11). The same issue was also found in the analysis with the RELAP5-3D code [4]. In this analysis, this behavior is linked primarily to the assumption made regarding the coolant inlet pressure in Channels 1 and 5: since no measurements are performed on these channels, a mean value coming from the reading of Channels 2–4 is used. Other factors playing a role on this issue are also:
  • The pressure drop coefficients in reverse direction were not re-calibrated while analyzing the steady-state at 300 and 330 kW/m2 (both with and without heat load) since no experimental data are available;
  • The inlet coolant pressure and temperature are available only for few channels.
Overall, the results of each scenario agree sufficiently well with the experimental data, thus suggesting the validity of the models adopted in the MELCOR code. The capabilities of the hydrodynamic model are ensured by the very good agreement achieved concerning the pressure evolution in the channels. The capability to reproduce heat transfer phenomena among adjacent heat structures is demonstrated by the evolution of the coolant temperature in Channels 8 and 9 when the LOFA occurs in Channels 1–5. At the same time, the evolution of the coolant temperature in Channels 3 and 4 shows the capabilities of the fluid-wall heat transfer model (Dittus–Boelter correlation).

3.4. Full LOFA Scenario at 300 kW/m2 with Calculated Sensitivities

The analyses performed adopting a sensitivity matrix calculated starting from a steady-state condition were sufficient to demonstrate the capabilities of the MELCOR 1.8.6 code. However, these analyses left two open questions:
  • Too-small uncertainty ranges for the outlet coolant temperatures;
  • The lack of back-flows in C3 scenarios.
The first issue is probably linked to the use of a sensitivity matrix coming from steady-state conditions, while the second one is probably linked to the assumptions made for the coolant inlet pressure through Channels 1 and 5. To prove the correctness of these two explanations, the Full LOFA scenario at 300 kW/m2 has been re-investigated calculating the sensitivity matrix adopting the brute force method. The set of parameters considered in this analysis was also extended to include the inlet coolant pressure in Channels 1 and 5.
The outlet coolant temperatures from the channels under heat load are shown in Figure 12, while Figure 13 shows the results achieved from the two sensitivity runs performed considering the inlet pressure from Channel 1 as parameter. The results achieved demonstrate that the small uncertainty ranges shown in Figure 7, Figure 9 and Figure 11 are mostly linked with the use of a sensitivity matrix obtained from a steady-state calculation.
However, the uncertainty ranges obtained in MELCOR 1.8.6 are smaller than those obtained in RELAP5-3D [4], but this is not surprising considering that RELAP5-3D offers more options and models to reproduce the thermal-hydraulics of the system.
Instead, the behavior of two sensitivity runs performed considering the inlet pressure from Channel 1 as parameters show that a small variation of this parameter can completely change the outcome of the calculations (non-linear variation in the surrounding of the nominal parameter value). This supports the same conclusion drawn in [4] that linked the inconsistent behavior of the temperature in the C3 scenarios with the user’s assumption made and not with the code.

4. Conclusions

This paper reports the activities concerning the validation of MELCOR 1.8.6 for fusion against experimental data investigating the behavior of a FWMU in DEMO relevant conditions. The strategy adopted for this activity capitalizes the previous experience with RELAP5-3D [4]. The validation work was divided into two phases: the creation of a model able to reproduce the Pressure Drop Characteristic Tests and the development of a more complex (and complete) model for the subsequent simulation of the LOFA scenarios. In both cases, the modeling stage was supplemented with the application of a best-estimate methodology to obtain best-estimate parameters and responses, together with a quantification of the uncertainties on the results [7,8,11].
The results show that the best-estimate response obtained with the MELCOR code well reflect the behavior of system in the Pressure Drop Characterization Tests, for all ten cooling channels. Minor differences are found when high air mass flow rates are involved.
The MELCOR 1.8.6 validation was pursued further, with the development of a new model to reproduce the entire FWMU installation and most of the pipes present in the test section of the HELOKA-HP facility. The code was able to reproduce the pressures in the system in all the LOFA scenarios, whereas it showed some difficulties when dealing with temperatures. Despite the lack of an apt model to account for the frictional heating, MELCOR 1.8.6 was able to reproduce the temperature trend, with only minor discrepancies. The additional analysis performed recalculating the sensitivity matrix for the full LOFA scenario at 300 kW/m2 supports these conclusions, demonstrating that the small uncertainty range and the discordant temperature behavior in the C3 scenarios are mostly linked to user’s assumptions.
Overall, considering that MELCOR is not a pure thermal–hydraulic code, the results are sufficiently robust to state the overall validity of the employed models in DEMO relevant conditions.

Author Contributions

Conceptualization, B.G., M.A., B.-E.G. and X.Z.J.; methodology, B.G., B.-E.G. and M.I.-B.; software, B.G. and M.A.; validation, B.G. and M.A.; formal analysis, B.G., M.A. and B.-E.G.; investigation, B.G. and M.A.; resources, R.S. and S.P.; data curation, B.G. and M.A.; writing—original draft preparation, B.G. and M.A.; writing—review and editing, B.G., M.A., B.-E.G., X.Z.J., M.I.-B., S.P. and R.S.; visualization, B.G. and M.A.; supervision, B.-E.G., M.I.-B., S.P. and R.S.; project administration, B.-E.G., X.Z.J. and R.S.; funding acquisition, X.Z.J. and R.S. All authors have read and agreed to the published version of the manuscript.

Funding

This work has been carried out within the framework of the EUROfusion Consortium and has received funding from the Euratom research and training programme 2014-2018 and 2019-2020 under grant agreement No 633053. The views and opinions expressed herein do not necessarily reflect those of the European Commission.

Institutional Review Board Statement

Not applicable.

Informed Consent Statement

Not applicable.

Data Availability Statement

The study reports data that are not freely available.

Conflicts of Interest

The authors declare no conflict of interest.

References

  1. Federici, G.; Bachmann, C.; Barucca, L.; Biel, W.; Boccaccini, L.; Brown, R.; Bustreo, C.; Ciattaglia, S.; Cismondi, F.; Coleman, M.; et al. DEMO design activity in Europe: Progress and updates. Fusion Eng. Des. 2018, 136, 729–741. [Google Scholar] [CrossRef]
  2. Hernandez, F.; Pereslavtsev, P.; Zhou, G.; Kang, Q.; D’Amico, S.; Neuberger, H.; Boccaccini, L.V.; Kiss, B.; Nádasi, G.; Maqueda, L.; et al. Consolidated design of the HCPB Breeding Blanket for the pre-Conceptual Design Phase of the EU DEMO and harmonization with the ITER HCPB TBM program. Fusion Eng. Des. 2020, 157, 111614. [Google Scholar] [CrossRef]
  3. Zeile, C.; Abou-Sena, A.; Boccaccini, L.V.; Ghidersa, B.-E.; Kang, Q.; Kunze, A.; Lamberti, L.; Maione, I.A.; Rey, J.; von der Weth, A. Conceptual design of a First Wall Mock-Up experiment in preparation for the qualification of breeding blanket technologies in the Helium Loop Karlsruhe (HELOKA) facility. Fusion Eng. Des. 2016, 109–111, 1335–1339. [Google Scholar] [CrossRef]
  4. Ghidersa, B.-E.; Gonfiotti, B.; Kunze, A.; Di Marcello, V.; Ionescu-Bujor, M.; Jin, X.Z.; Stieglitz, R. Experimental investigation of a Helium-cooled Breeding Blanket First Wall under LOFA conditions and pre-test and post-test numerical analysis. Appl. Sci. 2021, 11, 12010. [Google Scholar] [CrossRef]
  5. Neuberger, H.; Rey, J.; Von Der Weth, A.; Hernandez, F.; Martin, T.; Zmitko, M.; Felde, A.; Niewöhner, R.; Krüger, F. Overview on ITER and DEMO blanket fabrication activities of the KIT INR and related frameworks. Fusion Eng. Des. 2015, 96, 315–318. [Google Scholar] [CrossRef]
  6. Jin, X.Z. Preliminary Accident Analysis of Ex-Vessel LOCA for the European DEMO HCPB Blanket Concept. Fusion Sci. Technol. 2021, 5, 391–402. [Google Scholar] [CrossRef]
  7. Cacuci, D.G.; Ionescu-Bujor, M. Best-Estimate Model Calibration and Prediction through Experimental Data Assimilation—I: Mathematical Framework. Nucl. Sci. Eng. 2010, 165, 18–44. [Google Scholar] [CrossRef]
  8. Gonfiotti, B.; Angelucci, M.; Ghidersa, B.-E.; Jin, X.Z.; Ionescu-Bujor, M.; Paci, S.; Stieglitz, R. Best-Estimate for System Codes (BeSYC): A new soft-ware to perform Best-Estimate Plus Uncertainty analyses with thermal-hydraulic and safety system codes. Appl. Sci. 2022, 12, 311. [Google Scholar] [CrossRef]
  9. Ghidersa, B.E.; Marchese, V.; Ionescu-Bujor, M.; Ihli, T.H. HELOKA facility: Thermo-hydrodynamic model and control. Fusion Eng. Des. 2008, 10–12, 1792–1796. [Google Scholar] [CrossRef]
  10. Abou-Sena, A.; Boccaccini, L.V.; Ghidersa, B.E.; Zinn, K. Characterization of the cooling channels of First Wall Mock-Up dedicated to the HCPB TBM qualification. Fusion Eng. Des. 2017, 124, 391–395. [Google Scholar] [CrossRef] [Green Version]
  11. Ionescu-Bujor, M.; Cacuci, D.G. A Comparative Review of Sensitivity and Uncertainty Analysis of Large-Scale Systems I: Deterministic Methods. Nucl. Sci. Eng. 2004, 147, 189–203. [Google Scholar] [CrossRef]
Figure 1. The First Wall Mock-Up.
Applsci 12 00187 g001
Figure 2. Arrangement of the pipes feeding the FWMU.
Applsci 12 00187 g002
Figure 3. Single-channel model (out of scale).
Applsci 12 00187 g003
Figure 4. Wall–wall heat transfer model.
Applsci 12 00187 g004
Figure 5. Results of the pressure drop characterization tests: Channels 3 and 4 (horizontal inlet), and Channels 7 and 8 (vertical inlet).
Applsci 12 00187 g005
Figure 6. Outlet coolant pressure—300 kW/m2, 40% valve opening scenario.
Applsci 12 00187 g006
Figure 7. Outlet coolant temperature—300 kW/m2, 40% valve opening scenario.
Applsci 12 00187 g007
Figure 8. Outlet coolant pressure—300 kW/m2, 10% valve opening scenario.
Applsci 12 00187 g008
Figure 9. Outlet coolant temperature—300 kW/m2, 10% valve opening scenario.
Applsci 12 00187 g009
Figure 10. Outlet coolant pressure—300 kW/m2, 0% valve opening scenario.
Applsci 12 00187 g010
Figure 11. Outlet coolant temperature—300 kW/m2, 0% valve opening scenario.
Applsci 12 00187 g011
Figure 12. Outlet coolant temperature—300 kW/m2, 0% valve opening scenario with the sensitivity matrix recalculated.
Applsci 12 00187 g012
Figure 13. Outlet coolant temperature—300 kW/m2, 0% valve opening scenario. Comparison of the two runs adopting the coolant inlet pressure in Channel 1 as parameter for the best-estimate methodology.
Applsci 12 00187 g013
Table 1. Best-estimate parameters after the calibration against the pressure drop characterization tests.
Ch.Horizontal InletVertical Inlet
K v K h K b K v K h K b ε (μm)
11.45 ± 0.240.71 ± 0.161.60 ± 0.401.69 ± 0.240.50 ± 0.121.60 ± 0.401.70 ± 0.17
21.06 ± 0.190.62 ± 0.141.53 ± 0.381.15 ± 0.180.41 ± 0.101.53 ± 0.381.70 ± 0.17
30.99 ± 0.180.60 ± 0.141.52 ± 0.381.01 ± 0.170.39 ± 0.101.51 ± 0.381.70 ± 0.17
40.88 ± 0.180.56 ± 0.141.50 ± 0.380.80 ± 0.170.36 ± 0.101.49 ± 0.381.70 ± 0.17
50.93 ± 0.180.58 ± 0.141.51 ± 0.381.11 ± 0.180.40 ± 0.101.52 ± 0.381.70 ± 0.17
60.89 ± 0.180.56 ± 0.141.51 ± 0.380.93 ± 0.170.38 ± 0.101.50 ± 0.381.70 ± 0.17
70.97 ± 0.180.59 ± 0.141.52 ± 0.380.94 ± 0.170.38 ± 0.101.50 ± 0.381.70 ± 0.17
80.85 ± 0.180.55 ± 0.141.50 ± 0.380.78 ± 0.160.36 ± 0.101.48 ± 0.381.70 ± 0.17
90.87 ± 0.180.55 ± 0.141.50 ± 0.380.86 ± 0.170.37 ± 0.101.49 ± 0.381.70 ± 0.17
100.88 ± 0.180.56 ± 0.141.50 ± 0.380.86 ± 0.170.37 ± 0.101.49 ± 0.381.70 ± 0.17
Table 2. Results of the pre-calibration at the 330 kW/m2 steady-states (with and without heat flow).
ResponsesExperimental ResultsBest-Estimated Results
330 kW/m2—No heat load
Δp—Ch. 2 (MPa)7.70 ± 0.0157.67 ± 7.6 × 10³
Δp—Ch. 3 (MPa)7.69 ± 0.0157.67 ± 7.5 × 10⁻³
Δp—Ch. 4 (MPa)7.7 ± 0.0157.67 ± 7.7 × 10⁻³
Δp—Ch. 7 (MPa)7.72 ± 0.0157.71 ± 8.2 × 10⁻³
Δp—Ch. 8 (MPa)7.71 ± 0.0157.71 ± 8.2 × 10⁻³
Δp—Ch. 9 (MPa)7.72 ± 0.0157.71 ± 8.2 × 10⁻³
330 kW/m2—No heat load
Outlet T.—Ch. 2 (°C)302.5 ± 1.5300.2 ± 0.2
Outlet T.—Ch. 3 (°C)324.2 ± 1.6320.6 ± 0.4
Outlet T.—Ch. 4 (°C)321.1 ± 1.6315.6 ± 0.3
Outlet T.—Ch. 7 (°C)323.5 ± 1.6319.6 ± 0.3
Outlet T.—Ch. 8 (°C)305.4 ± 1.5301.7 ± 0.1
Publisher’s Note: MDPI stays neutral with regard to jurisdictional claims in published maps and institutional affiliations.

