Article

Modelling the Effects of Nanomaterial Addition on the Permeability of the Compacted Clay Soil Using Machine Learning-Based Flow Resistance Analysis

by
Mehmet Şükrü Özçoban
1,
Muhammed Erdem Isenkul
2,*,
Selçuk Sevgen
2,
Seren Acarer
3 and
Mertol Tüfekci
4,*
1
Geotechnical Department, Yıldız Technical University, Davutpaşa, 34220 Istanbul, Turkey
2
Computer Engineering Department, İstanbul University-Cerrahpaşa, Avcılar, 34320 Istanbul, Turkey
3
Environmental Engineering Department, İstanbul University-Cerrahpaşa, Avcılar, 34320 Istanbul, Turkey
4
Department of Mechanical Engineering, Imperial College London, South Kensington Campus, Exhibition Road, London SW7 2AZ, UK
*
Authors to whom correspondence should be addressed.
Appl. Sci. 2022, 12(1), 186; https://doi.org/10.3390/app12010186
Submission received: 5 December 2021 / Revised: 20 December 2021 / Accepted: 21 December 2021 / Published: 24 December 2021
(This article belongs to the Section Environmental Sciences)

Abstract

:
Impermeable base layers that are made of materials with low permeability, such as clay soil, are necessary to prevent leachate in landfills from harming the environment. However, over time, the permeability of the clay soil changes. Therefore, to reduce and minimize the risk, the permeability-related characteristics of the base layers must be improved. Thus, this study aims to serve this purpose by experimentally investigating the effects of nanomaterial addition (aluminum oxide, iron oxide) into kaolin samples. The obtained samples are prepared by applying standard compaction, and the permeability of the soil sample is experimentally investigated by passing leachate from the reactors, in which these samples are placed. Therefore, Flow Resistance (FR) analysis is conducted and the obtained results show that the Al additives are more successful than the Fe additive in reducing leachate permeability. Besides, the concentration values of some polluting parameters (Chemical Oxygen Demand (COD), Total Kjeldahl Nitrogen (TKN), and Total Phosphorus (TP)) at the inlet and outlet of the reactors are analyzed. Three different models (Artificial Neural Networks (ANN), Multiple Linear Regression (MLR), Support Vector Machine (SVM)) are applied to the data obtained from the experimental study. The results have shown that polluting parameters produce high FR regression similarity rates (>75%), TKN, TP, and COD features are highly correlated with the FR value (>60%) and the most successful method is found to be the SVM model.

1. Introduction

The disposal of solid wastes by landfill is a more widely used disposal method compared to others due to its economic advantages and simplicity [1]. With the effect of water in the composition of the wastes, precipitation, and physical, chemical, and biological reactions, leachate occurs in landfill areas [2]. Leachate is wastewater with a high contaminant content that contains organic substances, monovalent and multivalent ions, microorganisms, and heavy metals [3]. The type of waste in the landfill, waste composition, age of the landfill and climatic conditions are all factors that affect the chemical composition of the leachate [4]. In typical leachate, the chemical oxygen demand (COD), total phosphorus (TP) concentration, and organic nitrogen concentration vary in the range of 140–152,000 mg/L, 0.1–30 mg/L, and 14–2500 mg/L, respectively [5,6,7].
Liners with low hydraulic conductivity (k ≤ 10−7 cm/s) are used to prevent leachate from reaching the groundwater in landfill areas. Hydraulic conductivity depends on many factors such as the void ratio, medium porosity, pore size, soil type, liquid type, and contaminant concentration [8,9]. As the leachate passes through the clayey soil, it causes changes in the structure and properties of the clay, resulting in an increase or decrease in hydraulic conductivity. The increase in ion concentration [10,11], ionic valence [12,13], and organic matter concentration [14,15] in the leachate contributes to increasing the hydraulic conductivity, while the increase in the number of microorganisms [16] and the suspended solid concentration [17] contributes to the decrease in hydraulic conductivity. The increase in hydraulic conductivity as a result of the leachate-liner interaction is caused by factors such as the thinning of the diffuse double layer (DDL) thickness of the clay, agglomeration, flocculation of the clay particles, the formation of cracks in the soil structure, and the increase in the void ratio [12,14,18,19].
The low permeability of the liner, which can be provided with natural materials such as clay, is of great importance in terms of not polluting the groundwater with the leachate of the landfill area. However, geomembranes are used alongside the low permeability liner when the landfill area is inclined. The use of clay in landfills is more advantageous and preferable due to the cost of geomembranes and the risk of puncture. Therefore, it is important to improve the permeability of clay with nanomaterials [20,21].
The properties of the clays used in the landfill can be modified by adding nanomaterials to the clay. The high specific surface area of nanoparticles can cause a high surface energy between the particles, which can greatly change the engineering properties as well as the physical and chemical properties of the soil [22,23,24]. For instance, Naval et al. state that the addition of nano MgO and nano Al2O3 into kaolinite clay resulted in a decrease in the liquid limit, plasticity limit, plastic index, and swelling potential of the soil [25]. In addition, the presence of nanoparticles in the clay, and the increase in nanoparticle concentration, change the bonding and adhesion between the clay particles, increase the connection between the pores and cause the number and size of the pores to decrease [23,24,26]. Increasing the soil integrity of the clayey soil and decreasing the porosity through nanomaterials cause a decrease in hydraulic conductivity. Studies in the literature reveal that nanomaterial type [27,28,29], concentration [28,29], and size [30] affect permeability. Taipodia et al. report that the permeability coefficient decreased from 2.41 × 10⁻⁵ cm/s to 1.25 × 10⁻⁵ cm/s as a result of filling the soil voids with the addition of nano CaO to clayey soil [27]. Ng and Coo mix two different nanomaterials, gamma-aluminum oxide (γ-Al2O3) and nano-copper oxide (CuO), with kaolin clay in different proportions. The initial hydraulic conductivity is decreased by 30% and 45%, respectively, with the addition of 2% nano γ-Al2O3 and 2% nano CuO [28]. Taha and Alsharef report that the hydraulic conductivity value of pure soil sample decreased from 2.16 × 10⁻⁹ m/s to 9.46 × 10⁻¹⁰ m/s and 7.44 × 10⁻¹⁰ m/s, respectively, with the addition of multiwall carbon nanotube (CNT) and carbon nanofiber (CNF) [29]. Bahmani et al. investigate the effect of nanosilica particles of two different sizes, 15 nm, and 80 nm, on the hydraulic conductivity of the soil. Nanosilica particles with the size of 15 nm further reduced the hydraulic conductivity. Bahmani attributes this to the fact that the packing density of smaller-sized nanoparticles is higher than that of larger-sized nanoparticles [30].
There are many machine learning studies on permeability estimation in the literature. Ahangar-Asr et al. make an estimation of permeability using Evolutionary Polynomial Regression; the obtained results are compared with the Artificial Neural Networks and better results are obtained [31]. In Boroumand and Baziar’s studies, permeability estimation is made using ANN and comparative analyses are made with previous Artificial Neural Networks studies [32]. Günaydin et al. calculate the compaction parameters related to permeability using the Support Vector Machine model [33]. In Ozbeyaz and Soylemez’s study, Support Vector Machine and decision trees are used to calculate compaction parameters. The Support Vector Machine model is found to produce better results [34]. On the other hand, Singh et al. hypothesize that Support Vector Machines, Multi Linear Regression, Genetic Programming, and Random Forest algorithms are used for permeability estimation. The Support Vector Machine model has been found to produce the best results [35]. Sebastian and Sindhu’s study is intended to develop correlations between permeability and different soil properties using the Multi Linear Regression method [36]. Santisukkasaem et al.’s study is aimed to create a permeability-predicting ANN structure by using different ANN structures. The obtained results are compared with MLR and it is seen that ANN produced better results [37]. In another study, permeability, maximum dry density (MDD), and optimum moisture content are estimated using ANN. The obtained results are compared with Statistical Equations and it is seen that ANN is a suitable model [38]. Tizpa et al. present artificial neural network prediction models, which relate compaction characteristics, permeability, and soil shear strength to soil index properties. A comparison of the results demonstrates that the developed ANN models provide highly accurate predictions [39]. Finally, Mahdi and Holdich’s research predicts the permeability of loosely packed granular materials is made using ANN and MLR. One can see that ANN gives the best results [40].
This study is aimed to improve the impermeability of the base by adding different percentages of aluminum oxide and iron oxide as nanomaterials into the kaolin sample. Three different models (Artificial Neural Networks (ANN), Multiple Linear Regression (MLR), Support Vector Machine (SVM)) are applied to the data obtained from the experimental study. Thus, the Flow Resistance (FR) model is employed for the first time to approach this problem with an analogy of the typical traffic flow phenomenon. Finally, the obtained data are evaluated and the drawn conclusions are discussed.

2. Materials and Methods

2.1. Experimental Setup and Tests

Fixed head permeability experimental methods are used in this study. The reactor has a volume of 15,700 cm3 and is made of plexiglass. The height of the clay soil layer in the reactor is 11 cm. Clay soil specimens are saturated under 0.3 bar pressure [41]. The experimental setup is visualized in Figure 1 [42].

2.2. Standard Compaction Test

In this study, the standard compaction test, which characterizes the relationship between the dry unit weight of the soils and the mold water content, is applied. The energy and compression type provided for a given clay volume is standard. First, the clay samples are dried, and then water is added gradually to achieve the desired moisture content. The samples are placed in the mold and compression is applied in three stages. At each stage, 25 drops are made from a height of 30 cm with a 2.5 kg hammer [42]. The samples are prepared at the optimum water content by adding nanomaterials separately into kaolin.

2.3. Material Properties

The properties of the leachate, taken from Kemerburgaz-Odayeri Landfill Area located on the European side of İstanbul are as follows, pH: 8.5, COD: 5025 mg/L, TKN: 3365 mg/L, TP: 7.4 mg/L, and SS: 848 mg/L.
The kaolin consists of kaolinite, illite, and quartz. For more detailed chemical composition, the reader is encouraged to refer to the technical data sheet of Esan Eczacıbaşı Industrial Raw Materials Ind. and Trading Inc. Iron oxide nanopowder of 50–100 nm effective diameter, which is purchased from Sigma-Aldrich, and aluminum oxide nanopowder of 13 nm effective particle diameter are used as nanomaterial additives [42].

2.4. Methods of Modelling

2.4.1. Artificial Neural Networks (ANN)

ANN is a modelling approach that is based on simulating human nervous system behavior. This is an efficient tool for solving various problems thanks to its properties such as non-linearity, information processing, and learning. Therefore, ANN is used in various fields, especially for classification, modelling, and prediction processes. For the usage of these various fields, many types of ANN are developed in the literature: Multi-Layer Perceptron networks (MLP), Hopfield networks, Cohen–Grossberg networks, Elman networks, bidirectional associative memory networks etc. [43].
MLP, which is a popular network model and also used in this study, is a network that consists of an input layer, an output layer, and one or more hidden layers [43]. In this study, there are three neurons in the input layer as COD, TKN, and TP; ten neurons in the hidden layer, and one neuron in the output layer as kaolin (Figure 2).

2.4.2. Multiple Linear Regression (MLR)

Regression is an analysis method used to measure the relationship between two or more quantitative variables and it is widely used for analyzing multifactor data. This is useful when it comes to expressing the relationship between input variable(s) and an output variable. Multiple Linear Regression (MLR) is a regression type, in which there is more than one input parameter. MLR presents a relationship between the independent variables, which affect the dependent variables. The formulation of the general MLR model is shown below:
y = β0 + β1x1 + β2x2 + … + βkxk + ε
where y is the output, xi (i = 1, 2, …, k) are input values, βi (i = 0, 2, …, k) are the coefficients for the corresponding variables, β0 is the constant term and ε is the associated error term [44].

2.4.3. Support Vector Machine (SVM)

SVM is a popular supervised learning algorithm used for classification and regression problems thanks to its strength in the non-linear classification process and the ability to solve problems without getting stuck in a local minimum [45]. When using SVM in regression problems, an alternative loss function is given. In this study, the quadratic loss function is used for regression analysis [46].

2.5. Modelling

2.5.1. Flow Resistance (FR)

In the modelling phase, to examine the effects of clay samples with different percentages of nanomaterial content on pollutant permeability, a new model is developed by analogy with classical traffic flow models based on basic parameters, such as the amount of polluted water passing through the clay at different time intervals obtained from the experiment, height, volume, surface area. The development stages of the model are described below.
In the first stage of the model, firstly, the mass flow values of the leachate passing through the clay at different time intervals are calculated (Equation (2)). Flow rate information for different clay mixtures is shown in Table 1.
  Mass   Flow   Rate   ( MFR ) = m w a t e r Δ t
Then, the flow density (s/cm) for the polluted water passing through the clay is calculated for each time interval, from which the samples are taken (Equation (3)). ∆t is the time elapsed between the two measurements, and L is the thickness of the clay (L = 11 cm). Since the samples are taken at the same time for all clay types and the thicknesses are equal, the transition density values are the same for all clays (Table 2).
Flow   Density   ( FD ) = Δ t L
In the next step, the flow traffic rate (g/cm) at the time the sample is taken is calculated by multiplying the mass flow values with the flow density (Equation (4)).
Flow   Traffic   Rate   ( FTR ) = MFR   ×   FD
In the last step, the flow traffic rate (FTR) is multiplied by the time difference between the two samples. So, the average flow rate (AFR) is determined (Equation (5)). Afterwards, the average flow rate is multiplied by the clay permeability to determine how much the soil resists the flow (Equation (6)).
Average   Flow   Rate   ( AFR ) = FTR   × t
Flow   Resistance   ( FR ) = AFR   × k

2.5.2. Regression Similarity Approach

The other stage of the modelling is to examine the performance of predicting the FR values of pollutants at different time intervals with machine learning methods. Therefore, regression methods are used instead of classification methods in order to measure the effects of pollutants in the system as inputs on the FR value. As the FR values are real numbered variables that do not contain any class information (0 or 1), regression methods will enable the determination of both the current and future FR values of the system. If the problem is linear, linear regression methods should be used. Otherwise, non-linear regression methods can be selected for the analysis (Equation (7)).
Y i = β 0 + β 1 ( X i ) n + ε i
Y i is the estimated regression value of FR, β 0 is the parameter of the intersection point of the y-axis, β 1 is the slope of regression graph, X i is pollutant value, ε i is random error rate, n is the degree of the regression line. For n = 1 , the solution will be linear, however, for n > 1 the result is solved only in the non-linear plane.
We observed that the literature and many different studies, summarized in the Introduction section, generally focus on three different regression methods for the two types of problems mentioned above. Those are SVM, ANN, and MLR methods.
MLR is chosen as the linear regression method rather than the classical method. The main reason for choosing the MLR method is that the number of pollutant variables is more than one (COD, TKN, and TP). Therefore, classical linear regression is not a suitable method for the problem.
SVM and ANN are two commonly used techniques for non-linear regression. Some studies state that SVM is better than ANN, while some studies found the opposite. These performance differences are related to both problem types, dataset size, and dataset balance. Since the FR model we proposed is the first in the literature and therefore there is no comparable dataset, there is no definite information about which method would give better performance. However, as mentioned in the Analysis section, both methods show that the dataset has meaningful information and is highly correlated with the actual FR values.
Thirty-three randomly selected soil samples that contain COD, TKN, and TP of the leachate at different time intervals are divided into train and test sets to generate FR values based on soil using 5-fold cross-validation. Cross-validation is required to select the different time intervals. The separation process of the data into train and test sets is conducted in order to test the trained regression model without overfitting. What is required here is the similarity between the regression and the actual FR values. In the regression similarity approach, the root means square error (RMSE) of the two values is subtracted from 1 and the error rate is converted to the similarity ratio (Equation (8)).
Similarity = 1 1 n i = 1 n ( y i y ^ i ) 2
where n is the number of test size, yi is the observed value for the ith observation and y ^ i is the predicted value. In addition, R2 similarity analysis, which is frequently used in regression analysis, is also applied in our study. The most general definition formula for the identification coefficient (R2) is:
R 2 = 1 i ( y i y ^ i   ) 2 i ( y i y ¯ i ) 2
where yi is the observed value for the ith observation, y ^ i is the predicted value and y ¯ i is the mean value of the response variable.
We observed that COD, TKN, and TP as an attribute have different effects on the similarity ratio (in the range of 0 to 1 or non-similar to similar) between the value produced by regression and the actual FR values. This procedure is repeated 100 times and the average of similarity ratios is taken as the basis for the analysis.

3. Results

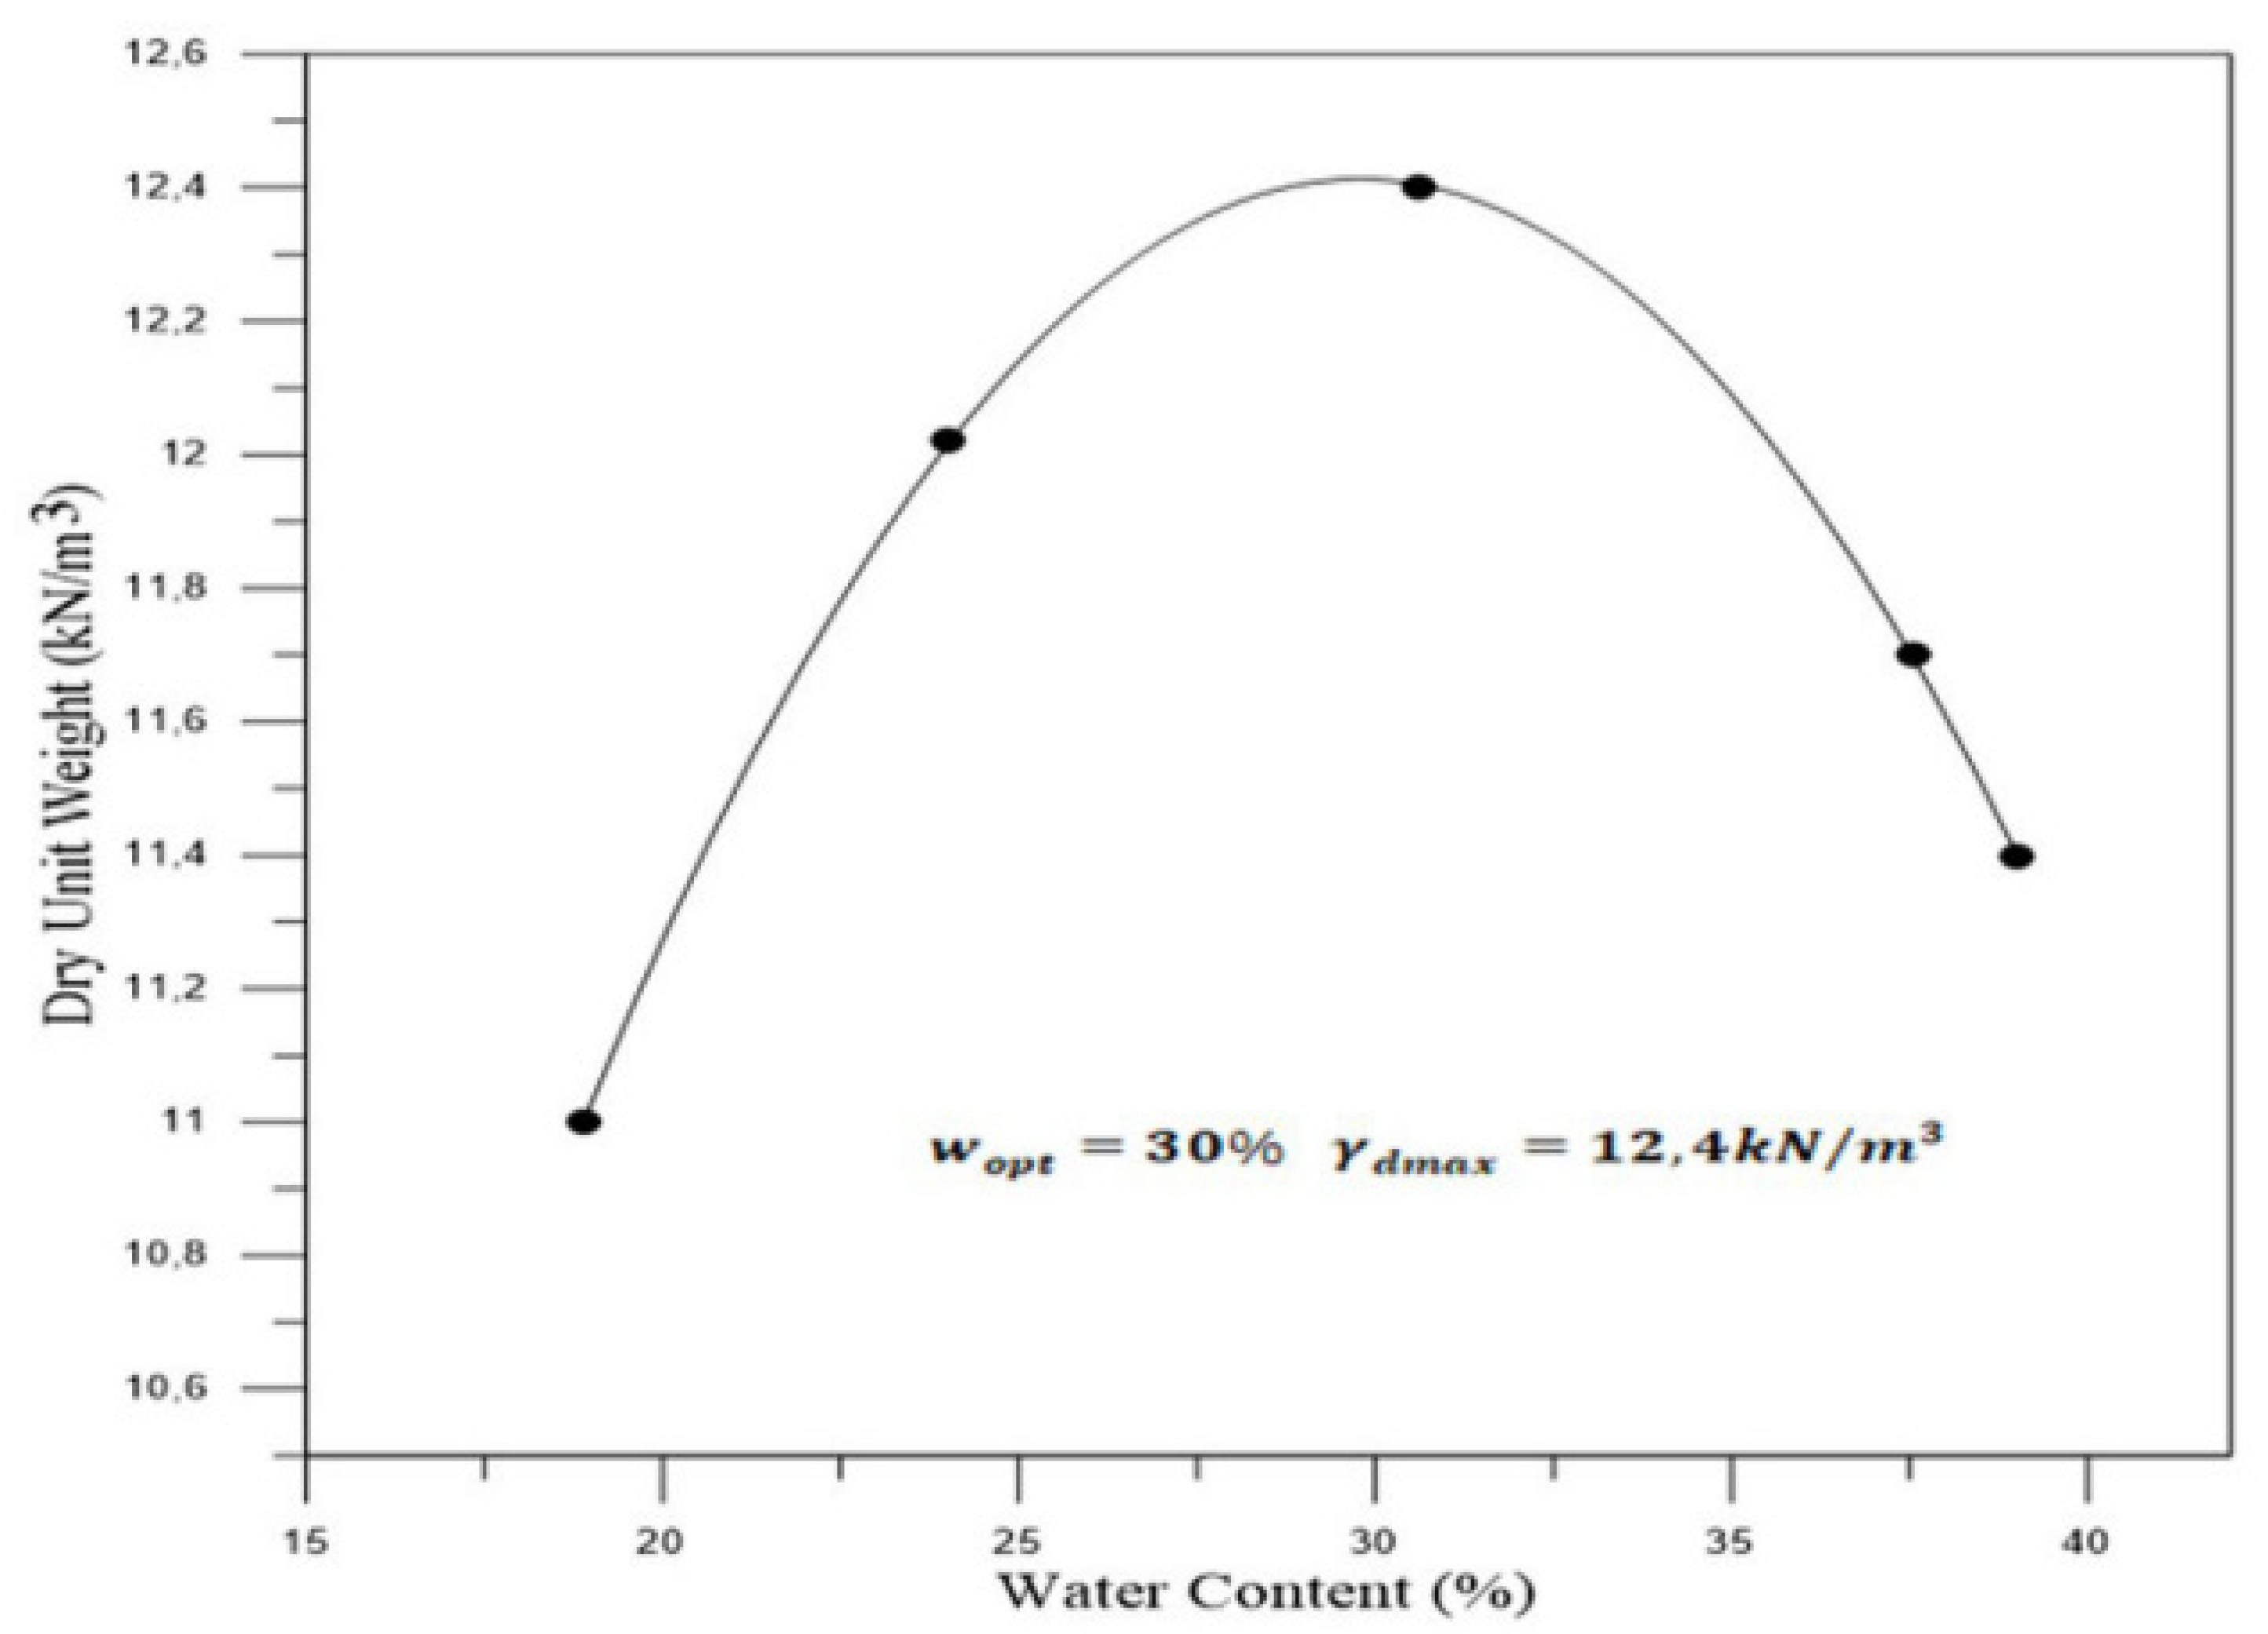
3.1. Compaction Test Results

Compaction in the laboratory experimentally investigates the changes in dry unit weight as well as the water content. As a result, the level of packing due to the applied compaction energy is also determined. The correlation between the water content and the dry unit weight is given in Figure 3. As a result of the standard compaction test, the optimal water content (wopt) of the soil is found to be 30% and the dry unit weight (γdmax) is 12.4 kN/m3 [40].

3.2. Flow Resistance Analysis

In the Flow Resistance (FR) analysis, FR values of different clay samples are calculated by using Equation (6). The calculated FR values are normalized to the 0–1 range and shown in Figure 4.
In light of the figures above, the time taken to reach 80% FR of the clay samples with and without nanomaterials is given in Table 3. According to the results obtained, we can see that the clay samples with nanomaterials reach the maximum FR much faster than the clay samples without additives and prevent leachate permeation much more quickly. While kaolin clay without additives can reach this value on the 139th day, the sample with 2% Fe added can reach this value on the 74th day, the sample with 4% Fe added on the 42nd day, the sample with 2% Al added on the 39th day and finally the sample with 4% Al added on the 11th day. The faster inhibition of leachate permeation after the addition of iron and aluminum nanomaterials to kaolin can be attributed to the fact that nanomaterials fill the pores in the clay soil structure and reduce porosity [47,48].
According to these results, we can be state that in the selection of the nanomaterial additives to be added to the clay, the Al additives are more successful than the Fe additive in the leachate permeability when compared to the pure kaolin clay sample. The smaller effective pore diameter of aluminum oxide compared to iron oxide means that aluminum oxide has a higher specific surface area. Nanomaterials with higher surface area absorb higher amounts of water and cause a greater increase in the water accumulation capacity of the soil [24,49]. The fact that the maximum FR value is reached in a shorter time in aluminum oxide added to kaolin compared to iron oxide added to kaolin, and that the permeability is lower when the aluminum oxide is added to kaolin, can be explained by the relationship between the surface area of the nanomaterial and its water accumulation capacity.
Another point is that with the increase in the iron oxide and aluminum oxide concentration added to kaolin, the time to reach the maximum FR is shortened and permeability values decreased. This result shows that the nanomaterial concentration creates a differentiation in the flow properties of the soil.

3.3. Regression and Correlation Analysis

The question underlying the regression analysis is how COD, TKN, and TP of leachate affect the FR value. Thus, the similarity between actual and predicted FR values should be calculated by using COD, TKN, and TP values.
Similarities between measured FR and predicted FR calculated using only leachate values would give some information about the effects of leachate on FR for different types of nanomaterial clay samples. For this reason, each COD, TKN, and TP value is selected as an attribute used for three different types of regression methods. Then, regression similarities are examined between the actual and predicted FR values. This process is repeated 100 times with randomly selected samples every time. Similarity (1 − RMSE), R2 regression similarity, and correlation (ρ) analysis results are shown in the tables given below (Table 4, Table 5, Table 6 and Table 7).
When the regression values of leachate parameters are examined, we see features produced by high FR regression similarity rates (>75%). Furthermore, the correlation analysis shows that TKN, TP, and COD parameters are highly correlated with the FR value (>60%).
The FR values of Multiple Linear Regression produced by features and the actual FR values graph are shown in Figure 3 below for three different clay samples (Normal, 4% Fe, 4% Al) (Figure 5, Figure 6 and Figure 7).
According to the results obtained, we can see that the regression performances and similarities decrease from the sample without nanomaterial additive to the sample with 4% Al. This situation is examined with three different regression methods. In the pure kaolin sample with the highest permeability, the regression similarity performance is 0.95. However, when the regression success rate of the 4% Al added clay sample with the lowest permeability is considered, we see that the success has decreased to the range of 78–80% and the similarity value, R2, has decreased to 0.32, away from the safe range. We can say that this result facilitates the predictability of the FR value, as the pollutants in the leachate regularly flow from the pure clay and form a certain flow pattern.

4. Conclusions

This study demonstrates a new machine learning-based flow resistance (FR) method for modelling the effects of nanomaterial additions (different percentages of aluminum oxide and iron oxide) on the permeability of compacted clay soil. The new model is developed by analogy with classical traffic flow models based on basic parameters such as the amount of polluted water passing through the clay at different time intervals obtained from the experiment, height, volume, and surface area. Three different machine learning regression algorithms (SVM, ANN, and MLR) are found to be very reliable and potential techniques for revealing the permeability performance for different types of soil clay samples are represented by the new model. In terms of flow resistance analysis, we found that the clay samples with nanomaterials, especially those with 4% Al, reach the maximum FR ratio much faster than those without and prevent dirty water permeation early. Regression and correlation analysis reveals how COD, TKN, and TP pollutants affect the FR value of different types of soil clay samples. We found that this analysis facilitates the predictability of the FR value, as the pollutants in the leachate regularly flow from the pure clay and form a certain flow pattern. The obtained model results validate the new model, which can be used as a reliable and standard model in many different permeability analysis studies.

Author Contributions

Conceptualization, M.Ş.Ö., M.E.I. and M.T.; methodology, M.Ş.Ö., M.E.I. and M.T.; software, M.E.I., S.S. and M.T.; validation, M.Ş.Ö.; formal analysis, M.Ş.Ö., M.E.I., S.S., S.A. and M.T.; investigation, M.E.I., S.S., S.A. and M.T.; resources, M.Ş.Ö. and S.A.; data curation, M.Ş.Ö. and S.A.; writing—original draft preparation, M.Ş.Ö., M.E.I., S.S., S.A. and M.T.; writing—review and editing, M.Ş.Ö., M.E.I., S.S., S.A. and M.T.; visualization, M.Ş.Ö., M.E.I., S.S., S.A. and M.T.; supervision, M.Ş.Ö.; project administration, M.Ş.Ö.; funding acquisition, M.Ş.Ö. All authors have read and agreed to the published version of the manuscript.

Funding

This research is funded by the Research Fund of Yıldız Technical University, grant number FBA-2017-3158.

Institutional Review Board Statement

Not applicable.

Informed Consent Statement

Not applicable.

Conflicts of Interest

The authors declare no conflict of interest.

References

  1. Vaverková, M.D.; Elbl, J.; Koda, E.; Adamcová, D.; Bilgin, A.; Lukas, V.; Podlasek, A.; Kintl, A.; Wdowska, M.; Brtnický, M.; et al. Chemical composition and hazardous effects of leachate from the active municipal solid waste landfill surrounded by farmlands. Sustainability 2020, 12, 4531. [Google Scholar] [CrossRef]
  2. Adhikari, B.; Dahal, K.R.; Khanal, S.N. A review of factors affecting the composition of municipal solid waste landfill leachate. Int. J. Eng. Sci. Innov. Technol. 2014, 3, 272–281. [Google Scholar]
  3. Zakaria, S.N.F.; Aziz, H.A. Characteristic of leachate at Alor Pongsu Landfill Site, Perak, Malaysia: A comparative study. In IOP Conference Series: Earth and Environmental Science; IOP Publishing: Bristol, UK, 2018; Volume 140. [Google Scholar] [CrossRef] [Green Version]
  4. Scott, J.; Beydoun, D.; Amal, R.; Low, G.; Cattle, J. Landfill management, leachate generation, and leach testing of solid wastes in Australia and overseas. Crit. Rev. Environ. Sci. Technol. 2005, 35, 239–332. [Google Scholar] [CrossRef]
  5. Kjeldsen, P.; Barlaz, M.A.; Rooker, A.P.; Baun, A.; Ledin, A.; Christensen, T.H. Present and Long-Term Composition of MSW Landfill Leachate: A Review. Crit. Rev. Environ. Sci. Technol. 2002, 32, 297–336. [Google Scholar] [CrossRef]
  6. Çeçen, F.; Çakiroǧlu, D. Impact of landfill leachate on the co-treatment of domestic wastewater. Biotechnol. Lett. 2001, 23, 821–826. [Google Scholar] [CrossRef]
  7. Stefanakis, A.; Akratos, C.S.; Tsihrintzis, V.A. Chapter 7—Treatment of Special Wastewaters in VFCWs. In Vertical Flow Constructed Wetlands; Elsevier: Boston, MA, USA, 2014; pp. 145–164. [Google Scholar] [CrossRef]
  8. Ren, X.; Zhao, Y.; Deng, Q.; Kang, J.; Li, D.; Wang, D. A relation of hydraulic conductivity—void ratio for soils based on Kozeny-Carman equation. Eng. Geol. 2016, 213, 89–97. [Google Scholar] [CrossRef]
  9. Stepniewski, W.; Widomski, M.K.; Horn, R. Hydraulic conductivity and landfill construction. In Developments in Hydraulic Conductivity Research; Dikinya, O., Ed.; Intech: Rijeka, Croatia, 2011; pp. 249–270. [Google Scholar] [CrossRef] [Green Version]
  10. Jo, H.Y.; Benson, C.H.; Edil, T.B. Hydraulic conductivity and cation exchange in non-prehydrated and prehydrated bentonite permeated with weak inorganic salt solutions. Clays Clay Miner. 2004, 52, 661–679. [Google Scholar] [CrossRef]
  11. Setz, M.C.; Tian, K.; Benson, C.H.; Bradshaw, S.L. Effect of ammonium on the hydraulic conductivity of geosynthetic clay liners. Geotext. Geomembr. 2017, 45, 665–673. [Google Scholar] [CrossRef]
  12. Xue, Q.; Zhang, Q.; Liu, L. Impact of high concentration solutions on hydraulic properties: Of geosynthetic clay liner materials. Materials 2012, 5, 2326–2341. [Google Scholar] [CrossRef]
  13. Mishra, A.K.; Ohtsubo, M.; Li, L.Y.; Higashi, T.; Park, J. Effect of salt of various concentrations on liquid limit, and hydraulic conductivity of different soil-bentonite mixtures. Environ. Geol. 2009, 57, 1145–1153. [Google Scholar] [CrossRef]
  14. Mosavat, N.; Nalbantoglu, Z. The impact of hazardous waste leachate on performance of clay liners. Waste Manag. Res. 2013, 31, 194–202. [Google Scholar] [CrossRef]
  15. Wang, S.; Zhu, W.; Xu, H.; Shu, S.; Fan, X. Effects of Leachate Concentration (Na+, Pb2+, COD) on Non-Darcy Flow of Compacted Clay; Springer: Singapore, 2019. [Google Scholar]
  16. Soon, N.W.; Lee, L.M.; Khun, T.C.; Ling, H.S. Factors Affecting Improvement in Engineering Properties of Residual Soil through Microbial-Induced Calcite Precipitation. J. Geotech. Geoenviron. Eng. 2014, 140, 04014006. [Google Scholar] [CrossRef]
  17. Viviani, G.; Iovino, M. Wastewater Reuse Effects on Soil Hydraulic Conductivity. J. Irrig. Drain. Eng. 2004, 130, 476–484. [Google Scholar] [CrossRef]
  18. Anandarajah, A. Mechanism Controlling Permeability Change in Clays due to Changes in Pore Fluid. J. Geotech. Geoenviron. Eng. 2004, 130, 450. [Google Scholar] [CrossRef]
  19. Emmanuel, E.; Anggraini, V.; Asadi, A.; Raghunandan, M.E. Interaction of landfill leachate with olivine-treated marine clay: Suitability for bottom liner application. Environ. Technol. Innov. 2020, 17, 100574. [Google Scholar] [CrossRef]
  20. Shackelford, C.D.; Benson, C.H.; Katsumi, T.; Edil, T.B.; Lin, L. Evaluating the hydraulic conductivity of GCLs permeated with non-standard liquids. Geotext. Geomembr. 2000, 18, 133–161. [Google Scholar] [CrossRef]
  21. Visentin, C.; Zanella, P.; Kronhardt, B.K.; Trentin, A.W.d.S.; Braun, A.B.; Thomé, A. Use of geosynthetic clay liner as a waterproofing barrier in sanitary landfills. J. Urban Environ. Eng. 2019, 13, 115–124. [Google Scholar] [CrossRef]
  22. Mohammadi, M.; Niazian, M. Investigation of Nano-clay effect on geotechnical properties of rasht clay. Int. J. Adv. Sci. Tech. Res. 2013, 3, 37–46. [Google Scholar]
  23. Daraei, E.; Bayat, H.; Zamani, P.; Gregory, A.S. Long-term effect of magnesium and iron nanoparticles on solute transport in saturated condition. Arch. Agron. Soil Sci. 2021, 1–13. [Google Scholar] [CrossRef]
  24. Ahmadi, H.; Shafiee, O. Experimental comparative study on the performance of nano-SiO2 and microsilica in stabilization of clay. Eur. Phys. J. Plus 2019, 134, 1–14. [Google Scholar] [CrossRef]
  25. Naval, S.; Chandan, K.; Sharma, D. Swelling Behaviour of Kaolinite Clay using Nanomaterials. In Proceedings of the International Conference on Sustainable Civil Engineering Practices, Chandigarh, India, 2–3 March 2017. [Google Scholar]
  26. Cheng, G.; Zhu, H.H.; Wen, Y.N.; Shi, B.; Gao, L. Experimental investigation of consolidation properties of nano-bentonite mixed clayey soil. Sustainability 2020, 12, 459. [Google Scholar] [CrossRef] [Green Version]
  27. Taipodia, J.; Dutta, J.; Dey, A. Effect of nano particles on properties of soil. In Proceedings of the Indian Geotechnical Conference, Kochi, India, 15–17 December 2011; pp. 105–108. [Google Scholar]
  28. Ng, C.W.W.; Coo, J.L. Hydraulic conductivity of clay mixed with nanomaterials. Can. Geotech. J. 2015, 52, 808–811. [Google Scholar] [CrossRef]
  29. Taha, M.R.; Alsharef, J.M.A. Performance of soil stabilized with carbon nanomaterials. Chem. Eng. Trans. 2018, 63, 757–762. [Google Scholar] [CrossRef]
  30. Bahmani, S.H.; Huat, B.B.K.; Asadi, A.; Farzadnia, N. Stabilization of residual soil using SiO2 nanoparticles and cement. Constr. Build. Mater. 2014, 64, 350–359. [Google Scholar] [CrossRef]
  31. Ahangar-Asr, A.; Faramarzi, A.; Mottaghifard, N.; Javadi, A.A. Modeling of permeability and compaction characteristics of soils using evolutionary polynomial regression. Comput. Geosci. 2011, 37, 1860–1869. [Google Scholar] [CrossRef]
  32. Boroumand, A.; Baziar, M.H. Determination of Compacted Clay Permeability By Artificial Neural Networks. In Proceedings of the Ninth International Water Technology Conference, IWTC9 2005, Sharm El-Sheik, Egypt, 1 January 2005; pp. 515–526. [Google Scholar]
  33. Günaydın, O.; Özbeyaz, A.; Söylemez, M. Regression Analysis of Soil Compaction Parameters Using Support Vector Method. Celal Bayar Üniversitesi Fen Bilimleri Derg. 2018, 14, 443–447. [Google Scholar] [CrossRef]
  34. Özbeyaz, A.; Söylemez, M. Modeling compaction parameters using support vector and decision tree regression algorithms. Turk. J. Electr. Eng. Comput. Sci. 2020, 28, 3079–3093. [Google Scholar] [CrossRef]
  35. Singh, B.; Sihag, P.; Pandhiani, S.M.; Debnath, S.; Gautam, S. Estimation of permeability of soil using easy measured soil parameters: Assessing the artificial intelligence-based models. ISH J. Hydraul. Eng. 2021, 27, 38–48. [Google Scholar] [CrossRef]
  36. Sebastian, N.; Sindhu, A.R. Prediction of Permeability of Compacted Clay Liners. Int. J. Res. Eng. IT Soc. Sci. 2016, 6, 42–47. [Google Scholar]
  37. Santisukkasaem, U.; Olawuyi, F.; Oye, P.; Das, D.B. Artificial Neural Network (ANN) for Evaluating Permeability Decline in Permeable Reactive Barrier (PRB). Environ. Processes 2015, 2, 291–307. [Google Scholar] [CrossRef] [Green Version]
  38. Sinha, S.K.; Wang, M.C. Artificial neural network prediction models for soil compaction and permeability. Geotech. Geol. Eng. 2008, 26, 47–64. [Google Scholar] [CrossRef]
  39. Tizpa, P.; Jamshidi Chenari, R.; Karimpour Fard, M.; Lemos Machado, S. ANN prediction of some geotechnical properties of soil from their index parameters. Arab. J. Geosci. 2015, 8, 2911–2920. [Google Scholar] [CrossRef]
  40. Mahdi, F.M.; Holdich, R.G. Using statistical and artificial neural networks to predict the permeability of loosely packed granular materials. Sep. Sci. Technol. 2017, 52, 1–12. [Google Scholar] [CrossRef] [Green Version]
  41. Daniel, D.; Anderson, D.; Boynton, S. Fixed-Wall versus Flexible-Wall Permeameters; ASTM International: West Conshohoken, PA, USA, 1985; pp. 107–126. [Google Scholar]
  42. Ozcoban, M.S. Project Report: The Permeability Change of Nano Particulate Added Undisturbed Clay Soil; Scientific Research Projects, FBA-2017-3158; Yildiz Technical University: İstanbul, Turkey, 2019. [Google Scholar]
  43. Haykin, S. Neural Networks and Learning Machines, 3rd ed.; Prentice Hall: Hoboken, NJ, USA, 2009; Volumes 1–3. [Google Scholar]
  44. Montgomery, D.C.; Peck, E.A.; Vining, G.G. Introduction to linear Regression Analysis, 5th ed.; Wiley: Hoboken, NJ, USA, 2012. [Google Scholar]
  45. Iplikci, S. Controlling the experimental three-tank system via support vector machines. In International Conference on Adaptive and Natural Computing Algorithms; Lecture Notes in Computer Science (Including Subseries Lecture Notes in Artificial Intelligence and Lecture Notes in Bioinformatics); Springer Science+Business Media: Berlin, Germany, 2009; Volume 5495, pp. 391–400. [Google Scholar] [CrossRef]
  46. Gunn, S. Support Vector Machines for Classification and Regression; ISIS Technical Report; University of Southampton: Southampton, UK, 1998. [Google Scholar]
  47. Kananizadeh, N.; Ebadi, T.; Ehsan, S.; Khoshniat, S.A.; Khoshniat, A. Behavior of Nanoclay as an Additive in order to Reduce Kahrizak Landfill Clay Permeability. In Proceedings of the 2nd International Conference on Environmental Science and Technology, Belgrade, Serbia, 28 September–2 October 2011; Volume 6, pp. 26–28. [Google Scholar]
  48. Bhadra, S.M.; Leander, T. Effect of Fly Ash and Nano Calcium Silicates in Clayey Soil used as Clay Liner. Int. Res. J. Eng. Technol. 2020, 7, 2451–2455. [Google Scholar]
  49. Majeed, Z.H. A Review of Stabilization of Soils by using Nanomaterials. Aust. J. Basic Appl. Sci. 2013, 7, 576–581. [Google Scholar]
Figure 1. Schematic view of the experimental setup [42].
Applsci 12 00186 g001
Figure 2. ANN structure.
Applsci 12 00186 g002
Figure 3. Water content and dry unit weight relation [40].
Applsci 12 00186 g003
Figure 4. Normalized FR analysis for different types of kaolin clay samples.
Applsci 12 00186 g004
Figure 5. Graph of actual and regression normalized FR values (kaolin).
Applsci 12 00186 g005
Figure 6. Graph of actual and regression normalized FR values (kaolin 4% Fe).
Applsci 12 00186 g006
Figure 7. Graph of actual and regression normalized FR values (kaolin 4% Al).
Applsci 12 00186 g007
Table 1. Mass flow rate values of different clay samples.
Min 1Max 1Mean 1Standard Deviation 1
Kaolin0 (No flow)35.331.596.10
Kaolin (2% Fe)0 (No flow)3.770.510.71
Kaolin (4% Fe)0 (No flow)174.006.4630.18
Kaolin (2% Al)0 (No flow)292.009.4050.76
Kaolin (4% Al)0 (No flow)65.382.1811.36
1 (10−5 g/s).
Table 2. Flow density values.
Min 1Max 1Mean 1Standard Deviation 1
27.27213272.7234106.2546688.41
1 (10−5 g/s).
Table 3. Time to reach maximum FR of clay samples with and without nanomaterial additives.
Time (Day)Permeability (cm/s)
Kaolin1392.350 × 10−8
Kaolin + 2% Fe743.338 × 10−9
Kaolin + 4% Fe422.209 × 10−9
Kaolin + 2% Al391.503 × 10−9
Kaolin + 4% Al111.430 ×10−9
Table 4. Average correlation (ρ) measurements between FR and leachate parameters of clay soil samples.
ρ KaolinKaolin
(2% Fe)
Kaolin
(4% Fe)
Kaolin
(2% Al)
Kaolin
(4% Al)
COD−0.639−0.769−0.839−0.639−0.769
TKN−0.922−0.947−0.895−0.923−0.947
TP−0.948−0.946−0.932−0.948−0.946
Table 5. SVM regression similarity measurements of FR using parameters of clay soil samples.
KaolinKaolin
(2% Fe)
Kaolin
(4% Fe)
Kaolin
(2% Al)
Kaolin
(4% Al)
1 RMSE 0.9420.9310.9180.9120.811
R 2 0.9700.9700.9600.9300.450
MSE 0.0030.0050.0070.0080.036
Table 6. ANN regression similarity measurements of FR using leachate parameters of clay soil samples.
KaolinKaolin
(2% Fe)
Kaolin
(4% Fe)
Kaolin
(2% Al)
Kaolin
(4% Al)
1 RMSE 0.9030.8620.8580.8230.792
R 2 0.9000.8700.8700.7100.350
MSE 0.0090.0190.0200.0310.043
Table 7. MLR regression similarity measurements of FR using leachate parameters of different clay soil samples.
KaolinKaolin
(2% Fe)
Kaolin
(4% Fe)
Kaolin
(2% Al)
Kaolin
(4% Al)
1 RMSE 0.9500.8720.8570.8610.787
R 2 0.9800.9000.8700.8200.320
MSE 0.0020.0160.0200.0190.045
Publisher’s Note: MDPI stays neutral with regard to jurisdictional claims in published maps and institutional affiliations.

