Abstract
The objective of this study was to investigate the dynamics of the urinary collagen type II C-terminal cleavage neoepitope (uC2C) before and after total knee replacement (TKR) in rapid knee OA progressors. C2C in the urine was measured by IBEX-uC2C assay in 86 patients (mean age: 59.9 years) with symptomatic knee OA (kOA) undergoing TKR, assessed before surgery and 3 and 12 months after. The patients’ condition was determined by self-assessment questionnaires, by lower limb performance tests, and by radiography. In the preoperative period, the uC2C level was significantly higher in females than in males, and was associated with the radiographic severity of kOA. A weak correlation between the C2C and knee pain was observed in the whole group and in males, but not in females. The individual dynamics of uC2C after TKR were heterogenic. In general, uC2C increased three months after TKR, but fell to the preoperative level after 12 months. A higher preoperative uC2C implied the tendency to diminish as a result of TKR, and vice versa. TKR did not stop the degradation of Coll2 in the tissues in the majority of cases. The pre-TKR uC2C predicts the postoperative uC2C level. The uC2C dynamic seems to be sex-specific, so it could be considered a prospective pre- and post-TKR biomarker for progressive kOA.
1. Introduction
Studies over the past two decades have enriched us with a wealth of important information about knee osteoarthritis (kOA), including the surprising heterogeneity of the disease [1]. kOA is a highly prevalent, disabling, whole-joint disorder that has doubled in prevalence since the mid-20th century, mainly due to obesity and the aging of the population [2,3]. However, other factors—such as diet, dysbiosis, physical inactivity, and metabolism—have also contributed to the marked increase. Women are more affected than men. The multifactorial nature of kOA and the complexity of the disease mechanism determine variability in the manifestation of the disease. Different phenotypes have been recognized, and different definitions have been proposed [4,5]. The presence of many subtypes has thus far hampered the discovery of disease-modifying therapies [6,7]. Longitudinal studies have shown that, of all cases of kOA, the disease progresses in only a minority [8,9], and OA progression is not a continuous but a phased process [10,11,12]. As noted in the previous studies, around one in seven cases progress continuously, thus reaching the final stage at an accelerated rate [12,13]. Clinically, patients in middle age (<65 years of age) undergoing total knee replacement (TKR) surgery due to OA are unequivocally recognized as rapidly progressive cases of the disease [14,15].
Dozens of biochemical markers have been proposed as candidate prognostic markers of the quick progression of kOA [16,17,18]. However, because cartilage degradation is a key feature of OA’s pathogenesis, particular attention has been paid to molecules originating from cartilage. Recently, the FNIH OA Biomarkers Consortium compared the prognostic values of eight selected biomarkers, carefully adjusted for possible confounding factors; two of them—urinary C-terminal telopeptide of type II collagen (uCTXII), and urinary collagen type II C-terminal cleavage neoepitope (uC2C)—predicted the progression of kOA a little better than other markers [19]. Recently, we reported that urinary collagenase-generated C2C neoepitope fragments of human collagen type II (Coll2) have good prognostic value, and are therefore promising prospective integrative characteristics of different tissues of the knee—especially in females [20].
TKR is considered to be a reflection of joint failure, and is the most common joint arthroplasty procedure worldwide [21]. TKR has been proposed as the clinical endpoint for the estimation of disease-modifying OA drugs (DMOADs), e.g., inhibitors of Wnt/β-catenin signaling (SM04690), inhibitors of aggrecanases (GLPG1972/S201086) and cathepsin K (MIV-711), or fibroblast growth factor-18 (sprifermin) [22,23]. The determination of a biomarker at this stage of the disease could also serve as a model for elucidating the potential of the marker in question—in the best case, both before and after the TKR. The knowledge of levels of biomarkers is therefore important for the description of the stage of the disease. Despite excellent outcomes, some studies have reported dissatisfaction with the outcome of TKR in up to 20% of patients [24,25]. Moreover, the dynamics of the biomarkers after TKR are also necessary for a comparison of the treatment’s effect if DMOADs are to be used instead of or in addition to TKR. In view of these important aspects, it is astonishing that the time course of OA biomarkers after the total joint replacement has never been analyzed systematically, and the few results obtained have been divergent [10,26,27,28]. Sharif et al. [10], in a long-term study, discovered a rise in serum cartilage oligomeric matrix protein (COMP) after TKR. However, Deberg et al. [27] described the normalization of the levels of a denaturation epitope of collagen II (Coll2-1) three months after surgery; however, levels of its nitrated form—Coll2-1NO2—remained elevated; the authors concluded that Coll2-1 was a sensitive and disease-specific marker of the structural changes occurring in a single joint [27].
Considering the above problems, the present study aimed to elucidate the following:
- (1)
- Whether uC2C values were elevated in patients scheduled for TKR surgery;
- (2)
- How the surgical intervention affected uC2C values;
- (3)
- How uC2C values were related to radiographic and clinical parameters before and after TKR;
- (4)
- Whether there were gender differences in the dynamics of uC2C values.
2. Materials and Methods
2.1. Subjects
We carried out a prospective cohort study of 86 patients (mean age ± SD: 59.9 ± 4.7 years) undergoing primary unilateral TKR before age 70 due to end-stage kOA (Kellgren–Lawrence system (KL) grade 3–4). TKR was performed between January 2017 and October 2019 at the Department of Orthopedics, Tartu University Hospital, Estonia.
Relevant demographic and clinical data (Table 1), including urine samples, were collected at three timepoints: 1–2 days before the operation, 3 months, and 12 monthsafter the operation.

Table 1.
Clinical characteristics of the study cohort by timepoints.
The clinical status of kOA patients was established by patients’ self-assessment using KOOS and SF-36 questionnaires and a visual analog scale for pain (VAS Pain), along with performance tests, radiographic examination of knees, and a description of the knee joint by the surgeon at the time of surgery. Patients who had signs of acute infections in the previous three months were excluded. Other exclusion criteria were evidence of secondary OA, such as trauma, gout, infection, or congenital and developmental disorders affecting the knee joints. Descriptions of study groups and the availability of clinical materials are presented in Figure A1.
The Research Ethics Committee of the University of Tartu approved the study (protocol 265/T-22, 19 December 2016), which was conducted according to the precepts of the Declaration of Helsinki. Subjects provided written informed consent before participation.
2.2. uC2C Measurement
The study subjects were instructed to collect urine from the second morning void in order to reduce the influence of diurnal variation in uC2C [29]. Urine samples were stored at −80 °C on the day of collection. Urinary levels of collagenase-generated C2C neoepitope fragments of human Coll2 were measured by IBEX C2C human urine sandwich assay (IB-C2C-HUSA, (IBEX Pharmaceuticals Inc., Montreal, QC, Canada), according to the manufacturer’s recommendations (Poole et al. [30] and https://www.ibex.ca/product-catalog/, accessed on 1 July 2020). All of the samples from each subject were tested in duplicate and in the same run. Each measured C2C concentration was corrected with the creatinine concentration in the same urine sample, determined using Cobas® Creatinine plus ver.2 (CREP2) kits (08057524190; Roche Diagnostics, Indianapolis, IN, USA) in a Roche Cobas c501 Analyzer.
2.3. Radiographic Evaluation of Knees
Anteroposterior standing full-leg X-rays were taken from the full-extension knee. The source-to-image distance (SID) was 3 m. X-ray exposure parameters were dependent on the patient’s limb size and tissue characteristics, and were modified digitally. Three radiographs of the limb were taken at different levels and digitally fused by the software; of those radiographs, knee X-rays (tibiofemoral joints) were assessed in the present study for kOA features. In 62 out of 86 patients, additional axial views of the patellofemoral (PF) joints were obtained with the subject in a standing position, with knee joints at 60° of flexion, according to the technique described by Boegard et al. [31].
Two radiologists independently graded the knee OA (kOA) severity using two grading systems—the Nottingham system (grades 0–3), and the KL system (grades 0–4)—for the classification of kOA [32,33]. For the Nottingham system (NSy), joint space narrowing (JSN) and osteophyte (OF) size were classified on a 4-point scale (grades 0–3). The highest grade of OA changes (OF and/or JSN) among all knee compartments was expressed as the radiographic global grade of kOA (gOA). Any differences in scoring were resolved by a consensus reading between two radiologists.
2.4. Visual Analog Scale for Pain (VAS Pain) in Joints in Different Skeletal Areas
The visual analog scale for pain is self-completed by the respondent. The respondent is asked to place a line perpendicular to the VAS line at the point that represents their pain intensity at a 100 mm scale on paper. The drawings were measured and transposed to a 0–10 pain score (0 = no pain; 10 = worst imaginable pain). Fourteen joints (skeletal areas) were assessed: right and left hand (wrist, metacarpal, and finger joints included), right and left elbow, right and left shoulder, right and left ankle, right and left knee, right and left hip, and upper (head, neck, and thorax) and lower (lumbar spine) back. A summary VAS pain score (sumVAS) was calculated as the sum of all VAS scores of assessed joints. The number of noticeably involved joints was expressed as sumJoint (VAS scores > 5 were evaluated as noticeable involvement of a joint).
2.5. Total Knee Replacement
During the operation, orthopedic surgeons performed direct visual assessment and reporting of knee articular cartilage status (location, depth, and extent) and the presence of osteophytes and synovitis [34]. The implants were inserted through a standard medial parapatellar approach, and cemented prostheses were used. The patella was left un-resurfaced, with only its osteophytes resected. Hoffa’s fat pad was also resected. We removed the synovial tissue around the margins of the patella. Following eversion of the patella and before removal of the osteophytes, the operating surgeon evaluated the macroscopic impairment of cartilage according to the original Outerbridge classification [35,36]: grade 1, softening and swelling of the cartilage; grade 2, fragmentation and fissuring in an area of 13 mm or less in diameter; grade 3, fragmentation and fissuring in an area of more than 13 mm in diameter; grade 4, erosion of cartilage down to the bone. Findings were recorded on the study sheet.
2.6. The Knee Injury and Osteoarthritis Outcome Score (KOOS)
The Estonian version of the KOOS questionnaire was used (www.koos.nu, accessed on 15 September 2021). The KOOS’s five patient-relevant subscales were scored and analyzed separately: symptoms (7 items); pain (9 items); ADL function (17 items); sport and recreation function (5 items), and quality of life (4 items). A Likert scale was used; all items had five possible answer options scored from 0 (no problems) to 4 (extreme problems). The scores were transformed to a 0–100 scale, with 0 representing extreme knee problems and 100 representing no knee problems.
The change in KOOS after one year from the TKR was calculated by subtracting the preoperative score from the postoperative score. To evaluate the substantial clinical benefit (SCB) of KOOS, defined as changing by more than ±20 units, we divided patients into SCB subgroups: worsening, no change, and improvement [37,38].
2.7. RAND 36-Item Short-Form Survey
The RAND 36-Item Short-Form Survey (SF-36) is a widely used measure of general health status that comprises eight subscales: physical functioning (SF36PF), role limitations due to physical health (SF36RP), role limitations due to emotional problems (SF36RE), energy/fatigue (SF-36VT), emotional wellbeing (SF36MH), social functioning (SF36SF), pain (SF36BP), and general health (SF36GH) [39]. The SF-36 is self-explanatory and is scored from 0 to 100, with 0 indicating extreme problems and 100 indicating no problems.
2.8. Lower Limb and Knee Performance Tests
Simple standardized tests were used, some of which differed slightly from later published recommendations available on the OARSI website (http://oarsi.org/research/physical-performance-measures, accessed on 15 October 2021). These tests included (1) the Timed Up and Go test (TUG) (time, s); (2) a 30 s chair stand test (30sCST) (number of repetitions); (3) a 30 m fast-paced walk test (30mFPWT) (time, s); and (4) the original chair test (Test-Chair), which was used to assess patients’ ability to rise from the lowest chair (cm from the floor). The corresponding heights were added or decreased in 5 cm increments.
2.9. Statistical Analysis
The data were analyzed using R software (version 4.0.5; Free Software Foundation, Boston, MA, USA; http://www.r-project.org, accessed on 20 July 2021) and GraphPad Prism 8 (GraphPad Software, San Diego, CA, USA). Subjects’ demographic data and body mass indices (BMIs) were summarized as means with standard deviations and analyzed with parametric tests (e.g., chi-squared test, t-test). As uC2C concentration subscale values of KOOS and SF-36 were not distributed normally (checked by Shapiro–Wilk test), nonparametric paired-samples tests (e.g., Wilcoxon signed-rank test) were used for comparing the pre- and postoperative values of the biomarker and clinical parameters. p-Values < 0.05 were considered to be significant.
To assess the association of clinical improvement of kOA and uC2C concentration in the pre-TKR period, generalized linear models (GLMs) were used. As several confounders may influence the course of kOA, we adjusted the models for age, sex, and BMI (odds ratios (OR of double the increase in uC2C) and 95% confidence intervals (CI 95%) were presented).
3. Results
3.1. The Clinical Characteristics of the Study Cohort in the Preoperative Period
The study group consisted of 86 patients who needed TKR due to end-stage kOA before age 70. The mean age of the patients was 59.9 (age range 46–68) years, and exactly half (n = 43) of the subjects were females. We demonstrated that most of the patients (69%; 59 out of 86) were obese (Table 1); their BMI range was 24.2–41.4 kg/m2. The mean age of sexes did not differ, but the BMI was slightly higher in females (mean BMI: 33.1 vs. 31.5 kg/m2 for males; p = 0.07, t-test).
Most of the patients (95%; 82 out of 86) had a severe radiological grade of kOA (grade 3/4 by KL), but some less severe cases (KL grade 2, n = 4) were also present (Table 1). In general, we demonstrated that a radiographic KL grade of 3/4 corresponded to NSy grade 3 (Table A1).
Surgery (TKR) on the opposite knee had previously been performed on 20 out of 86 (23%) subjects. Previous knee replacement was more frequent in females (13 cases out of 43; 30%) compared to males (7 out of 43; 16%); however, the difference did not reach statistical significance.
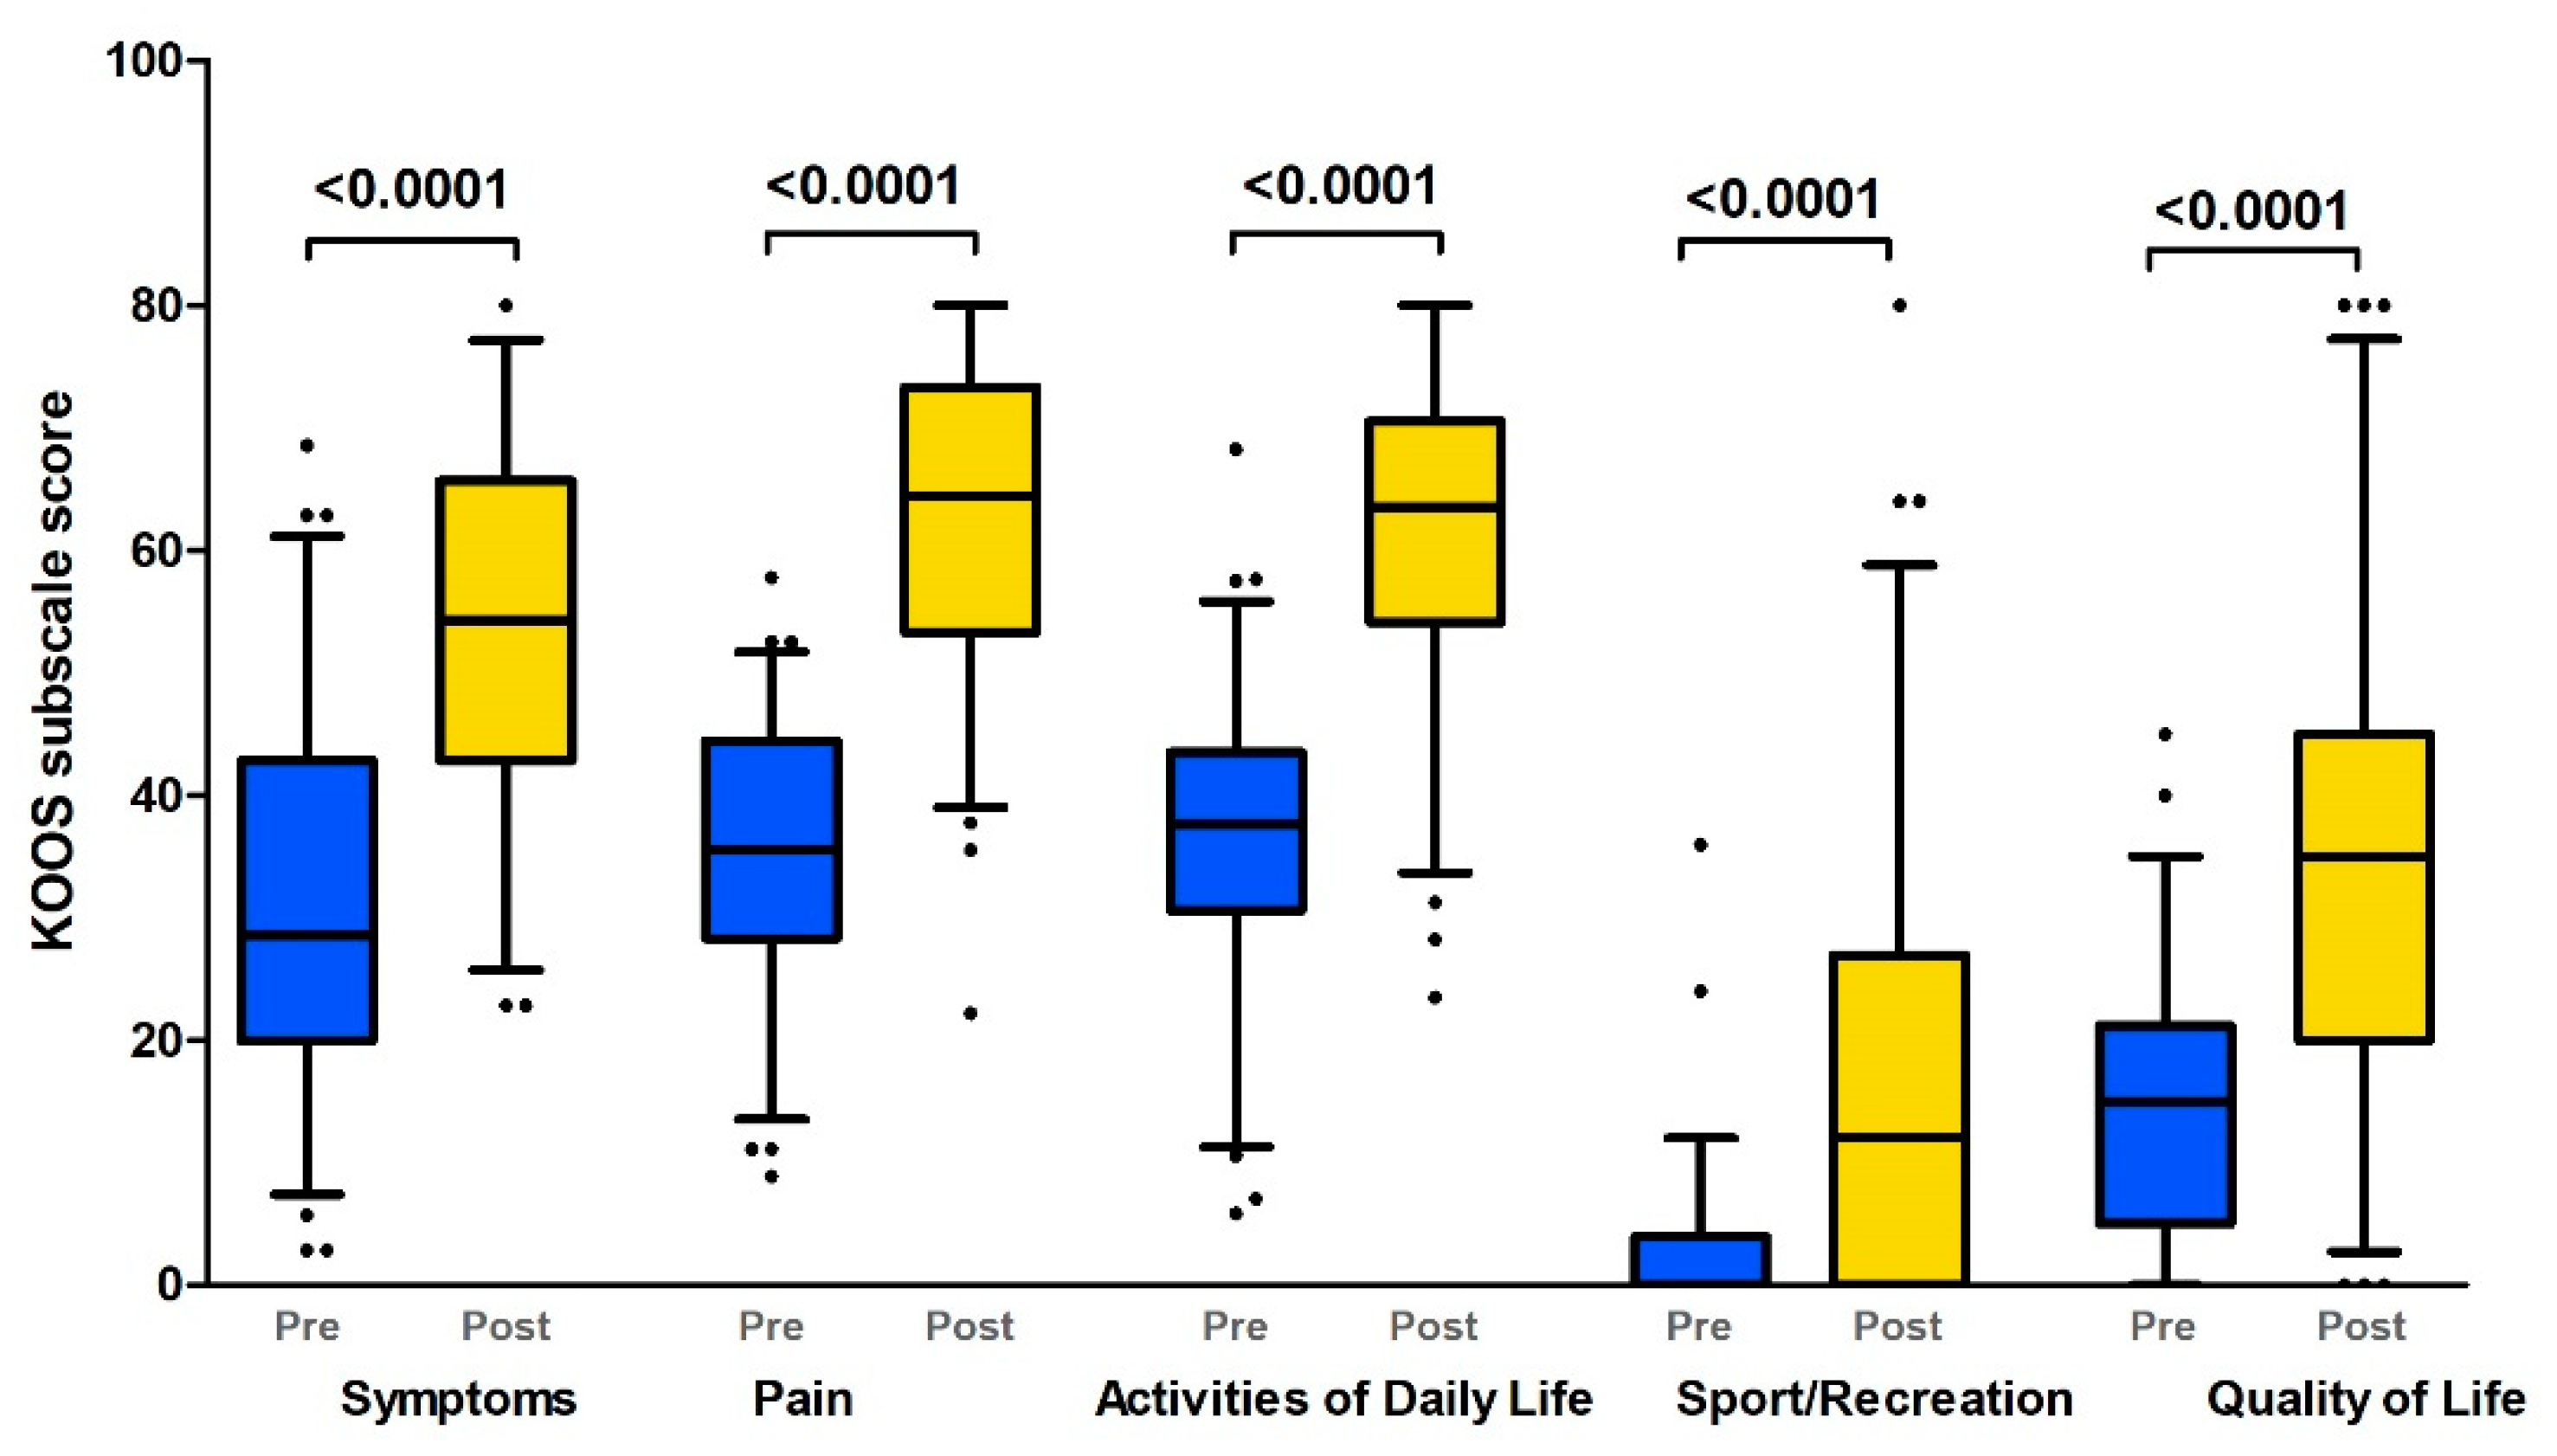
The evaluation of the self-reported instruments revealed that most of the patients had severe subjective complaints and a decrease in their quality of life in the preoperative period. We demonstrated a serious decrease in all KOOS subscales (median score < 35), but the sport and recreation subscale was the most severely affected (Figure 1, Table 2).
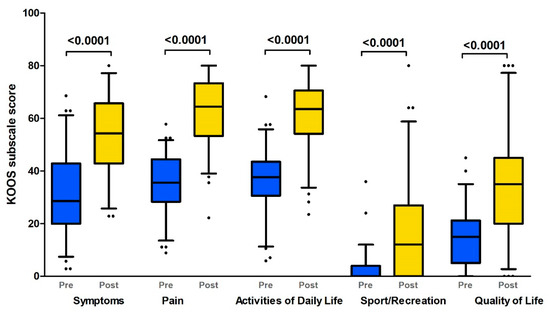
Figure 1.
KOOS profiles prior to and 12 months after TKR (Boxplot with 10th–90th percentiles). KOOS subscales: pain; symptoms; activities of daily living; sport and recreation; quality of life (Wilcoxon paired test p-values). Pre: preoperative status; Post: postoperative (1 year after TKR) status.

Table 2.
uC2C, KOOS, SF-36, and lower limb performance test results in the pre- and postoperative periods.
These knee problems added up to a serious decline in the quality-of-life subscale (median score: 15% of maximum). SF-36 results also demonstrated a serious decline in quality-of-life aspects before the operation (Table 2). Pain and physical functioning subscales (SF36RP, SF36PF, and SF36BP) were the most affected (median score < 25). At the same time, the mental and general health subscales of SF-36 had relatively high values (median scores of 40 for SF36MH and 55 for SF36GH). It should be noted that large intragroup variability in terms of emotional problems (SF36RE) and social functioning (SF36SF) was demonstrated (Figure A2).
In addition to subjective complaints, we also assessed the objective function of the lower limbs in the preoperative period (Table 2). We demonstrated that walking speed assessed by 30mFPWT dropped in the majority of kOA patients (less than 1.3 m/s in 78% of patients). Almost the same proportion of patients demonstrated problems with getting up from a chair (TUG > 10 s in 76%; 30sCST < 10 times in 83%).
3.2. uC2C Levels in the pre-TKR Period and Biomarker Associations with Clinical and Radiographic Parameters
We demonstrated that the uC2C level was statistically significantly higher in females compared to males (p = 0.0039, Wilcoxon test) in the preoperative period. Moreover, a gradual increase in uC2C level was associated with the radiographic severity of kOA (Table A2), but this was demonstrated only in females (p = 0.016 for NS2 vs. NS3; Figure 2). In males, uC2C seemed unrelated to the radiographic progression of end-stage kOA.

Figure 2.
The association of uC2C levels with the radiological severity of kOA in the preoperative period in (A) the whole group, (B) males, and (C) females (boxplot with 10th–90th percentiles, Wilcoxon paired test). KL—grades of radiographic knee osteoarthritis by the Kellgren–Lawrence scoring system; NS—the highest grade of knee OA changes in two knee joint compartments (tibiofemoral and/or patella–femoral joints) by the Nottingham system (NSy).
Evaluation of the associations between uC2C levels and subjective complaints demonstrated that higher levels of uC2C were weakly correlated with the increase in knee VAS pain. The correlation was clearly seen in the whole group (Spearman’s rho = −0.31, p = 0.006, for KOOSpain) and in males (Spearman’s rho = −0.33, p = 0.04), but absent in females (Table A3). Moreover, higher levels of uC2C were weakly correlated with lower social functioning (SF36SF) in females only (Spearman’s rho = −0.38, p = 0.02, for females). However, we demonstrated no correlation between functional tests and uC2C concentration.
Notably, we demonstrated no association between uC2C and the summary pain scores of other joints (sumVAS pain) or the status of previous TKR of the opposite knee. However, we demonstrated a tendency of higher uC2C in females with bilateral kOA compared to unilateral cases (Figure A3).
3.3. The Dynamics of uC2C Levels after TKR
A change in uC2C concentration over 12 months was shown in Figure 3. Although the median value of uC2C was significantly increased for three months after the TKR compared to the preoperative value (p = 0.012, Wilcoxon paired test; Table 2), the median uC2C fell to the preoperative level after 12 months. This dynamic applied to men, whereas in females the uC2C was lower a year after surgery compared to preoperative levels (Figure 3).

Figure 3.
The dynamics of uC2C before and 3 or 12 months after TKR in (A) the whole group, (B) males, and (C) females (boxplot with 10th–90th percentiles, Wilcoxon paired test).
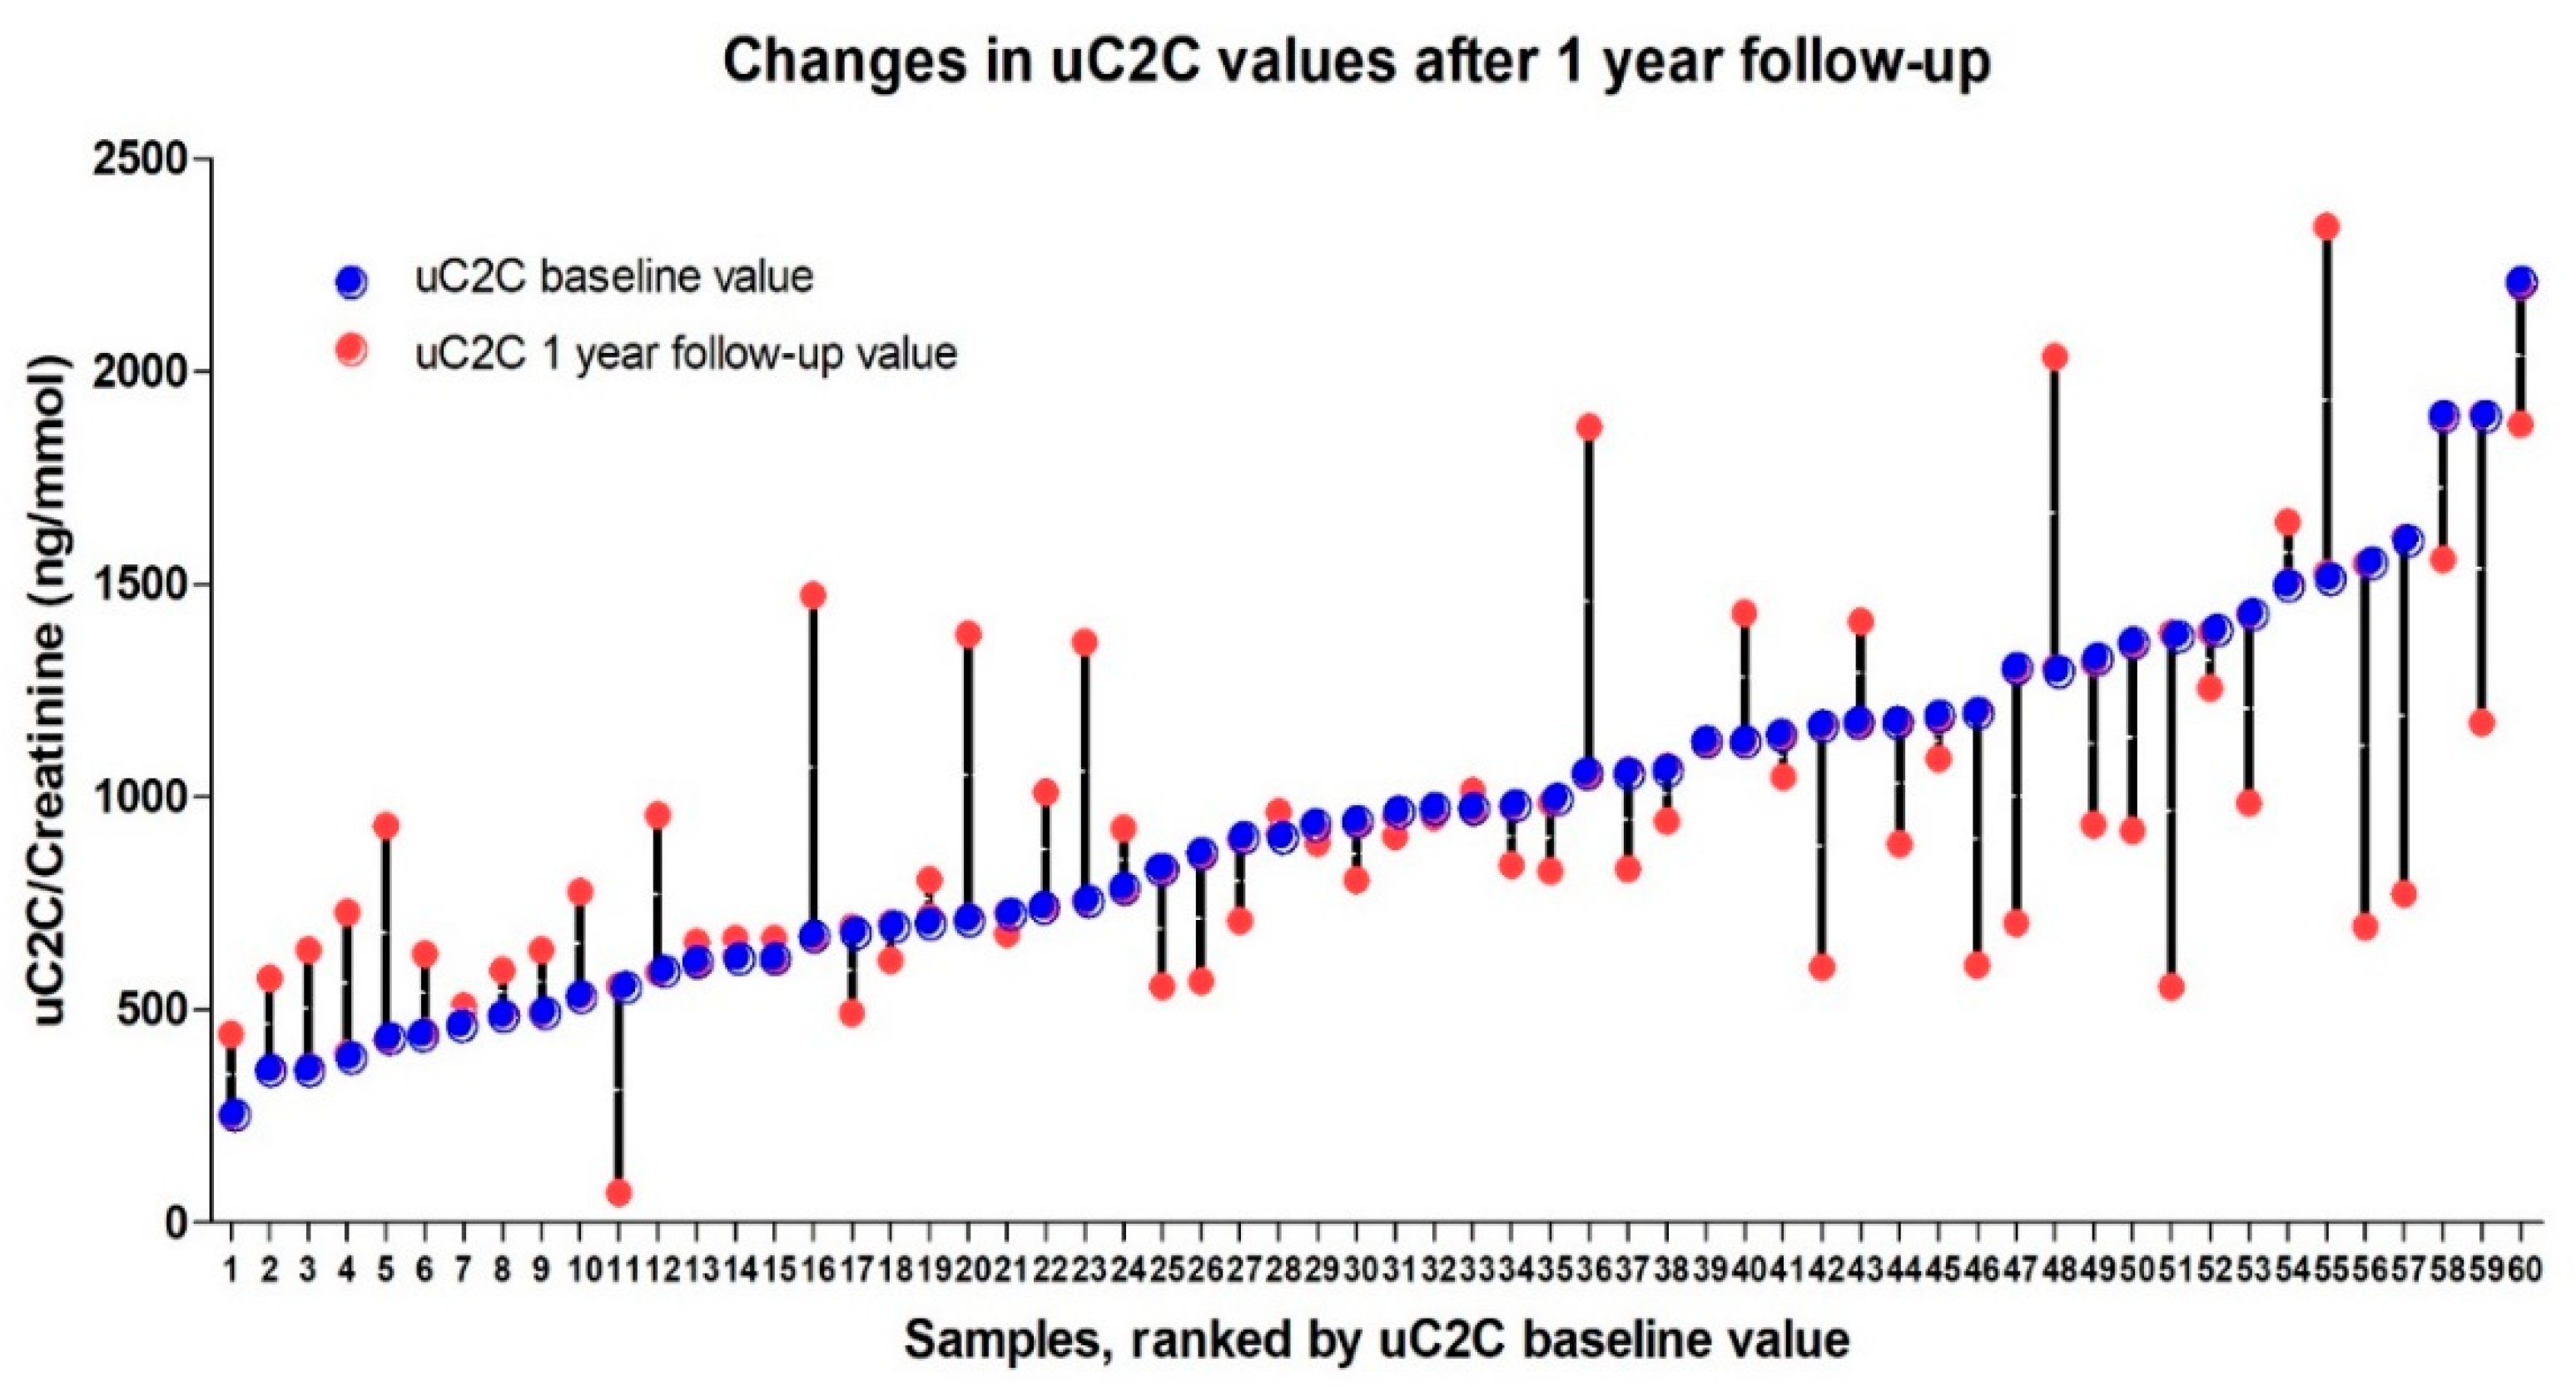
The individual dynamics of uC2C over the course of the year ranged from an 87% decrease to a 120% increase in uC2C levels (Figure 4). We also found that the significant (20%) increase in post-TKR concentration of uC2C was obvious in patients with lower baseline (preoperative) levels of uC2C (16 out of the first 30 ranked cases). Conversely, we found a remarkable number of cases (12 out of the last 29 ranked cases) with a significant decrease in the post-TKR period among those with a higher baseline value of uC2C.
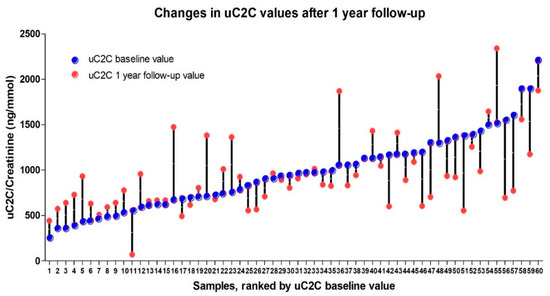
Figure 4.
The individual dynamics of uC2C values (pre-TKR and 12 months after TKR) ranked by baseline uC2C value.
Taking a 20% change in the biomarker as the basis for grouping, we demonstrated that 28% of patients (17 out of 60) were “descenders”, 32% were “ascenders” (19 out of 60), and the remaining 40% belonged to the “stable” group. We demonstrated a statistically significant difference between the uC2C values of “ascenders” and “descenders” both pre-TKR and 12 months after TKR (p = 0.00022 and p = 0.021, respectively, Wilcoxon test; Figure 5). We found the same statistically significant difference between “ascenders” and “descenders” in males (p = 0.019 for pre-TKR and p = 0.035 for one year post-TKR, Wilcoxon test; Figure 5C), but not in females (p = 0.10 for pre-TKR and p = 0.053 for one year post-TKR, Wilcoxon test; Figure 5B). However, the subgroups did not differ in uC2C levels at the three-month postoperative timepoint.

Figure 5.
Line plot of uC2C dynamics in (A) the whole group, (B) males, and (C) females, grouped by postoperative uC2C changes (decrease or increase means a > 20% decrease (green) or increase (red) in the 12-month post-TKR uC2C/Crea value compared to the preoperative one; mean and SEM shown).
In summary, although the median value of uC2C a year after the TKR was similar to the preoperative value, a variety of individual changes existed. The excretion of uC2C could decrease, increase, or remain constant. A higher baseline value of C2C implied a tendency to diminish as a result of TKR.
3.4. Association of UC2C Levels with Improvement of Subjective and Objective Limitations in the Postoperative Period
3.4.1. KOOS
We demonstrated significant improvements in all KOOS subscales one year after TKR in comparison with pre-TKR (p < 0.0001, Wilcoxon paired test; Figure 1). However, none of the scores of any subscale rose to the level of 85 (healthy). The limitations on the use of knee joints were more pronounced in more demanding activities such as squatting, kneeling, running, jumping, and twisting, as expressed by the function in sport and recreation subscale (Table 2).
To evaluate the substantial clinical benefit (SCB) change in KOOS, defined as changing by more than ±20 units, we divided patients into SCB subgroups: worsening, no change, or improvement (Table 3). We demonstrated that clinically significant worsening of KOOS was very rare (only one patient in our study). Approximately two-thirds of patients reported clinically significant improvements in the pain and the function in daily living subscales (70% vs. 30% and 65% vs. 35%, respectively; Table 3). However, improvement in the KOOS sp/recr subscale was in the minority compared to the no change subgroup (36% vs. 64%).

Table 3.
Substantial clinical benefit (SCB) in Knee Injury and Osteoarthritis Outcome Score (KOOS) subscales at 12-month follow-up after total knee replacement.
We demonstrated that the baseline (preoperative) uC2C level was statistically significantly higher in the improvement subgroup of KOOSsymp compared to the no change subgroup of the same subscale (Table 4; p = 0.01, Wilcoxon test). We found no statistically significant differences in uC2C levels in the SCB subgroups of other KOOS subscales.

Table 4.
Comparison of preoperative uC2C between SCB subgroups of KOOS subscales.
Using GLM models, we demonstrated that preoperative uC2C levels predicted clinically significant improvement in KOOSsymp in the whole group (OR = 2.79; CI 95% 1.19–6.53; Table A4), as well as in females (OR = 8.56; CI 95% 1.42–51.59). The predictive value of uC2C was missing in males. Moreover, we found no associations between uC2C and other KOOS subscales. We demonstrated that adjusting the model of KOOSsymp for well-known confounders (e.g., age, sex, and BMI) removed the statistical significance of the model for the whole group; however, it was still significant for females (adjusted OR = 9.43; CI 95% 1.19–74.73).
3.4.2. SF-36
We demonstrated significant improvements in physical and social functioning as well as in role limitations due to emotional problems as the result of TKR (p < 0.05 for SF36PF, SF36RP, SF36RE, and SF36SF, Wilcoxon paired test; Table 2). However, SF36RP remained relatively low (median 0) even one year after the operation. Moreover, several SF-36 subscales associated with emotional wellbeing, vitality, or pain (i.e., SF36VT, SF36MH, SF36BP) did not improve after TKR. It should be noted that the patients’ subjective assessment of their quality of life did not improve either.
We demonstrated that the dynamic of uC2C (pre-TKR vs. one year post-TKR) was weakly correlated with the changes in body pain (Spearman’s rho = 0.29, p = 0.025, for SF36BP), social functioning (Spearman’s rho = 0.30, p = 0.021, for SF36SF), and limitations due to emotional problems (Spearman’s rho = 0.29, p = 0.030, for SF36RE).
3.4.3. Lower Limb Performance Tests
We demonstrated significant improvement in only 30mFPWT 3 months after TKR; however, after 12 months, all functional tests demonstrated a statistically significant improvement (Table 2). A decrease in uC2C levels at 12 months compared to the pre-TKR levels was weakly correlated with an improved ability to rise from the lower chair (Spearman’s rho = 0.27, p = 0.038). The results of the other functional tests did not correlate with changes in uC2C levels.
4. Discussion
The present study is the first to present the dynamics of uC2C levels in subjects in pre- and post-TKR periods. Surprisingly, the uC2C level of the whole group rose three months after TKR, and then reverted to the baseline level. Unlike in men, there was a significant decrease in uC2C levels in women one year after TKR. Interestingly, the postoperative levels of uC2C remained higher than levels in subjects without kOA (in the long-term control group) or with early kOA [20,40].
The behavior of biomarkers after TKR has been studied relatively little—probably due to the understanding that the operation is the “end stage” of the OA. To our knowledge, four similar studies of the dynamics of cartilage biomarkers in serum (keratan sulfate, cartilage oligomeric matrix protein (COMP), and Coll2-derived fragments (Coll2–1 and Coll2–1NO2)) have been performed in subjects with TKR [10,26,27,28]. The first study found that, after a short preliminary decrease one week after TKR, keratan sulfate levels subsequently increased to be similar to preoperative levels after six months [26]. The second longitudinal study (Sharif et al.) demonstrated a substantial rise in serum COMP levels after TKR in all patients, persisting for up to 12 months following surgery [10]. Recently, Endres et al. showed a short reduction in COMP levels a week after total hip replacement, after which its levels returned to the preoperative baseline [28]. These results were unexpected for researchers at both centers, as a decrease in COMP levels was expected; they were forced to consider the possibility that COMP could originate from sources other than the operated joint alone. The first group assumed that there might be an increased production or degradation of COMP in the contralateral knee joint, or an increased release of COMP from other tissues—such as ligaments, tendons, and capsules—of the TKR joint. The researchers in the second group attributed the results to changes in physical activity: patients with relieved pain were much more mobile than before TKR. Compared to COMP, uC2C is a more specific marker of certain pathogenetic processes of kOA—especially the degradation of Coll2.
It should be noted that the reference values of the OA biomarkers were almost completely absent in published papers. Only Kraus et al. set up the references for several OA biomarkers, including uC2C–HUSA [41]. In the present study, almost all TKR patients had uC2C levels > 300 ng/mmol (only one patient had lower uC2C at baseline). Kraus et al. found no differences between the reference values of different sexes. Given the very high prevalence of OA with aging, lack of OA phenotyping could result in a reference “normal” population that can cause still-unsuitable reference values for the population—especially for older age groups.
Similarly, investigation of Coll2-derived fragments demonstrated that the pathogenic metabolism of Coll2 persisted after TKR [27]. Interestingly, in patients with preoperative values above the median, the biomarker of oxidative damage—Coll2–1NO2 levels—significantly and progressively decreased postoperatively, but tended to increase in patients with preoperative Coll2–1NO2 values below the median. Our results are consistent with the results of Deberg et al.: abnormal type II collagen degradation in the knee had a major influence on high preoperative Coll2–1 levels. It was proposed that the sustained level of Coll2 degradation markers after TKR was caused by persistent Coll2 degradation in different structures of a single joint, although the presence of OA lesions in other joints cannot be excluded. The opposite knee could be considered the most likely secondary source. We demonstrated a quite common involvement of both knees (in a quarter of cases); however, we found no associations between uC2C levels and previous history of TKR. Moreover, we were not able to prove an association between uC2C and the summary pain score of other joints. Of course, a more detailed investigation—not just of pain—is needed in order to measure the total body burden of OA [42]. Moreover, several authors have demonstrated that a rather large proportion of kOA patients may have a generalized joint disease [43,44].
However, we found that the individual dynamics of uC2C levels were rather heterogeneous: some patients had an increase, while others had a decrease. Interestingly, we demonstrated that the preoperative uC2C values could predict the postoperative status: if the preoperative value was low, this meant that Coll2 degradation had become more intense, and the reverse was true for high preoperative values. This finding was widely observed in females. The sex-related differences in the course of OA—and probably in its pathogenesis—should be emphasized, as they are often overlooked by researchers [45,46,47,48,49]. We have previously found that higher uC2C levels—especially in women—could predict further kOA progression [40].
Notably, the uC2C levels of the rapidly progressive study group in the present study, with gOA grade 3 according to the Nottingham system, were markedly higher compared to the uC2C levels of the same disease severity group for our middle-aged population cohort [40]. Thus, high levels of uC2C could help us to estimate the structural status of the knee in the preoperative period. However, we must not forget that one of the factors influencing uC2C levels is the severity of kOA, as assessed by X–ray [30,50].
Improvement in quality of life and knee function is common after TKR. We found that preoperative uC2C levels could predict the improvement of the KOOS symptoms score, but only in females. At the same time, the KOOS pain score was correlated with the uC2C value in men during the preoperative period. There is no good explanation for the contradiction between associations of uC2C with pain and other kOA symptoms, but they probably show different aspects of the disease. A possible explanation is that the pain in OA is recognized to be multifactorial [51,52], and may arise from multiple different structural changes [53,54]. Furthermore, obvious associations between increased levels of hs-CRP and greater kOA pain were observed among women, but not men [48,55]. Surprisingly, we did not demonstrate a correlation between the knee-function tests and uC2C levels; this needs more detailed study in the future.
This study has several limitations. First, our study group was small in number, although sufficient to allow a general assessment of uC2C behavior in TKR surgical patients in the initial study. In the case of a larger cohort, additional relationships are likely to emerge, e.g., a larger cohort is needed for the evaluation of sex-related differences in the pathogenesis of kOA. Second, we did not measure the synthesis of Coll2; therefore, we could not evaluate the balance between the synthesis and degradation of Coll2. Third, one year may be too short a period to evaluate far-reaching changes in OA biomarkers after TKR. Fourth, although we assessed other joints’ pain via sumVAS, a radiographic evaluation was not performed. Moreover, the X-ray method used for assessment of tibiofemoral joints was not a standardized method for kOA.
Despite these limitations, our study has several strengths. First, this is the first uC2C study in patients undergoing TKR surgery. Second, the cohort consisted of middle-aged people (mean age < 60 years), who could therefore generally be classified as rapidly progressive cases of kOA. Third, the study group included both men and women of the same age, allowing us to explain that the correlations we discovered were predominantly seen in female patients. While the majority of authors have studied patients of both sexes together, or only females, significant gender-related differences in OA have been overlooked. Fourth, we evaluated different aspects of quality of life after TKR: subjective assessment by different questionnaires (i.e., KOOS, SF-36), and objective status of knees by functional performance tests.
Summarizing these few studies on changes in biomarkers after TKR surgery, both our study and others show that when patients are viewed as a group, the biomarker levels (e.g., COMP, Coll2–1NO2, uC2C) do not decrease. Thus, in general, TKR does not stop the breakdown of collagen II and possible synovitis (as reflected by COMP levels). However, individual analysis of our results revealed that those patients with high pre-TRK secretion of uC2C achieved a significant reduction. It seems that such a phenomenon—as also described by Deberg et al. (2008) [22] for Coll2–1NO2—is worthy of further investigation. If this phenomenon is confirmed, there may be an opportunity for a close grouping of patients undergoing TRK surgery. The same trend was observed for changes in the KOOSsymp scale after surgery in women (OR > 9). The possibility of a more precise categorization of patients became apparent here.
Here, it should be emphasized that, KOOS, SF-36, and lower extremity performance tests demonstrated only partial improvement of patients 12 months after TKR. This was particularly evident in terms of the restrictions on the use of the lower limbs for more demanding functions. Thus, a large proportion of these patients require continued rehabilitation—especially exercise therapy—12 months after surgery.
Furthermore, it should be added that uC2C levels are also affected by other factors—in the present context, by radiological changes in the joints and their progression.
5. Conclusions
uC2C excretion was high in most of the patients before TKR surgery. We found that TKR does not stop the degradation of Coll2 in tissues in the majority of cases, which is supported by a rather heterogenic dynamic of the marker uC2C in the postoperative period. Partial improvements in quality of life and knee function are common after TKR. These changes are sex- and person-specific, and are multidirectional. The preoperative uC2C level could predict improvement in the KOOS symptoms score, but only in females; uC2C levels were significantly higher in patients with advanced radiological changes, and particularly in women. Obvious trends were observed in that higher preoperative uC2C levels decreased postoperatively, and vice versa. Therefore, uC2C could be considered a prospective pre- and postoperative biomarker for the characterization of the pathogenic process and treatment of kOA in the future. Moreover, continuous and probably systemic pathogenic processes of OA after TKR could be hypothesized in rapidly progressive cases.
Author Contributions
Conceptualization, A.O.T., A.E.T., K.K. and L.K.; methodology, K.K., A.O.T. and L.K.; validation, J.K., A.M., A.O.T. and K.K.; formal analysis, L.K. and K.K.; investigation, J.K., K.J., A.M., A.E.T., K.K. and L.K.; resources, A.O.T., A.E.T., K.K., and L.K.; data curation, K.K.; writing—original draft preparation, K.K., L.K., A.O.T. and A.E.T.; writing—review and editing, K.K., L.K., A.O.T., J.K., K.J. and A.M.; visualization, K.K. and L.K.; supervision, K.K. and A.O.T.; project administration, K.K.; funding acquisition, A.O.T. and K.K. All authors have read and agreed to the published version of the manuscript.
Funding
This work was supported by the Estonian Ministry of Social Affairs, Estonian Science Foundation grant No 5308, and by the EU’s 7th Framework Programme NMP-2008-4.0-1, GRANT AGREEMENT No 228929 (NanoDiaRA), as well as by basic financing of the Institute of Clinical Medicine, University of Tartu; Estonian Institutional Research Funding project IUT2-8.
Institutional Review Board Statement
This study was conducted according to the guidelines of the Declaration of Helsinki, and approved by The Research Ethics Committee of the University of Tartu (protocol 265/T-22, 19 December 2016).
Informed Consent Statement
Written informed consent was obtained from all subjects involved in the study.
Data Availability Statement
All data generated or analyzed during this study are included in the published article.
Acknowledgments
We give special thanks to the orthopedic surgeons Eiki Strauss, Anna-Helena Kase, Jaan Laos, Mart Parv, Sigrid Paul, Egon Puuorg, Alo Rull, and Viktor Šapovalov, who graded the status of knee cartilage during the TKR, and to Pärt Prommik for help conducting the knee-function tests. We would also like to thank Anne Krips and Ingrid Liimand for management of the subjects’ data and materials.
Conflicts of Interest
The authors declare no conflict of interest.
Appendix A
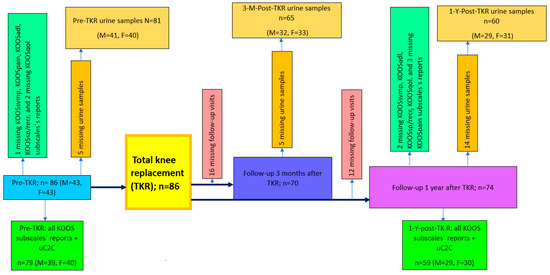
Figure A1.
Flowchart that details the study procedure and formation of the patient cohort. n—numbers of whole group; M—number of males; F—number of females.
Figure A1.
Flowchart that details the study procedure and formation of the patient cohort. n—numbers of whole group; M—number of males; F—number of females.
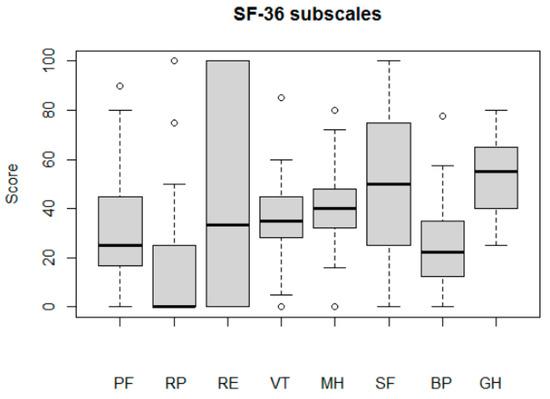
Figure A2.
Patients’ quality of life before the TKR, assessed by SF-36 subscales: physical functioning (PF); role limitations due to physical health (RP); role limitations due to emotional problems (RE); energy/fatigue (VT); emotional wellbeing (MH); social functioning (SF); bodily pain (BP); general health (GH).
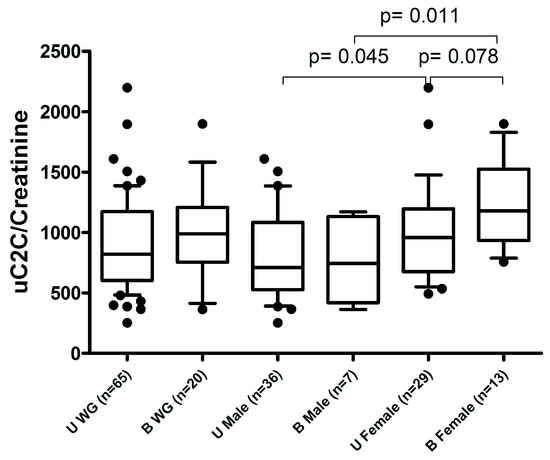
Figure A3.
The association of preoperative uC2C levels with uni- or bilateral kOA status. U WG (unilateral kOA without previous TKR in the whole group); B WG (bilateral kOA with previous TKR in the whole group); U Male (unilateral kOA without previous TKR in males); B Male (bilateral kOA with previous TKR in males); U Female (unilateral kOA without previous TKR in females); B Female (bilateral kOA with previous TKR in females). Boxplot with 10th–90th percentiles, Wilcoxon test p-values.
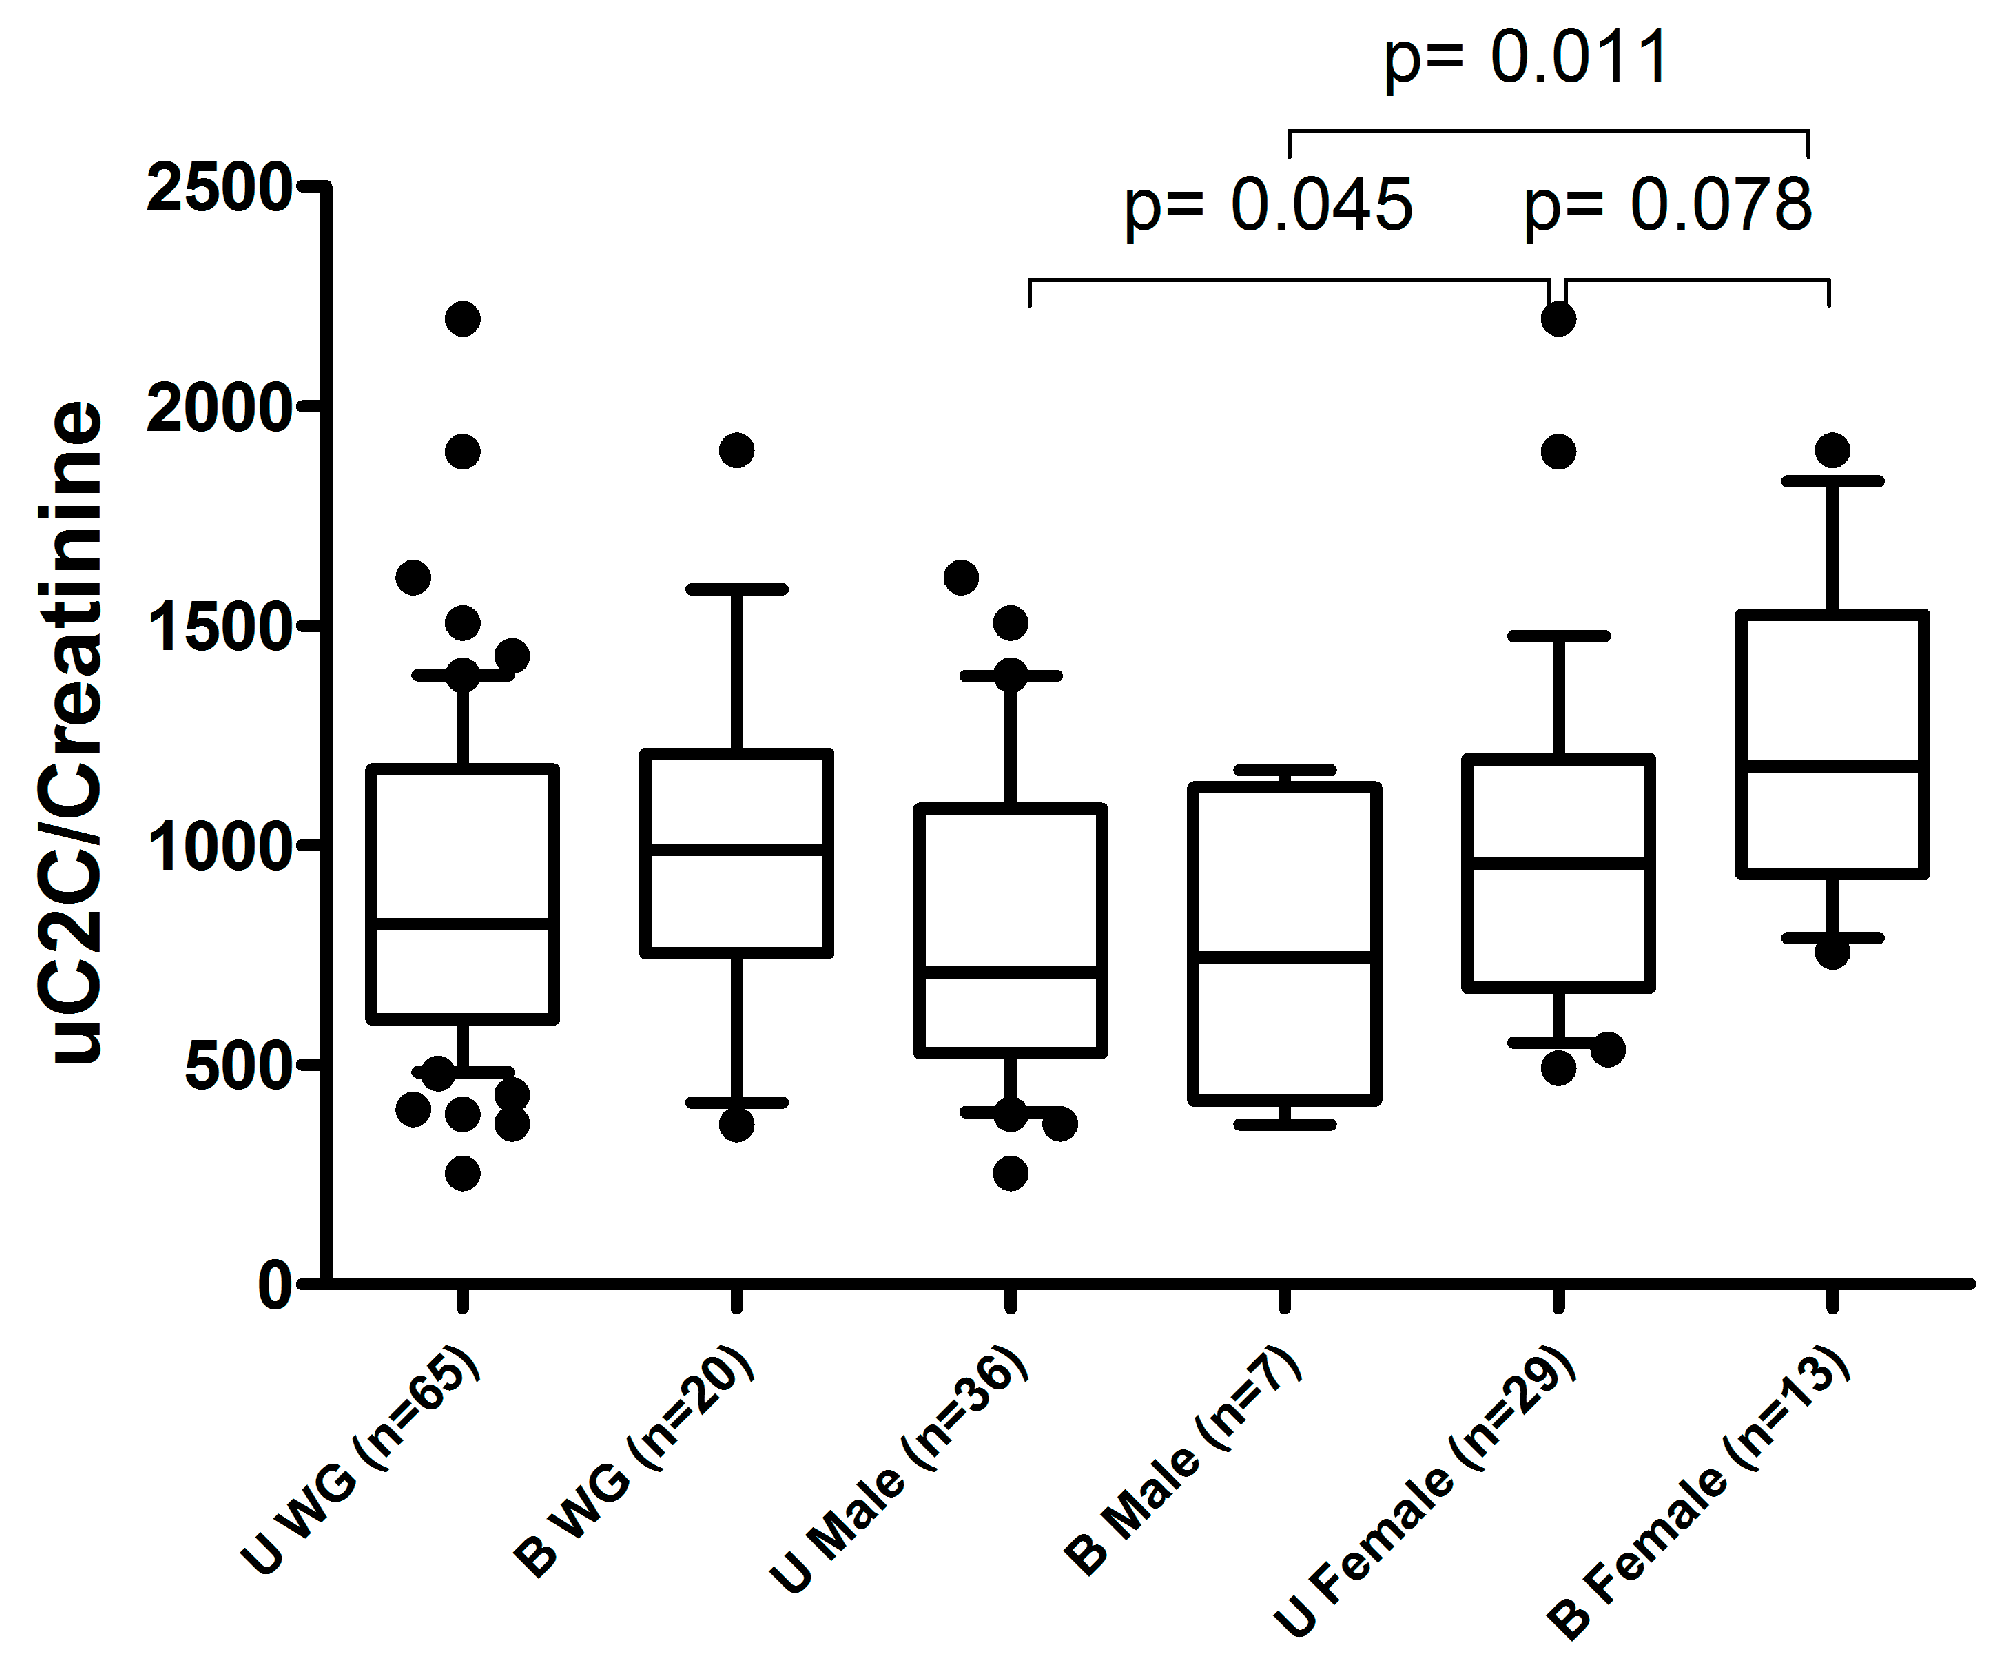

Table A1.
Distribution of radiographic grades of kOA evaluated by two different systems: KL and NSy.
Table A1.
Distribution of radiographic grades of kOA evaluated by two different systems: KL and NSy.
| Radiographic kOA Grades | gOA | |
|---|---|---|
| KL | Grade 2 | Grade 3 |
| Grade 2 | 3 | 1 |
| Grade 3 | 11 | 28 |
| Grade 4 | 2 | 41 |
KL—the severity grade of knee OA assessed by the Kellgren–Lawrence system; gOA—the highest grade of knee OA changes in two knee joint compartments (tibiofemoral and/or patellofemoral joints) assessed by the Nottingham system (NSy).

Table A2.
The associations between radiographic findings and uC2C levels or clinical parameters.
Table A2.
The associations between radiographic findings and uC2C levels or clinical parameters.
| Kellgren/Lawrence Scoring System | Nottingham Scoring System | |||||||
|---|---|---|---|---|---|---|---|---|
| Parameter | Median (1st–3rd Quantiles) | p-Value of Kruskal Test | p-Value of Wilcoxon Test 3 vs. 4 | Median (1st–3rd Quantiles) | p-Value of Wilcoxon Test | |||
| Grade 2 | Grade 3 | Grade 4 | Grade 2 | Grade 3 | ||||
| uC2C/Crea, ng/mmol | 610 (526–747) | 753 (627–986) | 1062 (677–1301) | 0.054 | 0.047 | 732 (635–967) | 934 (623–1179) | 0.27 |
| KOOSsymp | 44 (39–50) | 26 (17–40) | 29 (21–40) | 0.20 | 0.57 | 30 (22–46) | 29 (17–40) | 0.30 |
| KOOSpain | 46 (38–50) | 34 (25–44) | 33 (27–42) | 0.37 | 0.95 | 40 (31–47) | 33 (24–42) | 0.09 |
| KOOSadl | 39 (33–44) | 35 (29–44) | 38 (28–45) | 0.79 | 0.53 | 36 (31–43) | 35 (28–44) | 0.81 |
| KOOSsp/recr | 0 (0–1) | 0 (0–0) | 0 (0–4) | 0.24 | 0.10 | 0 (0–0) | 0 (0–4) | 0.18 |
| KOOSqol | 20 (13–30) | 15 (5–20) | 15 (5–20) | 0.57 | 0.78 | 18 (5–25) | 15 (5–20) | 0.61 |
The Knee Injury and Osteoarthritis Outcome Score (KOOS) subscales: symptoms (KOOSsymp), pain (KOOSpain), activities of daily living (KOOSadl), sport and recreation (KOOSsp/recr), and knee-related quality of life (KOOSqol).

Table A3.
Correlations between uC2C and results of subjective complaints or objective functional tests before TKR.
Table A3.
Correlations between uC2C and results of subjective complaints or objective functional tests before TKR.
| KOOS Subscales | Whole Group | Females | Males | |||
|---|---|---|---|---|---|---|
| Spearman’s Rho | p-Value | Spearman’s Rho | p-Value | Spearman’s Rho | p-Value | |
| KOOSsymp | –0.13 | 0.25 | –0.23 | 0.15 | 0.07 | 0.66 |
| KOOSpain | –0.31 | 0.006 | –0.20 | 0.21 | –0.33 | 0.04 |
| KOOSadl | –0.20 | 0.08 | –0.12 | 0.45 | –0.20 | 0.22 |
| KOOSsp/recr | –0.11 | 0.32 | –0.03 | 0.87 | –0.14 | 0.40 |
| KOOSqol | –0.10 | 0.37 | –0.06 | 0.72 | –0.05 | 0.77 |
| SF36PF | –0.13 | 0.26 | –0.24 | 0.14 | –0.02 | 0.91 |
| SF36RP | 0.08 | 0.49 | –0.14 | 0.40 | 0.22 | 0.17 |
| SF36RE | –0.16 | 0.16 | –0.24 | 0.14 | –0.05 | 0.76 |
| SF36VT | –0.23 | 0.05 | –0.22 | 0.19 | –0.16 | 0.31 |
| SF36MH | –0.12 | 0.28 | 0.11 | 0.50 | –0.24 | 0.13 |
| SF36SF | –0.24 | 0.03 | –0.38 | 0.02 | –0.08 | 0.64 |
| SF36BP | –0.18 | 0.11 | 0.18 | 0.28 | –0.12 | 0.45 |
| SF36GH | 0.02 | 0.85 | 0.12 | 0.46 | 0.01 | 0.95 |
| TUG | 0.16 | 0.17 | 0.16 | 0.32 | 0.10 | 0.54 |
| Test-Chair | –0.20 | 0.07 | –0.18 | 0.27 | –0.13 | 0.43 |
| 30sCST | –0.10 | 0.44 | –0.08 | 0.65 | 0.07 | 0.73 |
| 30mFPWT | 0.12 | 0.30 | 0.14 | 0.40 | –0.01 | 0.94 |
The Knee Injury and Osteoarthritis Outcome Score (KOOS) subscales: symptoms (KOOSsymp), pain (KOOSpain), activities of daily living (KOOSadl), sport and recreation (KOOSsp/recr), and knee-related quality of life (KOOSqol); 36-Item Short-Form Survey (SF–36) subscales: physical functioning (SF36PF), role limitations caused by physical health problems (SF36RP), role limitations caused by personal or emotional health (SF36RE), vitality (SF36VT), general mental health (SF36MH), social functioning (SF36SF), bodily pain (SF36BP), general health (SF36GH). Functional tests: Timed Up and Go test (TUG); 30 s chair stand test (30sCST); 30 m fast-paced walk test (30mFPWT); the original chair test (Test-Chair).

Table A4.
The prediction of improvement in different KOOS subscales by preoperative uC2C values (generalized linear models (GLMs)).
Table A4.
The prediction of improvement in different KOOS subscales by preoperative uC2C values (generalized linear models (GLMs)).
| KOOS Subscales | Models: Improvement Group * (ImpG) versus No Change Group (NCG) | ||||||
|---|---|---|---|---|---|---|---|
| Independent Variables in the Model | All Subjects | Males | Females | ||||
| n (ImpG/ NCG) | OR (CI 95%) | n (ImpG/ NCG) | OR (CI 95%) | n (ImpG/ NCG) | OR (CI 95%) | ||
| KOOSsymp | log2(C2C) | 38/29 | 2.79 (1.19–6.53) ** | 14/19 | 1.15 (0.39–3.37) | 24/10 | 8.56 (1.42–51.59) ** |
| log2(C2C) Age BMI Sex | 1.99 (0.78–5.04) 1.06 (0.93–1.20) 0.99 (0.87–1.14) 2.47 (0.80–7.66) | 1.35 (0.40–4.48) 1.01 (0.86–1.18) 1.08 (0.88–1.33) – | 9.43 (1.19–74.73) ** 1.13 (0.88–1.44) 0.80 (0.62–1.04) – | ||||
| KOOSpain | log2(C2C) | 46/21 | 0.99 (0.44–2.22) | 22/11 | 0.81 (0.27–2.46) | 24/10 | 1.17 (0.3–4.49) |
| log2(C2C) Age BMI Sex | 0.94 (0.38–2.34) 0.95 (0.83–1.07) 0.86 (0.74–1.00) 1.87 (0.54–6.52) | 0.52 (0.14–2.02) 0.92 (0.77–1.11) 0.78 (0.60–1.01) – | 1.23 (0.26–5.81) 0.95 (0.79–1.16) 1.01 (0.82–1.24) – | ||||
| KOOSadl | log2(C2C) | 44/24 | 1.58 (0.72–3.48) | 21/13 | 0.97 (0.34–2.79) | 23/11 | 3.46 (0.8–14.98) |
| log2(C2C) Age BMI Sex | 1.35 (0.56–3.25) 1.06 (0.94–1.19) 0.99 (0.87–1.13) 1.10 (0.36–3.39) | 0.62 (0.18–2.15) 1.08 (0.92–1.26) 0.86 (0.70–1.07) – | 3.03 (0.60–15.3) 1.02 (0.85–1.23) 1.05 (0.87–1.28) – | ||||
| KOOSsp/ recr | log2(C2C) | 25/44 | 0.81 (0.38–1.76) | 17/18 | 1.09 (0.39–3.04) | 8/26 | 1.09 (0.26–4.66) |
| log2(C2C) Age BMI Sex | 1.27 (0.52–3.10) 0.94 (0.83–1.06) 1.02 (0.89–1.16) 0.30 (0.09–0.94) ** | 1.33 (0.42–4.24) 0.93 (0.80–1.08) 1.03 (0.85–1.23) – | 1.23 (0.26–5.81) 0.95 (0.79–1.16) 1.01 (0.82–1.24) – | ||||
| KOOSqol | log2(C2C) | 36/30 | 1.23 (0.58–2.60) | 14/18 | 0.85 (0.29–2.44) | 22/12 | 1.19 (0.33–4.3) |
| log2(C2C) Age BMI Sex | 0.81 (0.33–1.99) 1.10 (0.97–1.24) 1.08 (0.95–1.24) 2.05 (0.67–6.31) | 0.85 (0.26–2.77) 1.05 (0.90–1.23) 1.05 (0.86–1.2) – | 0.63 (0.14–2.90) 1.17 (0.97–1.42) 1.12 (0.92–1.36) – | ||||
Abbreviations: KOOS subscales: symptoms (KOOSsymp), pain (KOOSpain), activities of daily living (KOOSadl), sport and recreation (KOOSsp/recr), and knee-related quality of life (KOOSqol); n—numbers OR—odds ratio (of double the increase in uC2C), CI—confidence interval; BMI—body mass index; *: KOOS changes of more than 20 units between the 12-months postoperative and preoperative periods were counted as SCB (substantial clinical benefit); ** p < 0.05.
References
- Törmälehto, S.; Aarnio, E.; Mononen, M.E.; Arokoski, J.P.A.; Korhonen, R.K.; Martikainen, J.A. Eight-year trajectories of changes in health-related quality of life in knee osteoarthritis: Data from the Osteoarthritis Initiative (OAI). PLoS ONE 2019, 14, e0219902. [Google Scholar] [CrossRef]
- Wallace, I.J.; Worthington, S.; Felson, D.T.; Jurmain, R.D.; Wren, K.T.; Maijanen, H.; Woods, R.J.; Lieberman, D.E. Knee Osteoarthritis Has Doubled in Prevalence since the Mid-20th Century. Proc. Natl. Acad. Sci. USA 2017, 114, 9332–9336. [Google Scholar] [CrossRef]
- Berenbaum, F.; Wallace, I.J.; Lieberman, D.E.; Felson, D.T. Modern-Day Environmental Factors in the Pathogenesis of Osteoarthritis. Nat. Rev. Rheumatol. 2018, 14, 674–681. [Google Scholar] [CrossRef]
- van Spil, W.E.; Bierma-Zeinstra, S.M.A.; Deveza, L.A.; Arden, N.K.; Bay-Jensen, A.-C.; Kraus, V.B.; Carlesso, L.; Christensen, R.; Van Der Esch, M.; Kent, P.; et al. A Consensus-Based Framework for Conducting and Reporting Osteoarthritis Phenotype Research. Arthritis Res. Ther. 2020, 22, 54. [Google Scholar] [CrossRef]
- Dell’Isola, A.; Allan, R.; Smith, S.L.; Marreiros, S.S.P.; Steultjens, M. Identification of Clinical Phenotypes in Knee Osteoarthritis: A Systematic Review of the Literature. BMC Musculoskelet. Disord. 2016, 17, 1–12. [Google Scholar] [CrossRef] [PubMed]
- Waarsing, J.H.; Bierma-Zeinstra, S.M.A.; Weinans, H. Distinct subtypes of knee osteoarthritis: Data from the Osteoarthritis Initiative. Rheumatology 2015, 54, 1650–1658. [Google Scholar] [CrossRef] [PubMed]
- Deveza, L.A.; Melo, L.; Yamato, T.P.; Mills, K.; Ravi, V.; Hunter, D.J. Knee osteoarthritis phenotypes and their relevance for outcomes: A systematic review. Osteoarthr. Cartil. 2017, 25, 1926–1941. [Google Scholar] [CrossRef]
- Felson, D.T.; Lawrence, R.C.; Dieppe, P.A.; Hirsch, R.; Helmick, C.G.; Jordan, J.M.; Kington, R.S.; Lane, N.E.; Nevitt, M.C.; Zhang, Y.; et al. Osteoarthritis: New Insights. Part 1: The Disease and Its Risk Factors. Ann. Intern. Med. 2000, 133, 635–646. [Google Scholar] [CrossRef] [PubMed]
- Kumm, J.; Tamm, A.; Lintrop, M.; Tamm, A. The prevalence and progression of radiographic knee osteoarthritis over 6 years in a population-based cohort of middle-aged subjects. Rheumatol. Int. 2012, 32, 3545–3550. [Google Scholar] [CrossRef] [PubMed]
- Sharif, M.; Kirwan, J.R.; Elson, C.J.; Granell, R.; Clarke, S. Suggestion of nonlinear or phasic progression of knee osteoarthritis based on measurements of serum cartilage oligomeric matrix protein levels over five years. Arthritis Rheum. 2004, 50, 2479–2488. [Google Scholar] [CrossRef] [PubMed]
- Kumm, J.; Tamm, A.; Lintrop, M.; Tamm, A. The value of cartilage biomarkers in progressive knee osteoarthritis: Cross-sectional and 6-year follow-up study in middle-aged subjects. Rheumatol. Int. 2013, 33, 903–911. [Google Scholar] [CrossRef] [PubMed]
- Kumm, J.; Tamm, A.; Lintrop, M.; Tamm, A. The prevalence and progression of radiographic knee osteoarthritis over 9 years in a population-based cohort of middle-aged subjects. Osteoarthr. Cartil. 2013, 21, S204. [Google Scholar] [CrossRef][Green Version]
- Thomas, M.J.; Neogi, T. Flare-ups of osteoarthritis: What do they mean in the short-term and the long-term? Osteoarthr. Cartil. 2020, 28, 870–873. [Google Scholar] [CrossRef]
- Maillefert, J.F.; Roy, C.; Cadet, C.; Nizard, R.; Berdah, L.; Ravaud, P. Factors influencing surgeons’ decisions in the indication for total joint replacement in hip osteoarthritis in real life. Arthritis Care Res. 2008, 59, 255–262. [Google Scholar] [CrossRef]
- Huynh, C.; Puyraimond-Zemmour, D.; Maillefert, J.F.; Conaghan, P.G.; Davis, A.M.; Gunther, K.-P.; Hawker, G.; Hochberg, M.C.; Kloppenburg, M.; Lim, K.; et al. Factors associated with the orthopaedic surgeon’s decision to recommend total joint replacement in hip and knee osteoarthritis: An international cross-sectional study of 1905 patients. Osteoarthr. Cartil. 2018, 26, 1311–1318. [Google Scholar] [CrossRef]
- Dam, E.B.; Loog, M.; Christiansen, C.; Byrjalsen, I.; Folkesson, J.; Nielsen, M.; Qazi, A.A.; Pettersen, P.C.; Garnero, P.; Karsdal, M.A. Identification of progressors in osteoarthritis by combining biochemical and MRI-based markers. Arthritis Res. Ther. 2009, 11, R115. [Google Scholar] [CrossRef] [PubMed]
- van Spil, W.E.; Bijlsma, J.W.; Mastbergen, S.C.; Lafeber, F.P. Associations of ctx-ii with biochemical markers of bone turnover raise questions on its tissue origin: Data from check, a cohort study of early osteoarthritis. Osteoarthr. Cartil. 2012, 20, S78. [Google Scholar] [CrossRef][Green Version]
- Arends, R.H.G.P.; Karsdal, M.A.; Verburg, K.M.; West, C.R.; Bay-Jensen, A.C.; Keller, D.S. Identification of serological biomarker profiles associated with total joint replacement in osteoarthritis patients. Osteoarthr. Cartil. 2017, 25, 866–877. [Google Scholar] [CrossRef]
- Kraus, V.B.; Collins, J.E.; Hargrove, D.; Losina, E.; Nevitt, M.; Katz, J.N.; Wang, S.X.; Sandell, L.J.; Hoffmann, S.C.; Hunter, D.J. Predictive validity of biochemical biomarkers in knee osteoarthritis: Data from the FNIH OA Biomarkers Consortium. Ann. Rheum. Dis. 2017, 76, 186–195. [Google Scholar] [CrossRef]
- Kuhi, L.; Tamm, A.E.; Tamm, A.O.; Kisand, K. Cartilage collagen neoepitope C2C in urine as an integrative diagnostic marker for early knee osteoarthritis. Osteoarthr. Cartil. Open 2020, 2, 100096. [Google Scholar] [CrossRef]
- Price, A.J.; Alvand, A.; Troelsen, A.; Katz, J.N.; Hooper, G.; Gray, A.; Carr, A.; Beard, D. Knee replacement. Lancet 2018, 392, 1672–1682. [Google Scholar] [CrossRef]
- Bay-Jensen, A.C.; Bager, C.; Bihlet, A.; Thudium, C.; Byrjalsen, I.; Nielsen, H.; Andersen, J.; Riis, B.J.; Christiansen, C.; Karsdal, M.A. Total joint replacement (TJR) as clinical endpoint in OA; prevalence and incidence rates of TJRS from the Prospective Epidemiologic Risk Factor (PERF I) study. Osteoarthr. Cartil. 2018, 26, S198–S199. [Google Scholar] [CrossRef]
- Alcaraz, M.J.; Guillén, M.I.; Ferrándiz, M.L. Emerging Therapeutic Agents in Osteoarthritis. Biochem. Pharmacol. 2019, 165, 4–16. [Google Scholar] [CrossRef] [PubMed]
- Nam, D.; Nunley, R.M.; Barrack, R.L. Patient dissatisfaction following total knee replacement: A growing concern? Bone Jt. J. 2014, 96, 96–100. [Google Scholar] [CrossRef] [PubMed]
- Beswick, A.D.; Wylde, V.; Gooberman-Hill, R.; Blom, A.; Dieppe, P. What proportion of patients report long-term pain after total hip or knee replacement for osteoarthritis? A systematic review of prospective studies in unselected patients. BMJ Open. 2012, 2, e000435. [Google Scholar] [CrossRef]
- Sweet, M.B.E.; Coelho, A.; Schnitzler, C.M.; Schnitzer, T.J.; Lenz, M.E.; Jakim, I.; Kuettner, K.E.; Thonar, E.J.-M.A. Serum keratan sulfate levels in osteoarthritis patients. Arthritis Rheum. 1988, 31, 648–652. [Google Scholar] [CrossRef]
- Deberg, M.; Dubuc, J.E.; Labasse, A.; Sanchez, C.; Quettier, E.; Bosseloir, A.; Crielaard, J.-M.; Henrotin, Y. One-year follow-up of Coll2-1, Coll2-1NO2 and myeloperoxydase serum levels in osteoarthritis patients after hip or knee replacement. Ann. Rheum. Dis. 2008, 67, 168–174. [Google Scholar] [CrossRef]
- Endres, E.; van Drongelen, S.; Meurer, A.; Zaucke, F.; Stief, F. Effect of total joint replacement in hip osteoarthritis on serum COMP and its correlation with mechanical-functional parameters of gait analysis. Osteoarthr. Cartil. Open 2020, 2, 100034. [Google Scholar] [CrossRef]
- Kong, S.Y.; Stabler, T.V.; Criscione, L.G.; Elliott, A.L.; Jordan, J.M.; Kraus, V.B. Diurnal Variation of Serum and Urine Biomarkers in Patients with Radiographic Knee Osteoarthritis. Arthritis Rheum. 2006, 54, 2496–2504. [Google Scholar] [CrossRef]
- Poole, A.R.; Ha, N.; Bourdon, S.; Sayre, E.C.; Guermazi, A.; Cibere, J. Ability of a Urine Assay of Type II Collagen Cleavage by Collagenases to Detect Early Onset and Progression of Articular Cartilage Degeneration: Results from a Population-based Cohort Study. J. Rheumatol. 2016, 43, 1864–1870. [Google Scholar] [CrossRef]
- Boegård, T.; Rudling, O.; Petersson, I.F.; Sanfridsson, J.; Saxne, T.; Svensson, B.; Jonsson, K. Joint-space width in the axial view of the patello-femoral joint. Definitions and comparison with MR imaging. Acta Radiol. 1998, 39, 24–31. [Google Scholar] [CrossRef] [PubMed]
- Nagaosa, Y.; Mateus, M.; Hassan, B.; Lanyon, P.; Doherty, M. Development of a logically devised line drawing atlas for grading of knee osteoarthritis. Ann. Rheum. Dis. 2000, 59, 587–595. [Google Scholar] [CrossRef] [PubMed]
- Kellgren, J.H.; Lawrence, J.S. Radiological Assessment of Osteo-Arthrosis. Ann. Rheum. Dis. 1957, 16, 494–502. [Google Scholar] [CrossRef]
- Ayral, X.; Pickering, E.H.; Woodworth, T.G.; Mackillop, N.; Dougados, M. Synovitis: A potential predictive factor of structural progression of medial tibiofemoral knee osteoarthritis–results of a 1 year longitudinal arthroscopic study in 422 patients. Osteoarthr. Cartil. 2005, 13, 61–367. [Google Scholar] [CrossRef] [PubMed]
- Outerbridge, R.E. The Etiology of Chondromalacia Patellae. J. Bone Jt. Surg. Br. 1961, 43-B, 752–757. [Google Scholar] [CrossRef]
- Slattery, C.; Kweon, C.Y. Classifications in Brief: Outerbridge Classification of Chondral Lesions. Clin. Orthop. 2018, 476, 2101–2104. [Google Scholar] [CrossRef]
- Glassman, S.D.; Copay, A.G.; Berven, S.H.; Polly, D.W.; Subach, B.R.; Carreon, L.Y. Defining substantial clinical benefit following lumbar spine arthrodesis. J. Bone Jt. Surg. Am. 2008, 90, 1839–1847. [Google Scholar] [CrossRef]
- Ogura, T.; Ackermann, J.; Barbieri Mestriner, A.; Merkely, G.; Gomoll, A.H. Minimal Clinically Important Differences and Substantial Clinical Benefit in Patient-Reported Outcome Measures after Autologous Chondrocyte Implantation. Cartilage 2020, 11, 412–422. [Google Scholar] [CrossRef]
- Ware, J.E.; Sherbourne, C.D. The MOS 36-item short-form health survey (SF-36). I. Conceptual framework and item selection. Med. Care 1992, 30, 473–483. [Google Scholar] [CrossRef]
- Kuhi, L.; Tamm, A.E.; Tamm, A.O.; Kisand, K. Risk Assessment of the Progression of Early Knee Osteoarthritis by Collagen Neoepitope C2C: A Longitudinal Study of an Estonian Middle-Aged Cohort. Diagnostics 2021, 11, 1236. [Google Scholar] [CrossRef]
- Kraus, V.B.; Hargrove, D.E.; Hunter, D.J.; Renner, J.B.; Jordan, J.M. Establishment of Reference Intervals for Osteoarthritis-Related Soluble Biomarkers: The FNIH/OARSI OA Biomarkers Consortium. Ann. Rheum. Dis. 2017, 76, 179–185. [Google Scholar] [CrossRef]
- Addison, S.; Coleman, R.E.; Feng, S.; McDaniel, G.; Kraus, V.B. Whole-body bone scintigraphy provides a measure of the total-body burden of osteoarthritis for the purpose of systemic biomarker validation. Arthritis Rheum. 2009, 60, 3366–3373. [Google Scholar] [CrossRef] [PubMed]
- Stürmer, T.; Sun, Y.; Sauerland, S.; Zeissig, I.; Günther, K.P.; Puhl, W.; Brenner, H. Serum cholesterol and osteoarthritis. The baseline examination of the Ulm Osteoarthritis Study. J. Rheumatol. 1998, 25, 1827–1832. [Google Scholar]
- Kraus, V.B.; Kepler, T.B.; Stabler, T.; Renner, J.; Jordan, J. First qualification study of serum biomarkers as indicators of total body burden of osteoarthritis. PLoS ONE 2010, 5, e9739. [Google Scholar] [CrossRef]
- Muraki, S.; Oka, H.; Akune, T.; Mabuchi, A.; En-yo, Y.; Yoshida, M.; Saika, A.; Suzuki, T.; Yoshida, H.; Ishibashi, H.; et al. Prevalence of radiographic knee osteoarthritis and its association with knee pain in the elderly of Japanese population-based cohorts: The ROAD study. Osteoarthr. Cartil. 2009, 17, 1137–1143. [Google Scholar] [CrossRef]
- Bihlet, A.R.; Byrjalsen, I.; Bay-Jensen, A.C.; Andersen, J.R.; Christiansen, C.; Riis, B.J.; Karsdal, M.A. Associations between biomarkers of bone and cartilage turnover, gender, pain categories and radiographic severity in knee osteoarthritis. Arthritis Res. Ther. 2019, 21, 1–10. [Google Scholar] [CrossRef]
- Boyan, B.D.; Tosi, L.L.; Coutts, R.D.; Enoka, R.M.; Hart, D.A.; Nicolella, D.P.; Berkley, K.J.; Sluka, K.A.; Kwoh, C.K.; O’Connor, M.I.; et al. Addressing the gaps: Sex differences in osteoarthritis of the knee. Biol. Sex Differ. 2013, 4, 4. [Google Scholar] [CrossRef] [PubMed]
- Perruccio, A.V.; Chandran, V.; Power, J.D.; Kapoor, M.; Mahomed, N.N.; Gandhi, R. Systemic inflammation and painful joint burden in osteoarthritis: A matter of sex? Osteoarthr. Cartil. 2017, 25, 53–59. [Google Scholar] [CrossRef] [PubMed]
- Kisand, K.; Tamm, A.E.; Lintrop, M.; Tamm, A.O. New insights into the natural course of knee osteoarthritis: Early regulation of cytokines and growth factors, with emphasis on sex-dependent angiogenesis and tissue remodeling. A pilot study. Osteoarthr. Cartil. 2018, 26, 1045–1054. [Google Scholar] [CrossRef] [PubMed]
- Tamm, A.O.; Kumm, J.; Tamm, A.E.; Kukner, A.; Rips, L.; Tein, T.; Saluse, T.; Pintsaar, A. Detection of type ii collagen degradation by urinary ctx-ii in patients with minimal lesions of knee cartilage in arthroscopy. Osteoarthr. Cartil. 2012, 20, S94. [Google Scholar] [CrossRef][Green Version]
- Neogi, T. The epidemiology and impact of pain in osteoarthritis. Osteoarthr. Cartil. 2013, 21, 1145–1153. [Google Scholar] [CrossRef] [PubMed]
- Wylde, V.; Sayers, A.; Odutola, A.; Gooberman-Hill, R.; Dieppe, P.; Blom, A.W. Central sensitization as a determinant of patients’ benefit from total hip and knee replacement. Eur. J. Pain 2017, 21, 357–365. [Google Scholar] [CrossRef] [PubMed]
- Yusuf, E.; Kortekaas, M.C.; Watt, I.; Huizinga, T.W.J.; Kloppenburg, M. Do knee abnormalities visualised on MRI explain knee pain in knee osteoarthritis? A systematic review. Ann. Rheum. Dis. 2011, 70, 60–67. [Google Scholar] [CrossRef] [PubMed]
- Fan, T.; Ruan, G.; Antony, B.; Cao, P.; Li, J.; Han, W.; Li, Y.; Yung, S.N.; Wluka, A.E.; Winzenberg, T.; et al. The interactions between MRI-detected osteophytes and bone marrow lesions or effusion-synovitis on knee symptom progression: An exploratory study. Osteoarthr. Cartil. 2021, 29, 1296–1305. [Google Scholar] [CrossRef] [PubMed]
- Sellam, J.; Rat, A.C.; Fellahi, S.; Bastard, J.-P.; Ngueyon Sime, W.; Ea, H.K.; Chevalier, X.; Richette, P.; Capeau, J.; Guillemin, F.; et al. Pain in women with knee and/or hip osteoarthritis is related to systemic inflammation and to adipose tissue dysfunction: Cross-sectional results of the KHOALA cohort. Semin. Arthritis Rheum. 2021, 51, 129–136. [Google Scholar] [CrossRef] [PubMed]
Publisher’s Note: MDPI stays neutral with regard to jurisdictional claims in published maps and institutional affiliations. |
© 2021 by the authors. Licensee MDPI, Basel, Switzerland. This article is an open access article distributed under the terms and conditions of the Creative Commons Attribution (CC BY) license (https://creativecommons.org/licenses/by/4.0/).

