
Backpack Process Model (BPPM): A Process Mining Approach for Curricular Analytics

 ,
,  ,
, 

Abstract
Featured Application
Abstract
1. Introduction
2. The Backpack Metaphor
3. Related Work in Process Mining
4. The Backpack Process Model (BPPM) Approach
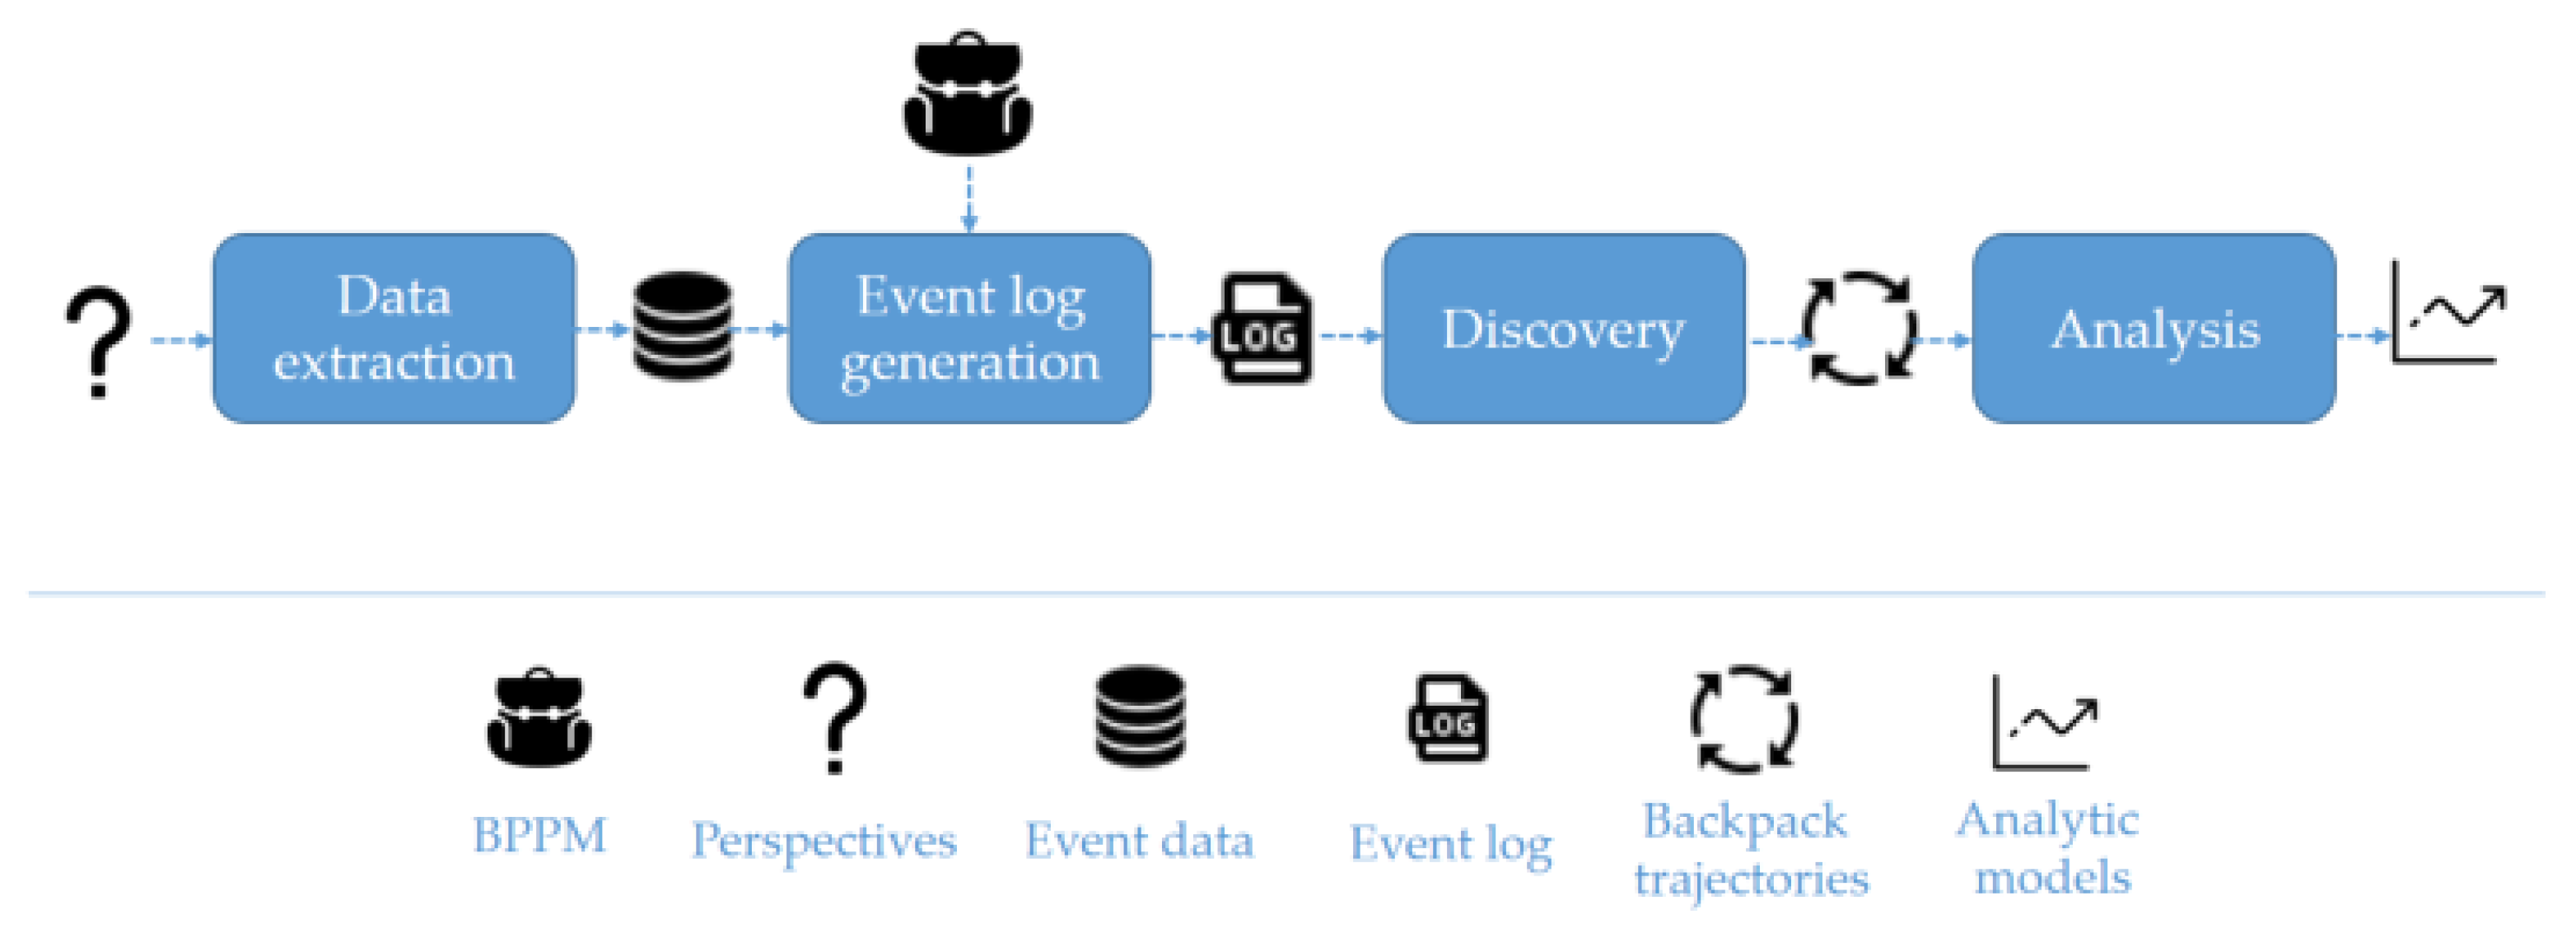
4.1. Data Extraction
- -
- s indicates the ID of the student who took the course
- -
- p the academic period when the course was taken
- -
- c the identifier of the course taken
- -
- g the final grade obtained
- -
- d the end date of the academic period.
4.2. Event Log Generation
4.3. Discovery
4.4. Analysis
5. Application Case: First Engineering Courses
- (P1)
- BPPM trajectories ending either in retention or in dropout
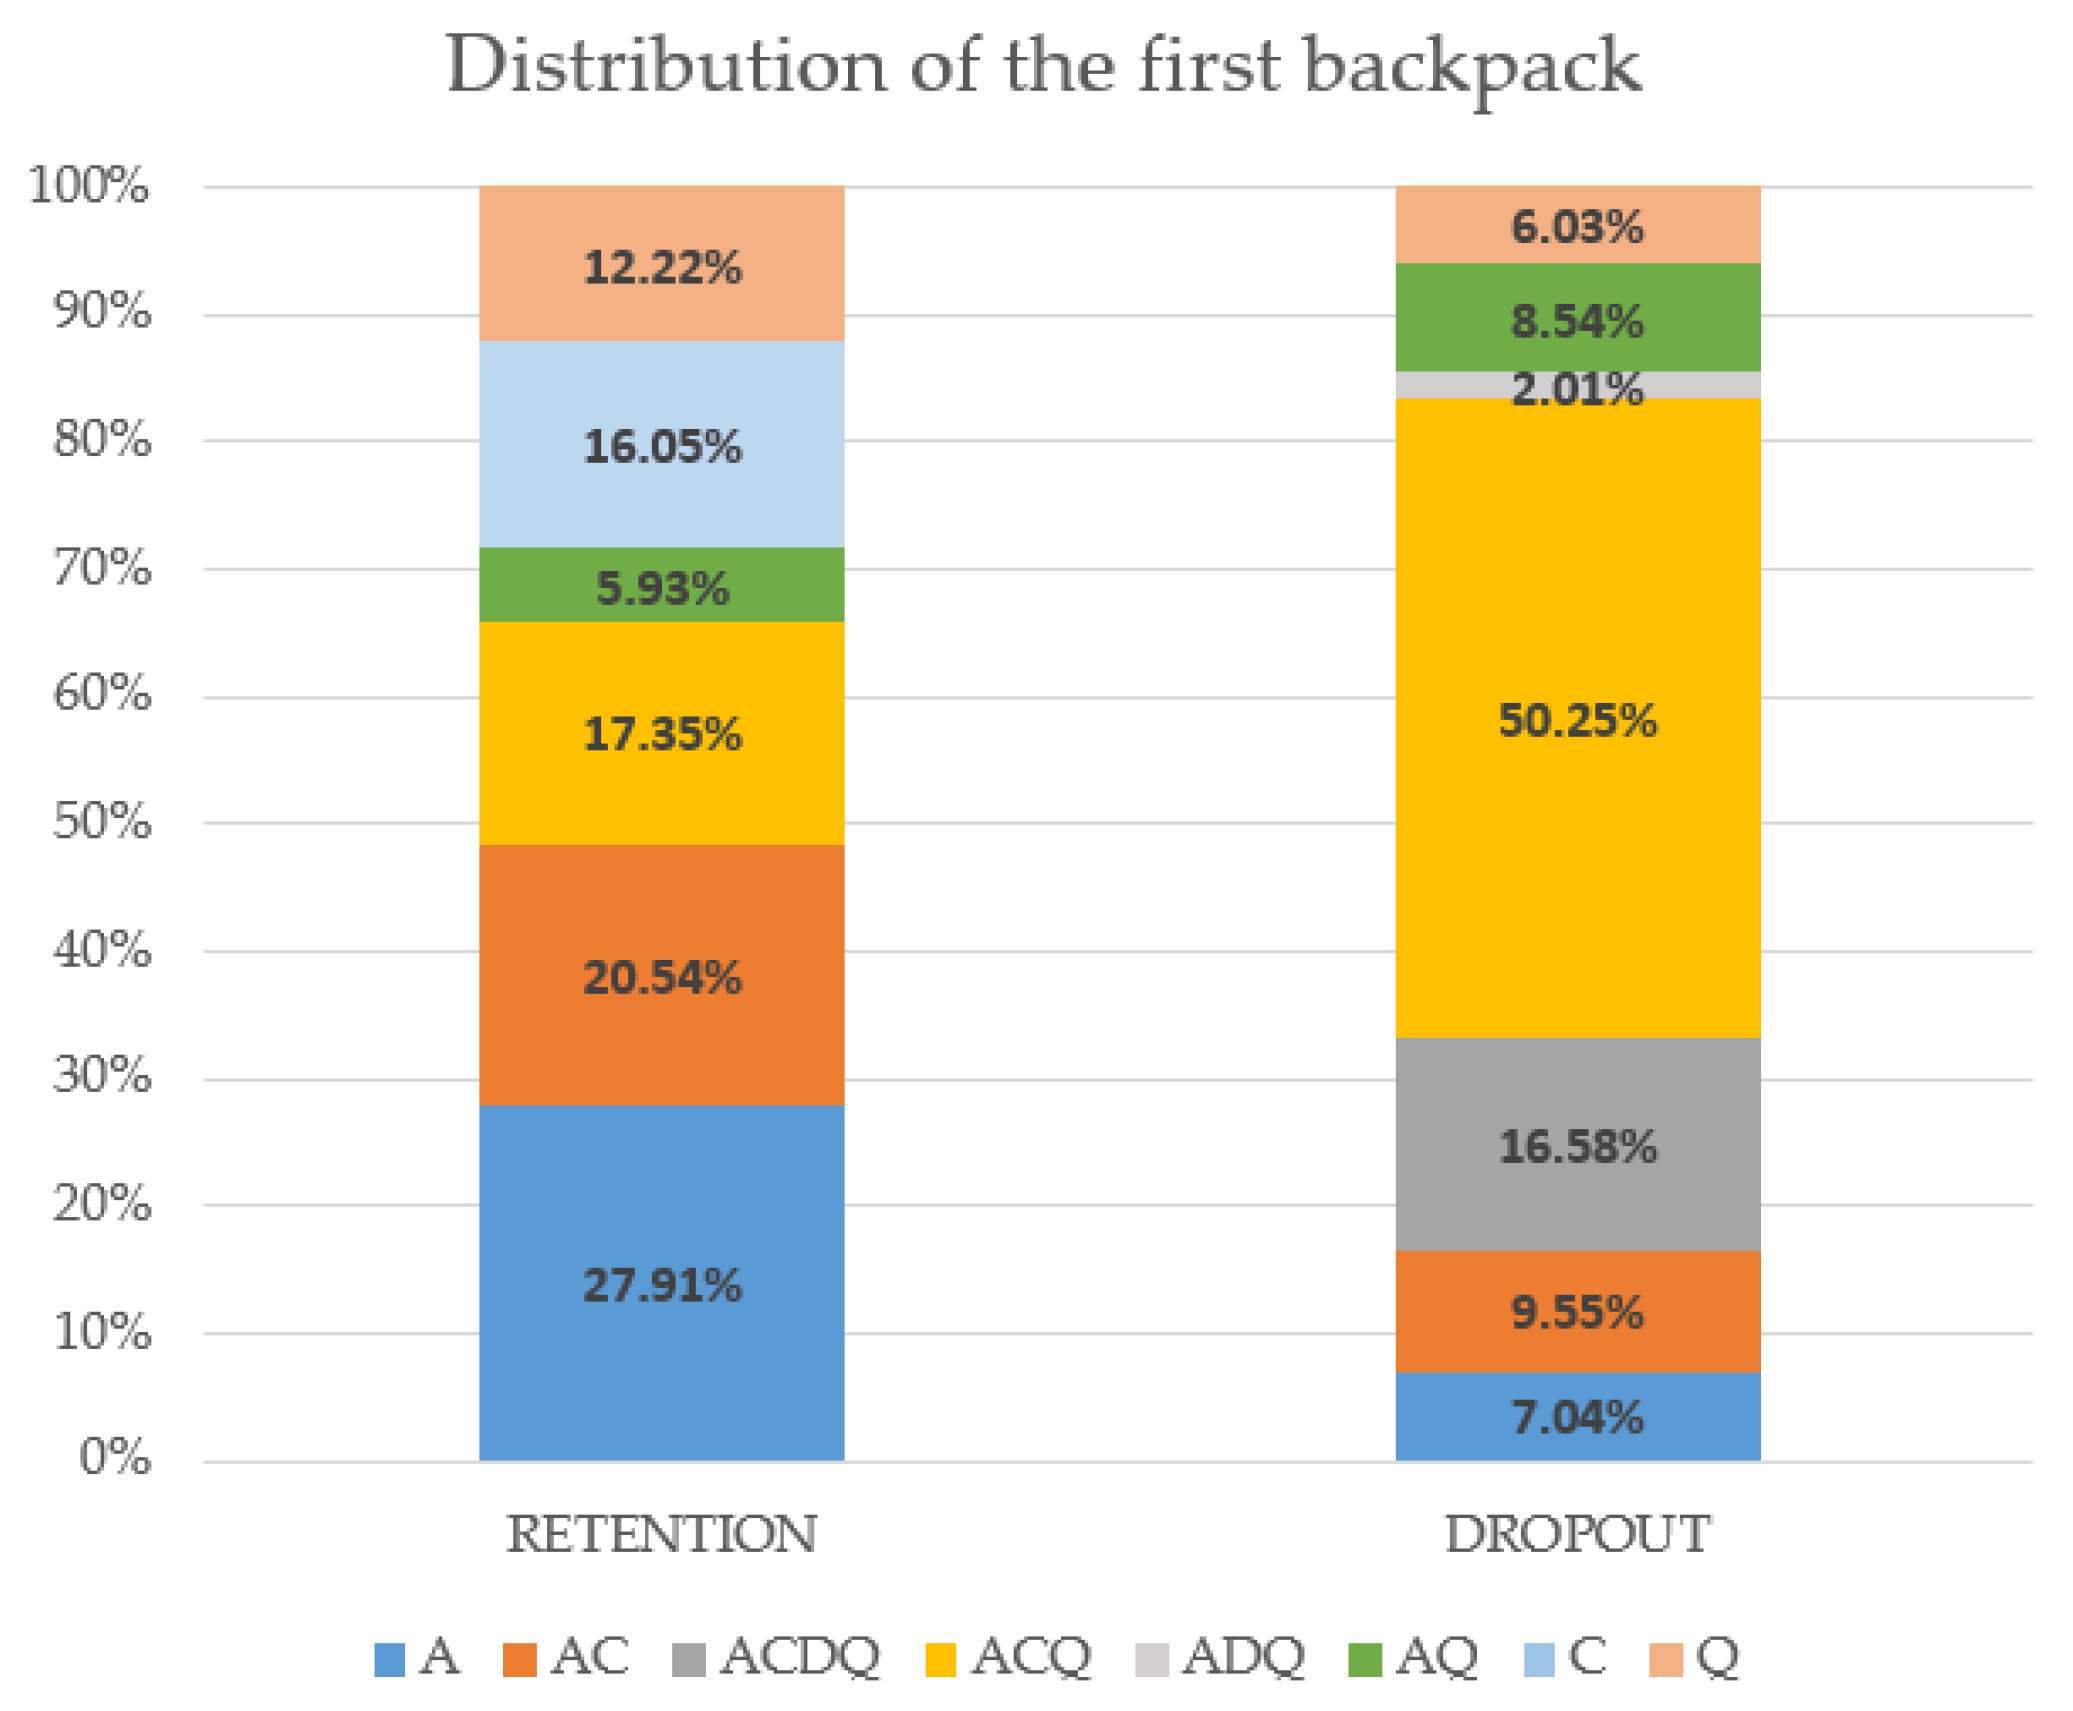
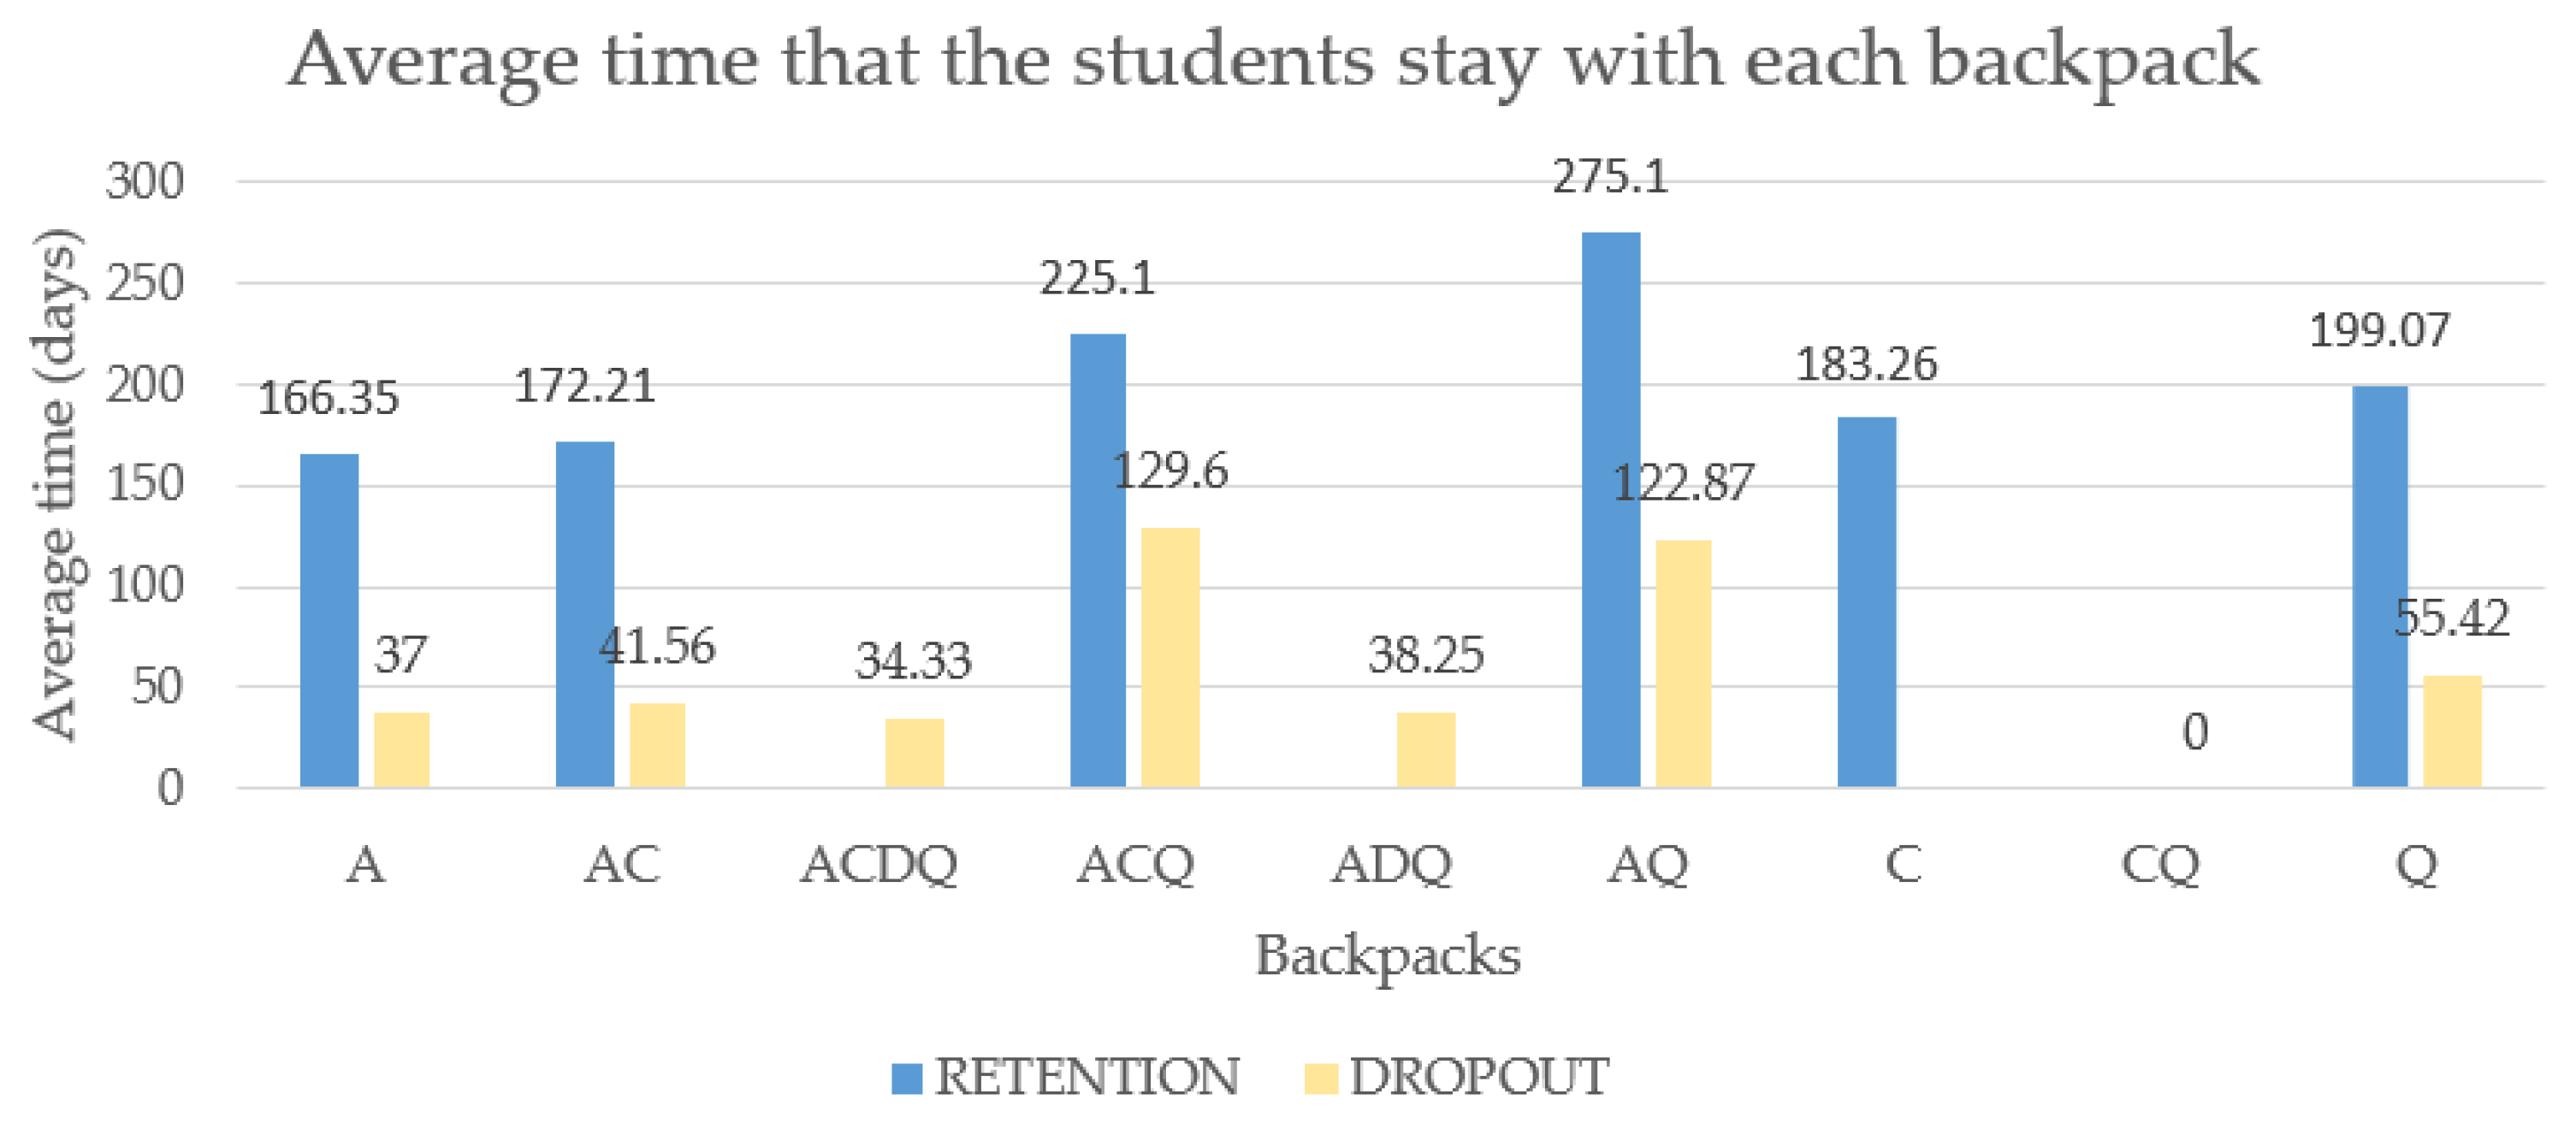
- (P2)
- most frequent backpacks.
- (P3)
- size of the backpack.
6. Discussion
7. Conclusions
Author Contributions
Funding
Institutional Review Board Statement
Informed Consent Statement
Data Availability Statement
Conflicts of Interest
References
- Viberg, O.; Hatakka, M.; Bälter, O.; Mavroudi, A. The current landscape of learning analytics in higher education. Comput. Hum. Behav. 2018, 89, 98–110. [Google Scholar] [CrossRef]
- Banihashem, S.K.; Aliabadi, K.; Ardakani, S.P.; Delaver, A.; Ahmadabadi, M.N.; Ardakani, S.P.; Delavar, A. Learning Analytics: A Systematic Literature Review. Interdiscip. J. Virtual Learn. Med. Sci. 2018, 9. [Google Scholar] [CrossRef]
- Gottipati, S.; Shankararaman, V. Competency analytics tool: Analyzing curriculum using course competencies. Educ. Inf. Technol. 2018, 23, 41–60. [Google Scholar] [CrossRef]
- Hilliger, I.; De Laet, T.; Henríquez, V.; Guerra, J.; Ortiz-Rojas, M.; Zuñiga, M.Á.; Baier, J.; Pérez-Sanagustín, M. For Learners, with Learners: Identifying Indicators for an Academic Advising Dashboard for Students. In Proceedings of the European Conference on Technology Enhanced Learning. EC-TEL 2020: Addressing Global Challenges and Quality Education, Heidelberg, Germany, 14–18 September 2020; Lecture Notes in Computer Science. Alario-Hoyos, C., Rodríguez-Triana, M.J., Scheffel, M., Arnedillo-Sánchez, I., Dennerlein, S.M., Eds.; Springer: Cham, Switzerland, 2020; Volume 12315, pp. 117–130. [Google Scholar] [CrossRef]
- Ochoa, X. Simple Metrics for Curricular Analytics. In Proceedings of the 1st Learning Analytics for Curriculum and Program Quality Improvement Workshop, Sixth International Learning Analytics and Knowledge Conference (LAK), 25–29 April 2016; Available online: http://ceur-ws.org/Vol-1590/paper-04.pdf (accessed on 25 March 2021).
- Levander, L.M.; Mikkola, M. Core Curriculum Analysis: A Tool for Educational Design. J. Agric. Educ. Ext. 2009, 15, 275–286. [Google Scholar] [CrossRef]
- Simanca, F.; Crespo, R.G.; Rodríguez-Baena, L.; Burgos, D. Identifying Students at Risk of Failing a Subject by Using Learning Analytics for Subsequent Customised Tutoring. Appl. Sci. 2019, 9, 448. [Google Scholar] [CrossRef]
- Mabel, Z.; Britton, T.A. Leaving late: Understanding the extent and predictors of college late departure. Soc. Sci. Res. 2018, 69, 34–51. [Google Scholar] [CrossRef]
- Rawatlal, R. Application of Graph Theory to Analysing Student Success Through Development of Progression Maps. In Engineering Education for a Smart Society. GEDC 2016, WEEF 2016. Advances in Intelligent Systems and Computing; Auer, M.E., Kim, K.-S., Eds.; Springer: Cham, Switzerland, 2018; Volume 627, pp. 295–307. [Google Scholar] [CrossRef]
- Campbell, C.M.; Mislevy, J.L. Student Perceptions Matter: Early Signs of Undergraduate Student Retention/Attrition. J. Coll. Stud. Retention: Res. Theory Pr. 2013, 14, 467–493. [Google Scholar] [CrossRef]
- Mason, C.; Twomey, J.; Wright, D.; Whitman, L. Predicting Engineering Student Attrition Risk Using a Probabilistic Neural Network and Comparing Results with a Backpropagation Neural Network and Logistic Regression. Res. High. Educ. 2018, 59, 382–400. [Google Scholar] [CrossRef]
- Zúniga-Prieto, M.A.; Ortiz, M.; Ulloa, M.; Jiménez, A. Applying the LALA Framework for the adoption of a Learning Analytics tool in Latin America: Two case studies in Ecuador. In Proceedings of the Third Latin American Conference on Learning Analytics, Cuenca, Ecuador, 1–2 October 2020. In press. [Google Scholar]
- Moreno-Marcos, P.M.; Muñoz-Merino, P.J.; Maldonado-Mahauad, J.; Pérez-Sanagustín, M.; Alario-Hoyos, C.; Kloos, C.D. Temporal analysis for dropout prediction using self-regulated learning strategies in self-paced MOOCs. Comput. Educ. 2020, 145, 103728. [Google Scholar] [CrossRef]
- Jivet, I.; Scheffel, M.; Specht, M.; Drachsler, H. License to evaluate: Preparing learning analytics dashboards for educational practice. In Proceedings of the 8th International Conference on Learning Analytics and Knowledge, Sydney, NSW, Australia, 5–9 March 2018. [Google Scholar] [CrossRef]
- Cairns, A.H.; Gueni, B.; Fhima, M.; Cairns, A.; David, S.; Khelifa, N. Process Mining in the Education Domain. Int. J. Adv. Intell. Syst. 2015, 8, 219–232. Available online: http://www.iariajournals.org/intelligent_systems/tocv8n12.html (accessed on 25 March 2021).
- Bogarín, A.; Cerezo, R.; Romero, C. A survey on educational process mining. Wiley Interdiscip. Rev. Data Min. Knowl. Discov. 2017, 8, e1230. [Google Scholar] [CrossRef]
- Salazar-Fernández, J.P.; Sepúlveda, M.; Munoz-Gama, J. Describing Educational Trajectories of Engineering Students in Individual High-Failure Rate Courses that Lead to Late Dropout. In Proceedings of the Second Latin American Conference on Learning Analytics, Valdivia, Chile, 18–19 March 2019; Available online: http://ceur-ws.org/Vol-2425/paper03.pdf (accessed on 25 March 2021).
- Munoz-Gama, J.; Maldonado-Mahauad, J.; Salazar-Fernández, J.P.; Bustamante, D.; Sepúlveda, M. Backpack Process Model (BPPM): Curricular Analytics through Process Mining. In Proceedings of the III Conferencia Latinoamericana de Analíticas de Aprendizaje, Cuenca, Ecuador, 1–2 October 2020. In press. [Google Scholar]
- Snyder, K.E.; Barr, S.M.; Honken, N.B.; Pittard, C.M.; Ralston, P.A.S. Navigating the First Semester: An Exploration of Short-Term Changes in Motivational Beliefs Among Engineering Undergraduates. J. Eng. Educ. 2018, 107, 11–29. [Google Scholar] [CrossRef]
- Choi, Y. Student Employment and Persistence: Evidence of Effect Heterogeneity of Student Employment on College Dropout. Res. High. Educ. 2018, 59, 88–107. [Google Scholar] [CrossRef]
- Geisinger, B.N.; Raman, D.R. Why They Leave: Understanding Student Attrition from Engineering Majors? Int. J. Eng. Educ. 2013, 29, 914–925. Available online: https://lib.dr.iastate.edu/abe_eng_pubs/607 (accessed on 25 March 2021).
- Kuley, E.A.; Maw, S.; Fonstad, T. Engineering Student Retention and Attrition Literature Review. In Proceedings of the Canadian Engineering Education Association, Hamilton, ON, Canada, 31 May–3 June 2015; Available online: https://ojs.library.queensu.ca/index.php/PCEEA/article/view/5813/pdf (accessed on 25 March 2021).
- Bandura, A. Self-Efficacy: The Exercise of Control; W.H. Freeman: New York, NY, USA, 1997. [Google Scholar]
- Meyer, M.; Marx, S. Engineering Dropouts: A Qualitative Examination of Why Undergraduates Leave Engineering. J. Eng. Educ. 2014, 103, 525–548. [Google Scholar] [CrossRef]
- Roldán-Riejos, A.M.; Úbeda-Mansilla, P. Metaphor use in a specific genre of engineering discourse. Eur. J. Eng. Educ. 2006, 31, 531–541. [Google Scholar] [CrossRef]
- Lopes, L.L. Between Hope and Fear: The Psychology of Risk. In Advances in Experimental Social Psychology; Berkowitz, L., Ed.; Academic Press: Cambridge, MA, USA, 1987; Volume 20, pp. 255–295. [Google Scholar] [CrossRef]
- Arnold, K.E.; Pistilli, M.D. Course signals at Purdue: Using learning analytics to increase student success. In LAK ’12: Proceedings of the 2nd International Conference on Learning Analytics and Knowledge; ACM: New York, NY, USA, 2012; pp. 267–270. [Google Scholar] [CrossRef]
- van der Aalst, W. Process Mining: The Missing Link. In Process Mining: Data Science in Action; van der Aalst, W., Ed.; Springer: Berlin/Heidelberg, Germany, 2016. [Google Scholar] [CrossRef]
- Martin, N.; De Weerdt, J.; Fernández-Llatas, C.; Gal, A.; Gatta, R.; Ibáñez, G.; Johnson, O.; Mannhardt, F.; Marco-Ruiz, L.; Mertens, S. Recommendations for enhancing the usability and understandability of process mining in healthcare. Artif. Intell. Med. 2020, 109, 101962. [Google Scholar] [CrossRef]
- Utama, N.I.; Sutrisnowati, R.A.; Kamal, I.M.; Bae, H.; Park, Y.-J. Mining Shift Work Operation from Event Logs. Appl. Sci. 2020, 10, 7202. [Google Scholar] [CrossRef]
- Van Der Aalst, W.M. A practitioner’s guide to process mining: Limitations of the directly-follows graph. Procedia Comput. Sci. 2019, 164, 321–328. [Google Scholar] [CrossRef]
- Bin Ahmadon, M.A.; Yamaguchi, S. Verification Method for Accumulative Event Relation of Message Passing Behavior with Process Tree for IoT Systems. Information 2020, 11, 232. [Google Scholar] [CrossRef]
- van Eck, M.L.; Lu, X.; Leemans, S.J.J.; van der Aalst, W.M.P. PM^2: A Process Mining Project Methodology. In Advanced Information Systems Engineering; Zdravkovic, J., Kirikova, M., Johannesson, P., Eds.; Springer: Cham, Switzerland, 2015; pp. 297–313. [Google Scholar] [CrossRef]
- Dumas, M.; la Rosa, M.; Mendling, J.; Reijers, H.A. Introduction to Business Process Management. In Fundamentals of Business Process Management; Springer: Berlin/Heidelberg, Germany, 2013. [Google Scholar] [CrossRef]
- Maldonado-Mahauad, J.; Pérez-Sanagustín, M.; Kizilcec, R.F.; Morales, N.; Munoz-Gama, J. Mining theory-based patterns from Big data: Identifying self-regulated learning strategies in Massive Open Online Courses. Comput. Hum. Behav. 2018, 80, 179–196. [Google Scholar] [CrossRef]
- Johnson, O.A.; Dhafari, T.B.; Kurniati, A.; Fox, F.; Rojas, E. The ClearPath Method for Care Pathway Process Mining and Simulation. In Business Process Management Workshops; Springer International Publishing: Cham, Switzerland, 2019; Volume 342, pp. 239–250. [Google Scholar] [CrossRef]
- Lorenz, R.; Senoner, J.; Sihn, W.; Netland, T. Using process mining to improve productivity in make-to-stock manufacturing. Int. J. Prod. Res. 2021, 1–12. [Google Scholar] [CrossRef]
- Reimann, P.; Markauskaite, L.; Bannert, M. e-Research and learning theory: What do sequence and process mining methods contribute? Br. J. Educ. Technol. 2014, 45, 528–540. [Google Scholar] [CrossRef]
- Zhou, X.; Zacharewicz, G.; Chen, D.; Chu, D. A Method for Building Service Process Value Model Based on Process Mining. Appl. Sci. 2020, 10, 7311. [Google Scholar] [CrossRef]
- Salazar-Fernandez, J.P.; Sepúlveda, M.; Munoz-Gama, J. Influence of student diversity on educational trajectories in engineering high-failure rate courses that lead to late dropout. In Proceedings of the 2019 IEEE Global Engineering Education Conference (EDUCON), Dubai, United Arab Emirates, 9–11 April 2019; pp. 607–616. [Google Scholar] [CrossRef]
- Berti, A.; van Zelst, S.J.; van der Aalst, W. Process mining for python (PM4Py): Bridging the gap between process-and data science. arXiv 2019, arXiv:1905.06169. [Google Scholar]
- Janssenswillen, G.; Depaire, B.; Swennen, M.; Jans, M.; Vanhoof, K. bupaR: Enabling reproducible business process analysis. Knowl. Based Syst. 2019, 163, 927–930. [Google Scholar] [CrossRef]
- Günther, C.W.; Rozinat, A. Disco: Discover Your Processes; BPM (Demos): Tallin, Estonia, 2012; Volume 940, pp. 40–44. Available online: http://ceur-ws.org/Vol-940/paper8.pdf (accessed on 25 March 2021).
- Geyer-Klingeberg, J.; Nakladal, J.; Baldauf, F.; Veit, F. Process Mining and Robotic Process Automation: A Perfect Match. In Proceedings of the International Conference on Business Process Management, Sydney, Australia, 9–14 September 2018; pp. 1–8, 124–131. Available online: http://ceur-ws.org/Vol-2196/BPM_2018_paper_28.pdf (accessed on 25 March 2021).
- Kember, D.; Leung, D.; Prosser, M. Has the open door become a revolving door? The impact on attrition of moving from elite to mass higher education. Stud. High. Educ. 2021, 46, 258–269. [Google Scholar] [CrossRef]
- Rodríguez-Gómez, D.; Meneses, J.; Gairín, J.; Feixas, M.; Muñoz, J.L. They have gone, and now what? Understanding re-enrolment patterns in the Catalan public higher education system. High. Educ. Res. Dev. 2016, 35, 815–828. [Google Scholar] [CrossRef]
- Stump, G.S.; Husman, J.; Corby, M. Engineering Students’ Intelligence Beliefs and Learning. J. Eng. Educ. 2014, 103, 369–387. [Google Scholar] [CrossRef]
- Suresh, R. The Relationship between Barrier Courses and Persistence in Engineering. J. Coll. Stud. Retent. Res. Theory Pr. 2006, 8, 215–239. [Google Scholar] [CrossRef]
- Haag, S.; Collofello, J. Engineering undergraduate persistence and contributing factors. In Proceedings of the 38th Annual Frontiers in Education Conference, Saratoga Springs, NY, USA, 22–25 October 2008; pp. T4D-8–T4D-14. [Google Scholar] [CrossRef]
- Bernasconi, A. Inclusion Programs at Elite Universities: The Case of Chile. In Mitigating Inequality: Higher Education Research, Policy, and Practice in an Era of Massification and Stratification; Advances in Education in Diverse Communities; Emerald Publishing Limited: Bingley, UK, 2015; Volume 11, pp. 303–310. [Google Scholar] [CrossRef]
- Bose, R.J.C.; Mans, R.S.; Van Der Aalst, W.M. Wanna improve process mining results? In Proceedings of the 2013 IEEE Symposium on Computational Intelligence and Data Mining (CIDM), Singapore, 16–19 April 2013; IEEE: New York, NY, USA, 2013; pp. 127–134. [Google Scholar] [CrossRef]
- Salazar-Fernandez, J.; Sepúlveda, M.; Munoz-Gama, J.; Nussbaum, M. Curricular Analytics to Characterize Educational Trajectories in High-Failure Rate Courses That Lead to Late Dropout. Appl. Sci. 2021, 11, 1436. [Google Scholar] [CrossRef]
- Sage, A.J.; Cervato, C.; Genschel, U.; Ogilvie, C.A. Combining Academics and Social Engagement: A Major-Specific Early Alert Method to Counter Student Attrition in Science, Technology, Engineering, and Mathematics. J. Coll. Stud. Retent. Res. Theory Pract. 2021, 22, 611–626. [Google Scholar] [CrossRef]
- Tariq, Z.; Khan, N.; Charles, D.; McClean, S.; McChesney, I.; Taylor, P. Understanding Contrail Business Processes through Hierarchical Clustering: A Multi-Stage Framework. Algorithms 2020, 13, 244. [Google Scholar] [CrossRef]


| Student ID | Backpack | Starting Date | Ending Date |
|---|---|---|---|
| 23 | AQ | 1 July 2013 | 1 December 2013 |
| 23 | A | 1 December 2013 | 1 February 2014 |
| 23 | RETENTION | 1 February 2014 | 1 February 2014 |
| 24 | Q | 1 July 2013 | 1 December 2013 |
| 24 | DROPOUT | 1 December 2013 | 1 December 2013 |
| Student ID (s) | Period (p) | Course (c) | Grade (g) | Ending Date (d) |
|---|---|---|---|---|
| 23 | 2013-1 | Algebra (A) | 2.0 | 1 July 2013 |
| 23 | 2013-1 | Chemistry (Q) | 3.5 | 1 July 2013 |
| 23 | 2013-1 | Calculus (C) | 4.5 | 1 July 2013 |
| 23 | 2013-1 | Innovation (D) | 5.5 | 1 July 2013 |
| 23 | 2013-2 | Algebra (A) | 3.4 | 1 December 2013 |
| 23 | 2013-2 | Chemistry (Q) | 5.0 | 1 December 2013 |
| 23 | 2013-3 | Algebra (A) | 6.5 | 1 February 2014 |
| 24 | 2013-1 | Algebra (A) | 5.5 | 1 July 2013 |
| 24 | 2013-1 | Chemistry (Q) | 3.5 | 1 July 2013 |
| 24 | 2013-1 | Calculus (C) | 4.5 | 1 July 2013 |
| 24 | 2013-1 | Innovation (D) | 6.0 | 1 July 2013 |
| 24 | 2013-2 | Chemistry (Q) | 3.8 | 1 December 2013 |
| Model | Perspective | Node Type | Transition Type | Filters | Figure |
|---|---|---|---|---|---|
| BPPM | (P1) Final event (DROPOUT or RETENTION) | Number of students | Number of students | Final state: RETENTION; DROPOUT Does not include initial state RETENTION More frequent variants: 80% | Figure 4 |
| average time | Number of students | Final state: RETENTION; DROPOUT Does not include initial state RETENTION More frequent variants: 80% | Figure 5 | ||
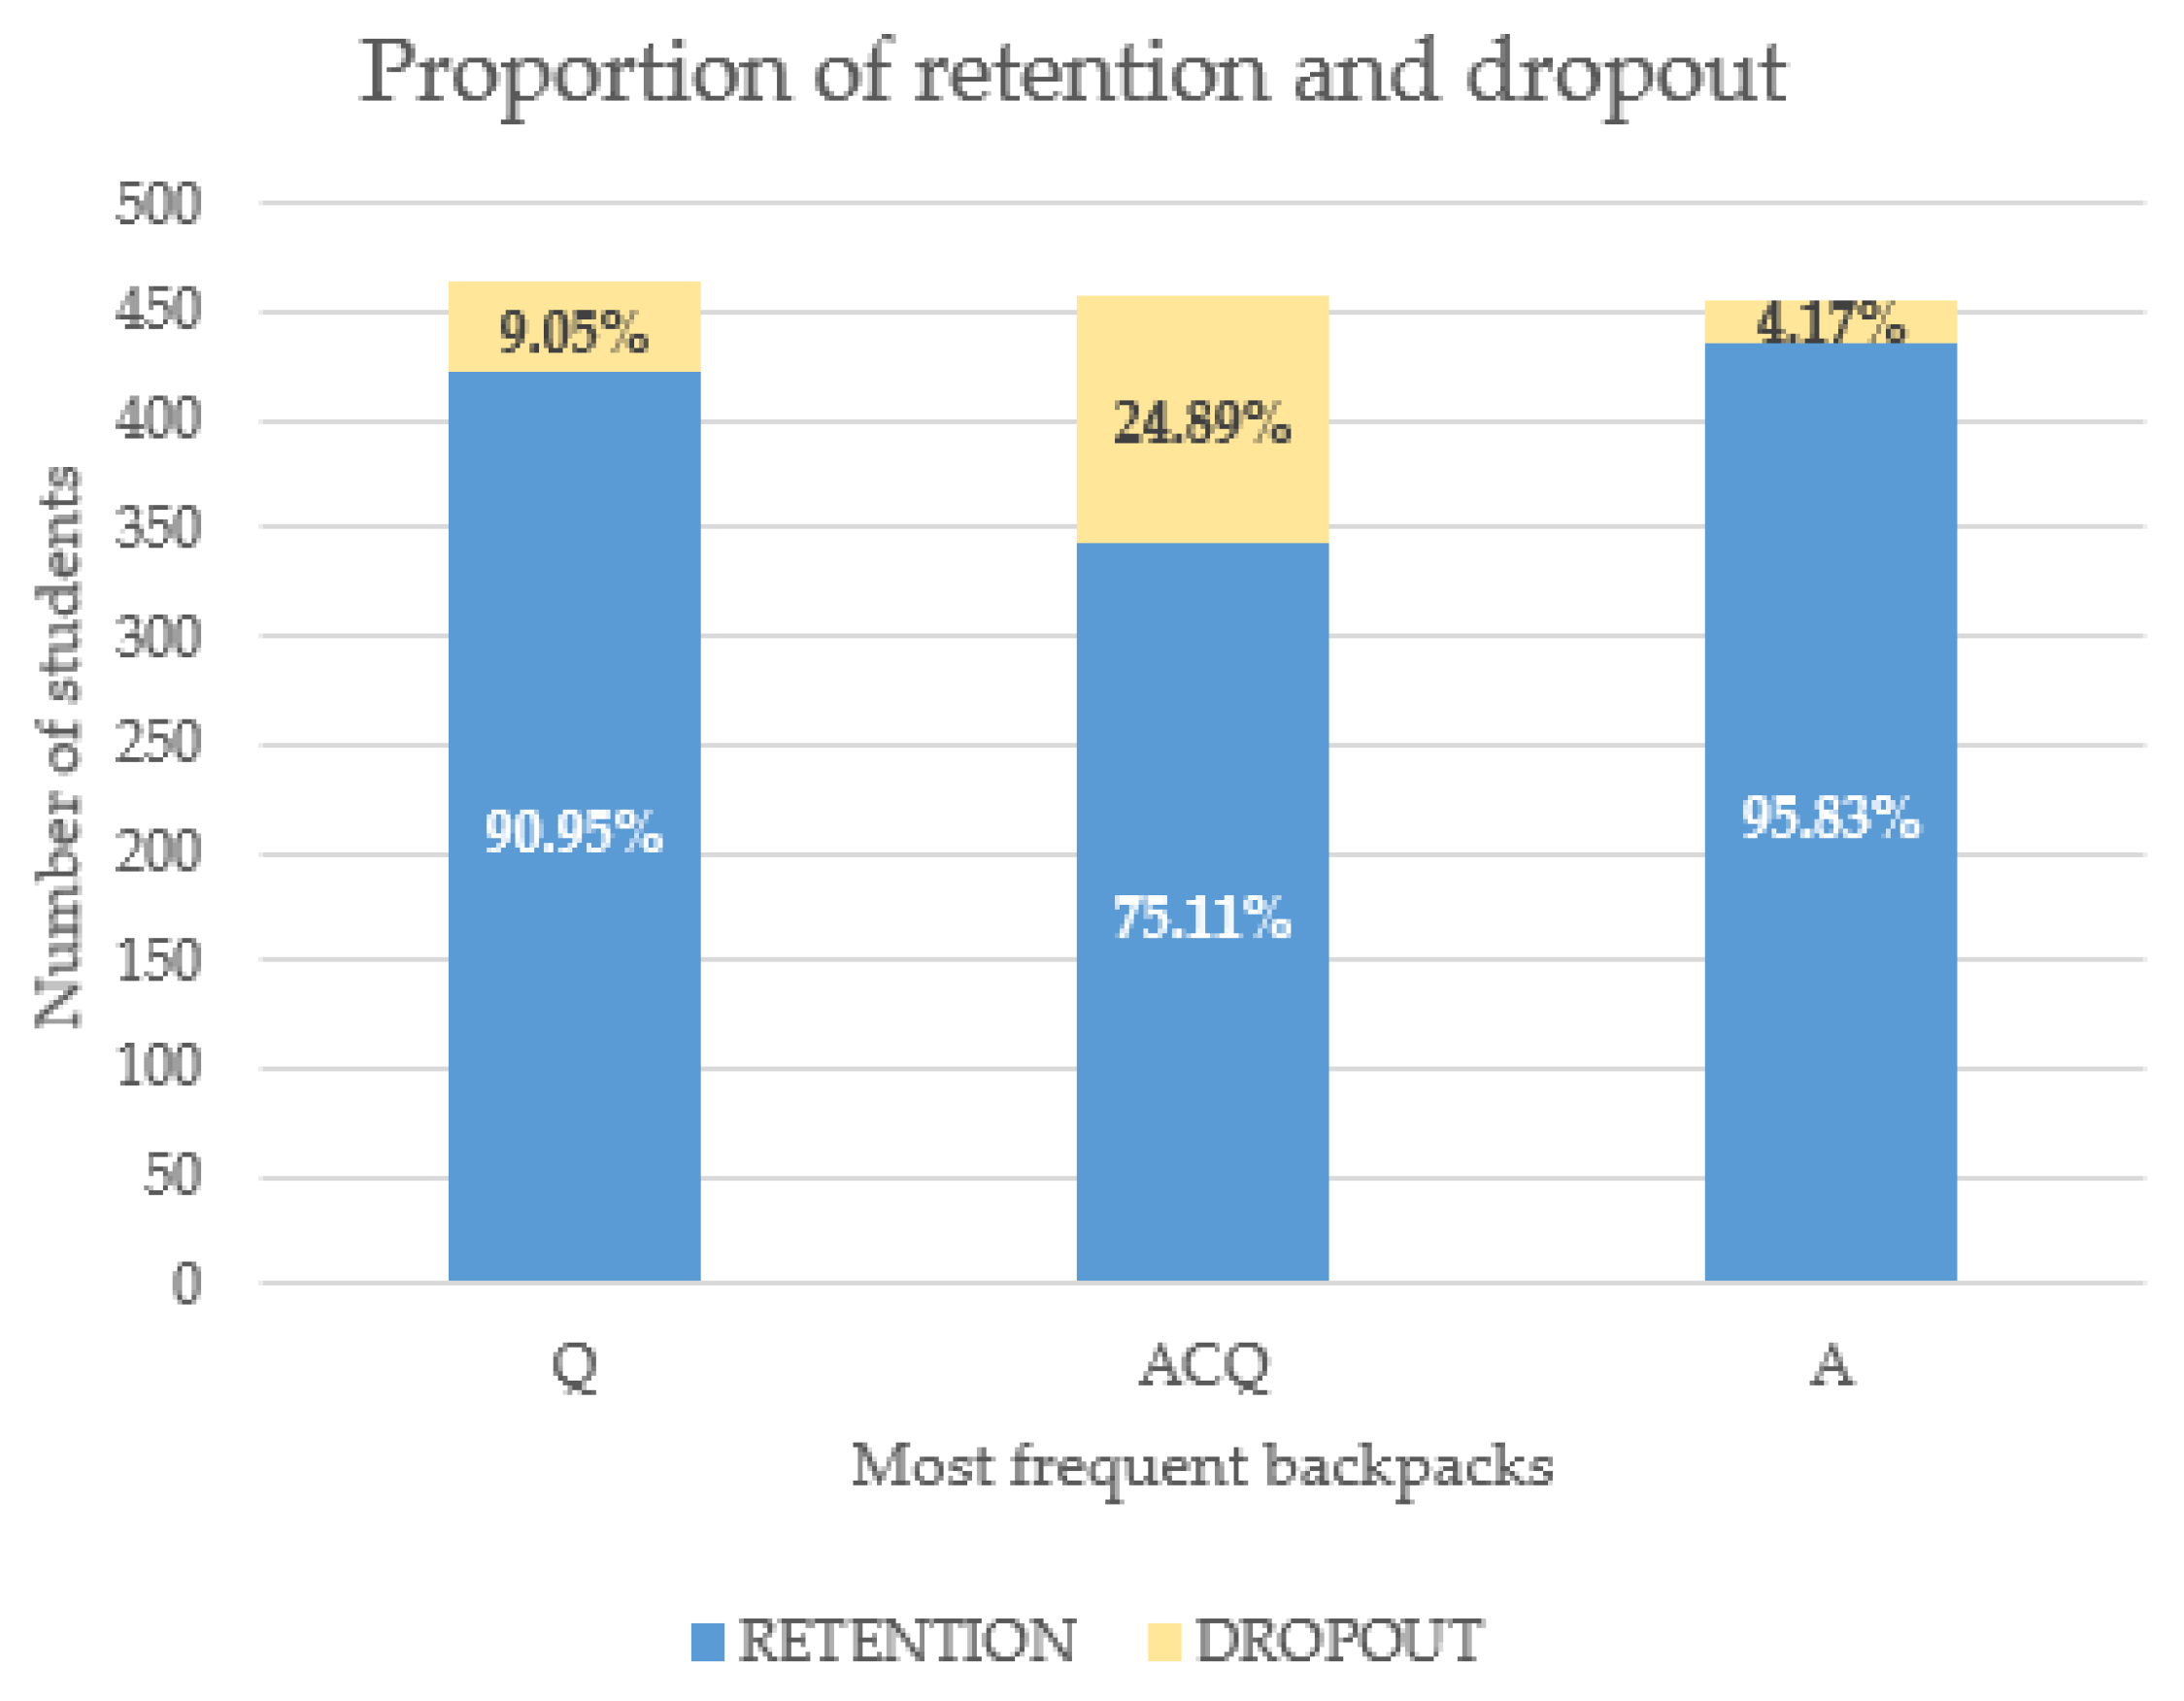
| (P2) Most frequent backpacks | Number of students; % students | Number of students | Does include state A; ACQ; Q Final state: RETENTION; DROPOUT | Figure 6 | |
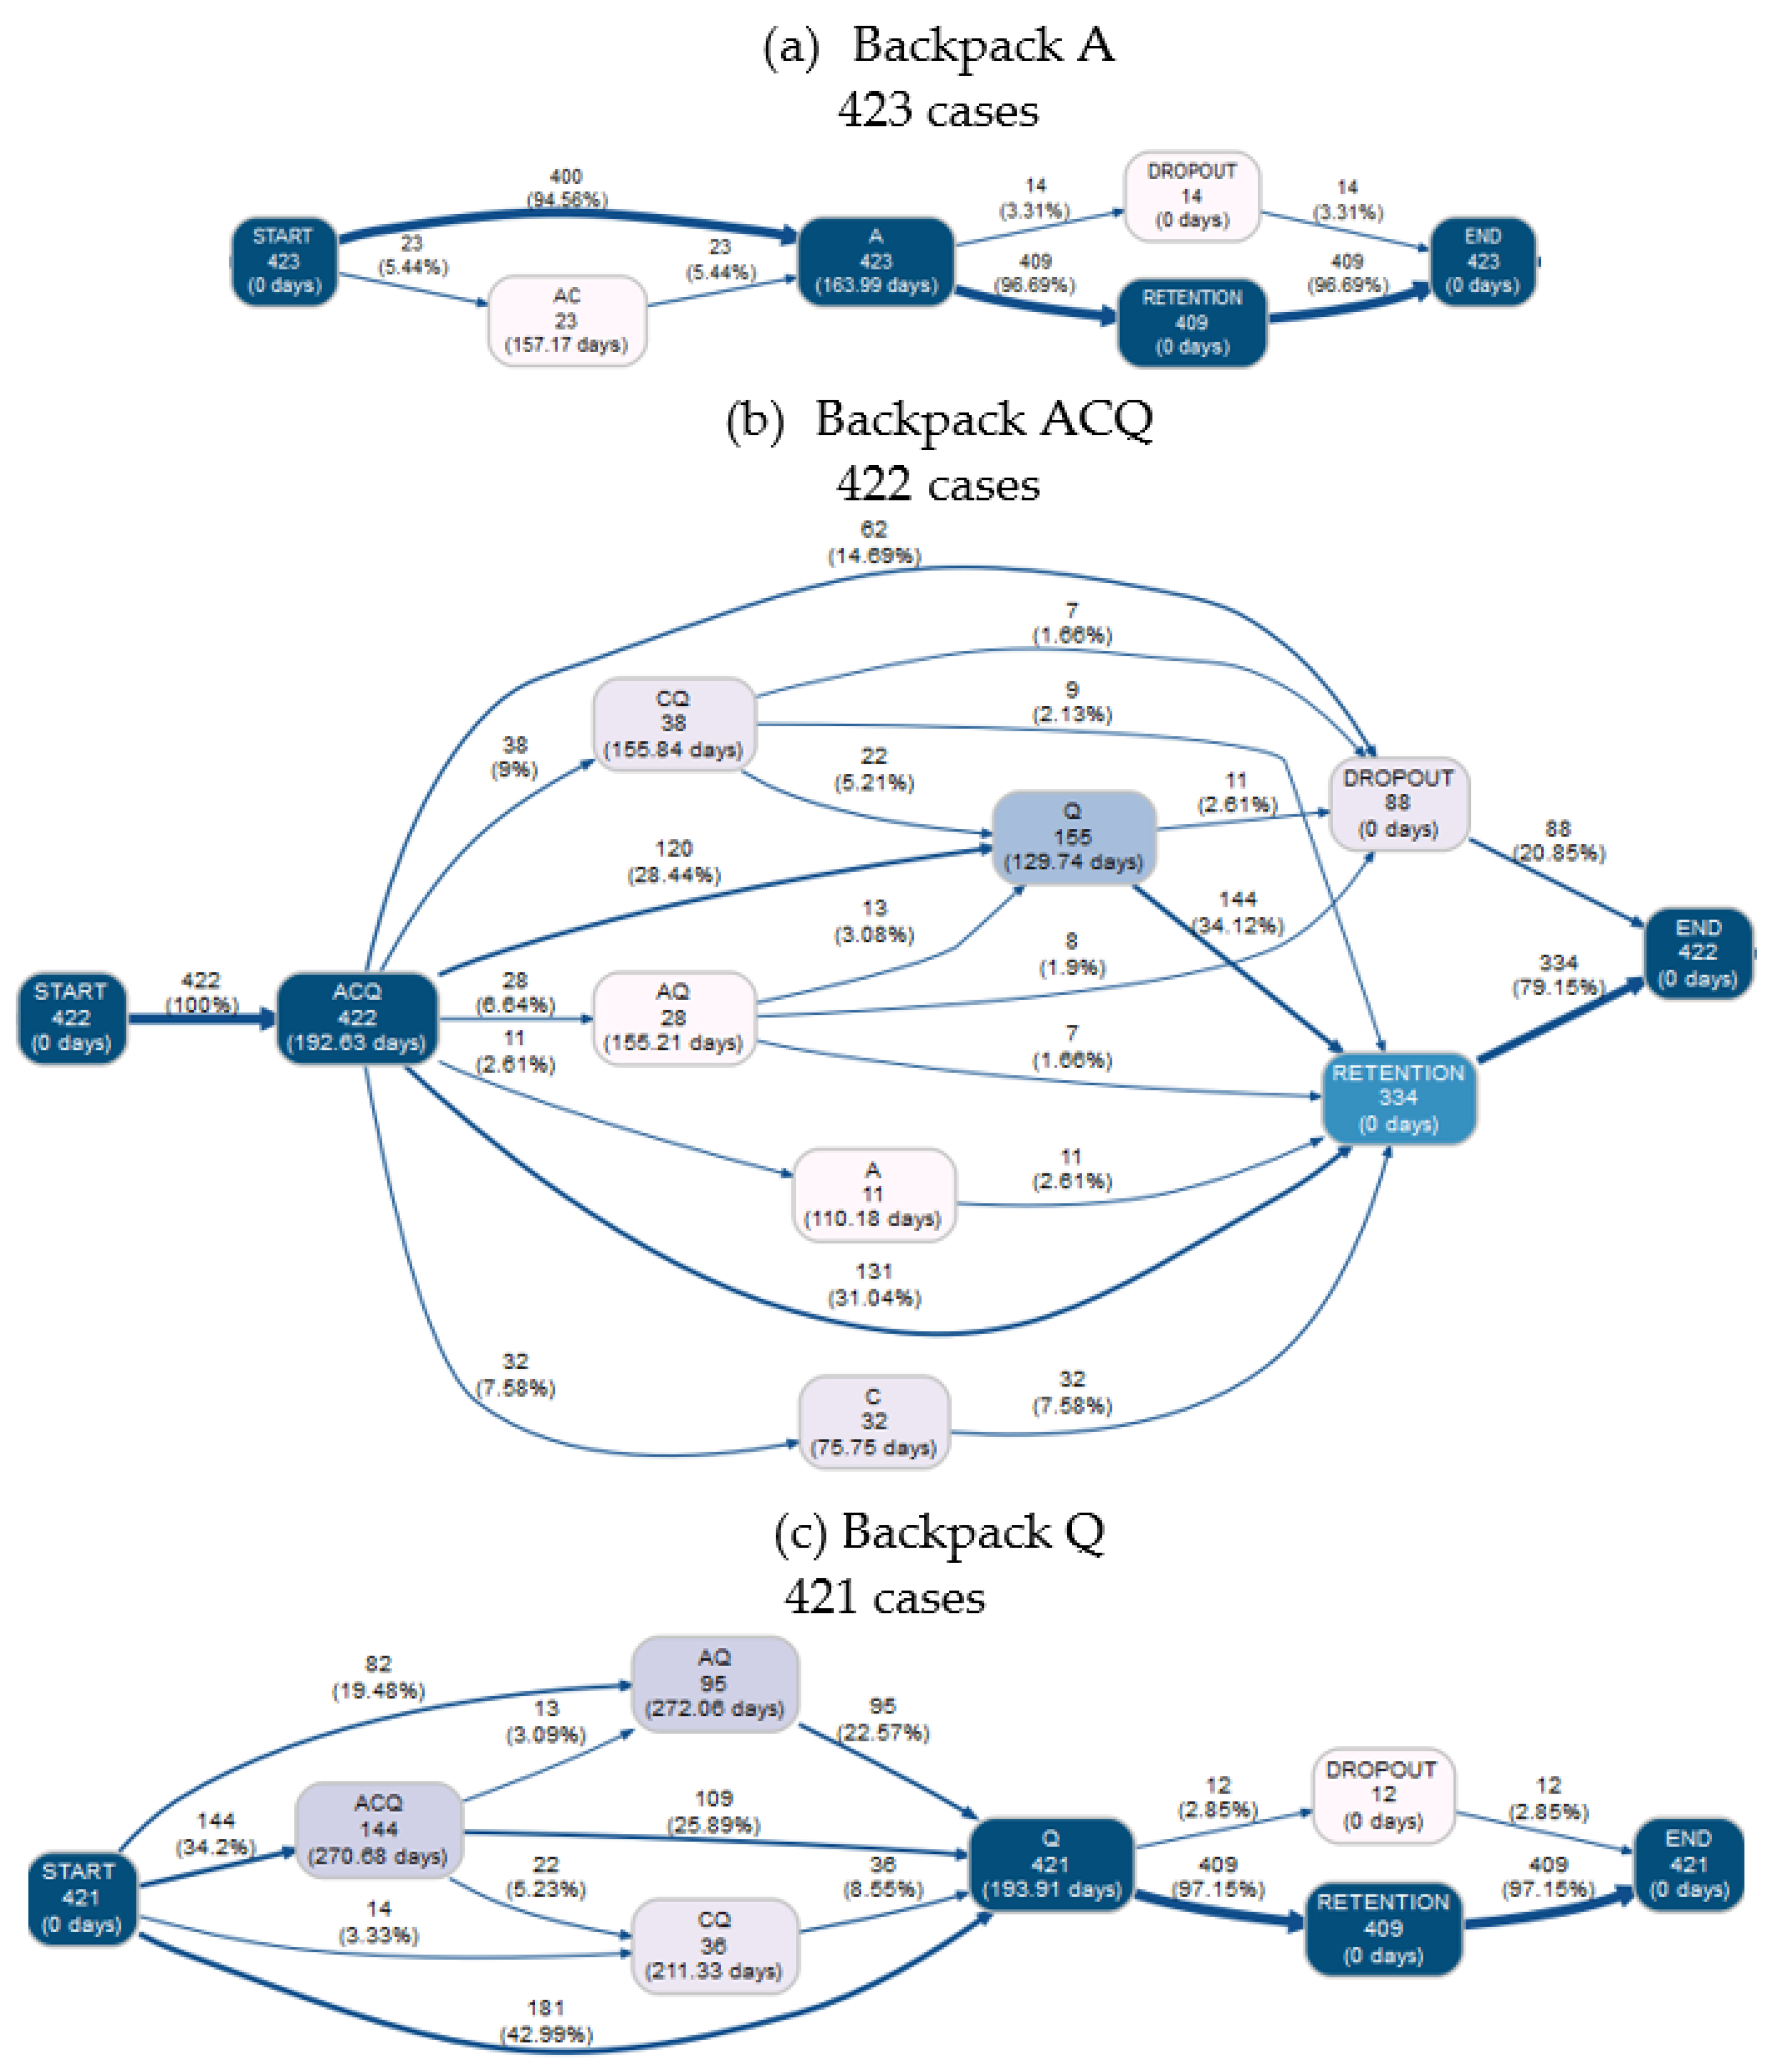
| Number of students | Number of students; % students | Does include state A More frequent variants: 90% | Figure 7a | ||
| Number of students; average time | Number of students; % students | Does include state ACQ More frequent variants: 90% | Figure 7b | ||
| Number of students; average time | Number of students; % students | Does include state Q More frequent variants: 90% | Figure 7c | ||
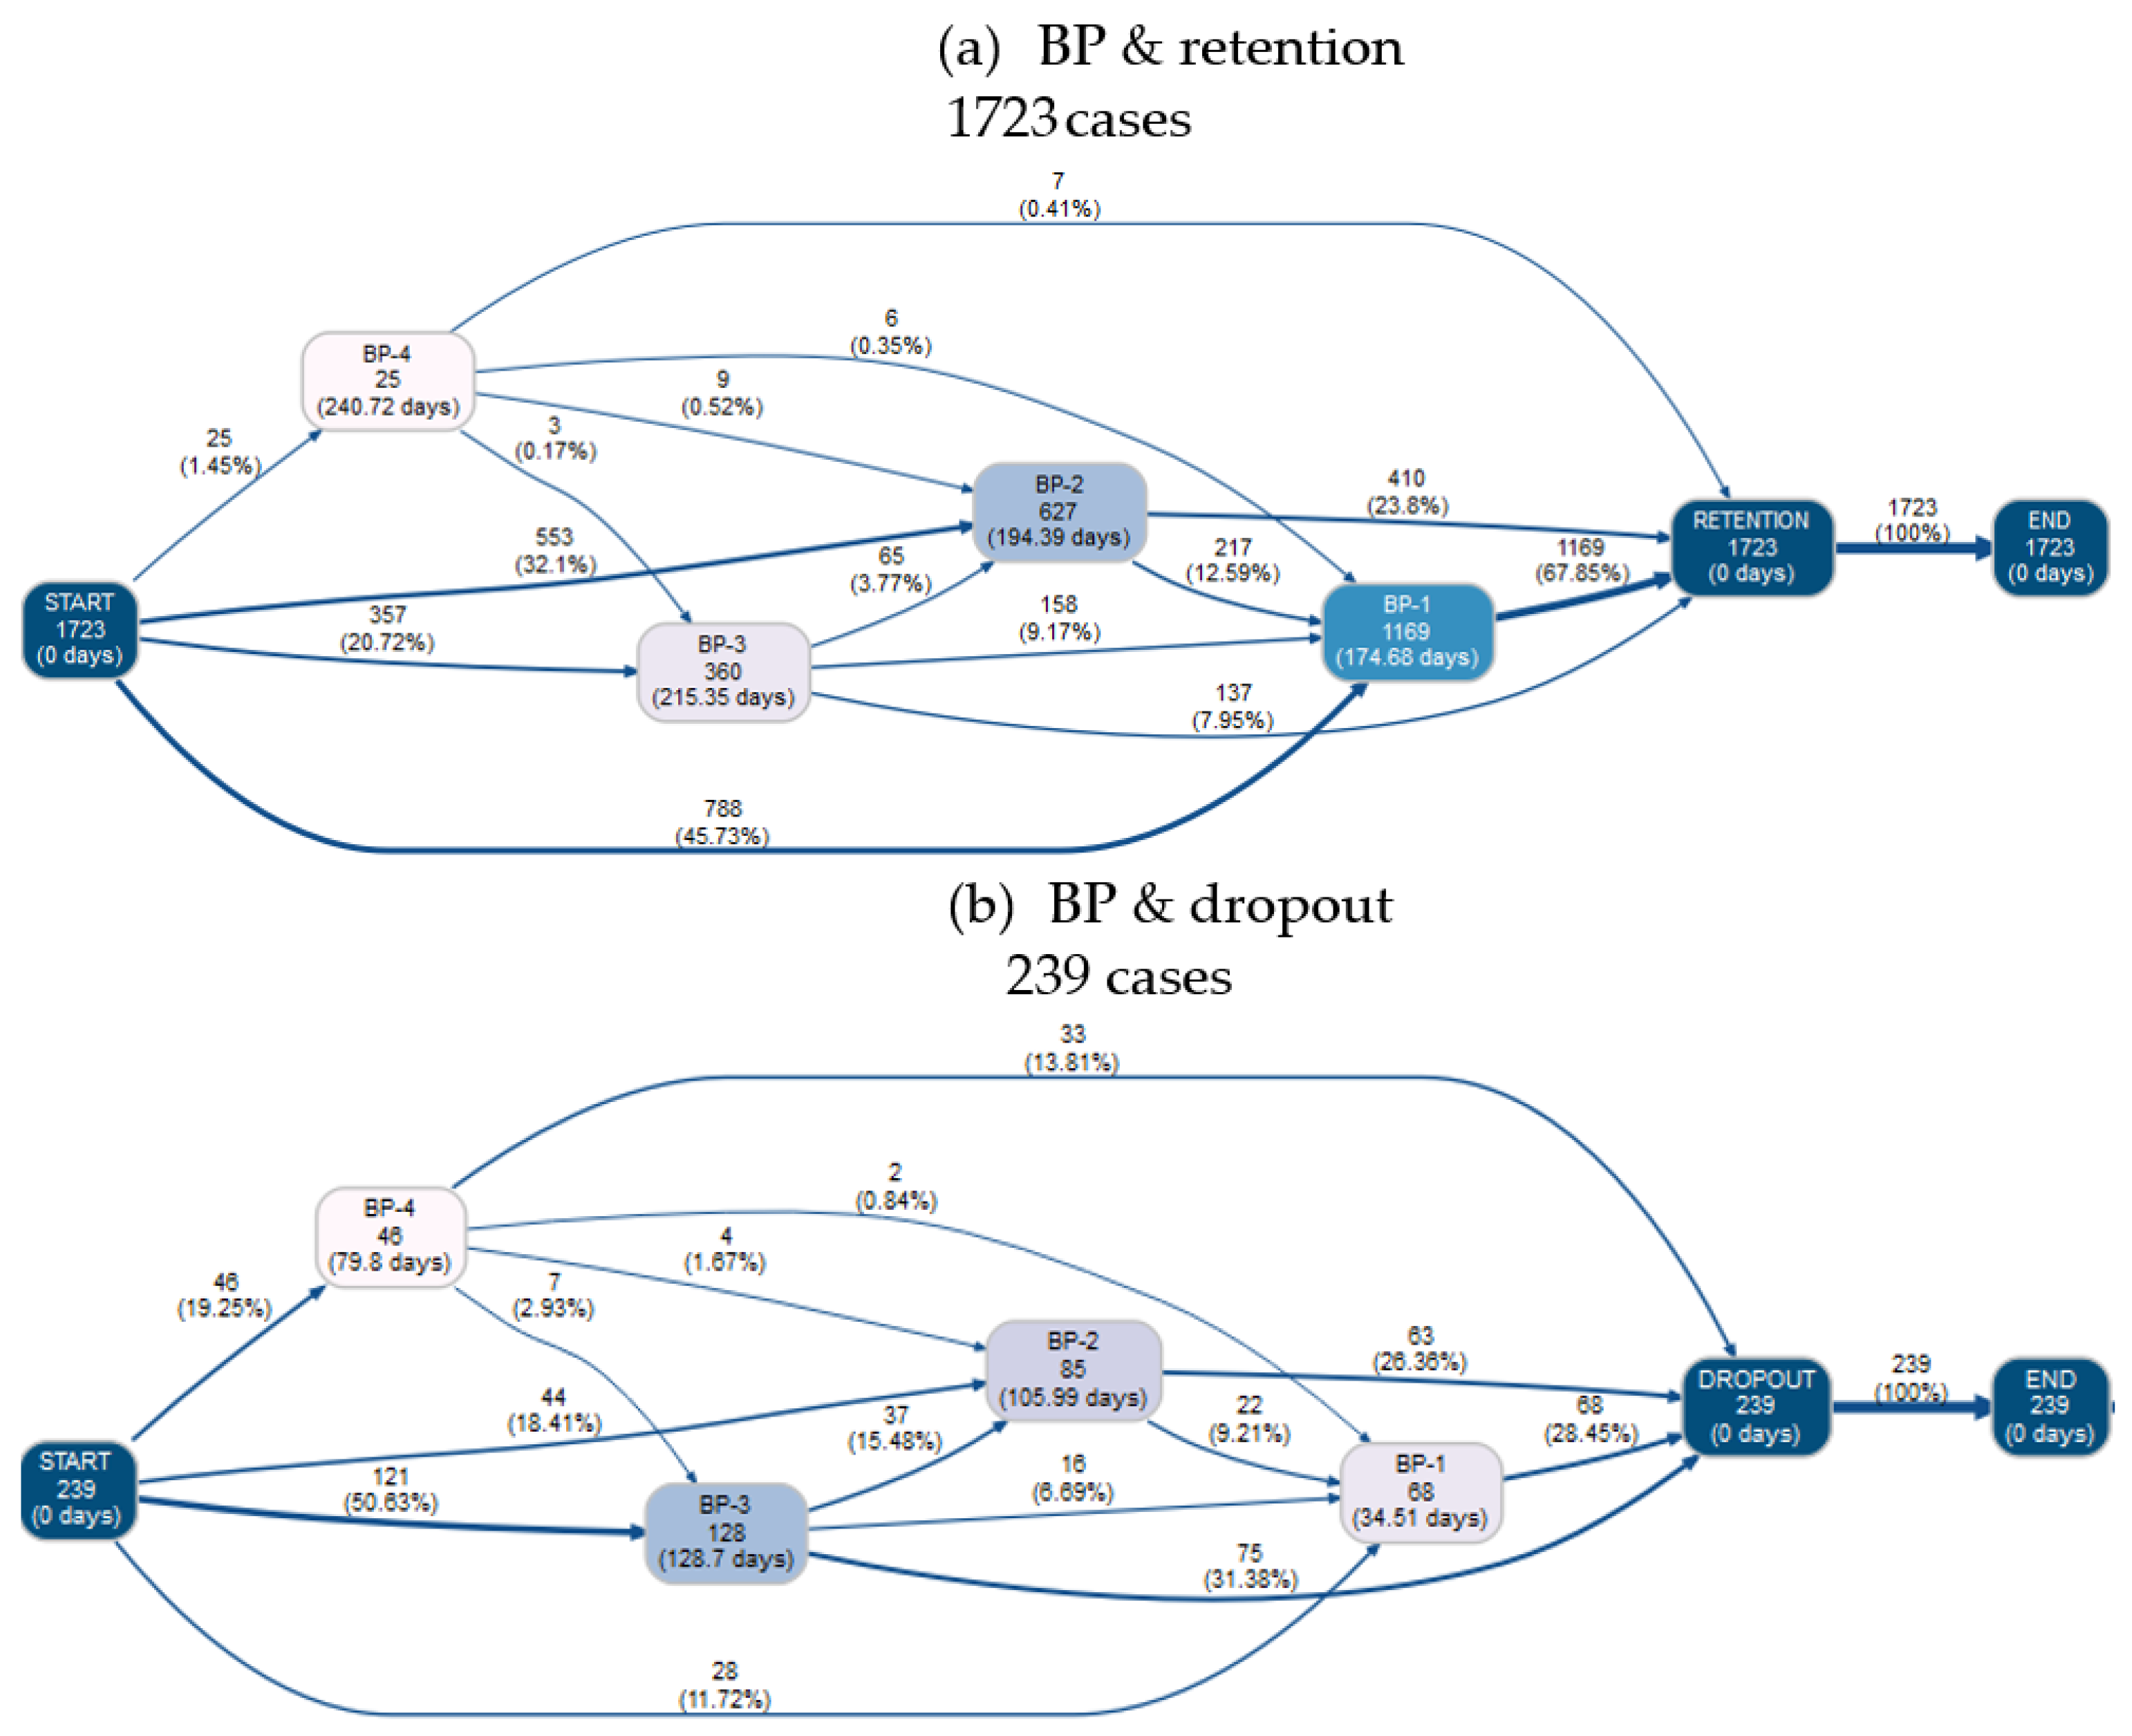
| BPPM-S | (P3) Size of the backpack | Number of students; average time | Number of students; % students | Final state: RETENTIONDoes not include initial state RETENTION | Figure 8a |
| Number of students; average time | Number of students; % students | Final state: DROPOUT | Figure 8b | ||
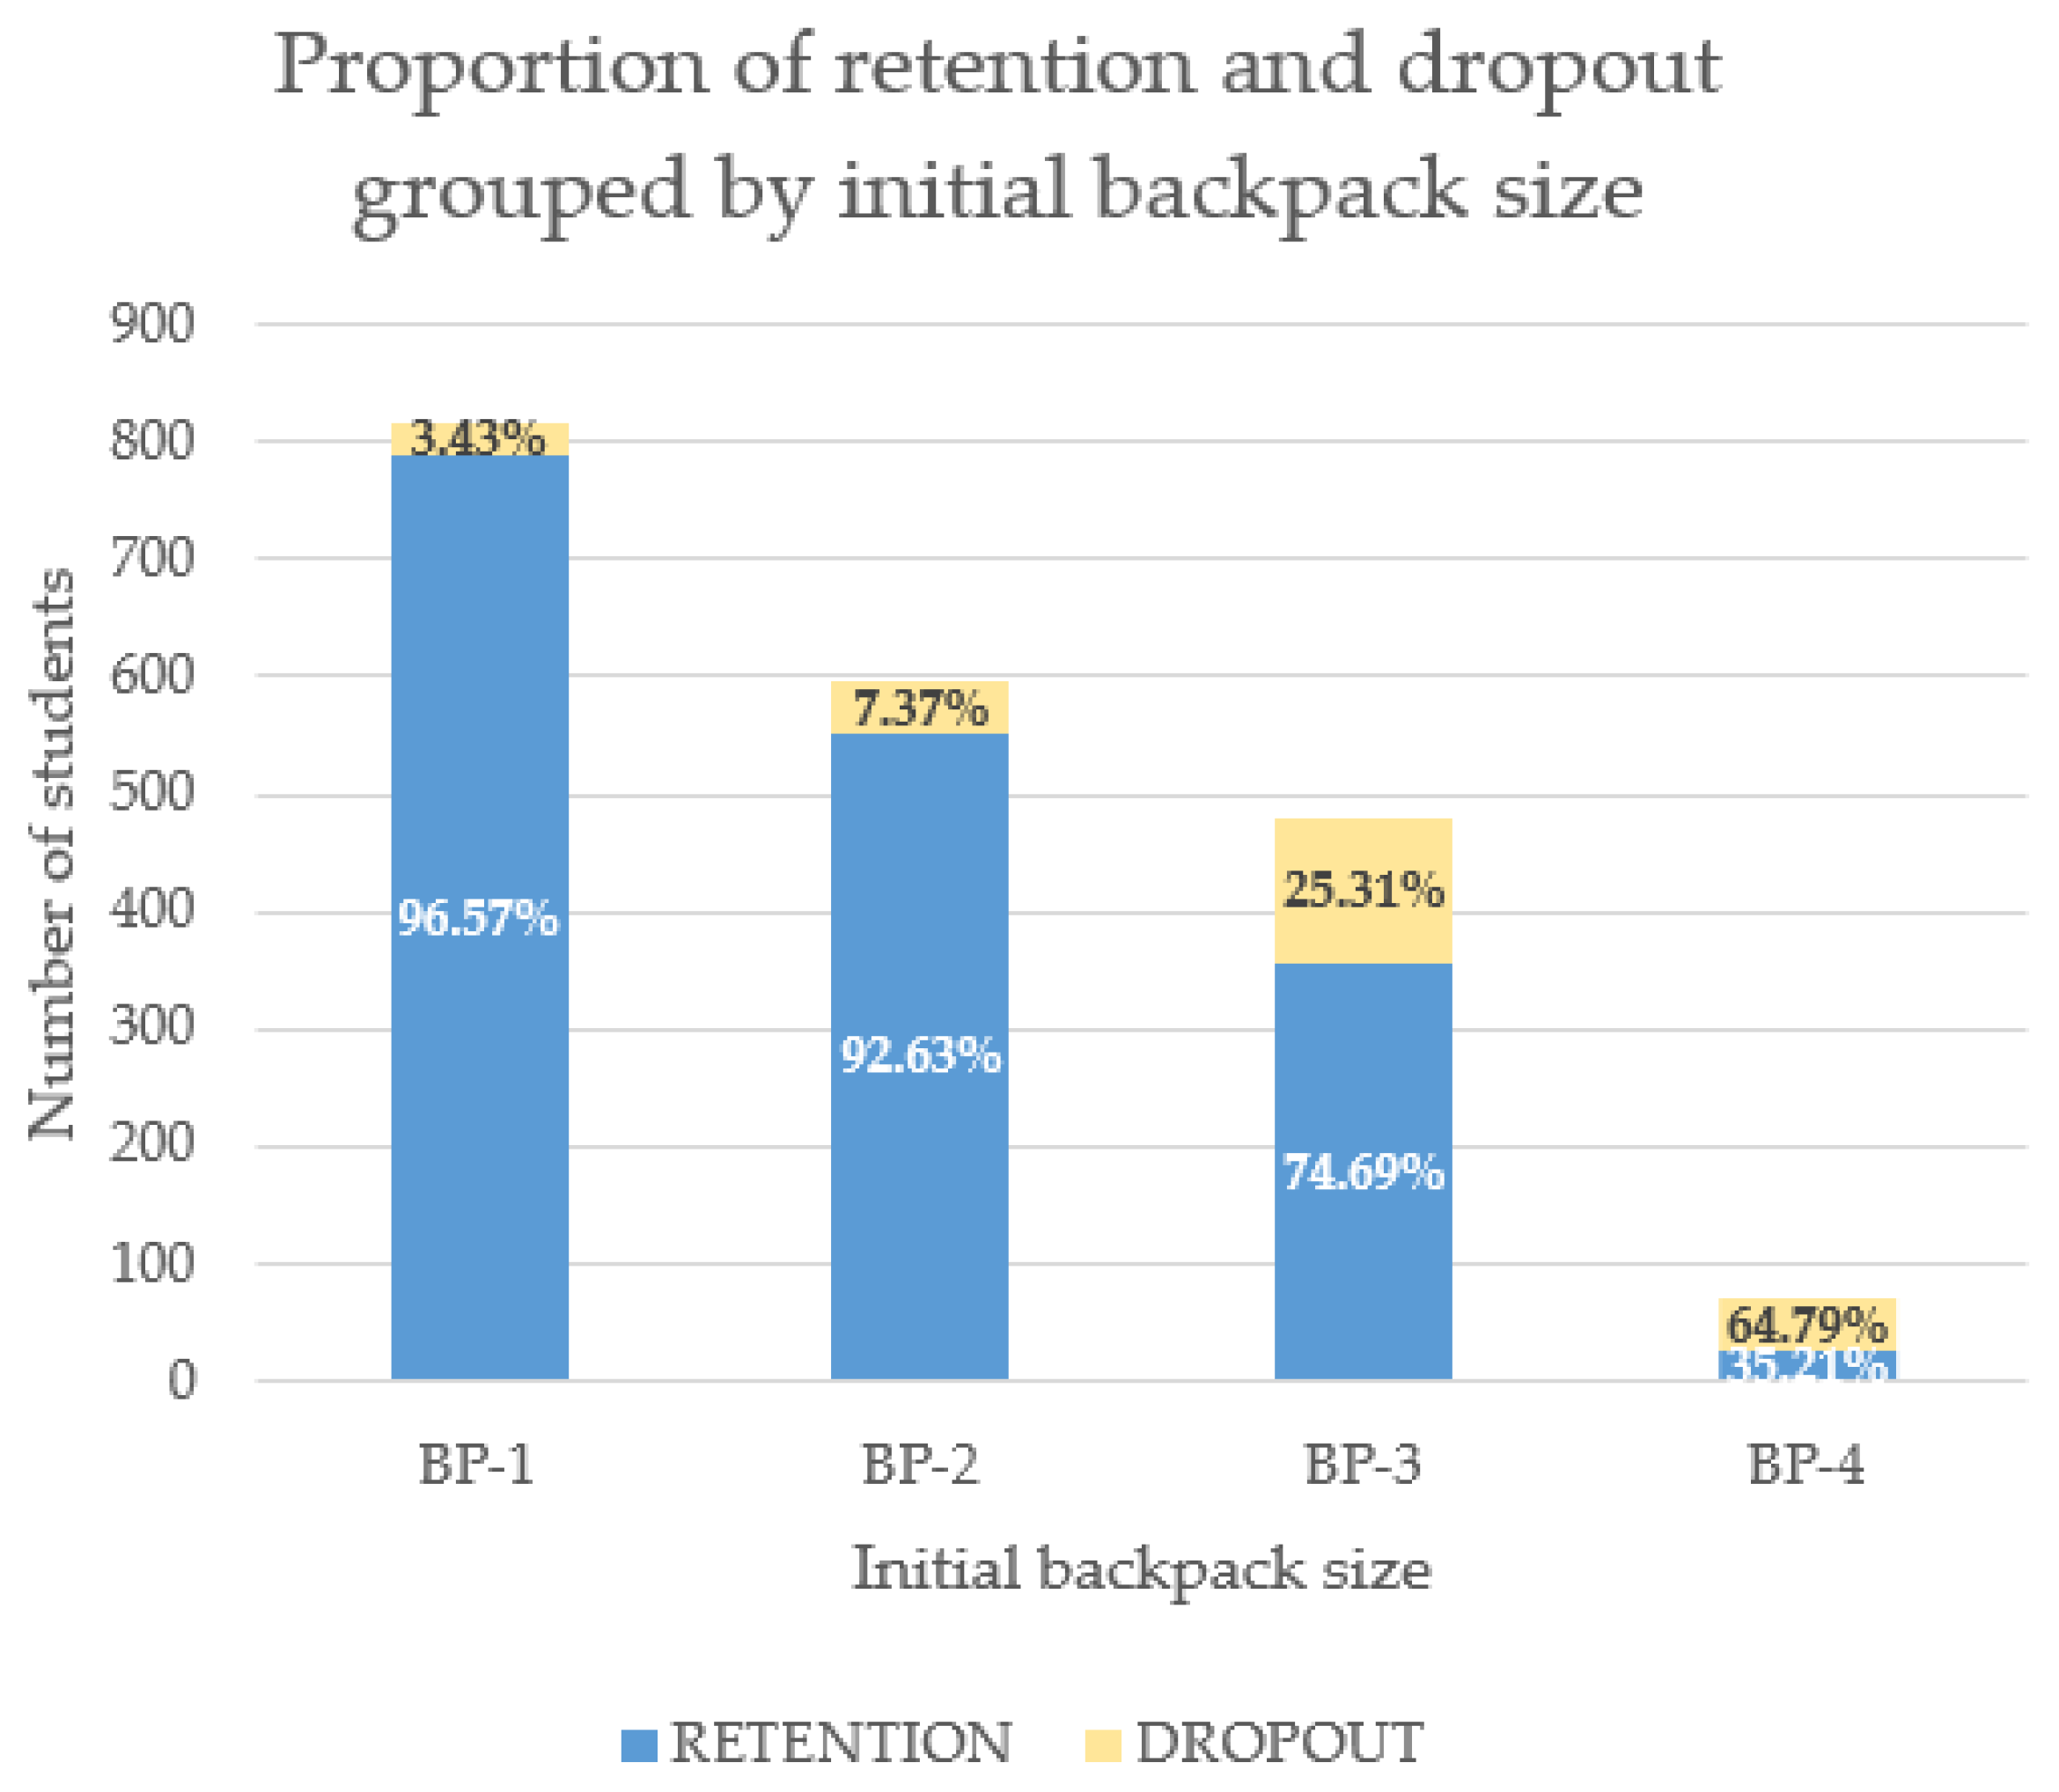
| Number of students; % students | Number of students | Initial state: BP-1; BP-2; BP-3; BP-4Final state: RETENTION; DROPOUT | Figure 9 | ||
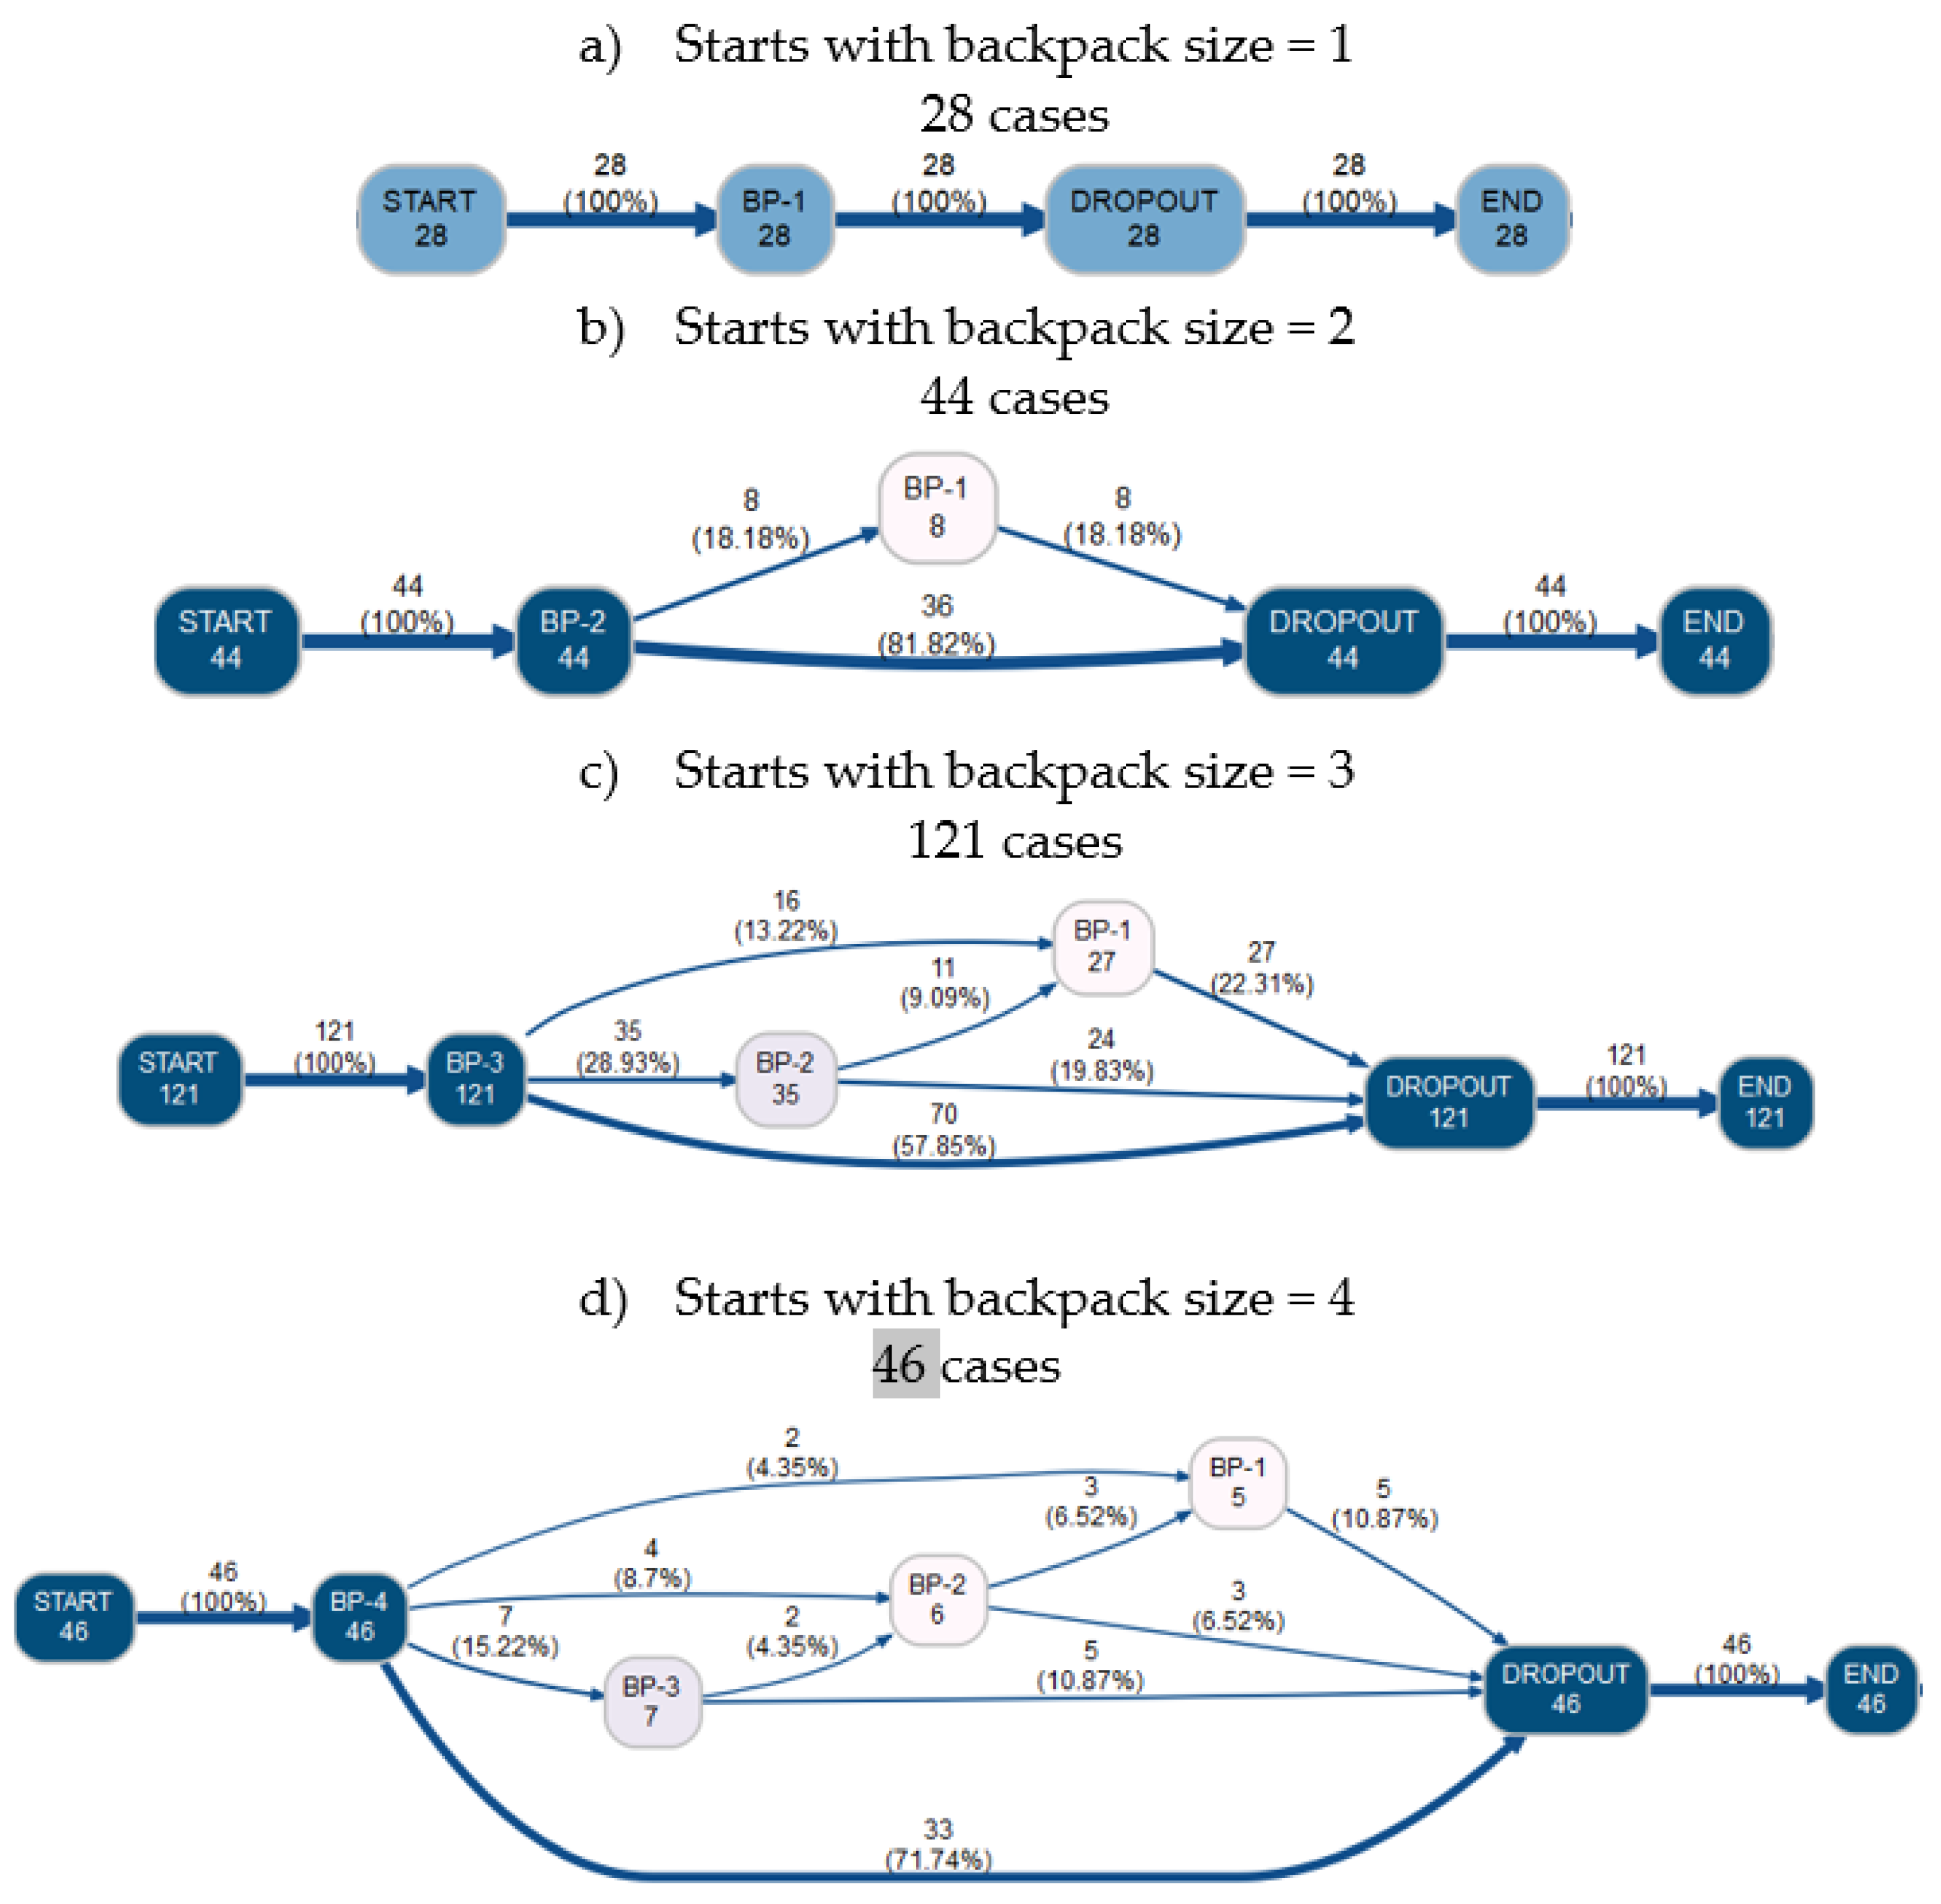
| Number of students; average time | Number of students; % students | Initial state: BP-1 Final state: DROPOUT | Figure 10a | ||
| Number of students; average time | Number of students; % students | Initial state: BP-2 Final state: DROPOUT | Figure 10b | ||
| Number of students; average time | Number of students; % students | Initial state: BP-3 Final state: DROPOUT | Figure 10c | ||
| Number of students; average time | Number of students; % students | Initial state: BP-4 Final state: DROPOUT | Figure 10d |
| Statistics | No BP | BP & Retention | BP & Dropout |
|---|---|---|---|
| Number of cases | 2504 | 1723 | 239 |
| Number of variants | 1 | 51 | 40 |
| Average number of BP events | 0 | 1.27 | 1.37 |
| Std. dev number of BP events | 0 | 0.52 | 0.62 |
| Mean time BP (days) | 0 | 237.74 | 131.80 |
| Std. dev time BP (days) | 0 | 183.71 | 178.48 |
Publisher’s Note: MDPI stays neutral with regard to jurisdictional claims in published maps and institutional affiliations. |
© 2021 by the authors. Licensee MDPI, Basel, Switzerland. This article is an open access article distributed under the terms and conditions of the Creative Commons Attribution (CC BY) license (https://creativecommons.org/licenses/by/4.0/).
Share and Cite
Salazar-Fernandez, J.P.; Munoz-Gama, J.; Maldonado-Mahauad, J.; Bustamante, D.; Sepúlveda, M. Backpack Process Model (BPPM): A Process Mining Approach for Curricular Analytics. Appl. Sci. 2021, 11, 4265. https://doi.org/10.3390/app11094265
Salazar-Fernandez JP, Munoz-Gama J, Maldonado-Mahauad J, Bustamante D, Sepúlveda M. Backpack Process Model (BPPM): A Process Mining Approach for Curricular Analytics. Applied Sciences. 2021; 11(9):4265. https://doi.org/10.3390/app11094265
Chicago/Turabian StyleSalazar-Fernandez, Juan Pablo, Jorge Munoz-Gama, Jorge Maldonado-Mahauad, Diego Bustamante, and Marcos Sepúlveda. 2021. "Backpack Process Model (BPPM): A Process Mining Approach for Curricular Analytics" Applied Sciences 11, no. 9: 4265. https://doi.org/10.3390/app11094265
APA StyleSalazar-Fernandez, J. P., Munoz-Gama, J., Maldonado-Mahauad, J., Bustamante, D., & Sepúlveda, M. (2021). Backpack Process Model (BPPM): A Process Mining Approach for Curricular Analytics. Applied Sciences, 11(9), 4265. https://doi.org/10.3390/app11094265