Featured Application
The findings of this work might be used in the design of restorations of premolars.
Abstract
The main purpose of this work was to analyze the stress distribution in premolars restored with indirect IPS Empress® CAD onlays or inlays. The three-dimensional geometry of a human first premolar was created using modeling software. The tooth fixation system was simulated through box geometry, comprising a cortical bone layer with 2 mm of thickness over a layer of trabecular bone with 15 mm of thickness. The tooth had the following approximated crown dimensions: 10.35 mm buccolingual length; 7.1 mm mesiodistal width; and 7.0 mm cervico-occlusal height. The mesio-occluso-distal (MOD) cavity preparations followed the suggestions available in the literature. The cement geometry was modified to include cohesive zone models (CZM) to perform the adhesive joint’s strength prediction. The loading body was created assuming contact between the food bolus and the tooth surface. Numerical solutions were obtained by performing static analysis and damage analysis using the finite element method. Von Mises stress values generated in the ceramic inlay restoration ranged from 1.39–181.47 MPa, which were on average 4.4% higher than those of the onlay ceramic restoration. The fracture strength of the onlay restoration was about 18% higher than that of the inlay restoration. The onlay design seems to contribute to higher homogenization of the adhesive resin cement strain and higher tooth structure protection.
1. Introduction
The restorative treatment of teeth with a considerable amount of loss structure remains a great challenge because of their susceptibility to fracturing [1,2]. The optimum tooth preparation depends on several design variables, which can vary from the materials used to the cavity geometries, passing through marginal or occlusal surface considerations. Although several variables achieve ideal tooth preparation, the objective is always to prevent fracturing and restore good tooth functionality. Nevertheless, the restoration materials and the cavity design geometry should also ensure a balance between preserving the tooth structure and maximizing the strength of the restoration [2].
In this context, ceramic inlays, onlays, veneers and complete-coverage crowns have gained popularity [3]. Several review studies have been developed to identify if different types of indirect restorations used for single teeth had different biological and technical complications and survival rates [4,5,6]. Within the nine studies selected by Vagropoulou et al., the caries was the main biological complication for all types of restorations, followed by a root or tooth fracture incidence of 11.34%. Ceramic fractures represented the most common technical complication, followed by loss of retention and porcelain chipping. Hence, two different ceramic preparation designs were selected in this study: inlay and onlay. These preparations are often used for indirect restoration when a molar or premolar is too damaged to support a basic filling, but not so severely that it needs a crown [7]. Both structures are prepared outside the patient’s mouth and, posteriorly, are cemented or bonded to the tooth. Both restorations were assumed to be CAD/CAM produced using IPS Empress® CAD (Ivoclar Vivadent, Schaan, Liechtenstein) dental restorative materials, which has been developing modern composites and ceramic-based materials that are almost indistinguishable from natural dentition. These indirect restorations are specially indicated to posterior teeth treatments, wherein they should be capable of offering superior mechanical properties, improved anatomy, proper contour, interproximal contact, marginal adaptation and surface texture [3,8]. Nevertheless, due to the lack of marginal ridges and their specific morphology, the prevalence of fractures in the maxillary premolars is higher than in the molars and mandibular premolars [9].
A great number of in vivo [7,10,11], in vitro [2,3,12] and numerical studies [8,13,14,15] have been developed to evaluate the outcome of several design parameters of the inlay and onlay preparations for the longevity of tooth restoration. In a five-year retrospective study, Arnelund et al. [16] concluded that when comparing inlay and onlay restorations, there was a tendency toward a higher number of failures in the inlay group. Later, in 2005, Stappert et al. [17] reported that teeth with inlays appeared more resistant to fractures than those with onlays. Nevertheless, the results of several finite element studies [18,19,20] show that significant defects in molars and premolars should be restored with ceramic onlays and not inlays. However, in 2011, Cubas et al. [21], in an experimental study of the fracture resistance of premolars restored with inlay and onlay ceramic restorations, showed that cuspid coverage did not result in improved fracture resistance of the restored teeth. Hence, inconsistent and conflicting reported results might be related to the use of different restoration materials, dimensions and criteria for reducing dental cusps and the use of varying experiment set-ups [16,18,19,20,21,22]. Hence, in the present study, preparation of both the onlay and inlay cavities was performed with the same dimensions at the cervical region. The main difference is only the cusps’ material i.e., the height and geometry of the dental cusps are the same for both restorations. This study’s objective was to compare the stress distribution and statistical analysis results of two restorations of a maxillary first premolar using the finite element method, as well as apply cohesive zone models (CZM) to perform strength prediction of the adhesive joint for both restoration geometries.
2. Materials and Methods
2.1. Geometrical Models
The three-dimensional geometry of a human first premolar was created using modeling software (Solidworks® 2019, Dassault Systèmes SOLIDWORKS Corp., Waltham, MA, USA). For this, the anatomical lines referring to each tooth component were constructed, and those corresponding faces were obtained following the anatomical conditions. Afterward, a solid geometry of a first maxillary premolar (tooth 24) with each tooth component was created. The tooth fixation system was simulated through box geometry, comprising a cortical bone layer with 2 mm of thickness over a layer of trabecular bone with 15 mm of thickness. The selected teeth had approximately the following crown dimensions: 10.35 mm buccolingual length, 7.1 mm mesiodistal width and 7.0 mm cervico-occlusal height. Figure 1 shows the final geometry of the assembly. The mesio-occluso-distal (MOD) cavity preparations were developed on the solid model using Boolean operations and the parameters presented in Figure 1. The dimensions of the inlay and onlay restorations followed the suggestions available in the literature [23].
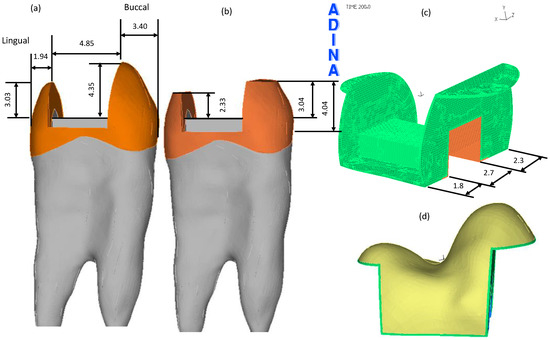
Figure 1.
The MOD cavity preparations. All dimensions are in millimeters. (a) Buccolingual dimensions of the inlay restoration. (b) Buccolingual dimensions of the onlay restoration. (c) Mesiodistal dimensions of both restorations. (d) Buccolingual view of the assemblage between the onlay ceramic restoration (yellow body) and the resin cement (green volume).
In the onlay cavity preparation, the functional cusps were reduced and included in the ceramic restoration (Figure 1d). Moreover, a resin cement layer (RelyX™ Ultimate Adhesive Resin Cement, Technical Data Sheet, 3M ESPE, 3M Deutschland GmbH, Neuss, Germany) with 113 μm of thickness was created for both preparations to cover the entire cavity surfaces. Figure 1c shows the resin cement geometry of the onlay cavity preparation. Additionally, the cement geometry was also modified to include a special “bed” geometry, of which the dimensions are presented in Figure 2, allowing the inclusion of cohesive zone models (CZM) to perform strength prediction of the adhesive joint [24]. The orange area presented in Figure 2a was subtracted from the resin cement geometry while the gray one was subtracted from the dentin geometry, but each one had a thickness of 50 μm. Figure 2b shows a blue surface mesh that represents the cohesive zone. The loading body’s geometry was created assuming glue contact between the food bolus and the tooth surface during the closing phase of the chewing cycle [25,26].
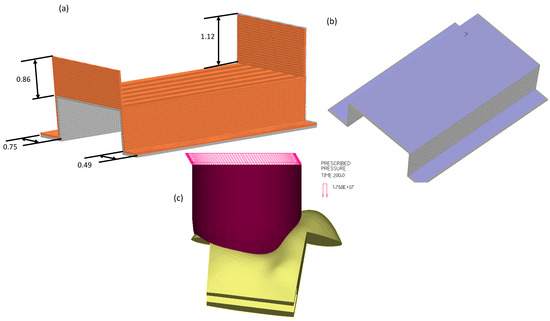
Figure 2.
Cavity preparations. All dimensions are in millimeters. (a) Additional geometry that was created to allow CZM capability. (b) The three blue surfaces are used to identify the CZM. (c) The loading body has a prescribed pressure over the top surface, while the bottom surface is glued to the tooth surface.
2.2. Numerical Models
Each of the two models was numerically studied using ADINA® software for nonlinear finite element analysis (ADINA AUI version 9.3.1, ADINA R &D Inc., Watertown, MA, USA). The contact among components was modeled using the glue mesh option every time that it was assumed that they remained perfectly bonded.
Assignment of the mesh density to each solid body was assured by promoting regular body subdivisions using the desired element edge length. In the bed geometries, which are presented in Figure 2a,b, it was necessary to create regular hexahedral meshes to include cohesive finite elements. Hence, those specific faces’ subdivision was recalculated with smaller lengths to promote a more refined and regular mesh. Table 1 presents the mesh density attributed to each body and the refinement areas. Discretization of the domains was assured with 8-node hexahedral elements, and additional displacement degrees of freedom were allowed by selecting the incompatible modes option.

Table 1.
Length of the element edges attributed to each component and the refinement zones.
This study assumed isotropic linear elastic properties for the all-natural teeth components, ceramic restorations, loading body and the cortical as well as the cancellous bones, but not for the resin cement. The resin’s nonlinear constitutive model was defined using a representative bilinear elastic–plastic stress–strain curve using the information listed in Table 2, whereas the isotropic elastic properties are listed in Table 3. Nevertheless, for the linear static analysis, the resin cement’s mechanical properties included only the linear part. Moreover, because the two finite element models were coupled with cohesive zone models (CZM), it was necessary to define traction–separation laws, critical values of toughness of tension and shear as well as the cohesive strengths of tension and shear [27]. The failure strengths of tension and shear were defined as being 17 MPa and 8 MPa, respectively [28,29]. The critical values of toughness of tension and shear were defined using the procedure described by Zhu and Joyce [30] and are also presented in Table 2.
Table 2.
Mechanical properties of the resin cement adhesive [31,32].
Table 3.
Mechanical properties of all isotropic materials.
Boundary conditions were applied in the five faces of the box that supported the teeth, assuming that the faces were connected to the remaining maxillary bone and, therefore, the three nodal displacements of all nodes placed over those faces were restrained. The load was applied on a 28.3 mm2 circle as a homogenously distributed pressure corresponding to an oblique load of 500 N at 30° to the tooth axis (Figure 2c) [37,38]. The loads were applied gradually to avoid dynamic effects and convergence problems.
3. Results
The linear analysis of both models completed all time steps of computation. In contrast, the onlay and inlay restorations’ nonlinear simulations stopped at incremental steps 66 and 56, respectively, due to excessive deformation of the resin cement. Hence, step 56, corresponding to a 140 N load, was the basis for comparisons among CZM models, whereas for the comparisons among linear solutions of both models, the final time step was used instead. These comparisons were based on the qualitative interpretation of the band plots and quantitative analysis of stress values through different element groups at the same load step. The models’ distribution of values was statistically analyzed using the one-way ANOVA test of the Statistical Package for the Social Sciences (SPSS) version 23.0. Post hoc comparisons were made using a paired samples t-test and a significance level of 0.05.
The inlay and onlay models revealed no significant difference between maximum values of the displacement magnitude, nor in their distribution pattern; the inlay restoration showed a maximum value of 47.4 μm, while the onlay restorations showed a value of 48.0 μm. These results can be seen in Figure 3, where the distribution of the displacement magnitude is presented for both ceramic restorations.
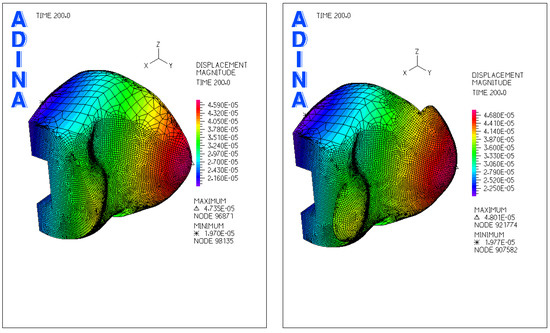
Figure 3.
Band plot of the displacement magnitude (m) over the ceramic restorations for the two models, inlay (left) and onlay (right), with non-matching color scales.
The magnitude of the displacement for the remaining components of both restoration models had similar behavior and, therefore, no further comparisons related to the displacement are presented hereafter.
3.1. Ceramic Restorations
The patterns of stress distribution on both ceramic restorations were similar and are shown in Figure 4a. The inlay model presented the highest values of effective stress. Nevertheless, the highest values appeared in the areas that were in direct contact with the loading body in the occlusal surfaces of both models. The mean von Mises stress was 17 ± 12 MPa, ranging from 1.4 to 181.5 MPa. Statistical descriptive results of the von Mises and maximum shear stresses are presented in Table 4.
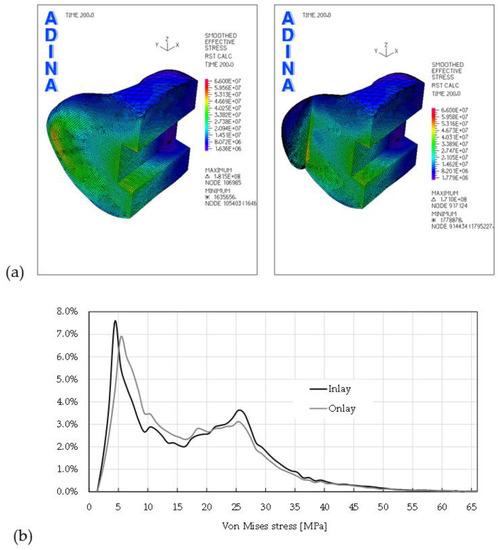
Figure 4.
Smoothed stress distributions of the restoration models. (a) Inlay (left) and onlay (right). (b) Histograms of the distributions for both models.
Table 4.
Statistical description of the stress distributions for the ceramic restorations.
Figure 4b shows the histogram of the material level loading distribution for both restorations, i.e., on the inlay and onlay geometries. The geometry that had a greater percentage of material loaded within the range of 5–20 MPa was the onlay, whereas for loading levels higher than 20 MPa, the inlay had a greater percentage of material.
3.2. Resin Cement Adhesive
The von Mises stress distributions in the resin cement adhesives are shown in Figure 5a. The adhesive of the inlay model presented the highest values of effective stress, and the area where the highest values were encountered was placed on the buccal side. The mean von Mises stress was 9.93 ± 6.86 MPa, ranging from 0.59 to 33.28 MPa. The descriptive statistical results of this stress and the maximum shear stress are presented in Table 5 for both restorations. Figure 5b shows the histogram of the adhesive level loading distribution for both restorations. Once more, the geometry that had a greater percentage of material loaded within the range of 5–10 MPa was the onlay, whereas for loading levels higher than 27.5 MPa, the inlay had a greater percentage of material.
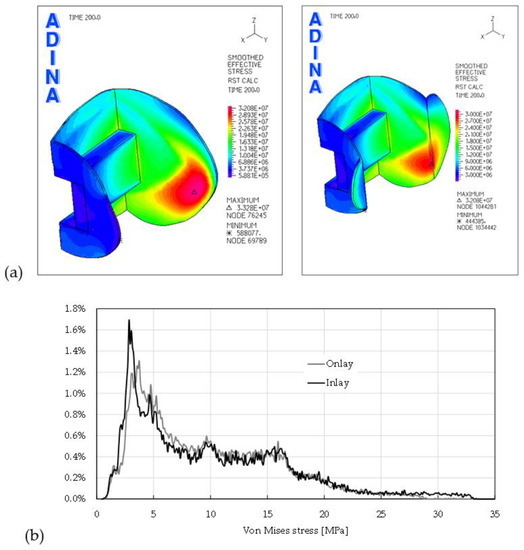
Figure 5.
Smoothed stress distributions for the adhesives of both models. (a) Inlay (left) and onlay (right). (b) Histograms of the distributions for both models.
Table 5.
Statistical description of the stress distributions for the resin cement adhesives.
The total percentage of adhesive material that was loaded behind 27.5 MPa was 0.42% in the onlay geometry and 2.5% in the inlay restoration, which meant that at this level of loading, the variation of material between the two restorations was about 83.4%.
Analysis of the solicitation level over the two “bed” geometries was also assured by comparing the von Mises and maximum shear stresses through the two restorations. Table 6 shows the descriptive values and the percentage of variation of the results between the two “bed” geometries.
Table 6.
Statistical description of the stress distributions for the “bed” resin cement adhesives.
Interestingly, because the bed geometries had the same node numbers in both geometries, resulting in 31,386 samples for each, it was possible to perform a paired samples t-test for all values, and the results are presented in Table 7.
Table 7.
Paired differences in the results between pairs of models and statistical analysis with a paired samples t-test, with confidence intervals for the difference for the “bed” resin cement adhesives.
In the inlay restoration, the magnitude of displacements was, on average, 26.05 ± 2.96 μm, and in the onlay model it was 26.18 ± 2.98 μm. The mean difference between the two models was statistically different, with statistical significance t(2, 31385) = −1036.407, p < 0.001. The variation of the different mean stresses between the two models showed similar behavior (i.e., the onlay model had the highest values, except for the second principal stress).
3.3. Enamel
The von Mises stress distribution in the onlay enamel is shown in Figure 6a. The von Mises stresses distribution in the inlay restoration enamel was similar to those presented here, and the maximum values also appeared in the same region. Still, the inlay model presented the highest maximum values. The descriptive statistical results of this stress and the maximum shear stress are presented in Table 8 for both restorations. Figure 5b shows the histogram of the enamel-level loading distributions. The geometry that had a greater percentage of material loaded behind 37 MPa was the onlay, whereas for loading levels smaller than 20 MPa, the inlay had a greater percentage of material.
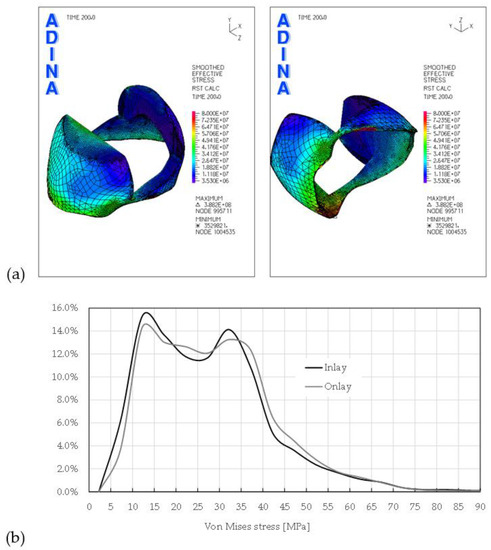
Figure 6.
Smoothed stress distributions on the enamel. (a) Onlay (left side lateral perspective view) and onlay (right side bottom perspective view). (b) Histograms of the distributions for both models.
Table 8.
Statistical description of the stress distributions for the enamel restorations.
3.4. Dentin
The von Mises stress distribution in the dentin of the onlay restoration is shown in Figure 7a. The stress distribution for the inlay restoration dentin was similar, and the main difference was only related to the maximum value, being 167.0 MPa in the onlay model and 175.9 MPa in the inlay model. Figure 7a also shows the von Mises stress distribution in the “bed” dentin. This geometry is placed below the cohesive elements presented in Figure 2b, but it also creates part of the dentin body. The descriptive statistical results of the main stresses are presented in Table 9 for both restorations.
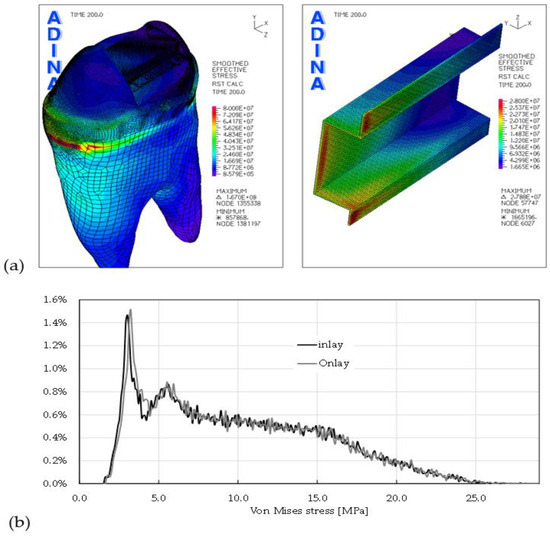
Figure 7.
Smoothed stress distributions of the dentin. (a) Global perspective view (left side) and the “bed” geometry of the dentin (right side). (b) Histograms of the distributions for the “bed” geometry of both models.
Table 9.
Statistical description of the stress distributions for the “bed” geometry at the dentin of both restorations.
The “bed” geometry had the same number of nodes in both restorations, resulting in a total of 26,986 samples for each. Hence, it was possible to perform a paired samples t-test for all values, and the results are presented in Table 10.
Table 10.
Paired differences in the results between pairs of models. Statistical analysis with a paired samples t-test, with confidence intervals for the difference for the “bed” dentin.
3.5. CZM
The results presented in this section were obtained with the assumption that the adhesive resin cement had a yield stress of 21 MPa and plastic bilinear behavior, with an isotropic strain hardening modulus of 770 MPa and rupture stress of about 37 MPa. The adhesive resin cement’s yield point was about 1.24 times the tension failure strength of the interface. This value can be considered small when the interest is adhesion enhancement [39]. Nevertheless, the only information available showed a similar magnitude [40].
Figure 8a shows the von Mises stress distribution in the “bed” adhesive resin of each restoration. The main difference was related to the maximum value, being 211.4 MPa in the inlay model and 204.7 MPa in the onlay model. Note that because the assumption of automatic rupture at the lowest stress–strain point was used, the deformed configurations of both “beds” showed damaged areas without finite elements. Figure 8b shows the von Mises boxplot and the maximum shear stresses at the “beds” without showing the outliers. These outliers were a consequence of the automatic rupture assumption, leading to higher concentration stresses around the zones where finite elements were removed. Therefore, their maximum values were about 100 times higher than the mean value. The descriptive statistical results of these values are presented in Table 11.
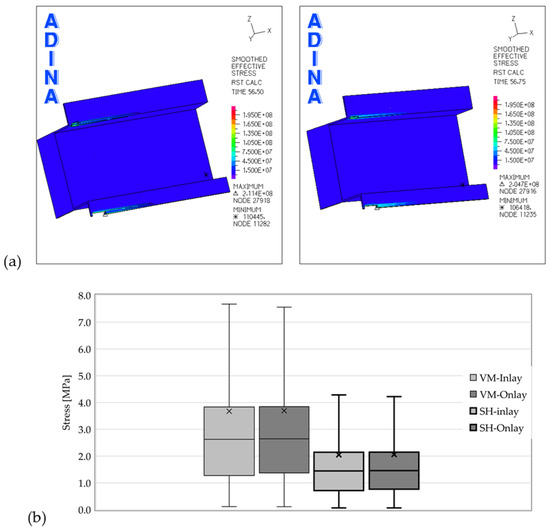
Figure 8.
Smoothed stress distributions for the “bed” adhesive resin cement. (a) Inlay restoration (left side) and onlay restoration (right side). (b) Box plot of the distributions for the two “bed” geometries.
Table 11.
Statistical description of the stress distributions for the “bed” geometry at the adhesive resin cement.
The values presented in Table 11 show that descriptive statistics of both adhesive resin cement beds were quite similar, with the higher variations appearing in the SD, in the first quartile and the maximum values. Other statistical measures that give information about the location and variability of a data set are skewness and kurtosis. These two parameters showed variations to the order of 1.84% and 3.75% for the von Mises stress and 1.76 and 3.48 for the maximum shear stress, respectively.
4. Discussion
The present study focused on evaluating the stress patterns associated with the cavity design of the first maxillary premolar restored with indirect ceramic onlay or inlay geometries when subjected to oblique loading. Two models were compared, one featuring an inlay restoration and the other an onlay restoration, with both restorations having the same geometry for the cervical cavity. Though some finite element studies addressing the biomechanical behavior of the cavity design on teeth restored with inlay or onlay ceramics have been published [19,22,41,42,43,44], the work presented here is, to our knowledge, the first nonlinear analysis presenting the results of damage analysis.
The study’s results seem to indicate that the highest fracture resistance of one restored tooth should be achieved with the onlay cavity restorations. This idea is supported by the nonlinear analysis results, which showed a variation in the maximum load supported by the inlay that was about 17.9% smaller than that supported by the onlay restoration. The similarity of these results with those experimentally reported by Bresser et al. [45] and Kassis et al. [2] contributes to the proximity of the FEM results and those reported in experimental studies. Regarding the experimental results, the assumption that the preparation design influences the fracture strength of ceramic restorations was also valid, and the onlay restorations were significantly stronger than the inlay restorations. Nevertheless, these results contradict other experiments wherein the load cell placement was directly axial to the tooth [3,46,47,48]. In the Bresser et al. [45] experiments, the samples were mounted in a metal base at 15° with the load cell, which was placed at the fossa of the supporting buccal cusp. In the work of Kassis et al. [2], the load cell was oriented on the center of the occlusal surface at 30° relative to the tooth’s long axis. An oblique force relative to the tooth axis will produce normal, shear and bending moment efforts. This might explain why the inlay restorations presented lower fracture strengths under oblique solicitations than the onlay restorations. Nevertheless, premolar teeth are subjected to functional and parafunctional forces of different magnitudes and directions [13,19], and the generality of studies agrees that oblique loads are responsible for higher stress levels than compressive loads.
In this numerical study, an oblique load of 500 N was applied to both tooth cusps, mimicking the lateral force that is directed buccolingually during masticatory movements [42]. Even though the magnitude of the force is about twice the biting force at occlusion during chewing [49], this value allows for the identification of higher levels of stress and, therefore, simulates extreme conditions that might lead to tooth damage. Moreover, Tortopidis et al. [50] measured a maximum biting force of 580 N in healthy people’s posterior areas. Besides the tooth loading level, the restorative procedure has been identified as another parameter influencing the stress and strain levels of restored teeth [19,20,35,38,41,43,51]. All researchers reported that teeth with onlay restorations appear more resistant to fracture than those with inlay restorations. In our study, the von Mises stress distributions for both restorations’ dentin and their corresponding statistical descriptions were very similar. The main differences appeared only in the maximum values; the inlay restoration showed a maximum von Mises stress 5% higher than the onlay restoration. Furthermore, the paired samples t-test performed over the two dentin “bed” geometries showed statistically significant differences between the onlay and inlay results for all stress components (i.e., for von Mises (vM), all three principal stresses and the maximum shear stress (MS)). Similar behavior was also observed in the results of the paired samples t-test for both cohesive zone models of the “bed” dentin, with statistically significant differences between the onlay and inlay results for all stress components except for the second principal stresses (p = 0.683).
The other tooth component that plays an important role in the longevity of tooth restoration is the enamel. The literature is rich in reports showing that secondary caries and tooth fractures are the two main factors for teeth failures [52]. Because the activation of dental caries starts with enamel demineralization [53,54], it is important to avoid stress hot spots on the enamel walls that remain in the restoration. Some works have been reporting that enamel is composed of prisms that are often perpendicular to the enamel–dentin junction [12,55] and can be fractured if the forces are not parallel to this direction. Hence, although the results reported in Section 3.3 showed that the vM stress distributions were quite similar for both enamel geometries, the inlay enamel geometry presented the highest maximum value. This result could be related to the fracture pattern of the pressable glass ceramic inlays group reported by Wafaie et al. [3], where the complete fracture of specimens was attributed to the alteration of the enamel point where the stress concentration appeared. They also reported that in cyclic fatigue tests of the inlay restorations, the crack initiation started at the cement interface. This behavior can also be associated with the results presented in Figure 5, showing the vM stress distributions and their corresponding histograms. It is possible to conclude that the onlay adhesive is less loaded than the inlay restoration adhesive and, hence, is less prone to crack initiations. The results presented in Figure 4 also show that cusp reduction could be suggested to the lower stress values in the restorative materials.
This work addressed some challenges in the definition of restoration–adhesive–dentin interfaces, allowing the inclusion of CZM to perform strength prediction of the adhesive joint. The first challenge is related to the structured mesh necessary to generate bidimensional cohesive interface elements, and the second is the mechanical properties needed to define the traction–separation laws, critical values of toughness in tension and shear, as well as the cohesive strengths in tension and shear. Hence, the definition of values different from those presented here might lead to different CZM results. Moreover, cohesive finite elements should be extended to all surfaces of the adhesive interface to ensure the appearance of possible damage. Another limitation of this work is related to both cavities’ dimensions; namely, the palatal cusp of the onlay restoration needs more restorative material to assure the manufacturer’s recommendations. Nevertheless, increasing the restorative palatal cusp dimensions contributes to improving the fracture resistance of onlay restorations [43]. Therefore, accounting for that variation can amplify the magnitude of the results presented here.
The are other physical factors not accounted for in this finite element study, such as the use of a rubber dam during the bonding procedures, which can affect the mechanical properties of the adhesion, and the level of edentulism, which can change the chewing cinematic and therefore the intensity and direction of the loads.
5. Conclusions
Within the limitations of the present study and those of finite element analysis, it is possible to conclude that cusp reductions could be recommended to reduce the stress values in the dental tissues and restorative material. The damage analysis showed that the initiation of damage appeared in the adhesive resin cement for both restorations. Nevertheless, the onlay restoration appeared to contribute to a more homogeneous distribution of strains; therefore, in the damage analysis, it supported a load that was about 18% higher.
Author Contributions
Conceptualization, A.M., R.I.F. and P.J.P.; methodology, L.R. and M.A.N.; software, M.A.N. and A.M.A.; validation, A.M., R.I.F. and P.J.P.; writing—original draft preparation, M.A.N.; writing—review and editing, A.M., L.R., R.I.F., P.J.P. and A.M.A. All authors have read and agreed to the published version of the manuscript.
Funding
This research was sponsored by FEDER funds through the COMPETE–Programa Operacional Factores de Competitividade program and by national funds through the Fundação para a Ciência e a Tecnologia (FCT) under project UIDB/00285/2020.
Institutional Review Board Statement
Not applicable.
Informed Consent Statement
Not applicable.
Data Availability Statement
Not applicable.
Conflicts of Interest
The authors declare no conflict of interest.
References
- Sabeti, M.; Kazem, M.; Dianat, O.; Bahrololumi, N.; Beglou, A.; Rahimipour, K.; Dehnavi, F. Impact of Access Cavity Design and Root Canal Taper on Fracture Resistance of Endodontically Treated Teeth: An Ex Vivo Investigation. J. Endod. 2018, 44, 1402–1406. [Google Scholar] [CrossRef]
- Kassis, C.; Khoury, P.; Mehanna, C.Z.; Baba, N.Z.; Bou Chebel, F.; Daou, M.; Hardan, L. Effect of Inlays, Onlays and Endocrown Cavity Design Preparation on Fracture Resistance and Fracture Mode of Endodontically Treated Teeth: An In Vitro Study. J. Prosthodont. 2021. [Google Scholar] [CrossRef]
- Wafaie, R.A.; Ibrahim Ali, A.; Mahmoud, S.H. Fracture resistance of prepared premolars restored with bonded new lab composite and all-ceramic inlay/onlay restorations: Laboratory study. J. Esthet. Restor. Dent. 2018, 30, 229–239. [Google Scholar] [CrossRef] [PubMed]
- Vagropoulou, G.I.; Klifopoulou, G.L.; Vlahou, S.G.; Hirayama, H.; Michalakis, K. Complications and survival rates of inlays and onlays vs. complete coverage restorations: A systematic review and analysis of studies. J. Oral Rehabil. 2018, 45, 903–920. [Google Scholar] [CrossRef]
- Bustamante-Hernández, N.; Montiel-Company, J.M.; Bellot-Arcís, C.; Mañes-Ferrer, J.F.; Solá-Ruíz, M.F.; Agustín-Panadero, R.; Fernández-Estevan, L. Clinical behavior of ceramic, hybrid and composite onlays. A systematic review and meta-analysis. Int. J. Environ. Res. Public Health 2020, 17, 1–23. [Google Scholar]
- Al-Haj Husain, N.; Özcan, M.; Molinero-Mourelle, P.; Joda, T. Clinical Performance of Partial and Full-Coverage Fixed Dental Restorations Fabricated from Hybrid Polymer and Ceramic CAD/CAM Materials: A Systematic Review and Meta-Analysis. J. Clin. Med. 2020, 9, 2107. [Google Scholar] [CrossRef]
- Aspros, A. Inlays & Onlays Clinical Experiences and Literature Review. J. Dent. Health Oral Disord. Ther. 2015, 2, 26–31. [Google Scholar]
- de Velloso Vianna, A.L.S.; do Prado, C.J.; Bicalho, A.A.; da Silva Pereira, R.A.; das Neves, F.D.; Soares, C.J. Effect of cavity preparation design and ceramic type on the stress distribution, strain and fracture resistance of CAD/CAM onlays in molars. J. Appl. Oral Sci. 2018, 26, e20180004. [Google Scholar]
- Panahandeh, N.; Johar, N. Effect of Different Cusp Coverage Patterns on Fracture Resistance of Maxillary Premolar Teeth in MOD Composite Restorations. J. Islamic Dent. Assoc. IRAN (JIDA) Winter 2014, 25, 4. [Google Scholar]
- Coelho Santos, M.J.M.; Mondelli, R.F.L.; Lauris, J.R.P.; Navarro, M.F.L. Clinical evaluation of ceramic inlays and onlays fabricated with two systems: Two-year clinical follow up. Oper. Dent. 2004, 29, 123–130. [Google Scholar]
- Santos, M.J.M.C.; Freitas, M.C.; Azevedo, L.M.; Santos, G.C.; Navarro, M.F.; Francischone, C.E.; Mondelli, R.F. Clinical evaluation of ceramic inlays and onlays fabricated with two systems: 12-year follow-up. Clin. Oral Investig. 2016, 20, 1683–1690. [Google Scholar] [CrossRef]
- Mondelli, J.; Rizzante, F.A.P.; Valera, F.B.; Roperto, R.; Mondelli, R.F.L.; Furuse, A.Y. Assessment of a conservative approach for restoration of extensively destroyed posterior teeth. J. Appl. Oral Sci. 2019, 27, e20180631. [Google Scholar] [CrossRef]
- Ausiello, P.; Rengo, S.; Davidson, C.L.; Watts, D.C. Stress distributions in adhesively cemented ceramic and resin-composite class II inlay restorations: A 3D-FEA study. Dent. Mater. 2004, 20, 862–872. [Google Scholar] [CrossRef]
- Homaei, E.; Jin, X.Z.; Pow, E.H.N.; Matinlinna, J.P.; Tsoi, J.K.H.; Farhangdoost, K. Numerical fatigue analysis of premolars restored by CAD/CAM ceramic crowns. Dent. Mater. 2018, 34, e149–e157. [Google Scholar] [CrossRef] [PubMed]
- Aslan, T.; Esim, E.; Üstün, Y.; Özkan, H.D. Evaluation of Stress Distributions in Mandibular Molar Teeth with Different Iatrogenic Root Perforations Repaired with Biodentine or MTA: A Finite Element Analysis Study. J. Endod. 2021, 47, 631–640. [Google Scholar] [CrossRef] [PubMed]
- Arnelund, C.-F.; Johansson, A.; Ericson, M.; Häger, P.; Fyrberg, K.A. Five-year evaluation of two resin-retained ceramic systems: A retrospective study in a general practice setting. Int. J. Prosthodont. 2004, 17, 302–306. [Google Scholar]
- Stappert, C.F.J.; Guess, P.C.; Gerds, T.; Strub, J.R. All-ceramic partial coverage premolar restorations. Cavity preparation design, reliability and fracture resistance after fatigue. AM J. Dent. 2005, 18, 275–280. [Google Scholar] [PubMed]
- Dejak, B.; Mlotkowski, A.; Romanowicz, M. Strength estimation of different designs of ceramic inlays and onlays in molars based on the Tsai-Wu failure criterion. J. Prosthet. Dent. 2007, 98, 89–100. [Google Scholar] [CrossRef]
- Yamanel, K.; Çağlar, A.; Gülşahi, K.; Özden, U.A. Effects of different ceramic and composite materials on stress distribution in inlay and onlay cavities: 3-D finite element analysis. Dent. Mater. J. 2009, 28, 661–670. [Google Scholar] [CrossRef] [PubMed]
- Yang, H.; Park, C.; Shin, J.H.; Yun, K.D.; Lim, H.P.; Park, S.W.; Chung, H. Stress distribution in premolars restored with inlays or onlays: 3D finite element analysis. J. Adv. Prosthodont. 2018, 10, 184–190. [Google Scholar] [CrossRef] [PubMed]
- de Azevedo Cubas, G.B.; Habekost, L.; Camacho, G.B.; Pereira-Cenci, T. Fracture resistance of premolars restored with inlay and onlay ceramic restorations and luted with two different agents. J. Prosthodont. Res. 2011, 55, 53–59. [Google Scholar] [CrossRef]
- Kantardžić, I.; Vasiljević, D.; Blažić, L.; Lužanin, O. Influence of cavity design preparation on stress values in maxillary premolar: A finite element analysis. Croat. Med. J. 2012, 53, 568–576. [Google Scholar] [CrossRef] [PubMed]
- Thompson, M.; Thompson, K.; Swain, M. The all-ceramic, inlay supported fixed partial denture. Part 1. Ceramic inlay preparation design: A literature review. Aust. Dent. J. 2010, 55, 120–127. [Google Scholar] [CrossRef]
- Alfano, G.; Crisfield, M.A. Finite element interface models for the delamination analysis of laminated composites: Mechanical and computational issues. Int. J. Numer. Methods Eng. 2001, 50, 1701–1736. [Google Scholar] [CrossRef]
- Ausiello, P.; Ciaramella, S.; Martorelli, M.; Lanzotti, A.; Zarone, F.; Watts, D.C.; Gloria, A. Mechanical behavior of endodontically restored canine teeth: Effects of ferrule, post material and shape. Dent. Mater. 2017, 33, 1466–1472. [Google Scholar] [CrossRef] [PubMed]
- de Oliveira Dal Piva, A.M.; Tribst, J.P.M.; Borges, A.L.S.; de Assunção e Souza, R.O.; Bottino, M.A. CAD-FEA modeling and analysis of different full crown monolithic restorations. Dent. Mater. 2018, 34, 1342–1350. [Google Scholar] [CrossRef] [PubMed]
- Amaro, A.M.; Neto, M.A.; Loureiro, A.; Reis, P.N.B. Taper’s angle influence on the structural integrity of single-lap bonded joints. Theor. Appl. Fract. Mech. 2018, 96, 231–246. [Google Scholar] [CrossRef]
- Della Bona, A.; Anusavice, K.J.; Mecholsky, J.J. Apparent interfacial fracture toughness of resin/ceramic systems. J. Dent. Res. 2006, 85, 1037–1041. [Google Scholar] [CrossRef] [PubMed]
- Calvo, F.; Murayama, N.; Doczi, R.J.; Robira, R.O.; García-López, S. Comparative study of bond strength of tubes bonded to a resin surface on the buccal aspect of molars using Empress Direct resin and Transbond XT resin: An ex vivo study. Rev. Mex. Ortod. 2017, 5, e136–e143. [Google Scholar] [CrossRef]
- Zhu, X.-K.; Joyce, J.A. Review of fracture toughness (G, K, J, CTOD, CTOA) testing and standardization. In Engineering Fracture Mechanics; Elsevier: Amsterdam, The Netherlands, 2012. [Google Scholar]
- Maghami, E.; Homaei, E.; Farhangdoost, K.; Pow, E.H.N.; Matinlinna, J.P.; Tsoi, J.K.-H. Effect of preparation design for all-ceramic restoration on maxillary premolar: A 3D finite element study. J. Prosthodont. Res. 2018, 62, 436–442. [Google Scholar] [CrossRef]
- Ultimate, R. Technical Data Sheet; 3M Deutschland GmbH, 3M Canada: London, ON, Canada, 2012. [Google Scholar]
- Schwartz-Dabney, C.L.; Dechow, P.C. Edentulation alters material properties of cortical bone in the human mandible. J. Dent. Res. 2002, 81, 613–617. [Google Scholar] [CrossRef]
- Schwartz-Dabney, C.L.; Dechow, P.C. Variations in cortical material properties throughout the human dentate mandible. Am. J. Phys. Anthropol. 2003, 120, 252–277. [Google Scholar] [CrossRef] [PubMed]
- Jiang, Q.; Huang, Y.; Tu, X.R.; Li, Z.; He, Y.; Yang, X. Biomechanical Properties of First Maxillary Molars with Different Endodontic Cavities: A Finite Element Analysis. J. Endod. 2018, 44, 1283–1288. [Google Scholar] [CrossRef]
- Fisher, K. IPS Empress Direct, Scientific Documentation; Ivoclar Vivadent: Schaan, Liechtenstein, 2010. [Google Scholar]
- Yuan, K.; Niu, C.; Xie, Q.; Jiang, W.; Gao, L.; Huang, Z.; Ma, R. Comparative evaluation of the impact of minimally invasive preparation vs. conventional straight-line preparation on tooth biomechanics: A finite element analysis. Eur. J. Oral Sci. 2016, 124, 591–596. [Google Scholar] [CrossRef]
- Zhu, J.; Luo, D.; Rong, Q.; Wang, X. Effect of biomimetic material on stress distribution in mandibular molars restored with inlays: A three-dimensional finite element analysis. PeerJ 2019, 2019, e7694. [Google Scholar] [CrossRef] [PubMed]
- Hirsch, F.; Kästner, M. Microscale simulation of adhesive and cohesive failure in rough interfaces. Eng. Fract. Mech. 2017, 178, 416–432. [Google Scholar] [CrossRef]
- Abuelenain, D.; Neel, E.A.A.; Aldharrab, A. Mechanical Properties of Different Commercially Available Dental Composites. Austin J. Dent. 2015, 2, 03. [Google Scholar]
- Jiang, W.; Bo, H.; YongChun, G.; LongXing, N. Stress distribution in molars restored with inlays or onlays with or without endodontic treatment: A three-dimensional finite element analysis. J. Prosthet. Dent. 2010, 103, 6–12. [Google Scholar] [CrossRef]
- Benazzi, S.; Kullmer, O.; Grosse, I.R.; Weber, G.W. Using occlusal wear information and finite element analysis to investigate stress distributions in human molars. J. Anat. 2011, 219, 259–272. [Google Scholar] [CrossRef]
- Mei, M.L.; Chen, Y.M.; Li, H.; Chu, C.H. Influence of the indirect restoration design on the fracture resistance: A finite element study. Biomed. Eng. Online 2016, 15, 3. [Google Scholar] [CrossRef]
- Abdulmunem, M.; Dabbagh, A.; Naderi, S.; Talaei Zadeh, M.; Abdul Halim, N.F.; Khan, S.; Abdullah, H.; Abu Kasim, N.H. Evaluation of the effect of dental cements on fracture resistance and fracture mode of teeth restored with various dental posts: A finite element analysis. J. Eur. Ceram. Soc. 2016, 36, 2213–2221. [Google Scholar] [CrossRef]
- Bresser, R.A.; van de Geer, L.; Gerdolle, D.; Schepke, U.; Cune, M.S.; Gresnigt, M.M.M. Influence of Deep Margin Elevation and preparation design on the fracture strength of indirectly restored molars. J. Mech. Behav. Biomed. Mater. 2020, 110, 103950. [Google Scholar] [CrossRef]
- Soares, C.J.; Martins, L.R.M.; Fonseca, R.B.; Correr-Sobrinho, L.; Fernandes Neto, A.J. Influence of cavity preparation design on fracture resistance of posterior Leucite-reinforced ceramic restorations. J. Prosthet. Dent. 2006, 95, 421–429. [Google Scholar] [CrossRef] [PubMed]
- Saridag, S.; Sevimay, M.; Pekkan, G. Fracture resistance of teeth restored with all-ceramic inlays and onlays: An in vitro study. Oper. Dent. 2013, 38, 626–634. [Google Scholar] [CrossRef]
- Alshiddi, I.F.; Aljinbaz, A. Fracture resistance of endodontically treated teeth restored with indirect composite inlay and onlay restorations—An in vitro study. Saudi Dent. J. 2016, 28, 49–55. [Google Scholar] [CrossRef] [PubMed]
- Gibbs, C.H.; Mahan, P.E.; Lundeen, H.C.; Brehnan, K.; Walsh, E.K.; Holbrook, W.B. Occlusal forces during chewing and swallowing as measured by sound transmission. J. Prosthet. Dent. 1981, 46, 443–449. [Google Scholar] [CrossRef]
- Tortopidis, D.; Lyons, M.F.; Baxendale, R.H.; Gilmour, W.H. The variability of bite force measurement between sessions, in different positions within the dental arch. J. Oral Rehabil. 1998, 25, 681–686. [Google Scholar] [CrossRef] [PubMed]
- Cheng, C.W.; Chen, W.P.; Chien, Y.T.; Teng, Y.T.; Lu, P.Y.; Huang, S.H.; Lin, P.Y.; Chiang, Y.C. Biomechanical behavior of cavity design on teeth restored using ceramic inlays: An approach based on three-dimensional finite element analysis and ultrahigh-speed camera. Acta Biomater. 2019, 89, 382–390. [Google Scholar] [CrossRef]
- Demarco, F.F.; Collares, K.; Correa, M.B.; Cenci, M.S.; de Moraes, R.R.; Opdamz, N.J. Should my composite restorations last forever? Why are they failing? Braz. Oral Res. 2017, 31, 92–99. [Google Scholar] [CrossRef]
- Cury, J.A.; Tenuta, L.M.A. Enamel remineralization: Controlling the caries disease or treating early caries lesions? Braz. Oral Res. 2009, 23, 23–30. [Google Scholar] [CrossRef] [PubMed]
- Abou Neel, E.; Aljabo, A.; Strange, A.; Ibrahim, S.; Coathup, M.; Young, A.; Bozec, L.; Mudera, V. Demineralization–remineralization dynamics in teeth and bone. Int. J. Nanomed. 2016, 11, 4743–4763. [Google Scholar] [CrossRef] [PubMed]
- Wang, C.; Ou, Y.; Zhang, L.; Zhou, Z.; Li, M.; Xu, J.; Fan, J.; Fu, B.; Hannig, M. Effects of regional enamel and prism orientations on bovine enamel bond strength and cohesive strength. Eur. J. Oral Sci. 2018, 126, 334–342. [Google Scholar] [CrossRef] [PubMed]
Publisher’s Note: MDPI stays neutral with regard to jurisdictional claims in published maps and institutional affiliations. |
© 2021 by the authors. Licensee MDPI, Basel, Switzerland. This article is an open access article distributed under the terms and conditions of the Creative Commons Attribution (CC BY) license (https://creativecommons.org/licenses/by/4.0/).