Article

Bot Datasets on Twitter: Analysis and Challenges

by
Luis Daniel Samper-Escalante
1,
Octavio Loyola-González
2,*,
Raúl Monroy
3 and
Miguel Angel Medina-Pérez
3
1
School of Engineering and Sciences, Tecnologico de Monterrey, Puebla 72453, Mexico
2
Altair Management Consultants Corp., 303 Wyman St., Suite 300, Waltham, MA 02451, USA
3
School of Engineering and Sciences, Tecnologico de Monterrey, Estado de Mexico 52926, Mexico
*
Author to whom correspondence should be addressed.
Appl. Sci. 2021, 11(9), 4105; https://doi.org/10.3390/app11094105
Submission received: 30 March 2021 / Revised: 17 April 2021 / Accepted: 19 April 2021 / Published: 30 April 2021
(This article belongs to the Special Issue New Trends in Social Computing and Its Applications)

Abstract

:
The reach and influence of social networks over modern society and its functioning have created new challenges and opportunities to prevent the misuse or tampering of such powerful tools of social interaction. Twitter, a social networking service that specializes in online news and information exchange involving billions of users world-wide, has been infested by bots for several years. In this paper, we analyze both public and private databases from the literature of bot detection on Twitter. We summarize their advantages, disadvantages, and differences, recommending which is more suitable to work with depending on the necessities of the researcher. From this analysis, we present five distinct behaviors in automated accounts exhibited across all the bot datasets analyzed from these databases. We measure their level of presence in each dataset using a radar chart for visual comparison. Finally, we identify four challenges that researchers of bot detection on Twitter have to face when using these databases from the literature.

1. Introduction

Social networks have been expanding by leaps and bounds since the last decade [1]. Their reach and influence over modern society and its functioning have created opportunities for traditional and relatively new professions, as well as challenges to prevent the misuse or tampering of such powerful tools of social interaction [2].
One of these new challenges has arisen in the form of a software application known as bot. Bots can be controlled by one or many botmasters running automated tasks regularly over any computer, group of servers, or the internet cloud [3,4]. When bots are programmed to interact with each other, they can form a botnet to carry out more complex tasks [5]. They are not harmful by nature as they depend on a human operator (botmaster), but are created in such large quantities over a small time frame that can represent an ongoing threat to application servers and online platforms when used with malicious intent [6]. In social networks, bots can create content quickly, transform topics into trends, artificially increase popularity, or even spread misinformation [7,8]. Bots can also infiltrate them at a large-scale, presenting serious security implications [9].
Twitter is a social networking service specialized in online news and information exchange that involves billions of users world-wide [10,11]. These services are a tempting target for malicious people to spread fake news, influence public voting, create false opinions, or harass users [12]. The platform has been infested by bots for several years, aggravated by its permissive stance over its wide-open application programming interface (API) in its early days [13]. When grouped, bots can tamper with the original purpose of the platform, and thus jeopardize the universal right to access information, freedom of expression, and the concept of democracy [14].
Since 2018, Twitter has changed its API due to the controversy of bots meddling in the U.S. election of 2016 [15]. These changes had the objective to restrict and reduce the impact of bot services. While this helped to mitigate the bot presence on Twitter, it is still an ongoing problem.
Twitter’s team reported having 126 million daily active users [16], with the number of monthly active users declining due to their efforts to remove questionable accounts [17]. The platform estimates that 8.5% of all their active accounts are bots [18], where Varol et al. [19] predict that it is around 15%. Over the years, their role as active participants has increased: a study by Sysomos [20] estimated that bots created 32% of Twitter posts from the most active users with more than 150 tweets per day.
In the literature, bot detection, especially on Twitter, has attracted increasing interest. Searching for the topics on Scopus [21] (Figure 1) in the last ten years (where the most publications has been registered) reveals that significant growth has occurred since 2016, particularly on the topic of bot detection on Twitter (about 850% compared to 2015, from 2 to 19 publications). This increase in interest matches the controversy of the federal election in the United States [22] in the same year (2016). Judging by the surge of publications in the last years, bot detection on the platform is still an open problem that requires special attention due to the potential of these automated accounts to harm the social network and its users.
Nowadays, researchers [23,24] of bot detection on Twitter agree that there is a need to discover, analyze, and characterize bot behavior on the platform. The continuous increase in the complexity of bots requires a change of focus that evaluates the dynamics, social interactions, and behaviors of bots rather than searching for individual features to detect them [24].
In this paper, we perform an analysis of four distinct labeled databases from the literature focused on bot detection. We compare the human and bot datasets (classes) on these databases using their extracted features and represent them as graphs for visual comparison to expose distinct behaviors of bot accounts that can be used to detect them individually or as a group. We define the behavior of a bot as the series of decisions and actions they take on the platform to accomplish their goal, programmed by the botmaster (owner).

1.1. Contributions

The main contributions of this study are listed as follows:
  • A comparison chart of the public and private databases analyzed from the literature.
  • A recommendation for researchers of which database to use based on their needs.
  • The identification of the distinct behaviors of automated accounts that appear across all bot datasets inside the databases analyzed.
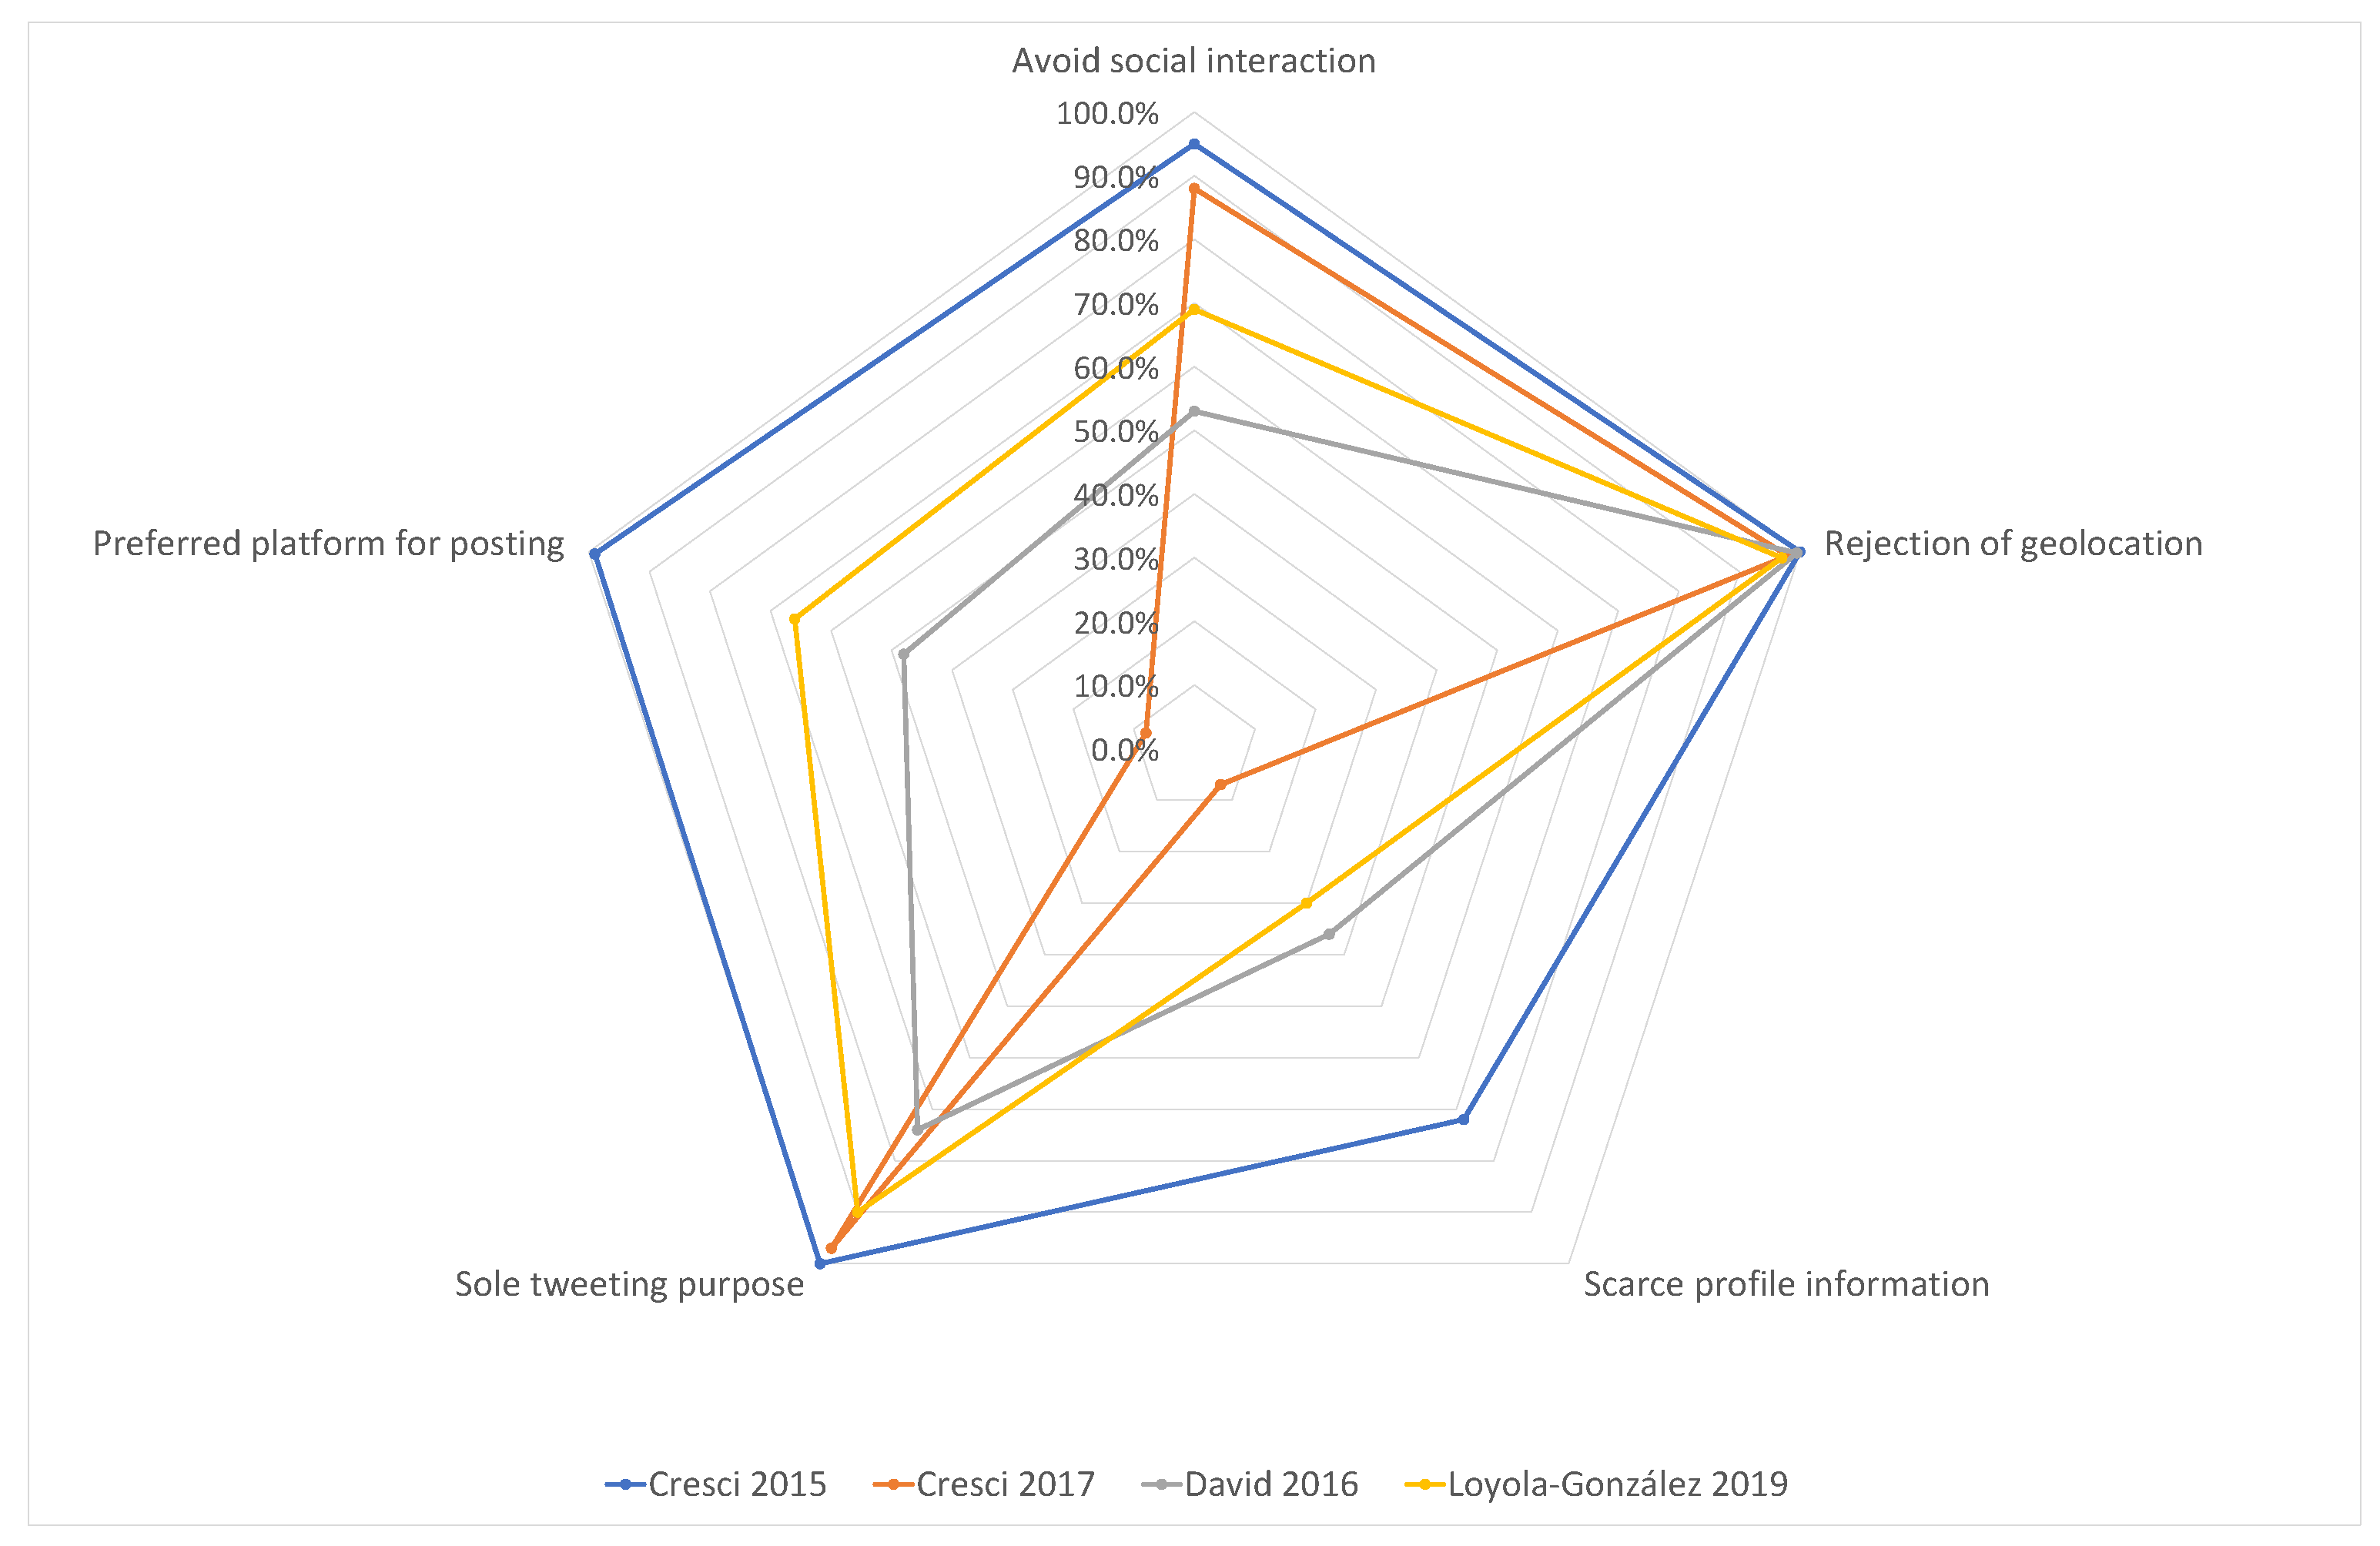
  • The quantification of the presence of these behaviors in each database using a radar chart.
  • A set of suggestions by way of good practices for future database creators and researchers of bot detection on Twitter.

1.2. Roadmap

The remainder of this paper is structured as follows: In Section 2, we review relevant approaches on the analysis of the social structure of the platform, the detection of bots on Twitter, and the identification of their behaviors from the state-of-the-art methods. Section 3 presents our analysis of four labeled databases (and their datasets within) from the literature on bot detection. We then introduce five distinct bot behaviors and a comparison chart (radar chart) in Section 4. In Section 5, we discuss key challenges that researchers face when working with public and private databases extracted from Twitter and provide suggestions of how to prevent or avoid them in future works. Finally, we give our last remarks in Section 6.

2. Literature Review

In this section, we structure our literature review on three topics. We first present some works dedicated to analyzing the inner workings of Twitter that impacted our research. Then, we review approaches on bot detection on Twitter that use machine learning methods for classification that brought us insights for our analysis. We finish with relevant works focused on bot behavior identification to compare similar approaches.

2.1. Analysis of Twitter’s Social Structure

Due to the increasing role Twitter takes in modern life, researchers have taken an interest in analyzing the structure, users, and interactions on the platform [25]. One of the most important works is the one from Kwak et al. [26], which presents the first quantitative analysis on the entire Twitterverse [27] in the literature. The article results in an analysis of the platform’s topological features and its potential as a new vehicle for distributing information. From their results, they found that there is a discordance of influence between the number of followers of a user and the number of retweets the user gets. Reciprocated relations also display a tendency of individuals to associate with others of similar opinions. Lastly, by ranking the users by the number of received retweets, the authors exposed the potential impact of the users on the platform.
Efstathiades et al. [28] reevaluated the Twitter network presented by Kwak et al. [26], gathering users’ complete characteristics again to create a new social graph snapshot in 2015, and comparing these two network snapshots (2010 and 2015) thoroughly. Results of the comparison showed that Twitter became a denser but less connected network, with increased reciprocity and a lower average shortest path. The authors also found differences in the popularity ranks and a significant change in its topological characteristics. They concluded by stating this is a consequence of the removal of users on the platform.
In [29], Daher et al. published a study of popular hashtags on the platform, analyzing their characteristics, evolution, and measures that appeal to user engagement. The authors first collected the user, tweet, and follower information of accounts participating in Christmas-related hashtags. Then, they represented their Twitter data as a social graph using Gephi software [30] and evaluated the resulting structure with influence, activity, and topological measures. Their results indicate that users with more social connections likely drive their followers into participating in the same hashtag, but the frequency of tweeting of these influential users does not significantly affect their followers.
Motamedi et al. [31] examined the participation of highly connected active users (named elite) in the social structure of Twitter. They constructed an elite social network (comprised of the top 10,000 influential users and their relationships) of the platform and evaluated its characteristics and evolution in two network snapshots over almost three years apart. From their results, they detected that the elite network became a sparser but more connected structure, contrary to the findings of Efstathiades et al. [28]. They also identified these influential users forming communities with a visible identity and theme. Lastly, the authors stated that regular users are inclined to stay in a single elite community, which they believe is a promising property for the clustering of regular users.
From these works, we conclude that researchers have identified notable differences in the social structure and the topological characteristics of the platform over the years: first, there is a higher occurrence of bidirectional links between people with similar interests than people with different opinions [26], becoming larger communities around influential users with whom they feel identified [31]. Second, the amount of followers does not directly reflect the influence a user has on the platform, as they are not a guarantee for a high rate of retweets [26,28]. Third, removing highly connected users can change the topology of the Twitter network [28], as some serve as bridges between user communities [31]. Fourth, users with numerous followers can entice other users into participating in different topics using hashtags [29], potentially becoming promoters of trends in the platform.
Finally, these works have influenced our research considerably: we analyzed the social relationships of a group of Twitter accounts and the characteristics of its network in Section 3.2.2. We also found that influential users such as Mexican politicians behave differently compared to genuine users or bots, interacting more with their followers (Section 3.5.2).

2.2. Bot Detection on Twitter

In the previous section, we verified the importance of users and their relationships on Twitter, potentially generating significant changes in its network [26,28]; therefore, we need to identify malicious accounts and mitigate their effects and influence, which the Twitter developers believe can help guarantee healthy coexistence and freedom of thought on the platform [32].
Since their discovery and recognition as a serious problem to the platform, researchers on bot detection have been classifying Twitter bots by their motivation [33,34,35]. These bots can be content polluters that distribute spam (unwanted electronic messages), attract customers to products or services, and even spread malicious content [36]. There is also a group of bots classified as statistic enhancers, utilized to increase the popularity of a product, person, or company artificially (thus gaining influence over real accounts), generate conversation about a particular topic, or even create false trends [37]. Another group is used as a political influence to change the popular perception of a candidate, infiltrate social discussions, or discourage supporters from voting [34]. Nowadays, these groups present an ongoing threat to the community and the goals of the platform [32].
Research on bot detection is based on the premise that a legitimate human account can be characterized well enough to be clearly distinguished from a bot account, no matter how well it is programmed to act like a genuine human-managed account [38]. Due to the immense potential of bots in modern life, which is so dependant on social networks, new methods are needed for detection and mitigation.
Cresci et al. [34] presented a group of rules, algorithms, and features used in the literature and online media to identify fake follower accounts (a sub-type of the statistic enhancers) on Twitter. They grouped the features into profile-based, timeline-based, and relationship-based. Their experiments showed that profile-based features offered an accurate prediction while being more cost-efficient than relationship-based features. They also discovered that fake followers do not tweet or use the Twitter API as much as spammers, and concluded that artificial neural networks [39] are promising classification techniques for bot detection. The article ended with the statement that features from social relations analysis were better for detecting fake followers on Twitter.
In [35], Cresci et al. identified a new problem on Twitter: a novel type of automated accounts for spamming content, called social spambots. This new type of spambot mimicked human behavior on the platform almost identically, making them significantly harder to detect. They proved this by carrying out several experiments using different datasets from Twitter. From them, they concluded that neither the platform, real-world persons, or benchmark algorithms for bot detection could accurately classify this new type of spambot. In the end, they identified a new trend in research that focuses more on analyzing groups of accounts as a whole, rather than evaluating them individually.
David et al. [40] designed a test to distinguish between bots and humans talking in Spanish. From an initial set of 71 inexpensive features, they performed a filter-based feature selection and ranked them by their importance using four different criteria. Then, they introduced the ranked features to five supervised classifiers, with random forest [41] obtaining the highest average accuracy of 94% using only 19 features. The authors highlighted that while artificial neural networks [39] obtained a considerable accuracy at first (about 90%), the increase of input neurons had minimum returns in terms of accuracy, stagnating at almost 91%. Lastly, they tested the winning classifier with its 19 features against around 5000 unclassified Spanish-speaking accounts, which reported that 13.5% of them were potential bots. Upon manual inspection, the authors concluded the suspicious accounts were spammers retweeting partisan messages from politicians in Mexico.
Loyola-González et al. [33] proposed the use of contrast pattern-based classification [42] for detecting social spambots on Twitter. The authors also introduced a novel feature model by combining the original features proposed by Cresci et al. [35] with new ones obtained from sentiment analysis and general usage of the account. To prove that sentiment analysis can be used regardless of the language a text is written, they performed a correlation analysis for English and Spanish tweets. Results from this evaluation demonstrated that sentiment analysis does not vary when tweets written in English are translated into Spanish and the other way around. They evaluated the performance of 21 classifiers from the literature of pattern-based classification. The results of the experiments indicated that the random forest classifier [41] from the literature and the proposed contrast pattern-based classification obtained the best average results for AUC (area under the receiver operating characteristic curve) and MCC (measurement of the differences between actual and expected values) with low standard deviation. Finally, they indicated that their combined feature model obtained better classification results for the classifiers than the original one from [35].
As we have learned from our literature review before, initial research on bot detection in online social networks focused on traditional spambots [34], which were automated accounts that avoided social interaction and left their public information empty, programmed for a specific function by the botmasters. These characteristics diverged from the ones found in legitimate accounts, which helped their classification. However, this is an arms race between botmasters and researchers [43], which derived an evolution of automated users: the social spambots [35], a definite improvement from the traditional ones. That said, as demonstrated by Loyola-González et al. [33], a consistent feature model can still identify these bot accounts. Feature models can operate with a reduced number of inexpensive features [40] that help cut computational costs, be language-independent [33], and achieve classification results over 93% [40] in accuracy and up to 0.99 in AUC [33].
To conclude, we have obtained the databases used in these works and made similar comparisons between classes and their features. We also incorporate the insights provided by these works’ authors regarding the identification of different types of bots in our analysis provided in Section 3.

2.3. Bot Behavior Identification

In our previous discussion, we mentioned various benefits a feature model can bring to bot detection research. In this section, we highlight one in particular, which is the basis of this work: the use of their set of features to identify distinct behaviors across multiple types of bot accounts.
As Aljohani et al. [23] state, there is a recognized need to identify bot behavior on Twitter. Many researchers have devoted their efforts to develop mechanisms that detect bots automatically [33,34,35,40], but few of them have centered on understanding their interactions and behaviors [24,44].
In [44], Abokhodair et al. discovered and studied the behaviors and features of a long-lived botnet of 130 members operating on Twitter that was active for 35 weeks, named the Syrian Social Botnet (SSB). Its purpose was to misroute public opinion from the Syrian civil war and cover tweets related to the ongoing conflict. They conducted three analyses on the dataset of tweets containing the SSB. Their results indicated that the SSB was not programmed to mimic human behavior and had a burst of activity on the last third of its lifespan, getting particular tweets into the top 100 retweeted. The authors concluded that the reason the SSB could have lived for so long and eluded Twitter detection was probably due to the language it was using to tweet (Arabic).
Mazza et al. [45] analyzed the retweeting behaviors of social bots on the platform. They introduced a scatter diagram named ReTweet-Tweet (RTT) that plots the timestamps of original tweets and their retweets, in which experiments revealed three suspicious behaviors attributed to retweet automation. Then, they proposed Retweet-Buster (RTbust), a bot detection technique that identifies groups of users with synchronized behaviors by exploiting the unique patterns found in the retweeting activity of the automated accounts. The results indicated that RTbust attained an F1 score (harmonic mean of precision and recall) of 87% and also helped recognize two active botnets hidden in their original dataset. In the end, they stated that the future for bot detection research lies in unsupervised learning approaches based on group identification.
In [23], Aljohani et al. studied the behavior and social influence of bots on an altmetric [46] Twitter social network (ATSN) by applying different social network analysis (SNA) techniques. Their analysis revealed bots are highly connected users that influenced 87% of the tweets in the ATSN, meddling with the metrics of scientific documents in the network. They also applied a graph convolutional network technique for bot classification in an ATSN dataset, obtaining an accuracy of 71% and an F1 score of 67%. The authors determined that there are not enough human-labeled collections to improve their model and that the difference between legitimate and social bot accounts is unclear nowadays, even for skilled annotators.
Pozzana and Ferrara [24] analyzed the behavior of bots and humans over periods of activity (consecutive tweets within 60 min), focusing more on the human perspective by identifying the changes in their behavior that are not present in the bot accounts. From their experiments, they encountered that human behavior comes across a transitory change in their retweets, replies, mentions, and text length over a period of activity, while bots do not experience this. Then, they introduced features related to the periods of activity of the users to improve bot classification into four classifiers, obtaining an AUC of 0.97 for three of them. Finally, they theorized that the reasons for the human behavior changes are derived from the growing tiredness of posting long messages and the increasing exposition to posts of other users, which translates to a greater chance to react.
From our previous literature review, we agree with the idea proposed by Pozzana and Ferrara [24] that studying bot behavioral dynamics represents an opportunity to improve the state-of-the-art techniques in bot detection. Research has been focusing on discovering the intentions of a group of bots by analyzing their tweet, reply, and retweet behavior [24,44,45], examining human conduct to compare it with automated behaviors [24], and identifying bot behavior in Twitter altmetric networks [23]. The most similar approach we found to our work is the one from Pozzana and Ferrara [24]. However, it is focused on a different perspective (characterizing human behavior rather than bots) using two bot datasets separately. Thus, we consider our analysis of the characteristics and behaviors of bots appearing across four different datasets (both public and private), a novel contribution to the literature of bot detection on Twitter (with the potential to be applied for identifying botnets). Additionally, the behaviors we identify in Section 4 are inspired in the previous works analyzed, as we consider them the starting point for understanding automated behavior on the platform. Next, we present the data and methodology used for our analysis.

3. Database Analysis

We present in this section the methodology followed and results obtained from our analysis on different labeled databases from the literature focused on bot detection. Each of the four databases contains distinct datasets holding public information extracted from Twitter (the users and their tweets), and in one case (Section 3.2) relationship information (the followers and followings of the users).
We focus only on these databases for the following reasons: they include bots or humans with novel behaviors that had not been previously reported (e.g., social spambots, bots from Spanish-speaking countries), the authors made it available to the community under permission, and they are relatively recent. Subsequently, we did not consider older public databases because of their similar characteristics and did not include newer private databases because we could not reach their authors. We tried our best to incorporate different types of bots and humans, which resulted in sets of accounts from various countries, cultures, and languages.

3.1. Materials and Methods

We first gathered the following databases (both public and private): Cresci et al.’s [34] 2015 public database, Cresci et al.’s [35] 2017 public database, David et al.’s [40] 2016 private database, and Loyola-González et al.’s [33] 2019 private database. We analyzed the databases’ contents and chose different human and bot datasets to compare them using their extracted features. We use the name of the datasets as specified by the database creators through this section.
We then represented them as graph structures for visual comparison and to apply graph metrics for those datasets with relationship information. Twitter social structure is commonly depicted as a directed graph composed of nodes (users or tweets) connected by edges (relationships) [29], so we follow this approach. We created all the graphs using Gephi 0.9.2 [30] on Windows 10 with Java JRE 1.8.0_241 [47]. We modeled human and bot datasets (classes) within the databases as simple graphs composed of nodes (users or tweets) with their associated features inside them (as attributes) and directed edges (follower or following relationships) connecting them. We executed ForceAtlas2 [48] in our resulting graphs to organize lowly and highly connected nodes in the datasets. ForceAtlas2 is a layout algorithm directed by forces where nodes repulse each other and edges attract them, so highly connected nodes gravitate towards the center and push lowly connected nodes to the border.
Finally, we created different colored partitions for our graphs using Gephi 0.9.2 [30] and the analysis of relevant user and tweet features that offer a better contrast between the human and bot classes. Each graph partition has different colored categories based on their percentage frequency distribution (PFD) [49]. The nodes (user or tweets) of the graph are colored depending on which category they fit, and each category is created and calculated from the values and frequency in the chosen feature.
Each database’s section contains an introduction detailing its contents, how we choose, sample, and represent its datasets as graph structures, an analysis of their features, graphs, and partitions, and our final remarks. We only show a portion of our mentioned graphs for space and convenience, but they are all available upon request to the corresponding author.

3.2. Cresci et al. Database (2015)

Cresci et al.’s [34] 2015 public database is a well-known collection (with a Field-weighted Citation Impact [50] of 5.33 for its article in Scopus) composed of five datasets extracted from Twitter’s API via crawling: the TFP dataset (real accounts following Twitter account @TheFakeProject validated through CAPTCHA), E13 dataset (real accounts from hashtag #elezioni2013 manually verified by sociologists), FSF dataset (fake accounts bought from public website fastfollowerz), INT dataset (fake accounts bought from public website intertwitter), and TWT dataset (fake accounts bought from public website twittertechnology). Each dataset contains public information of the crawled profiles, which are their account and tweet features, as well as their direct relationships in the form of followers and followings.
From all five datasets, we have selected two for our analysis: the TFP dataset containing certified human accounts and the FSF dataset storing fake accounts bought online. We preferred the TFP dataset because it is a mixture of researchers and journalists from North America and Europe, as the E13 dataset only consists of active Italian Twitter users. Concerning the FSF dataset, there is no apparent difference between the three datasets of fake accounts other than the site the authors of [34] obtained them from. Therefore, we selected it for the number of accounts and relationships present in the collection, which is smaller and thus more manageable than the others.
On the one hand, the TFP dataset comprises 469 Twitter real accounts, 258,494 follower relationships, 241,710 following relationships, and 563,693 tweets. On the other hand, the FSF dataset has 1169 Twitter fake accounts, 11,893 follower relationships, 253,026 following relationships, and 22,910 tweets. When contrasting both datasets, fake accounts outnumber real ones by 700 profiles but have about 25% fewer tweets and 22% fewer followers; however, they almost have the same amount of followers, with a difference of about 1%.

3.2.1. Representation

We represented both datasets as simple graphs for visual comparison, giving us a picture of their accounts and relationships as a network. This graph depiction was of great help in our analysis of the database (Section 3.2.2), where we inspected the in-degree (number of followers) and out-degree (number of followings) of the accounts. We also made significant findings when we applied graph network measures to them (detailed in the next section), which we obtained thanks to these structures.
We performed a simple random sampling [51] of the tweets from the TFP dataset because analyzing the complete dataset is very complex and time-consuming. So we considered it is preferable to perform the analysis with only a part of the dataset. We selected 23,000 random tweets to match the size of the other dataset. We obtained eight different graphs, four from TFP and four from FSF, executing the ForceAtlas2 layout algorithm [48] on each of them. We describe our resulting graph representations for users, tweets, followers, and followings of both datasets in the next section.

3.2.2. Analysis

This section aims to discover significant characteristics or behaviors that enable us to differentiate between classes. The analysis of the databases’ datasets will also help us recognize distinct behaviors of the bot accounts inside these datasets and identify key challenges of working with databases from the literature of bot detection on Twitter in Section 4 and Section 5.
In this database, we divided our analysis into two parts: we first observe the differences between features of classes (humans in the TFP dataset and bots in the FSF dataset), which the authors distributed in user’s (account) information and tweet’s information for each dataset. We then inspect relationships of classes with other accounts, and also divided into user followers’ information and user followings’ information for each dataset.
We started the feature comparison by examining the features extracted from the user’s information. Our results exposed a pattern happening on the bot accounts: they leave their profile information empty. In particular, we discovered that bot class always has the default settings for both profile picture and background, never uses geolocation or appear in public lists, and has no location nor time zone. Meanwhile, the real (human) class exhibit a different behavior: almost every profile has changed their default picture, but their default background not so much (66%); about half of them have geolocation enabled as well as appearing in public lists. Around 70% have a location and 20% a time zone.
Tweet features bring significant contrast between classes as well. Nearly all tweets from the bot class did not receive a favorite, compared to only one-quarter of human tweets. As in the user features, geolocation is a feature that can support adequately distinct classes: no bot has enabled it. None of the tweets published by bots was a reply, barely mentioning other users, and usually without being replied to. Finally, they posted almost all their content via the web (99%), contrary to humans, who used the web for one-third of their tweets, and then they diversify using different devices.
To conclude this first part of the analysis, we selected two user and two tweet features (favourites_count, friends_count, retweet_count, and source) from all the available as partitions for the graphs previously obtained in Section 3.2.1. We made this choice from our comparison of user features and tweet features, selecting the ones that contrasted the classes better by first analyzing the PFD of each feature for both humans and bots. Then, if the change in the categories or their associated frequency was significant enough, we considered them in our initial selection. Finally, we narrowed this selection to the most contrasting features, i.e., the features having the most different PFD between classes. We repeated this method for the other databases in this work.
Obtaining a simple random sample entails demonstrating that our results are valid or correct (consistent with if we had done the same analysis considering the complete dataset). So, we validate that it is representative of the total population when choosing the tweet features by performing three non-parametric tests: the chi-square goodness-of-fit test [52], the chi-square test of homogeneity [52], and the two-sample Kolmogorov–Smirnov test [53]. The null hypothesis (H0) for all three tests is that the sample and the actual population follow the same distribution. We used the chosen tweet features as input variables, and the results of the three tests (we obtained p-values of 0.57, 0.73, and d-stat of 0.003 respectively, with a significance level of 0.05) indicated that there is no sufficient evidence to reject H0. Given that we followed the guidelines for doing simple random sampling [51] to reduce bias, we believe the previous results allow us to assume that the sample is representative of the total population.
Next, we used Gephi 0.9.2 [30] to create the categories for each chosen feature using its data along with the percentage of users or tweets belonging to that category. Then, we picked unique colors to distinguish the nine categories with the most percentages, having the tenth color (gray) for the sum of the others. Finally, we colored the nodes of each dataset’s user or tweet graph based on the category they fell in.
From the user features, we have chosen the number of times the account has given a favorite (favourites_count) and the number of followings (friends) they have (friends_count) from the available user features. In the case of the tweet features, we selected the number of times it is retweeted (retweet_count) and the device where the tweet originated (source) for partitioning. We present a summary of our findings in Table 1.
The second part of the analysis begins with the estimation of the in-degree (incoming connections) and out-degree (outgoing connections) of our graphs created before from following and follower connections (Section 3.2.1). In these graphs, a node represents a user from the dataset, and a directed edge a connection between two nodes, made either because the original user is following another user or another user is a follower of the original user.
We colored the nodes based on their number of relationships, following a color gradient for a smoother transition: purple is assigned for the ones with fewest relationships, pink for fewer, red for few, orange for many, yellow for more, and green for the nodes with the most relationships. The resulting graphs for the followers of both datasets are available in Figure 2.
Next, we calculated graph metrics [54] for these graphs. For the followers’ graphs (Figure 2), the average degree for dataset TFP is 1.3, and for dataset FSF is 1.1. The diameter of the graph for the TFP dataset and the FSF dataset is 10.0 and 4.0, respectively. The average path length for the TFP dataset is 3.8 and 1.1 for the FSF dataset.
For the followings’ graphs, the average degree we obtained is 1.7 for the TFP dataset and 20.1 for the FSF dataset. The diameter of the graph calculated is 12.0 and 3.0 for the TFP dataset and the FSF dataset, respectively. The average path length estimated for the TFP dataset is 4.3 and 1.0 for the FSF dataset.
From all these results, we observe that fake accounts (FSF dataset) are slightly less popular and influential than real accounts (TFP dataset), as the average degree in their followers’ graph is smaller than the TFP dataset. However, fake (bot) accounts are less distanced from each other than real (human) accounts, which have a greater diameter and average path length. Figure 2 depicts this distancing, where there are more high-connected nodes (red color) in the center of the FSF dataset’s graph than in the TFP dataset’s graph, which have more low-connected nodes (purple color).

3.2.3. Concluding Remarks

Even though there are more fake accounts than real ones in the compared datasets (1169 of the FSF dataset vs. 469 of the TFP dataset), they exhibit a small-world effect [55] in both their followers and followings’ graphs, given their smaller diameter and average path length. We verified this effect in the FSF dataset’s out-degree graph shape, which is notably different compared to the others obtained. This fact, together with the observation raised in the first part of the analysis about the partition friends_count, could mean the existence of a botnet, as their numbers and behavior seem artificial.
As a counterpart, human relationships are more diverse and scattered, denoted by a higher diameter and average path length, which means a broader audience reach [26]. We expected this behavior as humans do not try to follow people as much as possible compared to bots. Humans are rather selective about their relationships, as they choose whom to follow based on related interests or similar political ideas [56].
Finally, we found several features in this database that could correctly identify fake accounts, especially when comparing the graphs obtained from both datasets. There is a clear distinction between genuine and bot accounts that help classify Twitter users. However, significant disadvantages of this database are that it is specialized for the detection of fake followers on Twitter and not other types of bots, and some features have been deprecated in the public API of Twitter, as it is more than four years old.

3.3. Cresci et al. Database (2017)

Cresci et al.’s [35] 2017 public database is one the most popular collections in the literature of bot detection on Twitter (with its article reporting a Field-weighted Citation Impact of 51.88 on Scopus), having nine datasets that were obtained from various sources: the genuine accounts dataset (verified profiles managed by humans from around the world obtained randomly via hybrid crowdsensing [57]), social spambots #1 (automated accounts identified as retweeters of an Italian political candidate), social spambots #2 (fake profiles that spam paid mobile apps on the platform), social spambots #3 (fake users discovered to be spamming products on sale on an e-commerce site), traditional spambots #1 (regular spammers used in [58] by Yang et al.), traditional spambots #2 (fake accounts that spam scam URLs), traditional spambots #3 (automated users dedicated to spam job offers), traditional spambots #4 (another group of false profiles spamming job offers), and fake followers dataset (simple faux accounts used as statistics enhancers).
In [35], Cresci et al. used a training set composed of genuine accounts & social spambots #1; we follow their methodology by selecting these two datasets for our data revision and representation. The first dataset, genuine accounts (GA), has 3474 verified human accounts from Twitter with 248,533 tweets in total. The second dataset, social spambots #1 (SS1), has 991 social spambot accounts extracted from the platform with 1,610,176 tweets in total. We also identified two classes from these datasets: the humans from the genuine accounts dataset and the bots from the social spambots #1 dataset.

3.3.1. Representation

For representing data as simple graphs, we used nodes to depict accounts and their tweets along with their characteristics. No direct relationships were present in this collection, so they are not depicted in our analysis. We also performed simple random sampling to reduce the number of tweets analyzed to 25,000 for each dataset.
From the user and tweet information of each dataset, we obtained four graph representations: two for genuine accounts and two for social spambots #1. Then, we applied the ForceAtlas2 layout algorithm [48] for an organized display of the datasets’ graphs. In the following section, we partition these graphs using relevant features we found upon close inspection of the set available.

3.3.2. Analysis

Cresci et al.’s [34] 2015 database (Section 3.2) is the only one with relationship information, so we focused our analysis of the next three databases on the discovery of patterns, behaviors, and differences between the classes using the available features for that database. We present our analysis of Cresci et al.’s [35] 2017 database in the following paragraphs.
We started with the comparison of the datasets selected (genuine accounts and social spambots #1) and discovered that even when genuine users outnumber fake ones by 2483 accounts, they have similar percentages in some user features. Therefore, a copycat phenomenon is observed happening in some of them, from the fake accounts to the real accounts.
We also encountered some unique features that can help identify bot accounts in a significant way, especially in our observation of tweet features. From profile information, we selected four features that showed a significant difference between classes for the partitions: the number of times an account appears in a public list (listed_count), its public position (location), the number of tweets it has published (statuses_count), and its time zone (time_zone). Regarding tweet information, we used the following four: the number of URLs inside tweets (num_urls), from where it is published (source), the number of mentions appearing in the tweet (num_mentions), and the number of times it was retweeted (retweet_count). We base our selection process on analyzing each user and tweet feature’s PFD for both classes (human and bots). If we find that the categories or their associated frequency are significantly different, we add them to our initial selection. We then narrow this list to the features with the most contrasting PFD between classes. We performed the same three non-parametric tests described in Section 3.2.2 for these four tweet features and obtained the same results as before. Therefore, we assume we are working with a representative sample of the total tweets.
From the graphs designed in Section 3.3.1, we applied eight distinct partitions using these features extracted from profile and tweet information to help visualize differences between humans and social spambots. The resulting partitions expose an automatic behavior of social spambots, which we detail in our summary of findings in Table 2.

3.3.3. Concluding Remarks

With all this evidence, social spambots are a definite improvement from the traditional ones presented in Cresci et al.’s [34] 2015 database (Section 3.2), which is challenging to detect since they try to mimic human behavior accurately. However, even with these improvements, it is still possible to identify them. Some features cannot be easily replicated and can even expose botnets as seen in our analysis, such as the number of retweets done, how many appear on public lists, or their systematic increase in the number of tweets made. We finish this section by stating that this database has served as a benchmark in the literature, where its two classes (human and bot) are still differentiable, and their datasets are still used by the research community nowadays [24,37].

3.4. David et al. Database (2016)

In David et al.’s [40] 2016 private database, there is only one dataset holding the public information of 1644 profiles crawled from Twitter and 799,145 tweets (around the first 1000 of each account). There are two identifiable classes (human and bot) but no direct relationships between users.
The 1644 profiles are composed of 719 manually labeled human accounts from Mexico and 918 bot accounts from Spain and Argentina identified by the website BotsDeTwitter [59]. The authors distributed the 799,145 tweets into 262,765 for the human class and 536,380 for the bot class.
As there is only one dataset in the original database with both classes (human and bots) mixed, we manually divided them into two datasets for our depiction and analysis. As a result, we now have the human accounts dataset and the bot accounts dataset, with their associated user and tweet information.

3.4.1. Representation

As before, we depicted the data as simple graphs, representing users and tweets as nodes, also containing their features. For each class, we modeled the total of users and obtained a sample of 25,000 tweets using simple random sampling due to computational constraints.
From this modeling, we obtained four graph structures as a result: two from human accounts and two from bot accounts, containing their user and tweet information. These structures will be valuable in the next section for analyzing our chosen features using the partitions we create.

3.4.2. Analysis

We start this section by analyzing the different features extracted from the public API of Twitter by David et al. [40]. Our comparison of user features yielded the following results: we identified the language, account verification, description of the profile, and the same date of creation as significant features that can help us distinguish between classes.
In the analysis of tweet features we found that the number of retweets, type of tweet (original message, reply, or retweet), geolocation (latitude and longitude), and source are distinctive features that could identify a tweet’s class.
We made eight distinct partitions from the features available in the dataset, choosing the best ones at differentiating between classes. For this election, we manually compared their PFD [49] with the others in the set.
The first four were from user information, which we found to be representative of the difference between classes: the default language of the account (lang), the number of times an account appears in a public list (listed_count), the public position of the account (location), and the number of tweets that have published (statuses_count). The other four came from tweet information: from where it was published (source), how many times it was retweeted (retweet_count), what type it was (type), and the date it was created (created_at). As before, we verified that our sample and the total population followed the same distribution with the selected tweet features using the three non-parametric tests, obtaining similarly successful results. After inspecting the graph partitions, we discovered some interesting patterns concerning bot accounts. We detail our findings in Table 3.

3.4.3. Concluding Remarks

From all this information, we conclude that bots from Spanish-speaking countries behave similarly to their English counterparts. They are not as easy to identify as traditional bots but can still be distinguished: They prefer to post from a specific medium, not protect or verify their account, their tweets have identical creation dates and do mostly retweets on the platform. We will be revisiting this valuable information in Section 4 when identifying the behaviors of bot accounts from the literature.
Although this database has not been used in the literature as much as the others, especially when compared to Cresci et al.’s [35] 2017 database, we consider it useful to highlight similarities with bot accounts speaking in English. Our analysis demonstrated that they are not so different despite being from different countries and cultures. Its major drawback lies in the fewer features available: while the ones accessible are significant to differentiate between classes, the other three databases offer a more extensive range of features. We expand this database’s advantages and disadvantages in our comparison table of all four databases in Section 3.6.

3.5. Loyola-González et al. Database (2019)

Loyola-González et al.’s [33] 2019 private database consists of three datasets, named accordingly to the three available classes: human, bot, and politician. Each one contains 109 user and tweet features combined from both the original set and the newly proposed one. There are no direct relationships between users.
The human dataset has 28,135 tweets of verified human accounts, all written in English, and chosen from the original dataset genuine accounts of Cresci et al.’s [35] 2017 database. The bot dataset holds 19,804 tweets of bot accounts, also written in English and taken from a mixture of datasets social spambots #2, social spambots #3, and traditional spambots #1 of the same database [35]. The politician dataset contains 3519 tweets written in Spanish that the authors extracted using the public API of Twitter from four Mexican political figures on the eve of the presidential election in July 2018 [60].

3.5.1. Representation

Our graph representation for this database will follow the same guideline we have been using: nodes will contain user and tweet information (features) without relationships, as they are not directly accessible. No sampling is required as the size of the datasets does not exceed our computational power available.
As before, we use these graph structures to observe the PFD [49] of the user and tweet features we consider relevant. We also model the new features proposed by the authors in their feature model and present our findings in the next section.

3.5.2. Analysis

For our analysis, we first made a comparison between the three datasets to discover important behaviors or patterns of the classes (human, bot, and politician). We separated the original set of 109 features proposed in [33] that mixed user, tweet, sentiment analysis, and usage frequency information into three categories: the user-related features, the tweet-related features, and the sentiment analysis and usage frequency-related features.
From our comparison of the first category, we discovered that features related to the date of creation prove a systematic generation of bot accounts, as more than 15% of the total share the same hour, day, month, or year. They also tend to leave their user description empty, have zero favorites issued, or do not appear in public lists, similarly to the observed in the previous databases analyzed.
In the second category, tweet-related features, we observe a similar situation in other databases analyzed: tweets from bots do not have geolocation, replies, hashtags, or retweets. The reason for this situation is that they are a mix of traditional and social spambots from Cresci et al.’s [35] 2017 database and thus share similar characteristics.
The features related to sentiment analysis from our third category, being novel and inviting, reveal new information: the profile descriptions of bots are less objective than their human counterparts. Unfortunately, a sentiment analysis of tweets does not offer a clear distinction between humans and bots that speak English, as they express their feelings in a similar way. Meanwhile, frequency features disclose a schedule-oriented nature of the bot class for posting: they tweet more from 2 p.m. to 8 p.m. but not so much on Sundays, and have the least inactive users through the week of all three classes.
After this comparison, we selected eight features to create distinct partitions that will help us differentiate between classes using the graph structures of the previous section. For determining the features that contrast the accounts the most, we performed the same selection process as in the previous databases starting with a manual inspection of each one, and then compared their PFD [49] for the three classes.
From the user-related features available, we selected these three: its language (lang), the times it appears in public lists (listed_count), and its current place (location). We also chose the following three from all the tweet-related features available: the medium used for posting (source), how many retweets it has (retweet_count), and the number of mentions in the tweet (num_mentions). Finally, from the sentiment analysis and usage frequency features, we picked two: the frequency of posting on Sunday (sunday_tweetdist) and the score obtained in the sentiment analysis, ranging from very negative to very positive (sa_score_tag).
From the resulting partitions, we identified similar behaviors of the bot class with those of the other databases, but also some notable differences with the Spanish-speaking politician accounts. We present our findings summarized in Table 4 and the tweet partition of the sentiment analysis feature sa_score_tag in Figure 3.

3.5.3. Concluding Remarks

The introduction of Spanish-speaking politician accounts operated by humans presents a new opportunity to evaluate the problem of detection of social bots on Twitter from another perspective. While it is harder to separate between bots and humans as they are very similar, this third class has marked differences in both its behavior and characteristics. We have verified that just as bots can be of different types (content polluters, statistics enhancers, or political influencers) according to their programming, humans can also have varied behavior in accord to their agenda on the platform.
The new feature model proposed by the authors of this database provides exciting tools to separate classes. We think the frequency of posting for accounts and the sentiment analysis for tweets are impactful enough to observe hidden patterns, especially in bot and politician accounts. Combining them with the original features such as the number of favorites given or the source of tweets can be helpful for correct classification.
We consider this database the most complete regarding available features. It also incorporates Spanish-speaking accounts that enabled us to analyze them with their counterparts that speak in English. The main disadvantage we found is that it does not include follower/following relationships.

3.6. Discussion

To conclude this section, we present a summary of our final remarks of each database in Table 5. Although the database created by Cresci et al. [34] in 2015 is the oldest of all four that we have analyzed, the inclusion of follower/following relationships gives clear advantages over the others: it allows researchers to examine the social structure of the Twitter accounts directly by implementing social network analysis (SNA) techniques or calculating graph metrics. However, if we are looking for a more complete, diverse, and updated database, then Loyola-González et al.’s [33] 2019 database is a better option to work with: it offers new and non-language dependent features of usage frequency and sentiment analysis, a novel human class (Mexican politicians), and a mixture of different bot types from Cresci et al.’s [35] 2017 database.

4. Bot Behaviors

In this section, we present different behaviors of bots that appear across all bot datasets. We create a comparison chart comprising the estimated level of presence of these behaviors in each bot dataset under consideration and discuss our findings.
From our previous analysis of the four databases and their datasets, we discovered five distinct behaviors that were consistent across all bot datasets. By examining bots designed and operated from different regions and cultures, we have reduced the bias when introducing these bot behaviors. Each behavior has associated features that are independent of the language set in the bot’s public profile or its type (content polluters, statistics enhancers, or political influencers) and were the most contrasting in our analysis (Section 3). We believe that the five behaviors proposed have allowed us to characterize the bot class well enough to create an opportunity for researchers to incorporate them into their solutions. By quantifying each behavior’s presence in their feature representation, they can reduce the number of features used (especially in the first and third behavior) and possibly improve the state-of-the-art on bot detection. Next, we present each identified behavior.

4.1. Avoidance of Social Interaction

Bot accounts tend to form relationships with other bots rather than real accounts, reinforcing our line of thought that we might be dealing with botnets. They also avoid social interaction by rarely mentioning or replying to other users in their tweets (lowest is around 0% from the third dataset), participating in hashtags (with the lowest around 4% from the fourth dataset), or giving favorites (the second dataset has the lowest with 9%). An observable consequence of this is their low appearance in public lists (an average of about 50% from all four datasets), more notable when compared with real accounts (highest is 100% from the fourth dataset), and almost non-existent for traditional spambots (down to 0%). We associate this behavior with the following features from our previous analysis of the four databases: user feature favourites_count (the number of favorites the user has given), user feature listed_count (in how many public lists the user appears), tweet feature in_reply_to_user_id (the ID of the user replied), tweet feature num_mentions (the number of mentions in the tweet), and tweet feature num_hashtags (the number of hashtags in the tweet).

4.2. Rejection of Geolocation

Botmasters (owners) do not activate geolocation services (the lowest is 97% from the last dataset), which is a feature associated with the user and tweet feature geo_enabled (if the user activated the geolocation for its profile or tweets). While these botmasters can manually set their location to cover appearances, geolocation services are harder to deceive. These services try to provide an approximate real-world geographic location (latitude and longitude) from where the connection to the platform is being established, making them more precise. The time zone is also related to the location, as it can determine to which region or country of the world the account belongs. For that matter, while geolocation is not favored, the selection of a time zone is different for the two types of bots studied in this section. The owners of old, traditional bots prefer to enclose this information as non-essential for operating on Twitter (about 0% activated it), which is less hard to spot. The owners of new, improved bots fix this issue by filling in time zone information to mimic human behavior (around 91% activated it for the second dataset). The time zone checks with the reported location in most cases, so we did not find significant discrepancies here.

4.3. Scarce Profile Information

Bots are inclined to leave their public profile information empty (72% of bots in the first dataset, 36% in average from all four). We relate this behavior to these features: user feature default_profile (if the user left the profile’s default settings), user feature profile_use_background_image (if the user is using a custom background instead of the default), and user feature description (if the user has filled it). Because filling public profile information on Twitter is optional, several fake accounts leave their profile picture, background, or description in its default setting, as it does not contribute to their programmed objective. This occurrence, in combination with the first behavior, makes us believe the reason the bot accounts from these datasets are unpopular on the platform is that they do not create relations with others by design. Programmers built them to generate interactions with their promoted links or inflate statistics of other accounts. We support our assertion with the fact that they have a low amount of real followers compared to their number of followings, mostly being other illegitimate accounts. This fact, in turn, explains why their posts are generally unappealing for a broader audience, as these bot accounts have a significant amount of tweets with few retweets or favorites (around 70% in average from all four datasets).

4.4. Sole Tweeting Purpose

The bots from these datasets mainly focus on creating new messages or retweeting a post from somebody else but rarely reply to others (about 2% in average from all four datasets). As programmers designed them for a specific function, bot accounts do not diverge much in other types of interaction. In part, this design has allowed researchers to create a better bot classification by assigning them types according to their recurring content created, especially notorious when compared to a more balanced content created by humans. However, sentiment analysis revealed a compelling occurrence: the new type of social spambots mimic and express human emotions so well in their tweets that it is not easy to distinguish which class they belong to with certainty [35]. For this behavior, we selected the following feature from our analysis that best represents it: the tweet feature type (indicates if the tweet is a reply, a retweet, or an original message).

4.5. The Preferred Platform for Posting

Botmasters have a preferred medium to publish their content (with the first dataset having around 99% and in average 55% from all four). We associated the following features to this behavior: tweet partition source (the medium used to post the tweet). Whether old or new, bots stick to one or two applications of their choice, where they usually publish more than 50% of their total tweets, which are not used as much by their genuine counterparts. Accordingly, the platforms that real accounts prefer are barely used by bots, making a significant difference in graph partitions of databases. It is worth mentioning the contribution usage frequency makes, as they helped us identify the time patterns spambots have when publishing tweets, especially their most active (2 p.m.–8 p.m.) and inactive (12 a.m.–8 a.m.) hours, which lead to the assumption of a human operator behind them.
Finally, for a visualization of the difference between bot datasets regarding these behaviors, we have created a comparison chart (radar chart), available in Figure 4. Using the results from the analysis of the four different bot datasets, we represent each bot behavior as a point in the radar chart, where its position (from 0% to 100%) is the average of the sum of their associated features’ percentages. Therefore, a point near the center (towards 0%) represents the lowest level of presence the bot behavior has in that bot dataset and vice versa.
From the graph, we can observe that Cresci et al.’s [34] 2015 bot dataset obtained the highest score in all five distinct behaviors because traditional spambots are the oldest, easiest to identify, and least complex of the four bot datasets we have analyzed. However, the new type of social spambots from Cresci et al.’s [35] 2017 bot dataset try to correct these behaviors to blend with real accounts and thus obtained the lowest overall score of the four datasets. Accordingly, Loyola-González et al.’s [33] 2019 bot dataset has similar scores to the previous two datasets, as it contains a mixture of traditional and novel spambots. Interestingly, David et al.’s [40] 2016 bot dataset obtained the lowest score in two behaviors (avoid social interaction and sole tweeting purpose). We attribute this to a different design of bot accounts, probably due to being in a different region of the world (they come from Hispanic countries). However, the other three behaviors are close to the second-highest score of all the four bot datasets, and thus we consider they balance the results of this bot dataset, making the five bot behaviors presented still applicable for characterizing bot accounts.

5. Challenges

Our analysis of four different databases from the literature of bot detection on Twitter has left us valuable insights into what researchers face while working with them. We have summarized them into four key challenges presented in the following paragraphs that we found the most time-consuming and recurring among the analyzed databases. At the end of each one, we provide a suggestion on how to avoid or prevent them. We conclude this section by giving our final remarks and recommendations.

5.1. Corrupted Data

While the gathering of public information is generally automated using collectors connected to API endpoints [61], they are not exempt from failure, leading to the storage of corrupted data. This corruption can cause the loss of critical information, especially on social networks, where the analysis of individual or collective data of bots can lead to the discovery of botmasters hidden in the social network [6]. We believe that managing and curating the content shared in the databases can help both their creators and researchers. Creators would benefit from a greater reach and popularity for using easy-to-implement databases. Researchers can save the time, processing, and resources needed to detect and discard damaged data that can slow down the flow of the research.

5.2. Accounts’ Metadata

Twitter offers a full list of attributes that can be extracted by researchers from an account using its API, named the data dictionary [62]. However, this data dictionary was not consistent across all the databases we analyzed from the literature, resulting in a mismatch between the attributes used across the databases. This discrepancy reduced the quantity of the account metadata available to be worked with, hindering our comparison between bots from different databases. As bots are becoming harder to detect (especially for human annotators [23]), we encourage database creators to extract the full data dictionary of accounts that is available in the API and make it available in their collections to improve the consistency across all databases. We consider it essential to clarify that this data dictionary (extracted directly from Twitter API) is independent of the feature model chosen by researchers for experimentation, as it represents all the public information available from an account, which is crucial when dealing with bots that can disappear at any moment from the platform [35].

5.3. Lack of Ground Truth Data

There is limited availability of human-labeled databases in the literature of bot detection on Twitter, also acknowledged by researchers [23,25]. Moreover, new databases extracted from the API must follow the recent changes in the policies and guidelines of Twitter for developers [63] that address previous privacy concerns and regulates the sharing of public information. These changes have resulted in most recent databases being made private and restricted. However, the few publicly available databases face some problems as well. Most of them contain a mixed type of bot accounts without a clear distinction among them and are not big enough to be considered a significant sample [25]. To solve this, we suggest database creators and the Twitter platform be less restrictive about the sharing of data with researchers and provide access to large databases since not everyone has the resources and time to create a big collection on their own.

5.4. Outdated Collections

The majority of bots and some of the genuine accounts stored in the databases are currently banned, deleted, or private. This occurrence, along with the lack of features, the limited databases available, and the damaged data stored, hinders the ability of the researcher to analyze bots in the wild and validate their findings. We consider it especially true for bot detection techniques that rely on analyzing relationship information, such as the work of Lingam et al. [64]. Nowadays, it is almost impossible to recreate the connections the account had when the database creators discovered them, and in some cases, researchers have to rely on databases more than four years old or create their own to validate their approaches [64]. For the reasons presented before, we emphasize the importance of collecting as much public information of the accounts as possible, preserving their characteristics, so new approaches do not become short-handed or limited.
We believe that the previous discussion of these challenges will bring awareness to researchers looking to create their databases and thus improve the quality of future collections published in the literature. While the changes in Twitter policies aim to improve user experience and security on the platform, we consider there is still an area of opportunity to facilitate the work of researchers working with Twitter information. Finally, while we identified these challenges on Twitter databases, they can appear in any data collection that requires extraction and storage, and thus we consider our suggestions valid for any researcher gathering information.

6. Conclusions

In the literature, bot detection on Twitter is a topic that has gained popularity due to the increased risk bots represent to free will and opinion as the popular social network expands. Researchers have agreed on the necessity to characterize bots on the platform at a behavioral level due to their increasing complexity that has overcome the traditional analysis of individual features.
In this work, we have analyzed both public and private databases from the literature of bot detection on Twitter. We summarized their advantages, disadvantages, and differences, recommending which is more suitable to work with depending on the necessities of the researcher. This analysis revealed five distinct behaviors in automated accounts exhibited across all the bot datasets analyzed from these databases. We measured their level of presence in each dataset using a radar chart for visual comparison, discussing our results. Lastly, we identified four challenges researchers of bot detection on Twitter have to face when using these databases from the literature.
We conclude that our recommendation of a database to work with from the ones we have analyzed depends on the need of follower/following relationships, and not only on the number of attributes extracted from the Twitter API. While our work does not directly improve classification results, the set of behaviors we have identified can characterize bot accounts from different datasets independently of their type, language used, year of creation, and complexity. While we acknowledge that current research has changed its focus to a group-detection effort, we consider our contributions are still applicable. Researchers can treat these behaviors as a series of individual decisions in the platform that they can develop as collective actions.
The present work pretends to serve as a starting point for new researchers working with Twitter databases from the literature, and to not repeat the same mistakes from other researchers when extracting their own information. As Cresci [12] recently stated, with the constant increase of publications focused on bot detection, the scientific community needs to evaluate the tools currently at their disposal. We soundly agree, and thus it is one of the motivations for which we carry out this work. We hope that the results of this study can inspire researchers to incorporate behavioral analysis in their individual or group detection approaches.
Finally, database creators can take into account our suggestions presented and improve the quality of their future collections. We believe that much of what we have learned and discussed here can be applied by researchers to data collections of different natures, with our contributions aiming to help future researchers that are looking to implement new strategies to detect automated accounts effectively.
For future work, we intend to create a feature representation that incorporates the five behaviors presented before to improve the state-of-the-art methods. We would also like to study databases of bots on other social networks to identify possible behaviors appearing across all of them, and not only Twitter. Finally, in our graph partitions, we discovered clusters of colored nodes without follower/following relationships connecting them. We want to explore them further as they could contain valuable insights.

Author Contributions

Methodology, L.D.S.-E.; software, L.D.S.-E.; formal analysis, L.D.S.-E.; investigation, L.D.S.-E.; writing—original draft, L.D.S.-E.; resources, O.L.-G.; supervision, O.L.-G., R.M. and M.A.M.-P.; writing—review and editing, O.L.-G., R.M. and M.A.M.-P.; validation, O.L.-G., R.M. and M.A.M.-P.; conceptualization, R.M.; visualization, M.A.M.-P. All authors have read and agreed to the published version of the manuscript.

Funding

This research was funded by the National Council of Science and Technology of Mexico (CONACyT) through the scholarship grant 540975.

Institutional Review Board Statement

Not applicable.

Informed Consent Statement

Not applicable.

Data Availability Statement

Two publicly available datasets were analyzed in this study. This data can be found here: https://sites.google.com/view/danielescalante/ (accessed on 20 April 2021). The other two private datasets presented in this study are available on request from the corresponding author. The data are not publicly available due to creator ownership and Twitter privacy policy.

Conflicts of Interest

The authors declare no conflict of interest.

Short Biography of Authors

Applsci 11 04105 i001Luis Daniel Samper-Escalante obtained a M.Sc. in Intelligent Systems in 2017 from the Tecnologico de Monterrey, where he is currently pursuing a PhD. in Computer Science. In 2017 he was honored with the Summa Cum Laude recognition as the highest GPA of all the generation when he finished his Master’s Degree. He has been publishing different articles since 2013 on National and International Conferences as well as Indexed and Refereed Journals. His research interests include Botnet Detection on Twitter, Wireless Sensor Networks, Swarm Intelligence, Graph Mining, and Provenance.
Applsci 11 04105 i002Octavio Loyola-González received his PhD degree in Computer Science from the National Institute for Astrophysics, Optics, and Electronics, Mexico, in 2017. He has won several awards from different institutions due to his research work on applied projects; consequently, he is a Member of the National System of Researchers in Mexico (Rank1). He worked as a distinguished professor and researcher at Tecnologico de Monterrey, Campus Puebla, for undergraduate and graduate programs of Computer Sciences. Currently, he is responsible for running Machine Learning & Artificial Intelligence practice inside Altair Management Consultants Corp., where he is involved in the development and implementation using analytics and data mining in the Altair Compass department. He has outstanding experience in the fields of big data & pattern recognition, cloud computing, IoT, and analytical tools to apply them in sectors where he has worked for as Banking & Insurance, Retail, Oil&Gas, Agriculture, Cybersecurity, Biotechnology, and Dactyloscopy. From these applied projects, Dr. Loyola-González has published several books and papers in well-known journals, and he has several ongoing patents as manager and researcher in Altair Compass.
Applsci 11 04105 i003Raúl Monroy obtained a a Ph.D. degree in Artificial Intelligence from Edinburgh University, in 1998, under the supervision of Prof. Alan Bundy. He has been in Computing at Tecnologico de Monterrey, Campus Estado de México, since 1985. In 2010, he was promoted to (full) Professor in Computer Science. Since 1998, he is a member of the CONACYT-SNI National Research System, rank three. Together with his students and members of his group, Machine Learning Models (GIEE–MAC), Prof. Monroy studies the discovery and application of novel model machine learning models, which he often applies to cybersecurity problems. At Tecnologico de Monterrey, he is also Head of the graduate programme in computing, at region CDMX.
Applsci 11 04105 i004Miguel Angel Medina-Pérez received a Ph.D. in Computer Science from the National Institute of Astrophysics, Optics, and Electronics, Mexico, in 2014. He is currently a Research Professor with the Tecnologico de Monterrey, Campus Estado de Mexico, where he is also a member of the GIEE-ML (Machine Learning) Research Group. He has rank 1 in the Mexican Research System. His research interests include Pattern Recognition, Data Visualization, Explainable Artificial Intelligence, Fingerprint Recognition, and Palmprint Recognition. He has published tens of papers in referenced journals, such as “Information Fusion,” “IEEE Transactions on Affective Computing,” “Pattern Recognition,” “IEEE Transactions on Information Forensics and Security,” “Knowledge-Based Systems,” “Information Sciences,” and “Expert Systems with Applications.” He has extensive experience developing software to solve Pattern Recognition problems. A successful example is a fingerprint and palmprint recognition framework which has more than 1.3 million visits and 135 thousand downloads.

References

  1. Ortiz-Ospina, E. The Rise of Social Media. Our World in Data. 18 September 2019. Available online: https://ourworldindata.org/rise-of-social-media (accessed on 6 October 2020).
  2. Orabi, M.; Mouheb, D.; Al Aghbari, Z.; Kamel, I. Detection of Bots in Social Media: A Systematic Review. Inf. Process. Manag. 2020, 57, 102250. [Google Scholar] [CrossRef]
  3. Rovetta, S.; Suchacka, G.; Masulli, F. Bot recognition in a Web store: An approach based on unsupervised learning. J. Netw. Comput. Appl. 2020, 157, 102577. [Google Scholar] [CrossRef]
  4. Asadi, M.; Jabraeil Jamali, M.A.; Parsa, S.; Majidnezhad, V. Detecting botnet by using particle swarm optimization algorithm based on voting system. Future Gener. Comput. Syst. 2020, 107, 95–111. [Google Scholar] [CrossRef]
  5. Porche, I.R. Cyberwarfare: An Introduction to Information-Age Conflict; Artech House: Boston, MA, USA, 2020; p. 380. [Google Scholar]
  6. Besel, C.; Echeverria, J.; Zhou, S. Full Cycle Analysis of a Large-Scale Botnet Attack on Twitter. In Proceedings of the 2018 IEEE/ACM International Conference on Advances in Social Networks Analysis and Mining (ASONAM’18), Barcelona, Spain, 30 August 2018; pp. 170–177. [Google Scholar] [CrossRef]
  7. Yang, K.C.; Varol, O.; Davis, C.A.; Ferrara, E.; Flammini, A.; Menczer, F. Arming the public with artificial intelligence to counter social bots. Hum. Behav. Emerg. Technol. 2019, 1, 48–61. [Google Scholar] [CrossRef] [Green Version]
  8. Latah, M. Detection of malicious social bots: A survey and a refined taxonomy. Expert Syst. Appl. 2020, 151, 113383. [Google Scholar] [CrossRef]
  9. Freitas, C.; Benevenuto, F.; Ghosh, S.; Veloso, A. Reverse Engineering Socialbot Infiltration Strategies in Twitter. In Proceedings of the 2015 IEEE/ACM International Conference on Advances in Social Networks Analysis and Mining (ASONAM’15), Paris, France, 25–28 August 2015; pp. 25–32. [Google Scholar] [CrossRef] [Green Version]
  10. Gyftopoulos, S.; Drosatos, G.; Stamatelatos, G.; Efraimidis, P.S. A Twitter-based approach of news media impartiality in multipartite political scenes. Soc. Netw. Anal. Min. 2020, 10, 36. [Google Scholar] [CrossRef]
  11. Zhao, Z.; Zhao, J.; Sano, Y.; Levy, O.; Takayasu, H.; Takayasu, M.; Li, D.; Wu, J.; Havlin, S. Fake news propagates differently from real news even at early stages of spreading. EPJ Data Sci. 2020, 9, 7. [Google Scholar] [CrossRef]
  12. Cresci, S. A Decade of Social Bot Detection. Commun. ACM 2020, 63, 72–83. [Google Scholar] [CrossRef]
  13. Gorwa, R. Twitter Has a Serious Bot Problem, and Wikipedia Might Have the Solution. Quartz. 23 October 2017. Available online: https://qz.com/1108092/ (accessed on 19 August 2020).
  14. Ferrara, E.; Varol, O.; Davis, C.; Menczer, F.; Flammini, A. The Rise of Social Bots. Commun. ACM 2016, 59, 96–104. [Google Scholar] [CrossRef] [Green Version]
  15. Twitter Public Policy. Update on Twitter’s Review of the 2016 US Election. Twitter Incorporated. 2018. Available online: https://blog.twitter.com/official/en_us/topics/company/2018/2016-election-update.html (accessed on 15 October 2019).
  16. Shaban, H. Twitter Reveals Its Daily Active User Numbers for the First Time. The Washington Post. 8 February 2019. Available online: https://www.washingtonpost.com/technology/2019/02/07/twitter-reveals-its-daily-active-user-numbers-first-time/ (accessed on 11 March 2020).
  17. Twitter Investor Relations. Q4 and Fiscal Year 2018 Letter to Shareholders. Twitter Incorporated. 2019. Available online: https://s22.q4cdn.com/826641620/files/doc_financials/2018/q4/Q4-2018-Shareholder-Letter.pdf (accessed on 22 August 2019).
  18. Subrahmanian, V.S.; Azaria, A.; Durst, S.; Kagan, V.; Galstyan, A.; Lerman, K.; Zhu, L.; Ferrara, E.; Flammini, A.; Menczer, F. The DARPA Twitter Bot Challenge. Computer 2016, 49, 38–46. [Google Scholar] [CrossRef] [Green Version]
  19. Varol, O.; Ferrara, E.; Davis, C.; Menczer, F.; Flammini, A. Online Human-Bot Interactions: Detection, Estimation, and Characterization. In Proceedings of the 2017 Eleventh International AAAI Conference on Web and Social Media (ICWSM’17), Montréal, QC, Canada, 15–18 May 2017; pp. 280–289. [Google Scholar]
  20. Sysomos. An In-Depth Look at the Most Active Twitter User Data. Meltwater Social. 2009. Available online: https://sysomos.com/inside-twitter/most-active-twitter-user-data/ (accessed on 31 August 2020).
  21. Elsevier. Scopus. Elsevier B.V. 2020. Available online: https://www.scopus.com/ (accessed on 20 April 2021).
  22. Bessi, A.; Ferrara, E. Social bots distort the 2016 U.S. Presidential election online discussion. First Monday 2016, 21, 1–14. [Google Scholar] [CrossRef]
  23. Aljohani, N.; Fayoumi, A.; Hassan, S.U. Bot prediction on social networks of Twitter in altmetrics using deep graph convolutional networks. Soft Comput. 2020, 24, 11109–11120. [Google Scholar] [CrossRef]
  24. Pozzana, I.; Ferrara, E. Measuring Bot and Human Behavioral Dynamics. Front. Phys. 2020, 8, 125. [Google Scholar] [CrossRef] [Green Version]
  25. Echeverria, J.; Zhou, S. Discovery, Retrieval, and Analysis of the Star Wars Botnet in Twitter. In Proceedings of the 2017 IEEE/ACM International Conference on Advances in Social Networks Analysis and Mining (ASONAM’17), Sydney, Australia, 31 July–3 August 2017; pp. 1–8. [Google Scholar] [CrossRef] [Green Version]
  26. Kwak, H.; Lee, C.; Park, H.; Moon, S. What is Twitter, a Social Network or a News Media? In Proceedings of the 2010 19th International Conference on World Wide Web (WWW’10), Raleigh, NC, USA, 26–30 April 2010; pp. 591–600. [Google Scholar] [CrossRef] [Green Version]
  27. Klymenko, O. Twitterverse: The birth of new words. Proc. Linguist. Soc. Am. 2019, 4, 1–12. [Google Scholar] [CrossRef] [Green Version]
  28. Efstathiades, H.; Antoniades, D.; Pallis, G.; Dikaiakos, M.D.; Szlávik, Z.; Sips, R. Online social network evolution: Revisiting the Twitter graph. In Proceedings of the 2016 IEEE International Conference on Big Data (BigData’16), Washington, DC, USA, 5–8 December 2016; pp. 626–635. [Google Scholar] [CrossRef]
  29. Daher, L.A.; Zantout, R.; Elkabani, I.; Almustafa, K. Evolution of Hashtags on Twitter: A Case Study from Events Groups. In Proceedings of the 2018 5th International Symposium on Data Mining Applications (SDMA’18), Riyadh, Saudi Arabia, 21–22 March 2018; pp. 181–194. [Google Scholar] [CrossRef]
  30. Bastian, M.; Heymann, S.; Jacomy, M. Gephi: An Open Source Software for Exploring and Manipulating Networks. In Proceedings of the 2009 Third International AAAI Conference on Web and Social Media (ICWSM’09), San Jose, CA, USA, 17–20 May 2009; pp. 361–362. [Google Scholar]
  31. Motamedi, R.; Jamshidi, S.; Rejaie, R.; Willinger, W. Examining the evolution of the Twitter elite network. Soc. Netw. Anal. Min. 2019, 10, 1. [Google Scholar] [CrossRef]
  32. Roth, Y. Bot or Not? The Facts about Platform Manipulation on Twitter. Twitter Incorporated. 2020. Available online: https://blog.twitter.com/en_us/topics/company/2020/bot-or-not.html (accessed on 3 June 2020).
  33. Loyola-González, O.; Monroy, R.; Rodríguez, J.; Lopez Cuevas, A.; Mata Sánchez, J. Contrast Pattern-Based Classification for Bot Detection on Twitter. IEEE Access 2019, 7, 45800–45817. [Google Scholar] [CrossRef]
  34. Cresci, S.; Di Pietro, R.; Petrocchi, M.; Spognardi, A.; Tesconi, M. Fame for sale: Efficient detection of fake Twitter followers. Decis. Support Syst. 2015, 80, 56–71. [Google Scholar] [CrossRef] [Green Version]
  35. Cresci, S.; Di Pietro, R.; Petrocchi, M.; Spognardi, A.; Tesconi, M. The Paradigm-Shift of Social Spambots: Evidence, Theories, and Tools for the Arms Race. In Proceedings of the 2017 26th International Conference on World Wide Web Companion (WWW’17), Perth, Australia, 3–7 April 2017; pp. 963–972. [Google Scholar] [CrossRef] [Green Version]
  36. Kumar, G.; Rishiwal, V. Machine learning for prediction of malicious or spam users on social networks. Int. J. Sci. Technol. Res. 2020, 9, 926–932. [Google Scholar]
  37. Fazzolari, M.; Pratelli, M.; Martinelli, F.; Petrocchi, M. Emotions and Interests of Evolving Twitter Bots. In Proceedings of the 2020 IEEE Conference on Evolving and Adaptive Intelligent Systems (EAIS’20), Bari, Italy, 27–29 May 2020; pp. 1–8. [Google Scholar] [CrossRef]
  38. Chu, Z.; Gianvecchio, S.; Wang, H.; Jajodia, S. Who is tweeting on Twitter: Human, bot, or cyborg? In Proceedings of the 2010 26th Annual Computer Security Applications Conference (ACSAC’10), Austin, TX, USA, 5–9 December 2010; pp. 21–30. [Google Scholar] [CrossRef]
  39. Krogh, A. What are artificial neural networks? Nat. Biotechnol. 2008, 26, 195–197. [Google Scholar] [CrossRef]
  40. David, I.; Siordia, O.S.; Moctezuma, D. Features combination for the detection of malicious Twitter accounts. In Proceedings of the 2016 IEEE International Autumn Meeting on Power, Electronics and Computing (ROPEC’16), Ixtapa, Mexico, 9–11 November 2016; pp. 1–6. [Google Scholar] [CrossRef]
  41. Breiman, L. Random Forests. Mach. Learn. 2001, 45, 5–32. [Google Scholar] [CrossRef] [Green Version]
  42. Liu, L.; Özsu, M.T. Contrast Pattern Based Classification. In Encyclopedia of Database Systems; Springer: Boston, MA, USA, 2009; p. 494. [Google Scholar] [CrossRef]
  43. Echeverria, J.; De Cristofaro, E.; Kourtellis, N.; Leontiadis, I.; Stringhini, G.; Zhou, S. LOBO: Evaluation of Generalization Deficiencies in Twitter Bot Classifiers. In Proceedings of the 2018 34th Annual Computer Security Applications Conference (ACSAC’18), San Juan, PR, USA, 3–7 December 2018; pp. 137–146. [Google Scholar] [CrossRef] [Green Version]
  44. Abokhodair, N.; Yoo, D.; McDonald, D.W. Dissecting a Social Botnet: Growth, Content and Influence in Twitter. In Proceedings of the 2015 18th ACM Conference on Computer Supported Cooperative Work & Social Computing (CSCW’15), Vancouver, BC, Canada, 14–18 March 2015; pp. 839–851. [Google Scholar] [CrossRef] [Green Version]
  45. Mazza, M.; Cresci, S.; Avvenuti, M.; Quattrociocchi, W.; Tesconi, M. RTbust: Exploiting Temporal Patterns for Botnet Detection on Twitter. In Proceedings of the 2019 10th ACM Conference on Web Science (WebSci’19), Boston, MA, USA, 30 June–3 July 2019; pp. 183–192. [Google Scholar] [CrossRef] [Green Version]
  46. Priem, J.; Groth, P.; Taraborelli, D. The Altmetrics Collection. PLoS ONE 2012, 7, 1–2. [Google Scholar] [CrossRef] [Green Version]
  47. Oracle Corporation. Java SE. Oracle. 2019. Available online: https://www.oracle.com/technetwork/java/javase/overview/index.html (accessed on 11 February 2020).
  48. Jacomy, M.; Venturini, T.; Heymann, S.; Bastian, M. ForceAtlas2, a Continuous Graph Layout Algorithm for Handy Network Visualization Designed for the Gephi Software. PLoS ONE 2014, 9, 1–12. [Google Scholar] [CrossRef] [PubMed]
  49. Lavrakas, P. Percentage Frequency Distribution. In Encyclopedia of Survey Research Methods; SAGE Publications Incorporated: Thousand Oaks, CA, USA, 2008; pp. 577–578. [Google Scholar] [CrossRef]
  50. Scopus. What Is Field-weighted Citation Impact (FWCI)? Elsevier B.V. 2020. Available online: https://service.elsevier.com/app/answers/detail/a_id/14894/ (accessed on 20 March 2021).
  51. Singh, S. Simple Random Sampling. In Advanced Sampling Theory with Applications; Springer: Dordrecht, Netherlands, 2003; Chapter 2; pp. 71–136. [Google Scholar] [CrossRef]
  52. Hinkle, D.E.; Wiersma, W.; Jurs, S.G. Applied Statistics for the Behavioral Sciences; Houghton Mifflin Harcourt: Boston, MA, USA, 2003; p. 756. [Google Scholar]
  53. Sheskin, D.J. Handbook of Parametric and Nonparametric Statistical Procedures; Chapman & Hall/CRC: Boca Raton, FL, USA, 2007; p. 1776. [Google Scholar]
  54. Wolfram. Graph Measures & Metrics. Wolfram Research Incorporated. 2020. Available online: https://reference.wolfram.com/language/guide/GraphMeasures.html (accessed on 21 June 2020).
  55. Akrami, A.; Rostami, H.; Khosravi, M.R. Design of a reservoir for cloud-enabled echo state network with high clustering coefficient. EURASIP J. Wirel. Commun. Netw. 2020, 2020, 64. [Google Scholar] [CrossRef] [Green Version]
  56. Grover, P.; Kar, A.K.; Dwivedi, Y.K.; Janssen, M. Polarization and acculturation in US Election 2016 outcomes - Can twitter analytics predict changes in voting preferences. Technol. Forecast. Soc. Chang. 2019, 145, 438–460. [Google Scholar] [CrossRef]
  57. Avvenuti, M.; Bellomo, S.; Cresci, S.; La Polla, M.N.; Tesconi, M. Hybrid Crowdsensing: A Novel Paradigm to Combine the Strengths of Opportunistic and Participatory Crowdsensing. In Proceedings of the 26th International Conference on World Wide Web Companion (WWW’17), Perth, Australia, 3–7 April 2017; pp. 1413–1421. [Google Scholar] [CrossRef] [Green Version]
  58. Yang, C.; Harkreader, R.; Gu, G. Empirical Evaluation and New Design for Fighting Evolving Twitter Spammers. IEEE Trans. Inf. Forensics Secur. 2013, 8, 1280–1293. [Google Scholar] [CrossRef]
  59. BotsDeTwitter. @BotsPoliticosNo. WordPress. 2019. Available online: https://botsdetwitter.wordpress.com/ (accessed on 22 March 2020).
  60. Althaus, D. These Are The Four Candidates in Mexico’s Presidential Election. The Washington Post. 2018. Available online: https://www.washingtonpost.com/news/worldviews/wp/2018/06/29/these-are-the-four-candidates-in-mexicos-presidential-election/ (accessed on 10 April 2020).
  61. Wright, J.; Anise, O. Don’t @ Me: Hunting Twitter Bots at Scale. In Proceedings of the 2018 Black Hat USA (BlackHat’18), Mandalay Bay, LV, USA, 4–9 August 2018; pp. 1–43. [Google Scholar]
  62. Twitter Dev. Data Dictionary: The Set of Features That Can Be Extracted from the Twitter API Regarding a User’s Public Information. Twitter Incorporated. 2021. Available online: https://developer.twitter.com/en/docs/twitter-api/data-dictionary (accessed on 20 April 2021).
  63. Twitter Dev. Developer Agreement and Policy. Twitter Incorporated. 2020. Available online: https://developer.twitter.com/en/developer-terms/agreement-and-policy (accessed on 15 November 2020).
  64. Lingam, G.; Rout, R.R.; Somayajulu, D.; Das, S.K. Social Botnet Community Detection: A Novel Approach Based on Behavioral Similarity in Twitter Network Using Deep Learning. In Proceedings of the 2020 15th ACM Asia Conference on Computer and Communications Security (ACCS’20), Taipei, Taiwan, 5–9 October 2020; pp. 708–718. [Google Scholar] [CrossRef]
Figure 1. The number of publications on bot detection and bot detection on Twitter for the last ten years in Scopus. We observed a significant increase in interest in 2016 matching the controversy of the U.S. federal election. The data for 2020 were gathered until September.
Applsci 11 04105 g001
Figure 2. Graph coloring using in-degree (follower relationships) for the TFP dataset (left) and the FSF dataset (right), both from Cresci et al.’s [34] 2015 database. It follows a color gradient, starting with purple for nodes with the fewest relationships and ending with green for most. Bots (right) have more high-connected nodes (red color) than humans (left), which have more low-connected nodes (purple color).
Applsci 11 04105 g002
Figure 3. Nearly half of the tweets from the human dataset do not express a sentiment in the tweet partition of the sentiment analysis feature sa_score_tag from Loyola-González et al.’s [33] 2019 database. Each color depicts the category (score in sentiment analysis) and its percentage of nodes (tweets).
Applsci 11 04105 g003
Figure 4. Estimated level of presence of the five bot behaviors in Cresci et al.’s [34] 2015 bot dataset, Cresci et al.’s [35] 2017 bot dataset, David et al.’s [40] 2016 bot dataset, and Loyola-González et al.’s [33] 2019 bot dataset, where the points depict the farthest (towards 0%) or nearest (towards 100%) they are from that bot behavior. The exposed behaviors can identify the bots from all four datasets, some easier than others.
Applsci 11 04105 g004
Table 1. A summary of our findings when analyzing the graph partitions of our chosen user (first two) and tweet (last two) features from the TFP dataset (certified human accounts) and the FSF dataset (fake accounts bought online) of Cresci et al.’s [34] 2015 database.
FeatureKey Findings
favourites_count94% of bots gave no favorite since created, which is drastically different from humans, which have 20%.
friends_countThe average of bots’ followings is around 210, and several of them follow each other.
retweet_countThere is a retweeting behavior for a small group of bot accounts that could be the work of a botnet.
sourceAlmost all of the bots’ tweets come from the web, compared to the diversity of sources of humans’ tweets.
Table 2. A summary of our findings when analyzing our graph partitions of the chosen user (first four) and tweet (last four) features from the genuine accounts dataset and the social spambots #1 dataset of Cresci et al.’s [35] 2017 database.
FeatureKey Findings
listed_countHalf of the social spambots do not appear on public lists compared to one-quarter of the genuine accounts.
locationMost of the bots are from Italy as they are retweeters of an Italian politician, contrary to genuine accounts that are scattered throughout the world.
statuses_countMore than 15% of bot accounts have a similar number of tweets with increments of 0.10% in their PFD [49].
time_zoneThe time zone of the bots is mostly from Europe, which agrees with their reported location.
num_urlsAbout 6% of bot tweets have at least one URL, compared to 15% of human tweets.
sourceThe genuine accounts usually utilize iPhone to tweet, while bot accounts diversify between many devices.
num_mentions97% of the bots’ tweets do not mention other users, different to humans with about 40%.
retweet_countThree-quarters of the bots’ tweets have no retweets, while humans’ tweets have more than half.
Table 3. A summary of our findings when analyzing our graph partitions of the chosen user (first four) and tweet (last four) features from the human accounts dataset and the bot accounts dataset of David et al.’s [40] 2016 database.
FeatureKey Findings
langMore than 90% of bot accounts set their default language to Spanish, while roughly 70% of human accounts did.
listed_countBot accounts are not present in public lists (about 64%) as much as human accounts are (roughly 76%).
locationBot accounts are spread around the world when they should be in places near Spain or Argentina.
statuses_countBots tend to post more than 1000 tweets. In contrast, humans tend to have less than 100 tweets.
sourceHumans tweet more from an iPhone device (35%) while bots prefer the TweetDeck platform (about 50%).
retweet_countBots have less tweets without a retweet (around one-fourth) compared to human tweets (about half).
typeBots do more retweets (75%) than original content, which directly contrasts with human behavior (27%).
created_atAlmost 31% of bot tweets have same creation dates, compared to only 0.6% of human tweets.
Table 4. A summary of our findings when analyzing our graph partitions of the chosen user (first three), tweet (middle three), and tweet sentiment analysis and usage frequency (last two) features from the human, the bot, and the politician classes of Loyola-González et al.’s [33] 2019 database.
FeatureKey Findings
lang92% of bots and humans set their language to English and all Mexican politicians picked Spanish.
listed_countAll politicians appear in more than 950 public lists, and bots have the lowest appearance in public lists.
locationMost of bots do not have a location (87%), which is higher than humans (27%) and politicians (0%).
sourceBot accounts prefers to use different applications (TweetAdder) than the other classes to tweet.
retweet_count97% of the tweets made by bots do not get retweeted, but for politicians it is only 10%.
num_mentionsBots mention other users scarcely (11%) while humans (59%) and politicians (35%) do it more.
sunday_tweetdistPoliticians have a busier schedule, bots are half less active, and humans have the least.
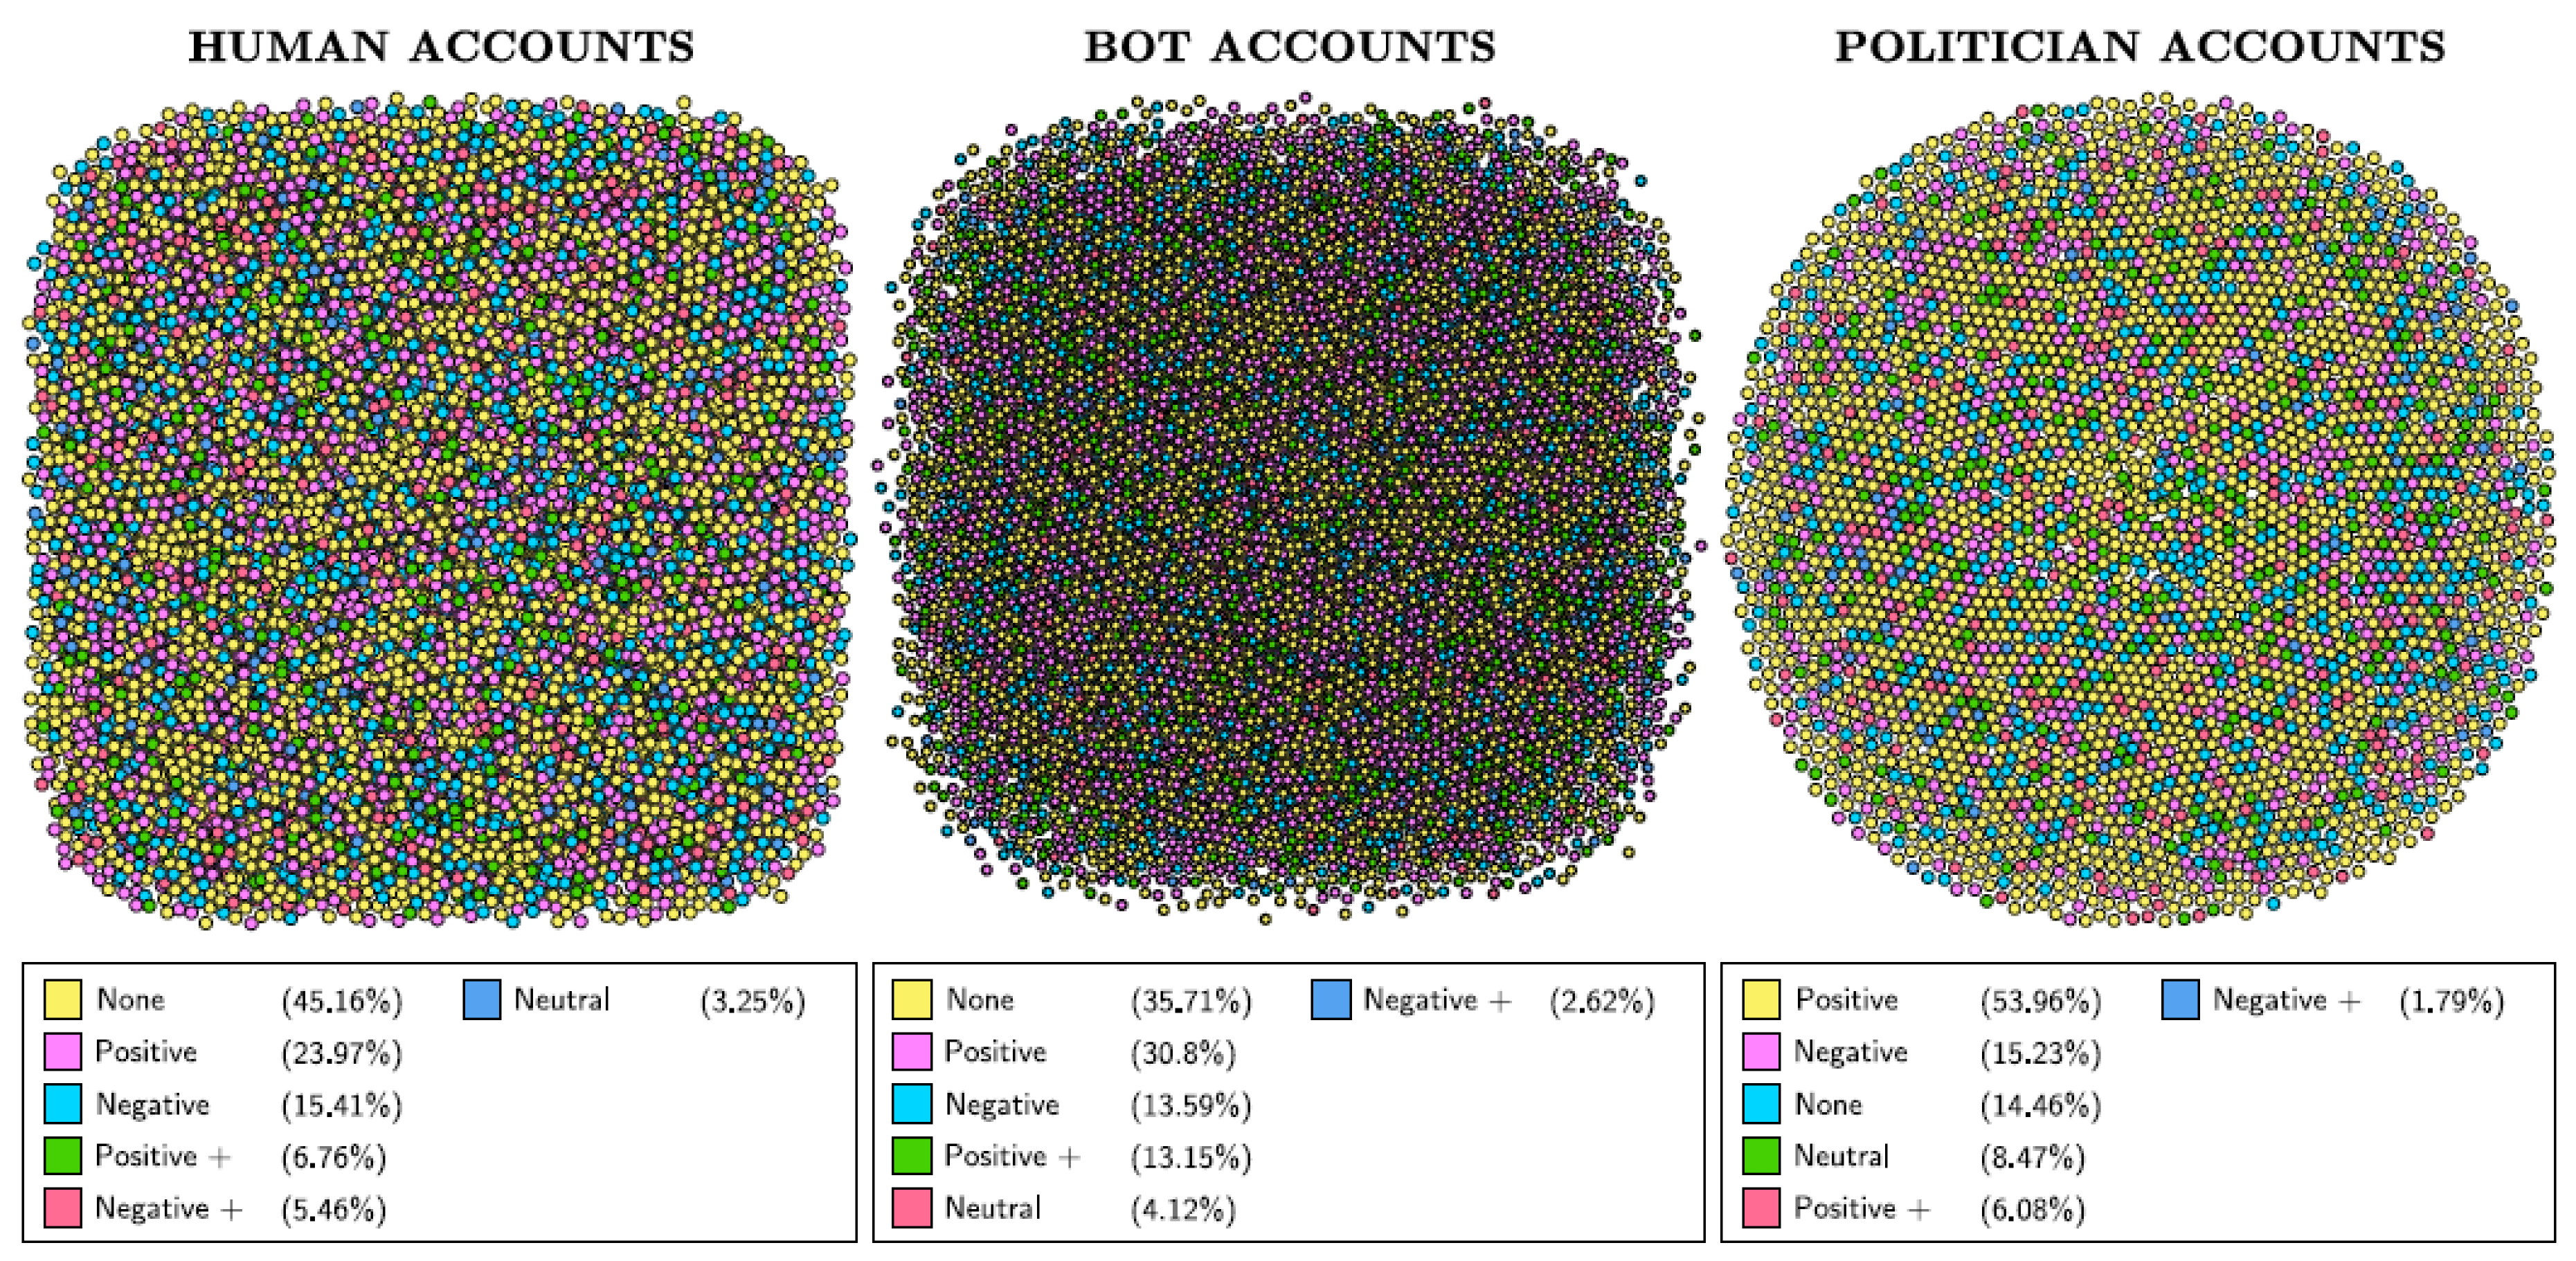
sa_score_tagMajority of bot and human tweets do not express a sentiment, while politician tweets are most positive.
Table 5. A comparison chart of the four databases from the literature that we have analyzed through Section 3.
DatabaseAdvantagesDisadvantages
Cresci et al. [34] (2015)Clear difference between classes, 5 distinct datasets, includes relationships, datasets are small and manageable.Only has fake followers, some features have been deprecated, imbalance of classes, more than 4 years old.
Cresci et al. [35] (2017)Popular for benchmarking, 9 distinct datasets, data easy to handle and interpret, introduces social spambots.Classes are harder to separate, datasets’ size is very large, no relationships between nodes, imbalance of classes.
David et al. [40] (2016)Only has Spanish-speaking accounts, the dataset is relatively small, bots’ type is not identified, significant features.Not used much in the literature, only one dataset, no relationships between nodes, fewer features.
Loyola-González et al. [33] (2019)Introduces a Mexican politician class, the dataset is not large thus more manageable, has a mixture of different types of bots, adds new features.Bot and human classes are harder to separate, it only has one dataset, no relationships between nodes, has few politician accounts.
Publisher’s Note: MDPI stays neutral with regard to jurisdictional claims in published maps and institutional affiliations.

