Article

Submerged Cultivation of Inonotus obliquus Mycelium Using Statistical Design of Experiments and Mathematical Modeling to Increase Biomass Yield

1
Horia-Hulubei National Institute for Physics and Nuclear Engineering (IFIN-HH), 077125 Magurele, Romania
2
Faculty of Biotechnology, University of Agricultural Sciences and Veterinary Medicine, 011464 Bucharest, Romania
*
Authors to whom correspondence should be addressed.
Appl. Sci. 2021, 11(9), 4104; https://doi.org/10.3390/app11094104
Submission received: 6 April 2021 / Revised: 22 April 2021 / Accepted: 27 April 2021 / Published: 30 April 2021

Abstract

:
Submerged culturing of mycelium is an efficient technique used to increase biomass yields, more so when employed with naturally slow-growing species of mushrooms. This paper is concerned with optimizing nutrient broth components used in Inonotus obliquus cultures for achieving high biomass yields. We modeled the effect of seven biotechnological parameters (six broth ingredients and the initial pH of nutritive broth) on mycelial biomass and predicted an optimum broth formula using response surface methodology. An analysis of variance showed that the elaborated model is significant (F-value of 2.76 and p-value of 0.0316). We used bioreactor cultures to confirm the model’s optimum prediction and to compare these results with a general-purpose mycology medium, namely potato dextrose broth (PDB). The optimized bioreactor culture yielded 4.37 g/L (93.36% of the dry weight prediction), while the PDB bioreactor culture yielded 2.084 g/L, after 15 days of cultivation. The optimized formula was: 2.15299 g malt extract, 3.99296 g yeast extract, 11.0041 g fructose, 17.4 g soluble starch, 0.1 g MgSO4, and 0.05 g CaCl2 per liter of broth.

1. Introduction

The therapeutic properties of many mushrooms, known to indigenous cultures across the globe, have been traced to their underlying chemical compounds with the advent of chemistry and molecular biology. Although the most well-documented are their use in cancer treatment due to beneficial glucan and proteoglycan synthesis [1], mushrooms have other therapeutic properties including antioxidant, antihypertensive, hepatoprotective, antifibrotic, anti-inflammatory, antidiabetic, antiviral, antimicrobial, and cholesterol-lowering properties [2].
Great improvements in biomass yield and bioactive compound production have been achieved with the help of biotechnological cultivation technics and conditions applied to mycology [3,4,5,6].
I. obliquus, also known as Chaga, is a mushroom that lives in certain parts of Europe and Asia at latitudes of 45–50° N as a parasite of birch trees [7]. In this environment, the Chaga mushroom grows very slowly and is not a reliable source of pharmaceutical compounds for industrial applications [8].
Recent studies have shown that the Chaga mushroom can produce polyphenols [9], flavonoids [10], melanins [11], and tannins [12]. It is also able to synthesize biologically active ergosterol peroxide, with a role in anticancer activity [13], as well as betulin, which has antiviral and anti-inflammatory properties [14].
Optimization of the various parameters or products of I. obliquus culture regularly employs a fractional factorial design, coupled with response surface methodology [15,16].
In this study, we attempted to increase the biomass of submerged cultures of Chaga mycelium by using a custom mix-process experimental design capable of predicting an optimum nutrient broth composition. Response surface methodology was used to evaluate the effects of different biotechnological parameters on biomass yield and played a role in the optimization process.

2. Materials and Methods

2.1. Inoculum Preparation

Inonotus obliquus (Ach. ex Pers.) Pilát (CBS 314.39) mycelium was purchased from Westerdijk Fungal Biodiversity Institute and grown on PDA agar (VWR Chemicals, Leuven, Belgium) for 7 days at 23.5 °C. Subsequently, 1 × 1 cm agar sectors were each transferred to 250 mL bottles with PTFE (polytetrafluoroethylene) membrane screw caps, which contained PDB seed culture medium (VWR Chemicals, Leuven, Belgium). The mycelia were incubated at the same temperature, with orbital shaking at 100 rpm until they occupied the entire volume of the culture vessels.

2.2. Optimization Design of the Nutrient Broth Components

Modern experimental designs fall into three main study types: factorial, mixture, or custom. The latter is used when the experiment requires adjustments that cannot be accommodated by a standard mixture design, such as when the differences between the high and low of all the mixture components are not the same, or when mixture and process variables are both used in the same design.
In order to optimize growth media in terms of biomass yield, the effect of six mixture components and one numeric factor was studied. Yeast extract (Merck KGaA, Darmstadt, Germany) and malt extract (Oxoid Ltd., Basingstoke, UK) were used as a protein source, while fructose (Schneekoppe GmbH, Buchholz, Germany) and soluble starch (Carl Roth GmbH, Karlsruhe, Germany) provided the carbohydrate source, and the latter also acted as a glucose substitute. We focused on fructose because it was reported that silver birch sap consists mostly of fructose (5.39% w/w) and, to a lesser extent, glucose (4.46% w/w) and sucrose (0.58% w/w) [17]. All growth media formulas were supplemented with equal amounts of magnesium sulfate heptahydrate (Merck KGaA, Darmstadt, Germany) and calcium chloride dihydrate (Honeywell GmbH, Seelze, Germany). Sterilization was performed at 121 °C for 15 min. The pH value of the growth media represented the single numeric factor, which was measured and entered into the experimental design after each media variant was sterilized, before being inoculated. The boundary values for each variable were chosen according to relevant literature data regarding submerged mushroom mycelium cultivation (Table 1).
The software Design-Expert version 11.1.0.1 (Stat-Ease Inc., Minneapolis, MN, USA) was used to achieve the mathematical modeling and statistical analysis of the experiment. By working with the type of design space described so far and inputting the above constraints, the software generates model points (runs) that are chosen algorithmically, though limited to as few runs as possible. These included five replicate points and five lack-of-fit points, supplementing the 20 required model points (Table 2).
To determine the appropriateness of a design involving mixture components, prediction-based metrics such as fraction of design space (FDS) statistics are employed. The FDS graph is useful for calculating the volume of the design space with a prediction variance equal to or less than a specified value. This custom volume’s ratio to the total volume is the fraction of the design space. The response surface was drawn by predicting the mean outcome as a function of inputs over the region of experimentation (Figure 1).
The custom quadratic × linear model in which the terms A, B, C, and D, and interactions: AB, AC, AD, AG, BC, BD, BG, CD, CG, and DG, were evaluated by FDS statistics found that 80% of the design space was below a standard error mean of 2.399.
By plotting the standard error of design and the different model values for the A, B, and G terms, the latter’s effect was shown to be the main source of the standard error mean value (Figure 2).
If the interactions related to the G term were not evaluated, the standard error mean for the same fraction of design space became 0.489. However, this approach hinders the significance of the model’s prediction power when evaluating the experimental response. Because the values of the single numeric factor were not generated algorithmically but were inputted based on real data, their predictive power is low. As such, the optimization results relating to the effect of pH on the dry weight of mycelium were not considered.

2.3. Broth Variants Cultivation

The experimental broths were prepared at a volume of 500 mL in screw-cap bottles with air exchange provided by PTFE membranes (0.22 µm pores). Each variant was inoculated by transferring 20 mL (a 4% v/v inoculum) of triturated and homogenized mycelium suspension from the fully occupied culture vessels. Sterilized glass beads were added to the screw-cap bottles, and vigorous shaking of the mycelium with the beads was used to achieve trituration. The resulting inoculated broth variants were cultured at 26 °C and agitated at 115 rpm for 21 days.

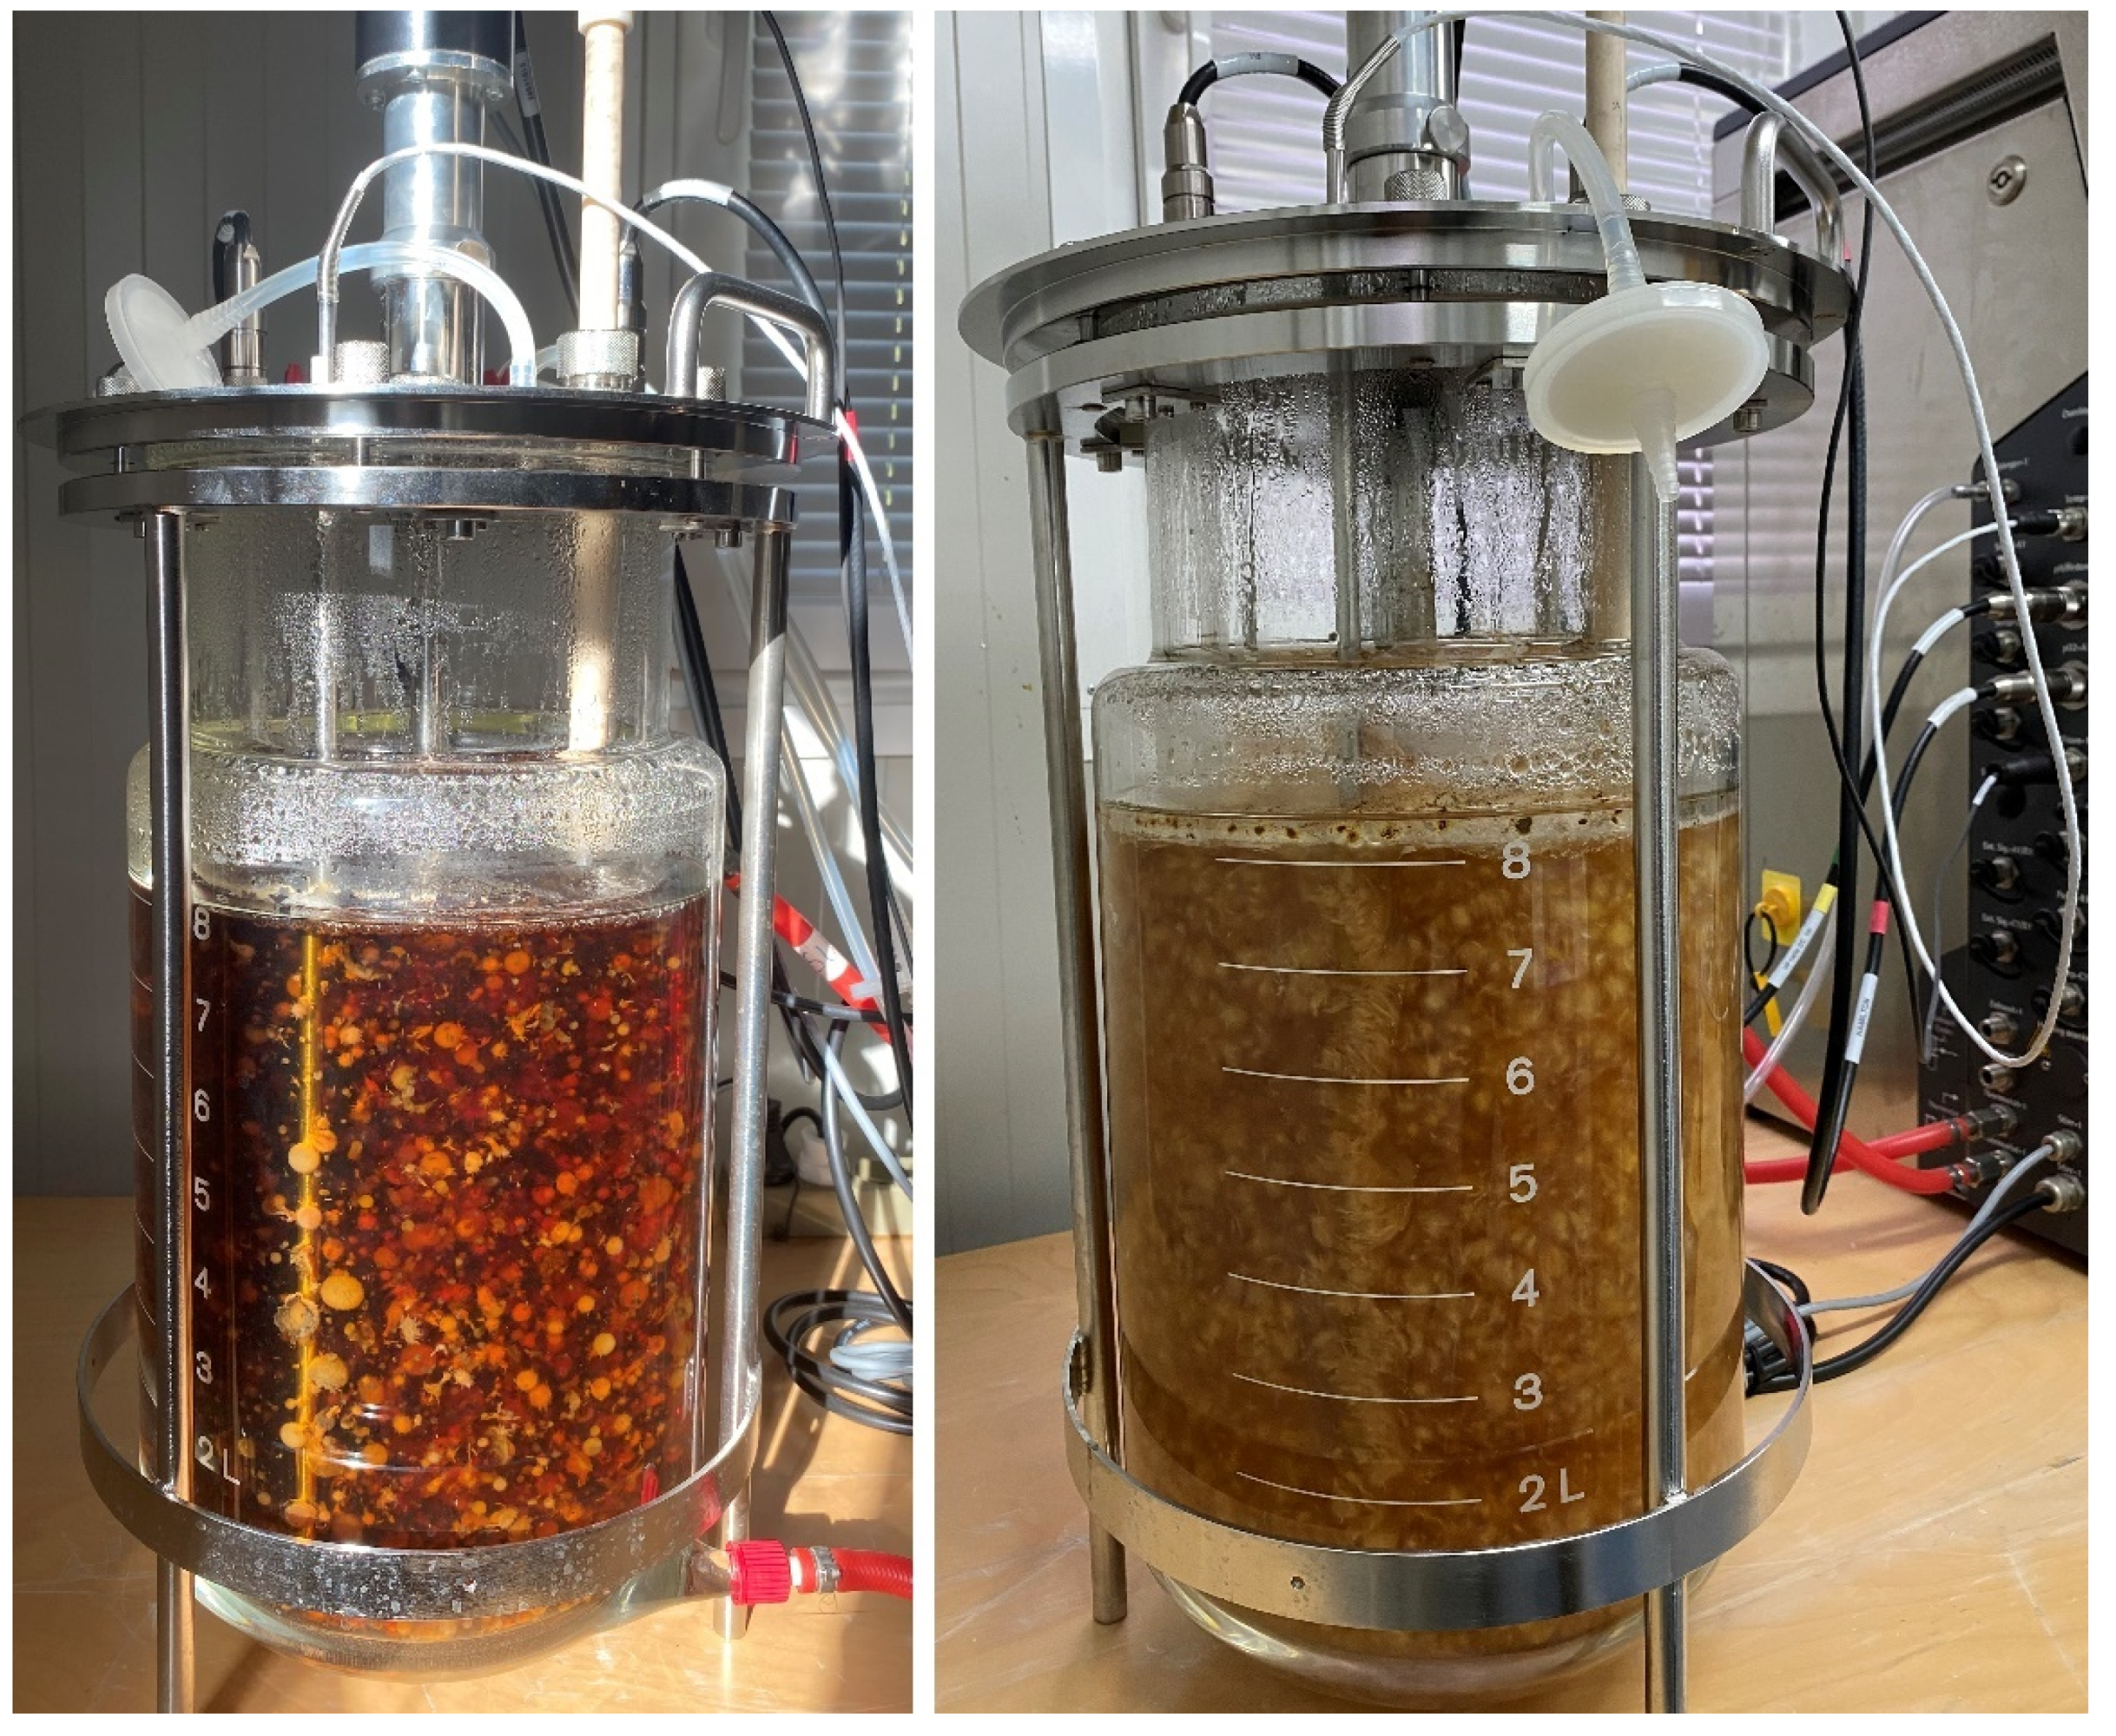
2.4. Bioreactor Cultivation

A 10 L double wall (jacketed) Biostat B (Sartorius Stedim Biotech, Göttingen, Germany) bioreactor, equipped with a dissolved oxygen and pH sensor, temperature control, stirrer, and ring sparger, was used to ensure replicable, pilot scale cultures of I. obliquus. The submerged, aerobic cultivation lasted 15 days and employed a strategy of specific parameter variation, according to the age of the culture. The stirrer shaft speed was kept at 50 rpm until the 5th day of culture, when it was increased to a final value of 75 rpm. Aeration was provided through the ring sparger at a rate of 2 L/min by adjusting a flowmeter. A solenoid valve further limited the airflow to a chosen percentage of the time. At the moment of inoculation, this value was 1%. On the 8th day of culture, aeration was increased to 8% and then again on the 12th day to the final value of 10%. Airflow entry and exit points were passed through Millex-FG50 (Millipore Co., Billerica, MA, USA) filter units. The temperature was maintained at a constant 24 °C throughout the whole culture period.
All bioreactor batches were loaded with 8 L of nutrient broth, 6 L of which were sterilized in 2 L communicating vessels, while 2 L remained in the culture vessel. The communicating vessels were sterilized separately from the bioreactor, although for the same duration of time. This procedure allows for better sterilization efficiency, especially when dealing with custom nutrient broths with ingredients having a high microbial load. Sterilization time differed: for potato dextrose broth, we used 20 min at 121 °C; for the custom nutrient broth, we used 50 min at the same temperature.
Each batch was inoculated by transferring 250 mL (a 3.125% v/v inoculum) of triturated mycelium suspension from one of the fully occupied culture vessels. The dry weight of this inoculum was calculated to be 1.415 g by averaging the weight of three identical lyophilized cultures. Similarly to the shaken cultures, the bioreactor cultures were not pH corrected throughout the fermentation process. For the optimized broth, the pH value at the start of cultivation was 4.89, whereas for the PDB, this value was 5.4 at the moment of inoculation.

2.5. Mycelial Biomass Harvesting

All cultures were harvested by separating the mycelium from the broth through a 1 mm sieve, followed by further filtration of the broth through a 250 nm sieve. The mycelia were then washed three times with deionized water and frozen at −50 °C before being lyophilized (Biobase BK-FD12S vacuum freeze dryer). Mycelial biomass was estimated by dry weight and is expressed as g/500 mL for the optimization experiment and as g/L for the bioreactor cultures.

3. Results and Discussion

3.1. Analysis of the Dry Mycelium Response and Model Building

During the agitated incubation, one of the experimental variants was lost due to a mechanical impact within the incubator. Modeling of the dry weight response proceeded in the absence of this variant, without issue.
After the mycelia were lyophilized and weighed, each broth variant was assigned with the experimentally obtained weight values. Design-Expert software was used to carry out an analysis of the dry weight response and build a model of the interactions between the design factors and the response. This model was then able to generate predictions about the response for any given combination of factors within the design constraints. For the actual experimental runs, the model was also able to predict theoretical yields (Table 3).
To better illustrate the relationship between the first two terms of this table, their values were plotted together and color-coded by dry weight (Figure 3).
An analysis of variance between the predicted and actual dry mycelium weights was carried out for two-component interactions and for every factor (Table 4) to determine whether the response modeling was statistically significant and could reasonably predict an optimal broth composition.
The model F-value of 2.76 indicates the model is significant. There is only a 3.16% chance that an F-value this large can occur due to noise. The p-value of 0.0316 also indicates that the model is significant.

3.2. Predicted Optimum Nutrient Broth for I. obliquus Biomass Production

A mathematical analysis of the response, carried out using Design-Expert software, was able to generate a model of the broth component interactions and use it to extrapolate a theoretical response for a given combination of factors. The contour plot below (Figure 4), shows the combined effect of malt extract, yeast, and fructose on the dry weight response for a particular concentration of soluble starch.
By changing this last term, slightly higher or lower predicted responses fell within the threshold of the model. However, the modeled space remained largely proportional due to the orthogonal nature of the design and fixed constraints. A value of 17.4 g of soluble starch was found to elicit the best design space, from which a point with the highest dry weight prediction (2.34028 g/500 mL) was flagged to determine the values of other involved factors. The predicted optimum values (Table 5) were obtained easily due to the interdependence of the factors within the model.

3.3. Bioreactor Biomass Yield with Predicted Optimum and PDB

After culturing the submerged Chaga mycelium in the optimized broth, under strict aeration and agitation parameters guided by the Biostat B control tower according to the culture plan, we found the total recoverable dry biomass weight to be 34.96 g. This value corresponds to 2.185 g when scaled down to the 0.5 L of the optimization experiment, and surpasses its best result (1.68 g/500 mL).
A two-sided statistical test at a 95% confidence level, using the chosen optimum values for each factor and the previously established model fit, was carried out (Table 6) to determine the relationship between the data mean and the prediction intervals.
Because the number of runs (n) was small, the spread of the low to high prediction interval is large (varying by ±0.92206 g of the predicted mean) at the 95% confidence level. The data mean’s value is 93.36% that of the predicted mean, so the difference between them is only equal to 6.64% of the predicted mean.
The culturing procedure was then repeated, under identical conditions, but using potato dextrose broth as a culture medium (Figure 5). Here we found the total dry mycelium to be 16.67 g. This value corresponds to approximately 1.042 g when scaled down to the 0.5 L of the optimization experiment.

4. Discussion

The submerged optimum broth bioreactor culture of I. obliquus mycelium yielded 93.36% of the dry weight prediction calculated by modeling 29 successful experimental cultures with different broth compositions. We studied the effect of six nutrient components and broth pH in a mixture-process type of experimental design and chose the highest yielding combination of factors using response surface methodology.
By using a stirred and aerated bioreactor, the cultivation period of the I. obliquus mycelium was reduced from 21 days (with static air exchange vessels in an incubator) to 15 days, all while the inoculum volume decreased from 4% to 3.125 % v/v. With these parameters, the mycelium grown in the optimized broth occupied the entire volume of the bioreactor, showing a 24.7-fold increase in dry weight at the end of the culture period.
We also grew I. obliquus mycelium in potato dextrose broth under the same bioreactor conditions to compare growth speed and final yield. Here we found that the culture grew more slowly, with an 11.78-fold increase in dry weight at the end of the cultivation period. We also found differences in the morphology of this mycelium, which accreted in dark-colored globules compared with the one grown in the optimized broth. Here, the color of the broth changed from a pale yellow at the beginning of cultivation to a reddish-brown at the end, indicating the possible release of soluble melanin pigments.
In a study of I. obliquus optimization, potato dextrose broth was also used in conjunction with submerged culture technics, yielding between 1.65 and 2.36 dry g/L for Difco PDB and fresh potato broth, respectively. The cultivation period lasted 12 days at 26 °C, with 100 mL flasks containing 25 mL of broth being used [18]. Our findings show similar yields (2.084 g/L) with 8 L of PDB inoculated in a stirred, aerated bioreactor culture.
In another study, shake flask cultures were performed with 250 mL flasks containing 50 mL of glucose, yeast extract, and MgSO4-based broth. Cultivation lasted 8 days at 25 °C and 150 rpm, and we used an orthogonal design to vary the three broth components. Mycelium dry mass was found to be between 3.6 and 8.11 g/L. Furthermore, a 5 L stirred tank bioreactor was used (3.5 L working volume) at identical temperature and agitation speed for 10 days. This yielded a maximum of 8.24 g/L after 8 days [14]. Our results confirm high yields when using optimized liquid culture media containing yeast extract, MgSO4, and a simple monosaccharide. However, we found that after 15 days of bioreactor culture with an optimized liquid medium, the entire 8 L volume was completely occupied by mycelium. The yields reported in the aforementioned study present a 1.88-fold increase in dry mycelium compared with a bioreactor culture that is already fully colonized.
For I. obliquus, we found that the maximum airflow of 0.2 L/min, combined with an agitation value of 75 rpm, was adequate for keeping the broth at an oxygen saturation of 50% for the final 3 days of culture.
In this paper, we provide a low-cost optimized broth formula for the rapid growth of I. obliquus mycelium and present a bioreactor method of culture based on incremental aeration and agitation.
The submerged cultivation of mycelium is well-suited for fast biomass production, and more so when paired with stirred tank bioreactor methods. Fast production of therapeutic metabolites such as betulin and ergosterol peroxide is possible by using this biotechnological approach.
A study of antioxidant constituents identified 22 extracellular and intracellular phenolic compounds in submerged cultures of I. obliquus grown in different culture media (control, H2O2, and arbutin-supplemented broths). The addition of hydrogen peroxide and arbutin increased the total levels of intracellular phenols and decreased these same compounds secreted extracellularly [8]. By this procedure, the mycelial biomass was enriched in antioxidant compounds. Such methods can easily be coupled with biomass accumulation strategies for a synergistic approach.

Author Contributions

A.P., E.V., and M.E. designed the experiments. M.E. was responsible for the administration of the project and resources. A.P. performed the experiments, analyzed the data and wrote the paper. The authors discussed and made comments on the results. All authors have read and agreed to the published version of the manuscript.

Funding

This work was supported by a grant of the Romanian Ministry of Research and Innovation, CCCDI—UEFISCDI, project number 171PED/2017 (PN-III-P2-2.1-PED-2016-0132) and 5PCCDI/2018 (PN-III-P1-1.2-PCCDI-2017-0323), within PNCDI III.

Institutional Review Board Statement

Not applicable.

Informed Consent Statement

Not applicable.

Data Availability Statement

Not applicable.

Conflicts of Interest

The authors declare no conflict of interest.

References

  1. Kidd, P.M. The use of mushroom glucans and proteoglycans in cancer treatment. Altern. Med. Rev. 2000, 5, 4–27. [Google Scholar] [PubMed]
  2. Jong, S.C.; Donovick, R. Antitumour and antiviral substances from fungi. Adv. Appl. Microbiol. 1989, 34, 183–262. [Google Scholar] [CrossRef] [PubMed]
  3. Hou, X.; Chen, W. Optimization of extraction process of crude polysaccharides from wild edible BaChu mushroom by response surface methodology. Carbohydr. Polym. 2008, 72, 67–74. [Google Scholar] [CrossRef]
  4. Hsieh, C.; Tsai, M.J.; Hsu, T.H.; Chang, D.M.; Lo, C.T. Medium optimization for polysaccharide production of Cordyceps sinensis. Appl. Biochem. Biotechnol. 2005, 120, 145–157. [Google Scholar] [CrossRef]
  5. Jonathan, G.S.; Ayodele, S.; Damilola, A. Optimization of sub-merged culture conditions for biomass production in Pleurotus florida (Mont.) Singer, a Nigerian edible fungus. Afr. J. Biotechnol. 2006, 5, 1464–1469. [Google Scholar]
  6. Wasser, S.P.; Elisashvili, V.; Tan, K.K. Effects of carbon and nitrogen sources in the medium on Tremella mesenterica Retz:Fr. (Heterobasidiomycetes) growth and polysaccharide production. Int. J. Med. Mushrooms 2003, 5, 49–56. [Google Scholar] [CrossRef]
  7. Handa, N.; Yamada, T.; Tanaka, R. An unusual lanostane-type triterpenoid, spiroinonotsuoxodiol, and other triterpenoids from Inonotus obliquus. Phytochemistry 2010, 71, 1774–1779. [Google Scholar] [CrossRef] [PubMed]
  8. Zheng, W.; Zhang, M.; Zhao, Y.; Wang, Y. Accumulation of antioxidant phenolic constituents in submerged cultures of Inonotus obliquus. Bioresour. Technol. 2009, 100, 1327–1335. [Google Scholar] [CrossRef] [PubMed]
  9. Lee, I.K.; Yun, B.S. Highly oxygenated and unsaturated metabolites providing a diversity of hispidin class antioxidants in the medicinal mushrooms Inonotus and Phellinus. Bioorg. Med. Chem. 2007, 15, 3309–3314. [Google Scholar] [CrossRef] [PubMed]
  10. Zheng, W.F.; Gu, Q.; Chen, C.F.; Yang, S.Z.; Wei, J.C.; Chu, C.C. Aminophenols and mold-water-extracts affect the accumulation of flavonoids and their antioxidant activity in cultured mycelia of Inonotus obliquus. Mycosystema 2007, 26, 414–426. [Google Scholar]
  11. Babitskaya, V.G.; Shcherba, V.V.; Lkonnikova, N.V. Melanin complex of the fungus Inonotus obliquus. Appl. Biochem. Microbiol. 2000, 36, 377. [Google Scholar] [CrossRef]
  12. Yang, S.Z.; Zheng, W.F. Factors affecting the accumulation of hydrolysable tannins in cultured mycelia of Inonotus obliquus. Chin. Tradit. Herb. Drugs 2007, 38, 798–803. [Google Scholar]
  13. Kang, J.H.; Jang, J.E.; Mishra, S.K.; Lee, H.J.; Nho, C.W.; Shin, D.; Jin, M.; Kim, M.K.; Choi, C.; Oh, S.H. Ergosterol peroxide from Chaga mushroom (Inonotus obliquus) exhibits anti-cancer activity by down-regulation of the β-catenin pathway in colorectal cancer. J. Ethnopharmacol. 2015, 173, 303–312. [Google Scholar] [CrossRef] [PubMed]
  14. Bai, Y.H.; Feng, Y.Q.; Mao, D.B.; Xu, C. Optimization for betulin production from mycelial culture of Inonotus obliquus by orthogonal design and evaluation of its antioxidant activity. J. Taiwan Inst. Chem. Eng. 2012, 43, 663–669. [Google Scholar] [CrossRef]
  15. Chen, H.; Xu, X.; Zhu, Y. Optimization of hydroxyl radical scavenging activity of exo-polysaccharides from Inonotus obliquus in submerged fermentation using response surface methodology. J. Microbiol. Biotechnol. 2010, 20, 835–843. [Google Scholar] [PubMed]
  16. Xiang, C.; Xiang, Q.X.; Ling, H.Z. Submerged culture optimisation for triterpenoids production by Inonotus obliquus using response surface methodology. Adv. Mat. Res. 2012, 560–561, 784–790. [Google Scholar] [CrossRef]
  17. Kūka, M.; Čakste, I.; Geršebeka, E. Determination of bioactive compounds and mineral substances in Latvian birch and maple saps. Proc. Latv. Acad. Sci. Sect. B Nat. Exact Appl. Sci. 2013, 67, 437–441. [Google Scholar] [CrossRef] [Green Version]
  18. Cho, N.S.; Shin, Y.S. Optimization of in vitro cultivation of Inonotus obliquus. J. Korean Wood Sci. Technol. 2005, 33, 92–98. [Google Scholar]
Figure 1. Fraction of design space graph for the evaluated model components and interactions.
Applsci 11 04104 g001
Figure 2. The 3D mix-process graph of the standard error of design.
Applsci 11 04104 g002
Figure 3. The predicted against actual results of dry mycelium weight (g/500 mL).
Applsci 11 04104 g003
Figure 4. Contour plot of the modeled effect of broth components (g/500 mL) and interactions on I. obliquus dry mycelium weight.
Applsci 11 04104 g004
Figure 5. Different macroscopic growth patterns of the 15 day aged bioreactor cultures of I. obliquus mycelium grown in potato dextrose broth (left), showing extracellular pigment secretion and dispersed globular morphology, and optimized broth (right), unpigmented occupation of the entire bioreactor.
Applsci 11 04104 g005
Table 1. Design constraints.
FactorSymbolLow Value (g/L)High Value (g/L)
Malt extractA1.102.30
Yeast extractB2.004.00
FructoseC11.0019.00
Soluble starchD11.0019.00
MgSO4E0.100.10
CaCl2F0.050.05
pHG4.975.67
Table 2. Experimental design.
RunMalt Extract (g/L)Yeast Extract (g/L)Fructose (g/L)Soluble Starch (g/L)MgSO4 (g/L)CaCl2 (g/L)pH
11.14725214.1235930117.279156990.10.05-
21.1212.45190.10.055.55
31.12.708751911.741250.10.055.33
42.32.78059134618.46940865110.10.054.97
51.1413.8185762415.631423760.10.055.55
62.3413.3596606414.890339360.10.055.13
71.551558201417.9984418110.10.055.01
81.7593896273.0112061311.4867870518.292617190.10.055.14
91.1151503333.11959669615.559774714.755478270.10.055.1
101.93376577414.6046981914.011536040.10.055.33
112.321911.250.10.055.21
121.1212.45190.10.055.15
131.781034944215.7994251614.969539890.10.055.05
141.141118.450.10.055.18
151.1043784273.44562157311190.10.055.44
161.8038908753.73066274218.01544638110.10.055.39
171.6544032653.13202274311.2307740918.53279990.10.055.62
182.341117.250.10.055.67
192.3211.25190.10.055.54
201.121912.450.10.054.99
212.32.93618094114.9878428514.325976210.10.055.41
222.32.93618094114.9878428514.325976210.10.055.4
232.3211.25190.10.055.14
242.078933462218.7710111211.700055410.10.055.12
251.1151503333.11959669615.559774714.755478270.10.055.06
261.6839132112.06525189615.7743209915.02651390.10.055.32
271.6544032653.13202274311.2307740918.53279990.10.055.52
281.13.4519110.10.055.22
291.7593896273.0112061311.4867870518.292617190.10.055.15
301.6839132112.06525189615.7743209915.02651390.10.055.29
Table 3. Statistical analysis of actual results and predicted values.
Run OrderActual Value (g/500 mL)Predicted Value (g/500 mL)ResidualLeverageInternally Studentized ResidualsExternally Studentized ResidualsCook’s Distance
20.82000.72750.09250.6960.6470.6340.068
31.161.150.00520.5770.0310.0300.000
40.79000.58460.20540.6651.3671.4120.265
51.051.020.03090.7360.2320.2250.011
60.11000.3745−0.26450.711−1.894−2.0980.630
70.75000.66540.08460.6640.5620.5490.045
80.93000.74860.18140.3090.8410.8320.023
90.39000.5534−0.16340.299−0.752−0.7410.017
100.87000.86720.00280.2600.0130.0120.000
110.28000.6352−0.35520.504−1.944−2.1710.275
120.62000.6609−0.04090.703−0.289−0.2800.014
130.43000.6702−0.24020.349−1.147−1.1600.050
140.61000.32600.28400.7062.0172.2820.696
150.69000.8875−0.19750.329−0.929−0.9240.030
161.191.27−0.08450.595−0.511−0.4980.027
171.211.34−0.13460.354−0.645−0.6320.016
181.681.630.04690.7280.3460.3360.023
190.77000.9171−0.14710.691−1.020−1.0220.167
201.131.030.10400.6050.6370.6240.044
210.64000.7846−0.14460.331−0.682−0.6690.016
221.280.77420.50580.3232.3682.8920.191
230.89000.75510.13490.7180.9780.9770.174
240.86000.75890.10110.3110.4690.4570.007
250.38000.5139−0.13390.338−0.634−0.6210.015
260.74000.73580.00420.2760.0190.0180.000
271.301.220.08260.2690.3720.3610.004
281.121.14−0.01870.400−0.093−0.0900.000
290.54000.7604−0.22040.300−1.015−1.0160.032
301.010.73080.27920.2541.2461.2710.038
Table 4. ANOVA for reduced quadratic × linear modeling of dry mycelium response.
SourceSum of SquaresdfMean SquareF-Valuep-Value
Model2.42130.18602.760.0316
(1) Linear Mixture0.075230.02510.37210.7743
AB0.187410.18742.780.1161
AC0.085910.08591.280.2764
AD0.117410.11741.740.2066
AG0.007010.00700.10380.7518
BC0.035610.03560.52910.4782
BD0.024410.02440.36290.5559
BG0.457410.45746.790.0199
CD0.231410.23143.440.0836
CG0.003110.00310.04560.8338
DG0.007510.00750.11080.7439
Residual1.01150.0674
Cor Total3.4328
(1) Inference for linear mixtures uses Type I sums of squares.
Table 5. Optimized concentrations of broth components for dry mycelium yield.
FactorOptimum Value (g/L)
Malt extract2.15299
Yeast extract3.99296
Fructose11.0041
Soluble starch17.40
MgSO40.10
CaCl20.05
Table 6. Point prediction and confirmation of the dry mycelium response.
AnalysisPredicted MeanPredicted MedianSDnSE Prediction95% PI LowData Mean95% PI High
Dry mycelium2.340282.340280.25952410.4325991.418222.1853.26234
Publisher’s Note: MDPI stays neutral with regard to jurisdictional claims in published maps and institutional affiliations.

