Featured Application
This study establishes a framework for Chinese text mining of civil environmental complaints to provide a technical reference for the analysis of massive environmental complaint text data.
Abstract
With the popularization of social networks, the abundance of unstructured data regarding environmental complaints is rapidly increasing. This study established a text mining framework for Chinese civil environmental complaints and analyzed the characteristics of environmental complaints, including keywords, sentiment, and semantic networks, with two–year environmental complaints records in Guangzhou city, China. The results show that the keywords of environmental complaints can be effectively extracted, providing an accurate entry point for solving environmental problems; light pollution complaints are the most negative, and electromagnetic radiation complaints have the most fluctuating emotions, which may be due to the diversity of citizens’ perceptions of pollution; the nodes of the semantic network reveal that citizens pay the most attention to pollution sources but the least attention to stakeholders; the edges of the semantic network shows that pollution sources and pollution receptors show the most concerning relationship, and the pollution receptors’ relationships with pollution behaviors, sensory features, stakeholders, and individual health are also highlighted by citizens. Thus, environmental pollution management should not only strengthen the control of pollution sources but also pay attention to these characteristics. This study provides an efficient technical method for unstructured data analysis, which may be helpful for precise and smart environmental management.
1. Introduction
Environmental quality has become a critical factor for improving urban sustainability [1]. In the era of big data, smart cities provide citizens with a better living environment, which has become an emerging model of world city development. Its essence lies in the high integration of informatization and urbanization. With the rapid development of information technology and the increase in citizens’ environmental awareness [2], it is more convenient to make environmental pollution complaints with the help of mobile phones and social networks. Citizens are more active in expressing their subjective feelings about environmental pollution. For example, in 2019, China’s “12369” environmental protection reporting network management platform received more than 530,000 environmental complaints records from the public, of which Guangdong Province ranked second. Environmental complaint data are unstructured text data, which have different data analysis methods from traditional environmental sensor networks (such as the air quality monitoring network or water pollution monitoring network); furthermore, the density of environmental complaints is much higher than that of any of the current environmental sensor network sites. Massive environmental complaints have produced huge text data containing rich information, such as the characteristics of the pollution source, the information of stakeholders, and the perception regarding the complainants.
However, previous studies of environmental complaints mostly focused on correlating environmental complaints with socio–economic factors or individual features, including economic development, geographical location, household income, literacy rate, environmental management, age, gender, education quality, perception, which played significant roles in determining civil environmental complaints. For example, Dasgupta and Wheeler [3] evaluated the influencing factors of civil environmental complaints based on an econometric model, which proved basic education has a significant effect on complaint behaviors. Weersink and Raymond [4] further demonstrated the influence of education and income on local environmental complaints. Dong et al. [5] demonstrated that exposure to harmful pollutants and household income significantly influence people’s complaint behaviors at the provincial level based on economic willingness–to–pay models. Liu [6] verified that the perception of environmental information significantly determined citizens’ environmental complaints by questionnaire survey and various multivariate regressions. Tong and Kang [1] explored the relationships between noise complaints and socio–economic factors at the city/region level. Some works indicated social psychological factors that impact environmental complaint behavior on the individual level based on the norm activation model and revealed that the personal norm is the most immediate and powerful predictor of environmental complaint intention [7,8]. Few scholars have discussed the relationship between environmental monitoring data and environmental complaints. Evendijk et al. [9] revealed that hydrocarbons have the highest correlation with the total number of citizen complaints by analyzing the correlation between air measurement results and public complaints. The environmental complaint is one of the most important channels that allows a deeper understanding of the local environment; provides a useful instrument for developing suitable environmental policies; and positively impacts pollution control [10,11,12]. Arshad et al. [13] constructed an approach to the field of environmental governance by considering youth complaints as an important source of information for the management authorities and verified the effectiveness of the complaint information on environmental governance. Zhang et al. [14] showed that public participation policy plays a significant role in improving environmental governance. A careful review of the existing literature shows that there are limited studies on environmental complaint text mining.
Text mining is the process of extracting previously unknown, understandable, potential, and practical patterns or knowledge from the collection of text data [2]. It has been actively used in various fields, including biomedical, medicine [15], risk management [16], policy, crime [17], market such as multilingual recommendation system [18], education, and informatic fields. Recently, some scholars have carried out research on complaint text. These studies focused on the following aspects: semantic network analysis and keyword analysis of citizen complaints [19]; use of text mining to determine citizens’ policy needs for safety and disaster management [20]; and the utilization of text mining to identify and evaluate the indicators of cultural ecosystem services [21]. Overall, previous studies using text mining analysis focus on civil complaints from various viewpoints to provide assistance to the government in decision–making. However, such studies have several limitations: (1) while previous studies are based on civil complaints, few studies have targeted specific urban environmental issues; (2) some only used a certain method of text mining, such as keyword extraction or the semantic network, to analyze the complaint text; therefore, they lacked the systematic application of text mining.
As citizens are direct victims of environmental pollution, the text mining of citizens’ complaints will not only help to elucidate their awareness of environmental pollution but also determine more precise countermeasures for the environmental management of smart cities. In this paper, civil environmental complaint records regarding six pollution topics (air, water, noise, waste, electromagnetic radiation, and light) from Guangzhou city are used, and a text mining framework for Chinese environmental pollution complaints is proposed. With this framework, we extract keywords, calculate the complainants’ sentiment score, and analyze the characteristics of the semantic network from each class of pollution complaint. These results underline the positive impact of text mining on urban environmental management in both the current and future development of the smart city.
2. Materials and Methods
2.1. Study Area
Guangzhou city is the capital of Guangdong Province, located in the south of mainland China (Figure 1). Guangzhou city is a regional center city in southern China and one of the core cities of the Guangdong–Hong Kong–Macao Greater Bay Area (Greater Bay Area). There are 11 districts in Guangzhou city, and it has a total area of 7434.4 km2 (2019). At the end of 2019, the resident population of Guangzhou was 15.30 million, and the GDP was RMB 2362.860. According to the list of key polluting firms in Guangzhou city, the number of such firms was 1147, 780, and 713 in 2018, 2019, and 2020, respectively.
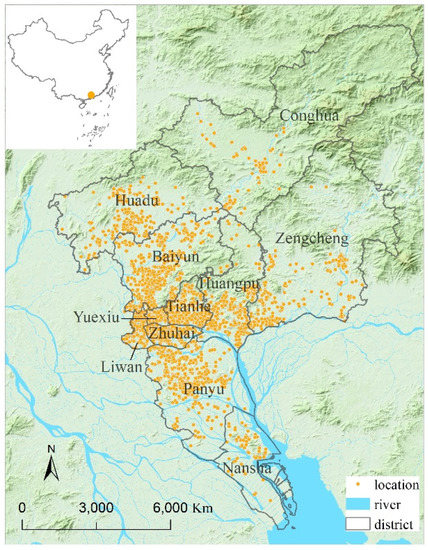
Figure 1.
Location of environmental complaints in Guangzhou city (March 2018–March 2020).
2.2. Data Collection and Methods
2.2.1. Data Collection and Pre-Processing
The two–year data (from 1 March 2018 to 31 March 2020) were retrieved from the website of the Guangzhou Municipal Ecological Environment Bureau (http://sthjj.gz.gov.cn/ztlm/tsjbzx/, accessed on 31 March 2020). The complaints datasets contain the date, complaint ID, district and address, firms, topic of complaint, complaint content, government response, and response date (Table 1). We obtained 5672 valid records with missing geographic information, and unidentified complaint content was excluded.

Table 1.
A typical example of one complaint record.
The 5672 complaint records were classified into six categories, including air, water, noise, waste, electromagnetic radiation (EM radiation), and light based on the topic of complaint (Table 2). Most complaints in all districts regard air pollution, follows by noise, while the categories with the smallest number of complaints are EM radiation and light. The Baiyun district has the largest number of complaints (1174), while the Conghua district has the fewest (157).
Table 2.
Records of environmental complaints in each district of Guangzhou.
Figure 2 describes the text mining process framework for Chinese environmental complaints. For the sake of content analysis and text mining, we cleaned the collected text data, including removing non–text data (punctuation marks, emoticons, and meaningless symbols), invalid characters (letters and numbers), and meaningless text (function words and pronouns). We removed the meaningless text by using some open–source Chinese stop word dictionaries (e.g., Harbin Institute of Technology (HIT) stop words and Baidu TM stop words). Then, we carried out data processing, including keyword extraction, sentiment analysis, and semantic network analysis.
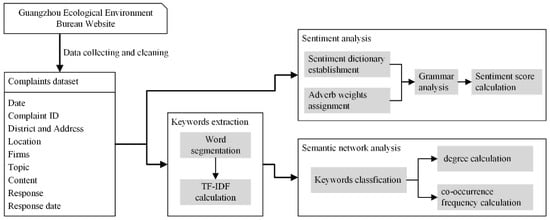
Figure 2.
Text mining framework for Chinese environmental complaints.
2.2.2. Keyword Extraction
Firstly, we used the Jieba Chinese text segmentation tool to segment the text records into meaningful words (https://github.com/fxsjy/jieba/, accessed on 25 January 2021). At this stage, synonym substitution and part-of-speech tagging were carried out to avoid the influence of different expressions of synonyms and meaningless function words on subsequent keyword extraction. In addition to the default corpus of the word segmentation tool, a domain dictionary for environmental complaints was established to jointly ensure the accuracy of word segmentation. Secondly, each type of complaint keyword was extracted based on the TF–IDF method [22], which is the most widely adopted word weighting scheme in text mining. It computes how significant a term t is to a document d by combining two scores, term frequency (TF) (2), which is the frequency of term t in document d, and inverse document frequency (IDF) (3), which is the number of documents in the corpus containing t regardless of its frequency. T is more important for d when its TF is large but its IDF is small. That is, words with high TF-IDF value are more important than other words in the documents, so they are the keywords that distinguish the document from others.
where f (t, d) is the number of times term t appears in a document, d is the total number of terms in the document, D is the total number of documents, and is the number of documents with the term t in it.
2.2.3. Sentiment Analysis
In this study, sentiment analysis was used to identify the citizen’s sentiment in the six types of environmental complaints. Lacking inter–word spacing, the diversification of expressions, the complexity of grammar, and the randomness of length of the complaint record increase the difficulty of Chinese sentiment analysis.
Firstly, a sentiment dictionary was established, including a domain emotion dictionary of environmental complaints and some general Chinese sentiment dictionaries, such as Li Jun’s Chinese commendatory and derogatory dictionary of Tsinghua University, National Taiwan University Sentiment Dictionary (NTUSD), Hownet Sentiment Dictionary. Meanwhile, the score of positive emotion words (Sp) was set to 1, and the score of negative emotion words (Sn) was −1 (Table 3).
Table 3.
Sentiment words and their weights.
Secondly, according to Hownet Dictionary, degree adverbs are divided into six levels. According to the weight value of the gradient descent Formula (4) [23], different weights are assigned to each level (Table 4). The emotional intensity of the emotional words modified by adverbs increases by a certain multiple. Moreover, when inverse words such as scarcely (没有), never (从不), and seldom (很少), modify emotional words, the emotional words are multiplied by −1.
where, is the weight of the “most” level; is the gradient descent rate.
Table 4.
Degree adverbs and its weights.
Finally, one complaint record (a compound sentence) is divided into multiple clauses by punctuation, and the sentiment value of each clause (Ci) is calculated by the combination of sentiment words (S), adverbs (A), inverse words (N), and punctuation (!/?) (Table 5). Additionally, the sentiment value of each complaint record (Sj) is calculated by Function (5). Table 5 shows nine combinations in Chinese grammar.
Table 5.
Common combinations of compound sentences.
is used to eliminate the influence of the complaint record’s length on the result. The sentiment value () is scaled in the range −1–1. > 0 means the sentiment of the complaint is positive; < 0 means the sentiment is negative; = 0 means the sentiment is neutral.
2.2.4. Semantic Network Analysis
A semantic network consists of nodes (words) and edges (the relationship between words). The node’s size (degree) is proportional to the number of words related to it; a thicker edge means a higher co–occurrence frequency or a closer relationship between the words. We used two–mode networks [24], including top and bottom nodes, to analyze the semantic network of each type of complaint. In our two–mode networks, keywords (bottom nodes) were categorized into three clusters (top nodes) based on pollution characteristics, stakeholders, or complainants. Furthermore, the pollution characteristics were categorized into three sub–clusters including pollution sources, pollution behavior, and sensory features; the stakeholders were categorized into two sub–clusters, including firms and administration; and the complainants were categorized into three sub–clusters, including pollution receptor, social life, and individual health.
Figure 3 shows the workflow of semantic network analysis. Firstly, keywords were extracted based on the TF–IDF method. Secondly, a word co–occurrence matrix with environmental complaint keywords was constructed, and co–occurrence analysis was performed on them. Finally, the generated semantic network was plotted by Gephi software (version 0.9.2) [25].
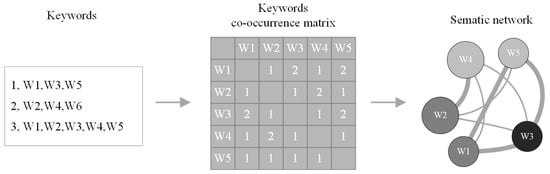
Figure 3.
The workflow of semantic network analysis.
3. Results and Discussion
3.1. Keywords of Environmental Complaints
The study used TF–IDF to extract keywords from six types of environmental complaints that indicated the characteristics of environmental complaints. The higher the TF-IDF value, the more important the word is in this type of environmental complaint. Table 6 shows the top 10 keywords of various environmental complaints, and we found that different environmental complaints show obvious differences and similarities characteristics of environmental issues.
Table 6.
Top 10 keywords of environmental complaints and their TF–IDF value.
As the keyword list demonstrates, differences in environmental complaints with different topics are noticeable. The list of keywords related to air complaints has the highest TF–IDF value for typical words, such as lampblack (油烟), exhaust gas (废气), and odor (气味). Among the keywords of water complaints, sewage (污水) ranks first, followed by stench (恶臭), sewer (下水道), and smell (气味). In noise complaints, the most important word is noise (噪音), followed by sound (声音) and decibel (分贝) also showing high scores. The word with the highest TF–IDF value in the waste complaint is waste (垃圾), which also includes feature words, such as waste cleaning(清理) and ashbin (垃圾桶). The most critical vocabulary in EM radiation complaints consists of converter station (换流站), signal (信号), base station (基站), and EM radiation (电磁辐射). The keywords for light complaints are community (小区) and resident (居民).
In short, this proves that keywords can accurately reflect the differences in environmental complaints and further provide a scientific basis on which for environmental managers to solve environmental problems with accurate entry points. Turning to the similarities of keywords, the terms resident (居民) and community (小区) appear in all type of complaints. The result confirms that the residents and their living environment are of great concern in environmental complaints.
3.2. The Sentiment of Environmental Complaints
The box plot (Figure 4) shows that the mean (air: −0.11; water: −0.10; noise: −0.10; waste: −0.04; EM radiation: −0.15; light: −0.18) and median (air: −0.09; water: −0.08; noise: −0.08; waste: −0.04; EM radiation: −0.10; light: −0.19) of all types of environmental complaint sentiment are both lower than zero, which indicates that the complainants’ overall sentiment tendency is negative. Comparing the mean and median of various environmental complaints, electromagnetic radiation and light have the lowest value. The sentiment value distribution of electromagnetic radiation is the most scattered (0.30), followed by light (0.23), which is presumably due to the wide differences between cognitive and individual. There is little difference in the sentiment value distribution of air, water, and noise pollution complaints.
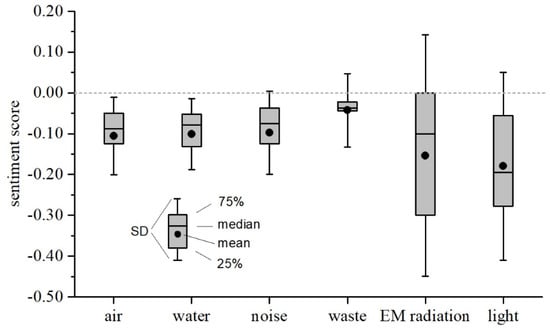
Figure 4.
Sentiment score for each complaint.
3.3. The Semantic Network of Environmental Complaints
As shown in Table 7, we identified the proportion of clusters and sub–clusters in semantic networks. From the semantic network node, the pollution characteristic is the largest cluster of each network. Except for noise complaints, cluster 3 (complainant) has a higher proportion than cluster 2 (stakeholder). This suggests that individuals making the complainants pay most attention to pollution characteristics, especially the sub–cluster pollution source, followed by their impacts. Stakeholders account for the smallest proportion, which may indicate the least understanding of this cluster of complainants.
Table 7.
Statistics of semantic network clusters of each complaint.
Citizens’ insufficient knowledge of relevant stakeholders, such as polluting firms and administrations, has also led to complaints that cannot be handled well. According to the official statistics of responses to complaints, 1225 complaints (21.60%) are not within the authority of the Ecology Environment Bureau. Moreover, the complaint contained other stakeholders, including the Water Affairs Bureau, the Urban Management Bureau, and the Education Bureau, which reflects the complexity of urban pollution management. Therefore, urban environmental management needs to strengthen the coordination of multiple departments.
Figure 5 reflects the relationships between the keywords of citizens’ environmental complaints, from which we observed that the relationships between pollution sources and pollution receptors (PR–PS) are the most important in environmental complaints, such as resident–lampblack (居民–油烟) and resident–exhaust gas (居民–废气) in air complaint; resident–sewage (居民–污水) and residential–oil bath(住宅–油池) in water pollution complaints; noise–resident (噪声–居民) and resident–lampblack (居民–油烟) in noise complaints; waste–resident (垃圾–居民) and garbage station–resident (垃圾站–居民) in waste complaints, residential–converter station (住宅–换流站) in electromagnetic radiation complaints; and LED–resident (LED–居民) in light pollution complaint. From the standpoint of the complainant, pollution sources are a primary concern in environmental complaints. The relationships between the above keywords indicate which pollution should be first supervised and controlled.
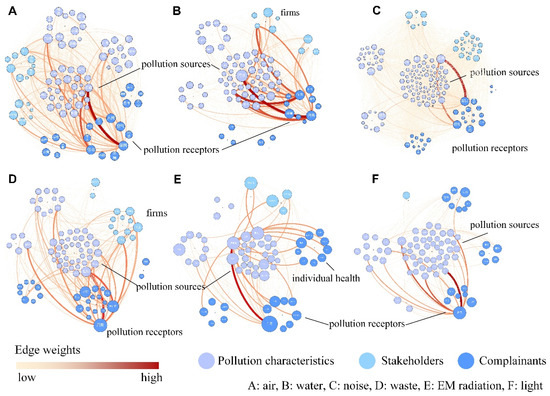
Figure 5.
The semantic network of environmental complaints. (A): 96 nodes and 1371 edges; (B): 91 nodes and 582 edges; (C): 177 nodes and 2683 edges; (D): 101 nodes and 458 edges; €: 72 nodes and 302 edges; (F): 86 nodes and 252 edges.
In addition to the most concerning relationship between pollution sources, other relationships in environmental complaints also deserve the attention of environmental managers, including those between pollution receptors and pollution behavior (PR–PB), pollution receptors and sensory feature (PR–SF), and pollution receptors and individual health (PS–HL) (Table 8). As shown in Figure 5, complaints about pollution behavior (PB) mostly regard space and time. The pollution behavior of air complaints and waste complaints emphasizes spatial issues (people–location ‘人民–选址’ and resident–location ‘居民–选址’), while the pollution behavior of noise complaints and light complaints emphasizes time, such as resident–disturbing (居民–扰民), residential–disturbing (住宅–扰民), and resident–overnight (居民–通宵). The relationship between the pollution receptor and sensory feature (PR–SF) is more prominent in air and waste complaints, mainly for smell–related terms, such as residential and odors (住宅–气味) and resident and stench (居民–臭味). Complaints about EM radiation show that the relationship between pollution receptors and individual health (PR–HL) is more prominent. Specifically, citizens are most concerned about the impact of converter stations on safety and health (converter station–physical and mental health 换流站–身心健康). This suggests that supervisors should provide the public with EM radiation–related knowledge.
Table 8.
Top 10 relations of environmental complaints semantic networks.
The relationship between pollution receptors and pollution behavior (PR–PB) suggests that scientific and integrated site selection is necessary to resolve environmental complaints, including more reasonable site selection of garbage dumps and power telecommunication equipment and stricter construction time control measures. Actions should be taken to address the problems reflected by sensory features (such as stench, mosquitoes, and rats) and to provide the public with environmental and scientific knowledge, especially regarding EM radiation pollution.
4. Conclusions
In this study, a framework for the textual analysis of Chinese environmental protection complaints was established, and the two–year civil environmental complaint records in Guangzhou city were analyzed using this framework. The conclusions show the following: (1) Civil environmental complaint characteristics can be identified. Keywords of various types of environmental complaints can be automatically and effectively extracted by TF–IDF, such as “lampblack” and “exhaust gas” in air pollution and “LED lights” in light pollution, which provides an accurate entry point for solving urban environmental problems. It also provides technical support for smart city environmental management. (2) The overall sentiment of environmental complaints is negative. Light pollution complaints are the most negative, and EM radiation complaints have the most fluctuating emotions, which may be caused by differences in citizen perception of EM radiation. (3) The semantic network nodes of the six types of environmental complaints reveal that the public pays the most attention to the pollution sources when complaining but the least attention to stakeholders, which may reduce the efficiency of environmental managers in handling complaints. (4) Besides the Ecology Environment Bureau, stakeholders in environmental complaints involve multiple government departments, including water affairs departments, urban management departments, and other departments. This not only reflects the complexity of environmental pollution but also shows that the issue of environmental complaints is deemed urgent by multiple departments. (5) The citizen semantic network indicates that pollution sources and pollution receptors are paid the most attention. Simultaneously, among different types of complaints, the pollution receptor’s relationship with pollution behaviors (site selection, overnight construction), sensory features (stench, dazzle), stakeholders, and individual health are also highlighted by citizens. These relationships suggest that the pollution behavior of pollution sources, sensory features, environmental knowledge of pollution sources, and other details may become a crucial part of pollution management, which will provide more accurate management measures and be beneficial to smart urban environmental governance.
For accurate text mining in further research, a rich corpus of environmental complaints must be established, and adaptable Chinese grammar for complaints needs to be summarized. Named–entity recognition could be considered, which will provide assistance in extracting detailed information about pollution incidents in semantic network analysis. Urban environmental management departments must establish a big data analysis system for environmental complaints based on text mining technology. Only in this way can urban environmental issues be effectively managed.
Author Contributions
Y.J. developed the framework for textual analysis and performed the experiments, derived the models, and analyzed the data. Y.L. was involved in part of the code work. Y.J. wrote the manuscript in consultation with C.L. All authors have read and agreed to the published version of the manuscript.
Funding
This research was funded by the Strategic Priority Research Program of the Chinese Academy of Sciences [Grant No. XDA23030401] and the Youth Innovation Promotion Association, Chinese Academy of Sciences [Grant No. 2017351].
Informed Consent Statement
Informed consent was obtained from all subjects involved in the study.
Conflicts of Interest
The authors declare no conflict of interest.
References
- Tong, H.; Kang, J. Relationships between noise complaints and socio-economic factors in England. Sustain. Cities Soc. 2021, 65, 102573. [Google Scholar] [CrossRef]
- Zhang, Y.; Chen, M.; Liu, L. A review on text mining. In Proceedings of the 2015 6th IEEE International Conference on Software Engineering and Service Science (ICSESS), Beijing, China, 23–25 September 2015; pp. 681–685. [Google Scholar]
- Dasgupta, S.; Wheeler, D. Citizen Complaints as Environmental Indicators: Evidence from China. In The Causal Effects of Long-Term PM2.5 Exposure on COVID-19 in India; The World Bank: Washington, DC, USA, 1997. [Google Scholar]
- Weersink, A.; Raymond, M. Environmental regulations impact on agricultural spills and citizen complaints. Ecol. Econ. 2007, 60, 654–660. [Google Scholar] [CrossRef]
- Dong, Y.; Ishikawa, M.; Liu, X.; Hamori, S. The determinants of citizen complaints on environmental pollution: An empirical study from China. J. Clean. Prod. 2011, 19, 1306–1314. [Google Scholar] [CrossRef]
- Liu, X.; Dong, Y.; Wang, C.; Shishime, T. Citizen Complaints about Environmental Pollution: A Survey Study in Suzhou, China. J. Curr. Chin. Aff. 2011, 40, 193–219. [Google Scholar] [CrossRef]
- Zhang, X.; Geng, G.; Sun, P. Determinants and implications of citizens’ environmental complaint in China: Integrating theory of planned behavior and norm activation model. J. Clean. Prod. 2017, 166, 148–156. [Google Scholar] [CrossRef]
- Zhang, X.; Liu, J.; Zhao, K. Antecedents of citizens’ environmental complaint intention in China: An empirical study based on norm activation model. Resour. Conserv. Recycl. 2018, 134, 121–128. [Google Scholar] [CrossRef]
- Evendijk, J.; Müskens, P.; De Jong, T. Relationship Between Citizen Complaints of Air Pollution, Meteorological Data and Immission Concentrations. Stud. Environ. Sci. 1980, 8, 379–386. [Google Scholar] [CrossRef]
- Huang, H.; Miller, G.Y. Citizen Complaints, Regulatory Violations, and Their Implications for Swine Operations in Illinois. Appl. Econ. Perspect. Policy 2006, 28, 89–110. [Google Scholar] [CrossRef]
- Carvalho, D.S.; Fidélis, T. The perception of environmental quality in Aveiro, Portugal: A study of complaints on environmental issues submitted to the City Council. Local Environ. 2009, 14, 939–961. [Google Scholar] [CrossRef]
- Wang, H.; Di, W. The Determinants of Government Environmental Performance: An Empirical Analysis of Chinese Townships. In The Causal Effects of Long-Term PM2.5 Exposure on COVID-19 in India; The World Bank: Washington, DC, USA, 2002; pp. 704–708. [Google Scholar]
- Arshad, S.; Shafqat, A.; Khan, A.A.; Safdar, Q. Youth environmental complaints in Bahawalpur City, Pakistan: An informational intervention for local environmental governance. Hum. Geogr. J. Stud. Res. Hum. Geogr. 2013, 7, 71–80. [Google Scholar] [CrossRef]
- Zhang, G.; Deng, N.; Mou, H.; Zhang, Z.G.; Chen, X. The impact of the policy and behavior of public participation on environmental governance performance: Empirical analysis based on provincial panel data in China. Energy Policy 2019, 129, 1347–1354. [Google Scholar] [CrossRef]
- Bhasuran, B.; Subramanian, D.; Natarajan, J. Text mining and network analysis to find functional associations of genes in high altitude diseases. Comput. Biol. Chem. 2018, 75, 101–110. [Google Scholar] [CrossRef]
- Jacinto, R.; Reis, E.; Ferrão, J. Indicators for the assessment of social resilience in flood-affected communities—A text mining-based methodology. Sci. Total Environ. 2020, 744, 140973. [Google Scholar] [CrossRef]
- Tseng, Y.H.; Ho, Z.P.; Yang, K.S.; Chen, C.C. Mining term networks from text collections for crime investigation. Expert Syst. Appl. 2012, 39, 10082–10090. [Google Scholar] [CrossRef]
- Liu, P.; Zhang, L.; Gulla, J.A. Multilingual Review-aware Deep Recommender System via Aspect-based Sentiment Analysis. ACM Trans. Inf. Syst. 2021, 39, 1–33. [Google Scholar] [CrossRef]
- Min, K.; Jun, B.; Lee, J.; Kim, H.; Furuya, K. Analysis of Environmental Issues with an Application of Civil Complaints: The Case of Shiheung City, Republic of Korea. Int. J. Environ. Res. Public Health 2019, 16, 1018. [Google Scholar] [CrossRef]
- Lee, E.; Lee, S.; Kim, K.S.; Pham, V.H.; Sul, J. Analysis of Public Complaints to Identify Priority Policy Areas: Evidence from a Satellite City around Seoul. Sustainability 2019, 11, 6140. [Google Scholar] [CrossRef]
- Lee, J.-H.; Park, H.-J.; Kim, I.; Kwon, H.-S. Analysis of cultural ecosystem services using text mining of residents’ opinions. Ecol. Indic. 2020, 115, 106368. [Google Scholar] [CrossRef]
- Salton, G.; Buckley, C. Term-weighting approaches in automatic text retrieval. Inf. Process. Manag. 1988, 24, 513–523. [Google Scholar] [CrossRef]
- Xin, Y.; Yang, Y.; Jiao, W.; Zhu, D.; Zheng, S.; Yuan, Z.; Yang, X.; Luo, Z. Sentiment Analysis of Homestay Comments Based on Domain Dictionary. Sci. Technol. Eng. 2020, 020, 2794–2800. [Google Scholar]
- Opsahl, T. Triadic closure in two-mode networks: Redefining the global and local clustering coefficients. Soc. Netw. 2013, 35, 159–167. [Google Scholar] [CrossRef]
- Bastian, M.; Heymann, S.; Jacomy, M. Gephi: An Open Source Software for Exploring and Manipulating Networks. In Proceedings of the Third International Conference on Weblogs and Social Media, San Jose, CA, USA, 17–20 May 2009. [Google Scholar]
Publisher’s Note: MDPI stays neutral with regard to jurisdictional claims in published maps and institutional affiliations. |
© 2021 by the authors. Licensee MDPI, Basel, Switzerland. This article is an open access article distributed under the terms and conditions of the Creative Commons Attribution (CC BY) license (https://creativecommons.org/licenses/by/4.0/).