1. Introduction
Big data has been an emerging driver in recent years for the further creation of values for companies and organizations spanning different industries by generating higher revenues, facilitating operations, improving system efficiency and deriving hidden insights. The use of big data has become widespread and is observed to be rapidly growing in the business sector because of its potential to increase productivity and operating margins. According to a report published by McKinsey Global Institute [
1], the utilization of big data is estimated to increase sector-wide productivity by at least 0.5% per year through 2020 and operating margins by more than 60%. In a more recent report [
2], McKinsey Global Institute estimated that Internet of Things (IoT), which is one of the most critical enablers of big data, will bring a potential economic impact of as much as USD 11.1 trillion per year in 2025. There have been various uses of big data for supply chain management and these applications are promising. The big data levers include inventory management, distribution and logistics optimization, informing supplier negotiations, performance transparency and labor input optimization [
1]. In this paper, we focus on one aspect of the use of big data: an application of radio frequency identification (RFID) technologies for managing cart operations in vast and highly dynamic distribution facilities. We also present a real case study of an actual implementation of our proposed system in a large and high-traffic airmail center (AMC). This application can bring significant impact to supply chain management because the efficiency of distribution facilities has become remarkably crucial in the recent years of the age of electronic retailing. The gain in efficiency of a distribution facility is expected to reduce the delivery time of products, resulting in a higher level of customer satisfaction and so an increase in market share.
RFID has been a key element in supply chains for over a decade. In 2003, Wal-Mart announced their plans for affixing RFID tags to the pallets and cases of the the items shipped by their major suppliers [
3]. A year later, the Department of Defense of the United States finalized the guidelines on which suppliers are required to place RFID tags on their consignments of pallets, cases and precious items [
4]. Since then, there have been various popular RFID applications, including monitoring cargoes and shipments [
5] and tracking products at an item level for inventory control [
6]. More recently, RFID has also been used within supermarkets for self-checkout [
7] and tracking the flow of customers via tagged shopping carts [
8]. The usage of RFID is expected to be expanding; according to [
1], the number of RFID tags sold over the world is estimated to be 209 billion in the year of 2021.
Our proposed system of locating carts at mail facilities is different from the traditional RFID applications and was motivated by a real-world problem; we developed an RFID infrastructure to enable tracking and tracing capabilities of carts at a large and high-traffic AMC. One of their major operational problems was that the carts loaded with mail bags were densely staged at the AMC and the staff members were spending a very long time searching for the carts of the departing flights in this highly dynamic environment. Because of this problem, we developed an RFID-based positioning system to help the staff members of the AMC locate carts in real time. This system can improve the operational efficiency of the facility, reduce misplacements of mail bags to flights and enable the capability of analyzing cart movements with the offline locational data. While there are already numerous successful applications of RFID for managing supply chains, to the best of our knowledge, this is the first paper that reports this novel application of RFID for tracking carts at distribution facilities to enhance throughput and operational efficiency. The scientific objective of our research is to demonstrate the effectiveness of RFID technologies with the use of triangulation of signals in identifying tagged objects in a crowded fast-moving environment. We also believe that this application has a high practical impact on supply chain management due to the prevalence of electronic retailing in recent years.
The remainder of our paper is organized as follows. In
Section 2, we review the existing work on RFID and their use in supply chain management. In
Section 3, we present the architecture of our proposed platform and discuss its potential benefits to distribution centers.
Section 4 provides the case study of our actual implementation at the AMC and presents the analytics powered by the RFID tracking data collected.
Section 5 concludes our work.
2. Literature Review
Real-time locating technology is an essential enabler for our proposed platform. In particular, in our motivating example, an RFID infrastructure has been established for the AMC to locate carts in real time. The applications of RFID technologies are popular in various industries, such as retail [
9,
10], logistics [
11] and healthcare [
12,
13,
14,
15,
16,
17]. For recent detailed reviews and summaries on RFID applications, we refer the reader to the works of Liao et al. [
18].
RFID has been demonstrated to be an effective technology to track tagged objects. For example, it has been deployed to track components and parts of products in a job shop [
19], shopping carts and apparel products [
20,
21]. The objects in this research study (i.e., carts in our application) have to be tracked in a highly dynamic environment where their precise locations in real time and continuous time have to be tracked. This is highly relevant to the applications of RFID for object localization. In existing studies, RFID has also been demonstrated in successful applications for localizing people in a building [
22], patients and medical equipment at hospitals [
16,
17], equipment at industrial sites [
23] and shopping carts in supermarket aisles [
24]. The successful applications support the feasibility of RFID technology in our research.
RFID has been applied extensively in supply chains; for comprehensive literature reviews, we refer the reader to the works of Tajima [
25] and Sarac et al. [
26]. The benefits and values of RFID technologies have also been shown in various studies. Dutta et al. [
27] discussed three dimensions of the value proposition of RFID—technology, value measurement and incentives—and examined how business value can be extracted from the technology. There have also been analytical approaches to evaluate impacts of RFID technologies on supply chains. Inventory record inaccuracy (such as shrinkage, transaction errors and misplacement) is a pervasive problem in retail in retail supply chain [
28]. Heese [
29] presented a supply chain model to examine the impact of inventory record inaccuracy on optimal stocking decisions and founded that it can aggravate the inefficiencies caused by double marginalization in decentralized supply chains. Assuming that RFID technologies can improve inventory record accuracy, he derived the cost thresholds that the adoption of the technologies become beneficial. Gaukler et al. [
30] developed analytical models to evaluate the benefits of item-level RFID to the manufacturer and the retailer. Lee and Özer [
31] reviewed a number of analytical models that can help measure the value of RFID. In addition to analytical models, simulation is also able to estimate the impacts of RFID on supply chains. Fleisch and Tellkamp [
32] developed a simulation model to show that the elimination of inventory inaccuracy can reduce supply chain costs. Ross et al. [
33] also adopted a simulation approach to examine the tradeoffs associated with various RFID implementation strategies. Sarac et al. [
34] considered inventory inaccuracies and used simulation to examine the effects of introducing RFID technologies on the supply chain performance. There have also been empirical studies that attempt to measure the value of RFID technologies. Visich et al. [
35] used data of secondary sources to examine the impacts of RFID on supply chain performance and help practitioners identify implementation areas that the technologies can be advantageous. Whitaker et al. [
36] studied the data on U.S. firms and adverted that RFID implementation expenditure is positively correlated with the expected early return on RFID investment. Furthermore, RFID can also improve product safety and security [
37] and trace bad products [
38] in supply chains.
There has also been literature on reporting successful real-world applications of RFID in supply chains. Ngai et al. [
39] presented a case study that used an RFID infrastructure to trace airplane repairable items in an aircraft engineering company in Hong Kong. Their study also suggested critical success factors for companies to adopt RFID technologies for their businesses (e.g., strong internal and external motivation for improvement, desire to keep abreast of the latest technology, avoiding major process changes and RFID skills and knowledge transfer) and summarized the lessons learned from their study (e.g., identification of the advantages and return on investment, securing top management support, performing a small-scale proof-of-concept testing and using standard hardware and software). Most case studies are relevant to warehousing operations. Holmqvist and Stefansson [
40] presented a case from Volvo that made use of mobile RFID, cellular networks and web technologies for managing products in a supply chain and evaluated the application regarding its operational reliability, usability and productivity. They also demonstrated the productivity gain in lead-time due to the adoption of the solution. Chow et al. [
41] proposed an RFID-based system for handling the sequences of performing daily warehousing tasks. Their system was piloted at GENCO. In a later work, Chow et al. [
42] developed an RFID-enabled logistics process knowledge-based system, which can automatically identifies current process status and provide knowledge support to staff members, and demonstrated the application with a case study in Eastern Worldwide Company Limited. Poon et al. [
43] piloted an RFID case-based system for aiding decisions of order picking at Group Sense Limited. Their system had the capability of identifying the locations of the resources and recommending the shortest pick-up route. Wang et al. [
44] developed an RFID-based digital warehouse management system, which supports real-time inventory management and automatic storage and retrieval assignment. Poon et al. [
45] proposed a real-time warehouse operation planning system, which adopts a set of RFID equipment to collect information about resources and demand orders, to support order pickup and delivery operations. Wamba et al. [
46] presented a case study of a Canadian third-party logistics supply chain, which adopted RFID technologies for truck tracking and warehouse operations. The integration of the RFID infrastructure with the existing ERP and WMS enabled the real-time verification of shipments and hence reduced shipment mismatches. It also enhanced the efficiency of the picking and shipping processes. For a comprehensive review of the literature on RFID in warehousing, we refer the reader to the work of Lim et al. [
47].
Our application is different from the existing research on the traditional use of RFID for warehouse operations because: (i) in those applications, the items considered are usually static so that real-time locating systems provide less value to them; and (ii) carts can be staged at any unoccupied space in the facility. Furthermore, in addition to the capability of locating objects in real time, we analyze the tremendous offline historical data about cart movements collected from our RFID-based system for studying operational issues in this large facility.
3. An RFID-Enabled Real-Time Cart-Locating Platform for Mail Facilities
RFID, which uses electromagnetic fields to establish wireless data communications, is a key enabler for our proposed application. In this section, we present the architecture of this RFID-enabled platform for managing cart operations at distribution facilities. Our project team successfully developed a system based on this architecture, and this system was implemented in a large and busy AMC in an Asian city. The details of the implementation are given in
Section 4. With this platform, the AMC is also able to: (i) promptly locate carts loaded with mail bags of departing flights and reduce mail delays; (ii) reduce misplacements of mail bags to ULDs; and (iii) analyze cart movements and derive insights into managing the cart operations from the data collected. This actual implementation also demonstrates the practicality of the platform.
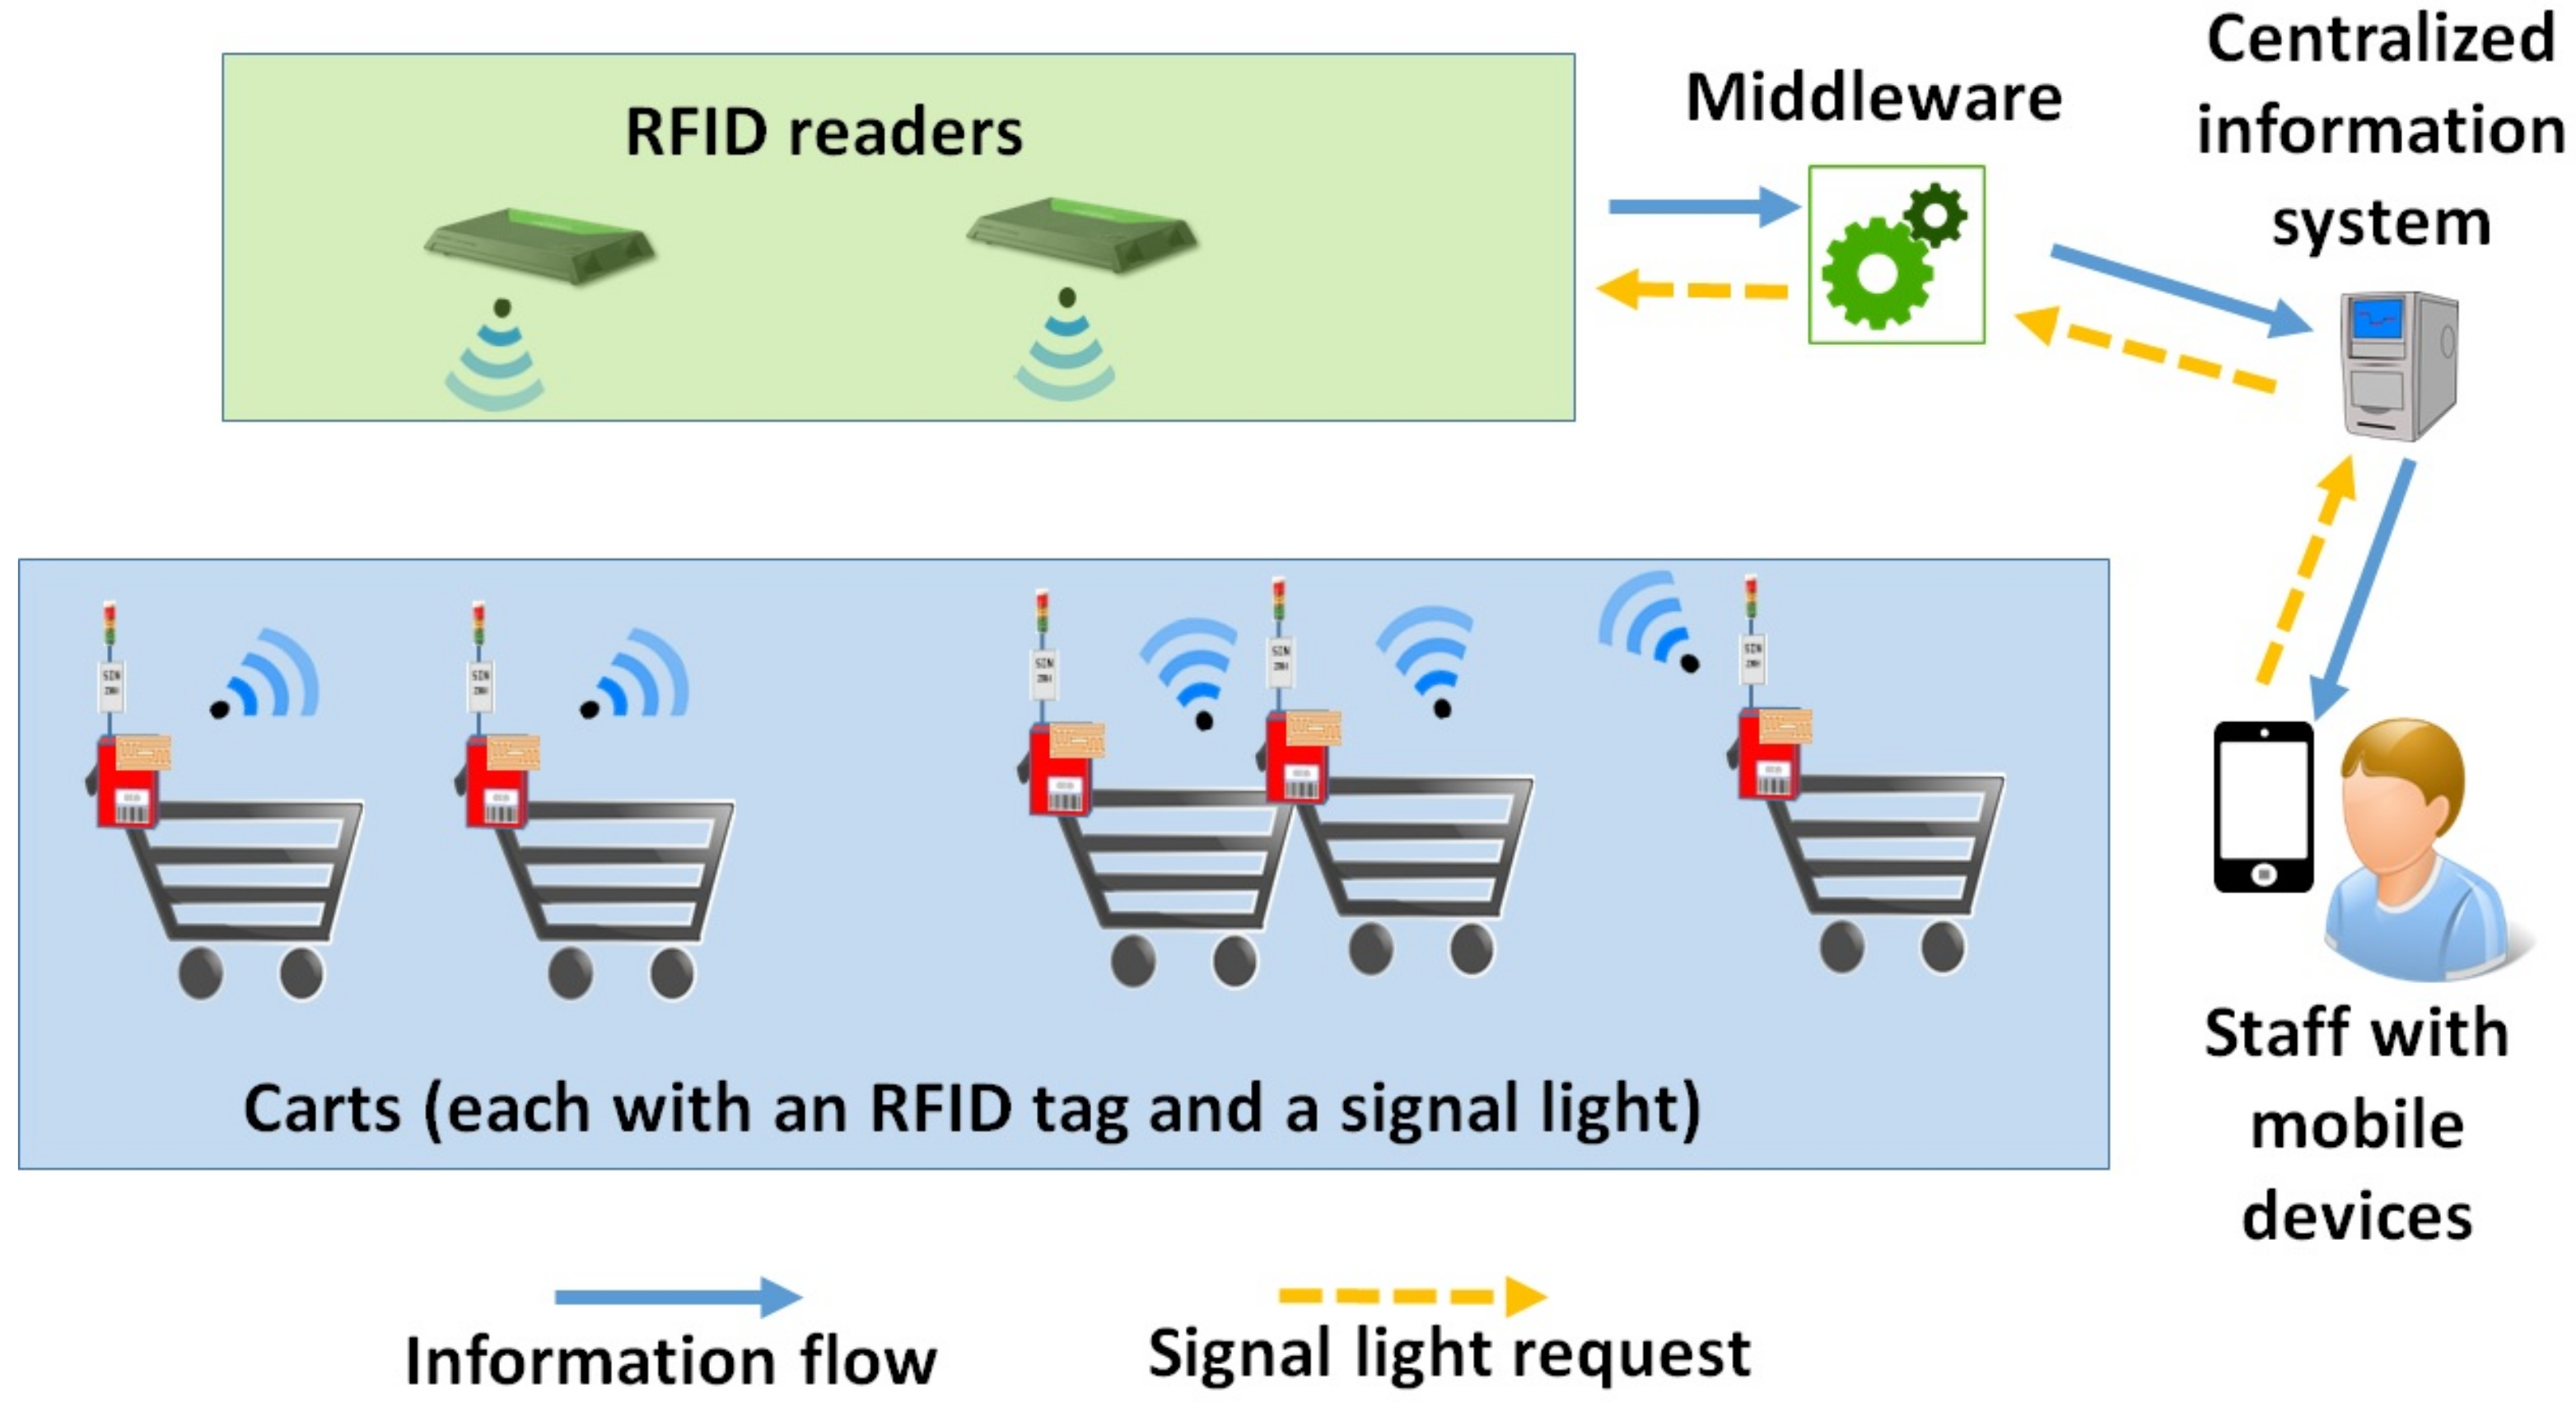
Our platform consists of the ordinary key components of RFID platforms: tags, readers and middleware. Active RFID is adopted for our platform because of its higher tracking ability. The benefits of active RFID over the passive one in this application are its longer read range (i.e., the maximum distance that the tags and the reader can communicate) and its capability of continuously and automatically tracking the objectives, although the active one is more expensive and needs battery to supply power to the tags [
48]. In our application, RFID tags are affixed to the carts in the facility. Each tag has an ID, which is unique in the information system; since each tag is associated with exactly one cart, the tag ID can be used to identify the cart. Several positioning readers are installed at different locations within the facility such that the tags can be positioned by using the estimated angles of arrival communication signals between the readers and the tags and the signal strengths. An illustration of the principle of this locating method is given in
Section 4. The middleware establishes the data linkage between the positioning readers and the main information system of the company or organization so that the staff can retrieve real-time locational information about all the carts to facilitate the circulation of mail bags within the facility. Information related to each mail bag (e.g., destination of the mails) is available in the system so that staff can acquire the desired information whenever needed. Mobile applications can be developed on portal electronic devices, such as smartphones and tablets, to provide staff members with an access to the required information from the system in the highly dynamic environment of the facility. From the mobile application, the users can send a request to the platform for locating the carts loaded with mail bags of the selected flights on the map of the facility in real time. Signal lights connected with the RFID tags are installed on the carts so that the users can use the mobile application to send visual signals from the selected carts for effective on-spot searching. In addition to the information about the cart locations, the mobile application also has the capability of providing the planned loading times of the mail bags to the ULDs using the latest flight schedule obtained from the airport authority such that the staff members can realize the urgencies of the loading tasks.
Figure 1 depicts the flows of information and visual-signal requests on our proposed RFID-enabled platform. The historical data about the cart locations also be analyzed to provide intelligence for improving the staging operations at the mail facility. Examples of such offline data analytics are provided in
Section 4.2. In summary, our proposed platform can facilitate mail bags circulating at both operational and analytical levels by the capabilities of real-time tracking of carts, reducing misplacements of mail bags to flights and performing intelligence and analytics on operational enhancement. The overall benefits of the system are as follows.
3.1. Enhanced Operational Efficiency
Our proposed platform could result in enhanced efficiency and throughput of the facility. In a vast facility which has a large number of carts circulating, it is very time consuming for the staff to locate the carts of flights which are soon to depart. The capability of locating the carts in real time can save staff members a significant amount of time from searching for the necessary carts. The mobile application developed on a portable device can be used to retrieve the real-time information from the main system and to display the locations of carts of the selected flights on the floor map of the facility. Signal lights are installed on the carts and used to help the staff identify the carts of selected flights more efficiently. An alert can be issued in the system for notifying the staff members of the situation that mail bags have not been moved to the ULD loading area by the planned time. This capability can also eliminate the cases of mail bags being late for loading or not being loaded to their intended flights. Consequently, this system can reduce the total delivery time of items from senders to receivers.
3.2. Reduced Risk of Misplacement of Mail Bags to Flights
Another advantage of this platform is the reduced risk of misplacement of mail bags to flights. The misplacement of mail bags to flights can be avoided in two ways. First, the signal lights on the carts can ensure that the staff members are moving the right carts. Second, the locating system can also warn the staff if carts are entering the ULD area but they are not supposed to be there.
In the next section, we present a case study which adopted this proposed RFID infrastructure for managing mail bag circulating operations.
4. Case Study: Tracking of Carts in a Large and High-Traffic RFID-Enabled Air Mail Centre
In this section, we present a case study of developing an RFID infrastructure to enable tracking and tracing capabilities of carts at a large and high-traffic AMC in an Asian city.
4.1. Actual Implementation at a Mail Facility
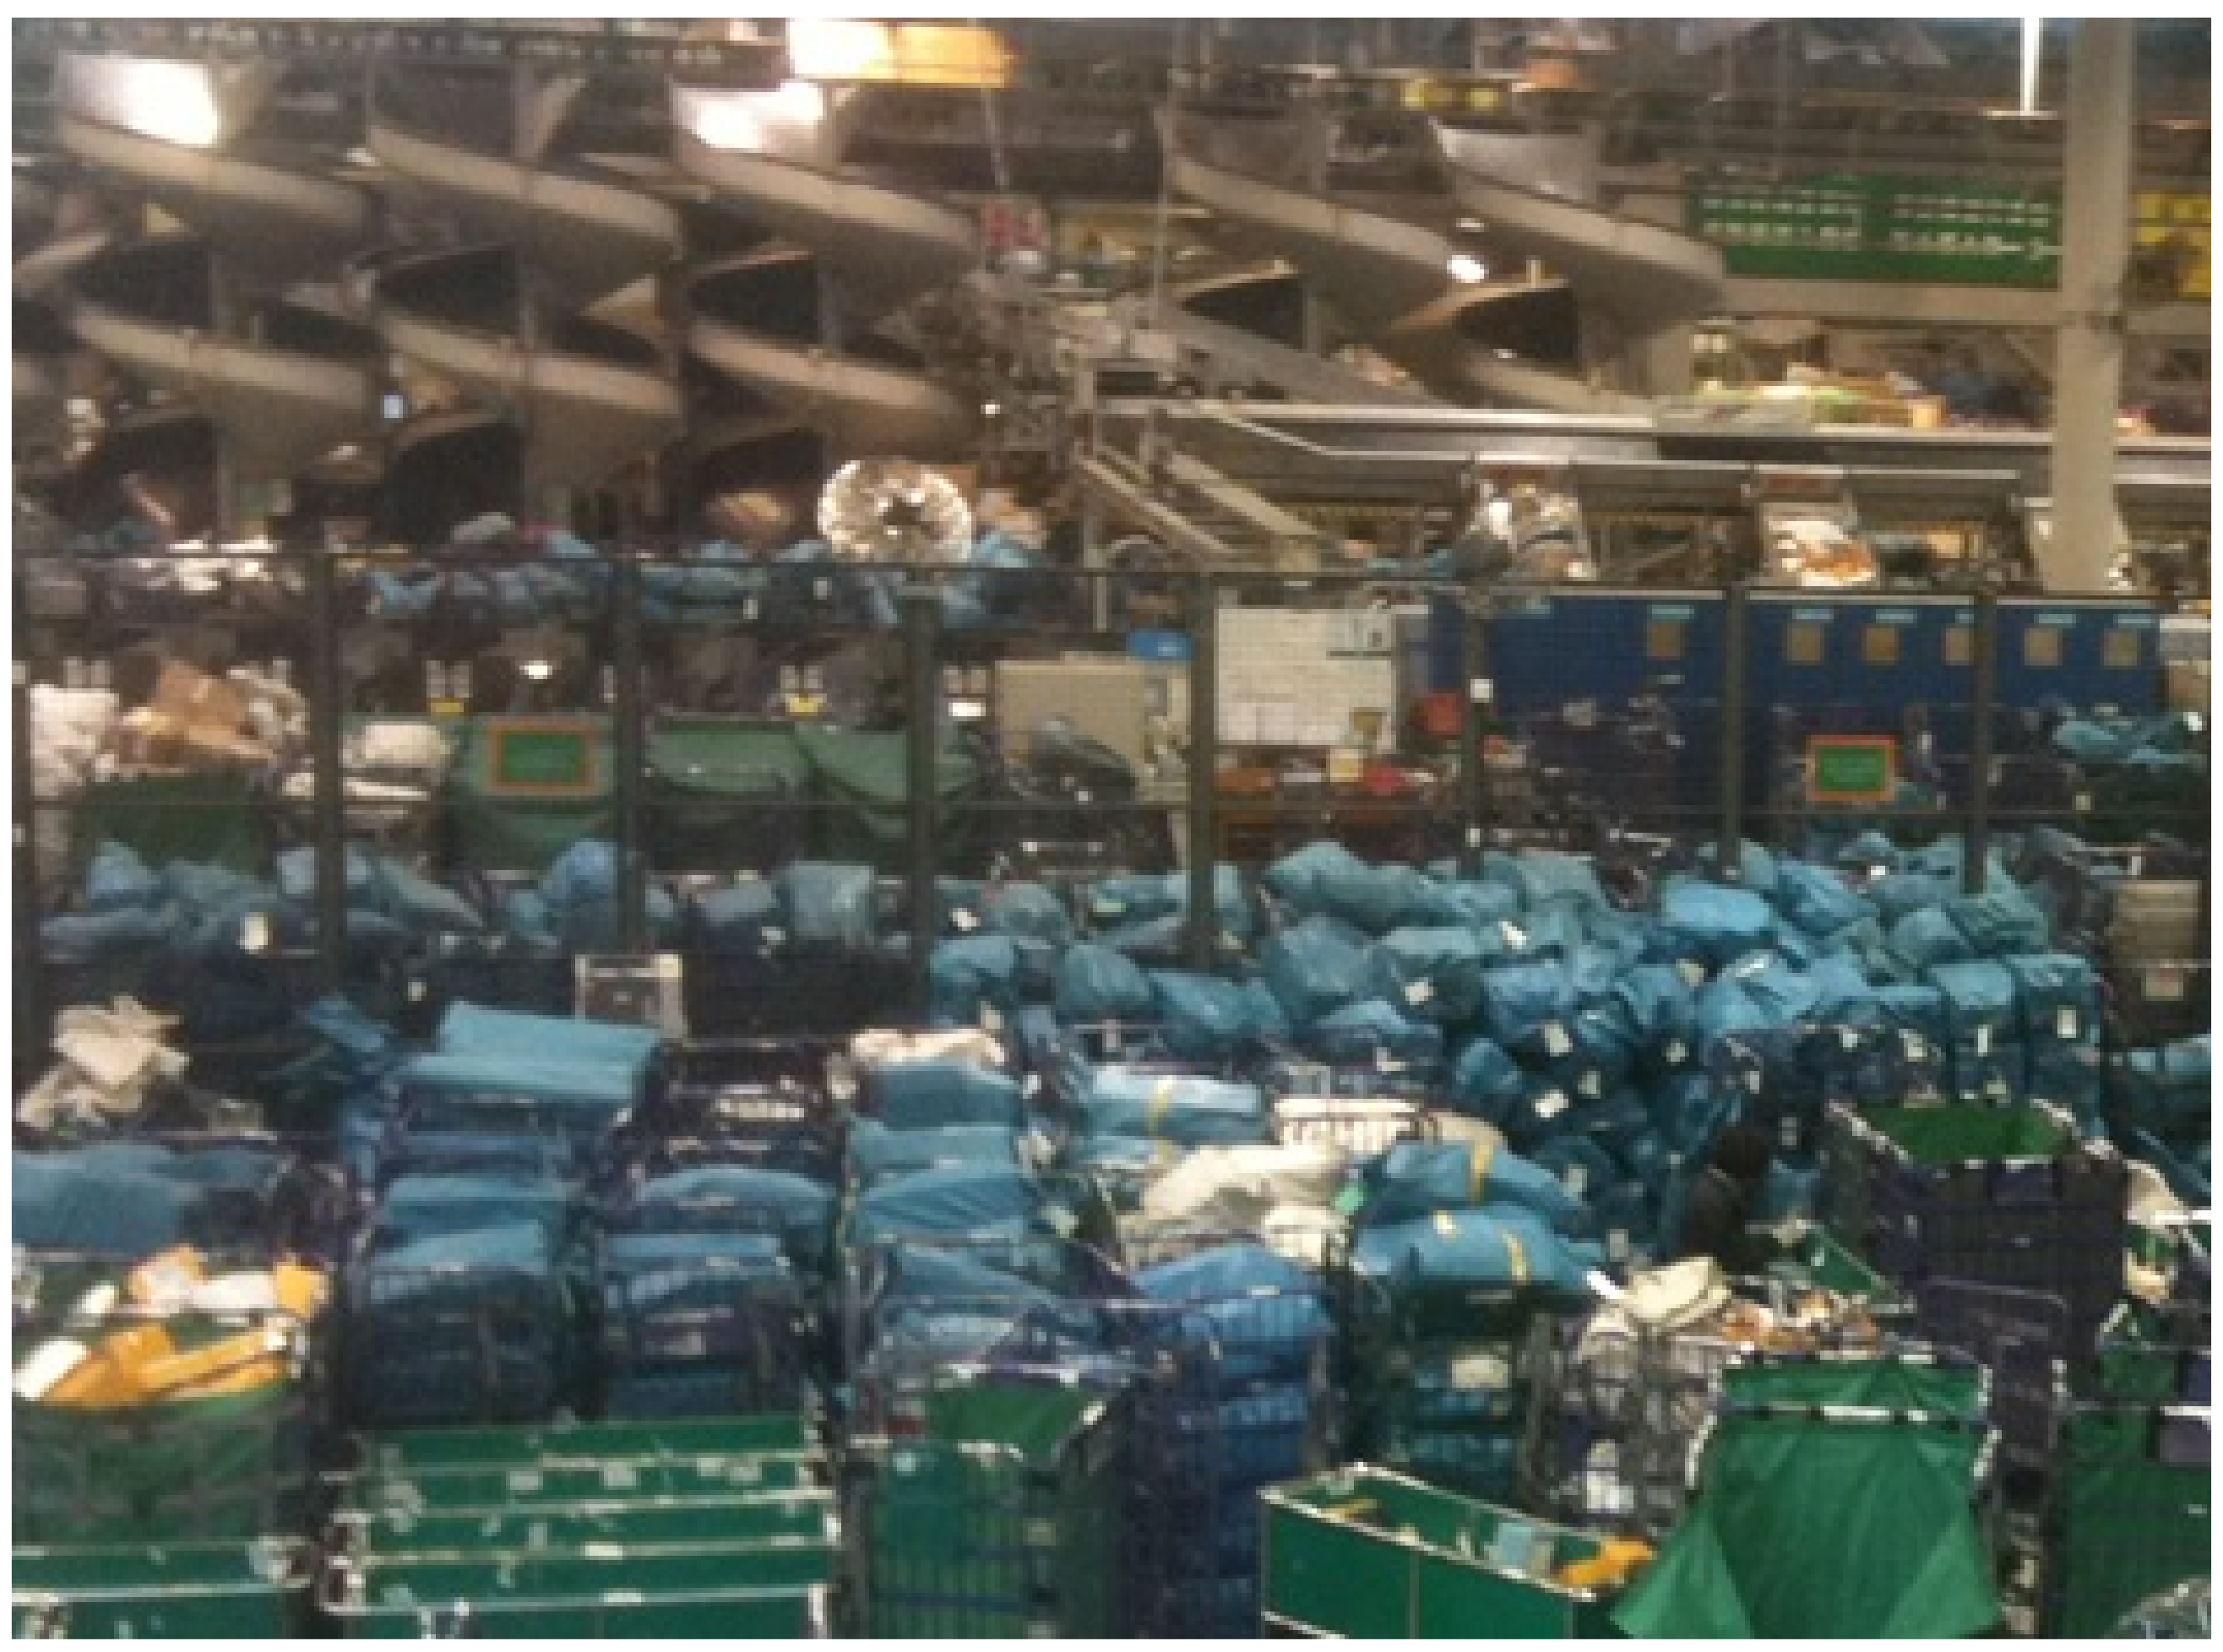
The AMC, which is operated by the local governmental Post Office, is located next to the international airport of the city, has an area of about 100,000 square meters and handles an average of 700,000 mail items per day. The large area of the AMC, the tremendous volumes of mail items being sent to more than 180 cities across the world and the high air traffic at the international airport (around 1000 flight movements per day) all together create a very challenging task for the AMC to deliver mail items to their intended flights efficiently. One of the major operational problems was that the carts loaded with mail bags were densely staged at the AMC and the staff members were spending a very long time searching for the carts of the departing flights in this high-traffic environment.
Figure 2 depicts shows the very crowded environment of the AMC, where the carts loaded with mail bags are densely staged within the facility, on a typical day. During the original practice, the staff members spent a significant amount of time reading the tags, which state the destinations of the mail bags, for finding the right carts of the departing flights. This not only was time-consuming, but also exhausted the staff members. For this reason, the AMC decided to adopt advanced information technologies to reduce the time of searching for carts and hence to increase their operational efficiency and throughput.
The readers and tags used on this platform were developed by the Department of Electronic Engineering, the Chinese University of Hong Kong. In total, 68 positioning RFID readers were installed at various places of the AMC and 300 carts had an RFID tag affixed to it. The facility was zoned for cart staging and RFID readers were set up at the different corners of each zone. Therefore, there were at least four RFID readers used to locate each object to ensure a high level of positioning accuracy.
Figure 3 shows several positioning RFID readers installed on a pillar of the facility.
Figure 4 shows a display board, where an RFID communication module and an antenna module are installed.
Figure 5 shows a cart for circulating mail bags, with the display board showing the abbreviation of the destination of the mail bags and a signal light to help the staff members to identify the carts. The positioning method adopted by this project was based on the angles of arrival signals from the tags to the readers. A graphical illustration is shown in
Figure 6. The staff members could also send a request using the mobile application via the RFID network to switch on the lights of the carts. This capability successfully assisted the staff at the AMC to locate carts in real time and could save them time from searching for the carts. The RFID system also stored the location data about the carts: at the time that a cart was located by an RFID reader, a time stamp and information about this transaction (e.g., the RFID tag ID and its coordinates of location) were stored into the legacy computer system of the AMC. The platform captured the data about the locations of the carts and these data have the following “big data” characteristics:
High transfer rate: Data were transferred automatically and continuously between the readers and the tags. The wireless communication data rate of the system was 250 kbps and the read rate in positioning was 40 tags per second. All the transmitted data were stored in the information system.
Volume: These high-speed locational data were captured and aggregated in the system. In total, there were more than 11 million records, excluding those of which the cart was staying at the same location point for a certain time duration, collected in the information system.
Accuracy: In total, 68 readers were installed at different places of AMC to achieve a high positioning accuracy for the cart locations. The positioning accuracy of the system was within 1 m.
This system can help the staff members of the facility manage the cart operations more efficiently. When an AMC staff requires moving the cart to the ULD area, he or she can immediately locate the carts in real time (as demonstrated in
Figure 7) and extract information about their loaded mail bags. Staff members can further reduce their searching time by sending a request to turn on the signal lights of the selected flights via the RFID infrastructure using the mobile application. This practice can save their time and effort in searching for the right carts. As a result, the risk of having delay in the delivery of mail bags to flights is mitigated, while throughput and efficiency are enhanced.
4.2. Offline RFID Data Analytics
While this platform is still in use at AMC, we only extracted data captured between January 2015 and April 2015 for the analysis in this study. Every second, the real-time information about the cart locations was transferred to the information system via the wireless data transmissions between the tags and readers. To reduce the data storage requirement and the computational effort for data analysis, we discarded records that a same cart staying at the same position for a period of time; in other words, we only kept those indicating moving activities. In total, we obtained 11,287,904 records and all are used in this analysis. Each data record consists of a unique record ID, the timestamp of the record created, the location of the cart (expressed in terms of the x- and y- coordinates of the cart on the layout map), the reader ID and the tag ID.
Data visualization is adopted as the data analytics technique to analyze the cart staging operations. The AMC staff can visualize the collected offline RFID data to analyze the cart movements, observed non-trivial operational issues and improve operations. The staging duration was measured as the sum of time periods where the cart was inactive. The speed of a cart was defined as the distance moved divided by the time. The number of movements was defined as the time points which the status of the cart changed from inactive to active.
4.3. Staging Durations of Carts at Different Locations
Data visualization is one of the most powerful tools of data analytics.
Figure 8 shows the cart locations for a selected hour (left) and a selected date (right). The carts are represented by different colors. The circle size is directly proportional to the total duration that the cart was staying at the location. That is, a larger circle means a longer duration the cart was staying there.
Figure 8 shows that the carts spent most time near the pocket sorting machine and at/near the ULD loading area (i.e., the area of ETV in the figure). As expected, there appears to be a pathway in the middle of the crowd of carts so that the staff members could move the carts more easily to the ULD loading area. Another observation from the figure on the left is that there are some clusters of small dots with the same color. This phenomenon indicates that some carts were moved to a nearby location very frequently (but were not heading to the ULD loading area). This may imply that some staff members were trying to relocate the cart. Such movements happen when a crowd of carts blocked a cart that was required to be moved to the ULD loading area, and hence relocations of carts were needed. The AMC management can consider the number of occurrences of such clusters of small dots with the same color as a measure of operational efficiency. If this occurs very frequently, it indicates the rules of guiding the staging operations are not good enough and the operational team should reconsider the staging rules.
4.4. Tracking of Cart Movements
Figure 9 demonstrate the paths that selected carts were moving in a selected hour (left) and on a selected day (right). Again, the carts are represented by different colors. In the figure, we observed that the movements of carts are very frequent. We are also able to identify some relocation movements of carts (i.e., those movements that are not for delivering the mail bags from the sorting machine to the ULD loading area), which are those paths that are bounded within a small area. Again, if such relocations of carts are very frequent, the AMC management should reconsider the staging rules. The platform is also able to calculate the number of moves and distance traveled by carts within particular time periods. For example,
Figure 10 and
Figure 11 depict the total number of moves and the total distance traveled by all tagged carts within the implementation period in different hours. These figures could reflect how busy the AMC was in different hours. The higher is the number, the busier was the facility. These figures, therefore, could potentially be used as an important piece of information for resource allocation and planning. We observe that both figures have similar patterns; the peak period was from 07:00 to 20:00 where the carts moved very frequently and traveled long distances. Note that, in our calculation for distance, we assume that the cart moved from one point to another in a straight line. Therefore, the actual distances traveled could be longer than what we presented, but we do not expect the errors are significant due to our very frequent collection of location data. By using the distance traveled from one point to another and the time required, the system is also able to estimate the speed of the cart.
Figure 12 depicts the average speed of all tagged carts in different hours. We also observe that the speed was higher during the peak hours. That might be due to the fact that during the peak hours the AMC was much busier and the staff members had to rush at moving carts for loading mail bags to ULDs. Similarly, this speed could be underestimated as we assumed that the carts moved in a straight line from each point to another.
4.5. Discussion
Our project team learned some lessons from the implementation of this RFID-enabled locating system. The technological challenge of the project was that the angles of arrival signals from the tags to the readers might not be exact due to various factors. For example, the accuracy can be affected by the metallic walls, blockage of signals, movements of tags, other movements of objects within the facility, interferences from other electrical devices, etc. Moreover, the indoor channel fading effects might also cause severe communication failures at some particular locations. Therefore, our project team used multiple readers to locate each tag and conducted a site survey for more than a year to figure out the proper locations for installing the readers for the best positioning performance. In the site survey, the project team had done a series of experiments to ensure a high positioning accuracy, including: (i) measuring antenna pattern of every positioning reader; (ii) performance test of the estimated angles of arrival signals; (iii) performance test of the readers in different positions and environments; and (iv) weight assignments to the readers for calculation of location based on the accuracy. More specifically, two key techniques for positioning accuracy improvements are:
Positioning by angles of the tagged object from more than three receivers for a smaller confident zone
Filtering receivers by ignoring the signals from receivers which did not lie within the confident zone
As reported by other studies (e.g., [
31,
39]), return on investment (ROI) is the biggest concern of companies and organizations about the adoption of advanced technologies. In this project, the benefits and value of adopting RFID to locate the carts for more efficient operations at the AMC could not be directly converted to monetary value. Therefore, our project team tried various methods to reduce the cost of establishing this RFID-enabled locating system. For example, our team developed RFID tags, the middleware and the mobile application in-house; reduced the power required to operate the system (e.g., the display board was turned on only when a signal request was sent from the mobile application); and replaced the original 6-inch E-Ink display board of 800 × 400 resolution with the 5.2-inch LCD display board of 128 × 280 resolution. The cost of the new version of RFID tags was then reduced by one-third. Furthermore, the AMC was also able to secure a grant from a funding agency to financially support this project on integrating innovation and advanced technologies for real-life applications in the industry. Our project team also had very frequent meetings and on-site visits at the AMC to ensure that the user requirements were correct and the solutions for locating objects within the facility were feasible.


