Article

Modeled 3D-Structures of Proteobacterial Transglycosylases from Glycoside Hydrolase Family 17 Give Insight in Ligand Interactions Explaining Differences in Transglycosylation Products

by
Javier A. Linares-Pastén
1,*,
Lilja Björk Jonsdottir
2,
Gudmundur O. Hreggvidsson
2,3,
Olafur H. Fridjonsson
2,
Hildegard Watzlawick
4 and
Eva Nordberg Karlsson
1,*
1
Biotechnology, Department of Chemistry, Lund University, P.O. Box 124, 221 00 Lund, Sweden
2
Matis Ltd., Vinlandsleid 12, 113 Reykjavik, Iceland
3
Faculty of Life and Environmental, Sciences, University of Iceland, Sturlugata 7, 102 Reykjavík, Iceland
4
Institut für Industrielle Genetik, Universität Stuttgart, 70569 Stuttgart, Germany
*
Authors to whom correspondence should be addressed.
Appl. Sci. 2021, 11(9), 4048; https://doi.org/10.3390/app11094048
Submission received: 7 March 2021 / Revised: 25 April 2021 / Accepted: 26 April 2021 / Published: 29 April 2021
(This article belongs to the Special Issue Trends in Biocatalysts Technology)

Abstract

:
The structures of glycoside hydrolase family 17 (GH17) catalytic modules from modular proteins in the ndvB loci in Pseudomonas aeruginosa (Glt1), P. putida (Glt3) and Bradyrhizobium diazoefficiens (previously B. japonicum) (Glt20) were modeled to shed light on reported differences between these homologous transglycosylases concerning substrate size, preferred cleavage site (from reducing end (Glt20: DP2 product) or non-reducing end (Glt1, Glt3: DP4 products)), branching (Glt20) and linkage formed (1,3-linkage in Glt1, Glt3 and 1,6-linkage in Glt20). Hybrid models were built and stability of the resulting TIM-barrel structures was supported by molecular dynamics simulations. Catalytic amino acids were identified by superimposition of GH17 structures, and function was verified by mutagenesis using Glt20 as template (i.e., E120 and E209). Ligand docking revealed six putative subsites (−4, −3, −2, −1, +1 and +2), and the conserved interacting residues suggest substrate binding in the same orientation in all three transglycosylases, despite release of the donor oligosaccharide product from either the reducing (Glt20) or non-reducing end (Glt1, Gl3). Subsites +1 and +2 are most conserved and the difference in release is likely due to changes in loop structures, leading to loss of hydrogen bonds in Glt20. Substrate docking in Glt20 indicate that presence of covalently bound donor in glycone subsites −4 to −1 creates space to accommodate acceptor oligosaccharide in alternative subsites in the catalytic cleft, promoting a branching point and formation of a 1,6-linkage. The minimum donor size of DP5, can be explained assuming preferred binding of DP4 substrates in subsite −4 to −1, preventing catalysis.

1. Introduction

Leloir glycosyl transferases (GTs) that utilize nucleotide-activated monosaccharides as donor substrates are the most common enzymes to catalyze glycosylation reactions in nature [1]. GTs are, however, not well suited for in vitro glycosylation reactions, due to the requirement of expensive nucleotide-activated glycosyl donors, as well as reported recombinant expression difficulties. Instead, retaining glycoside hydrolases (GH), with high transglycosylation activity (often referred to as transglycosylases) are ideal candidates for glycosylation reactions, due to natural abundance, robustness and wide acceptor specificity [2,3]. In transglycosylases, oligo- or polysaccharide acceptors react instead of water, resulting in a new glycosidic bond. Therefore, transglycosylases are attractive tools for developing a variety of glycoproducts [4], including oligosaccharides and glycoconjugates with applications in food, pharma, and other industries. Some examples with main specificities for α-glucosyl groups, include cyclomaltodextrin glucanotransferases (CGTases in family GH13) [5,6]. CGTases can also be used for the synthesis of alkyl glycosides [7,8].
Bacterial transglycosylases are involved in various functions. Periplasmic synthesis of β-glucans and cyclic β-glucans has been reported in some species [9] that may have roles in protection against antibiotics [10], plant-microbe interaction, or osmoregulation [11]. The enzymes identified to be involved in this synthesis are modular membrane-anchored proteins (NdvB), including GH17 catalytic modules. Cloning of synthetic genes, encoding the individual GH17 catalytic domains of these proteins from Bradyrhizobium diazoefficiens (previously B. japonicum, Glt20), Pseudomonas putida (Glt3) and P. aeruginosa (Glt1), have shown that these enzymes are able to hydrolyze β(1-3)-glucosidic bonds and transfer β(1-3)-glucooligosaccharides to other β(1-3)-glucooligosaccharide acceptors making new β(1-3)- or β(1-6)-linkages [12,13]. Biochemical studies using oligosaccharides have shown that Glt1 and Glt3 act from the non-reducing end, while transfer by Glt20 occurs from the reducing end (after removal of a disaccharide). The main product of the respective enzyme is also different. Glt20 produces branched 1,6-linked products [13], while Glt1 and 3 mainly form 1,3-linkages [12]. To understand the molecular reasons for these differences, structural information is needed. However, no structures of these transglycosylating types of bacterial enzymes are yet known, but, recently, a crystal structure of a GH17 β-1,3-glucanosyltransferase from the fungus Rhizomucor miehei (termed RmBgt17A) was solved [14].
In this work, the crystal structure of the fungal enzyme was used as the main template for building hybrid models of the structures of bacterial enzymes Glt20, Glt3 and Glt1. The models were then subjected to molecular dynamics simulations, which supported the stability of the modeled structures. Subsequent docking with different ligands allowed prediction of the amino acids potentially involved in specificity. This work provides an explanation of why these highly homologous enzymes act from either the reducing or non-reducing end of oligosaccharide substrates, based on molecular dynamics simulation and ligand docking to the modeled structure.

2. Materials and Methods

2.1. Modeling of the 3D Molecular Structures

Structures of the catalytic domains of Glt1, Glt3, (GenBank codes: AAG04552, AAN67147, respectively), and Glt20 (GenBank code: KU043394) were modeled from their corresponding amino acid sequences by homology modeling using YASARA v15.10.18 software [15]. A hybrid model approach was used (parameters for the prediction are listed in Supplementary Table S1). The crystal structure of RmBgt17A (PDB code 4WTP) [14] was the main template, while other crystallographic structures contributed with minor fragments in the hybrid models, as summarized in Supplementary Table S2. YASARA fully and automatically takes all of the steps to get the 3D model from the amino acid sequences and a detailed description of every step is available on the website.
Firstly, all possible templates were identified by running 10 PSI-BLAST iterations to extract a position specific scoring matrix (PSSM) from UniRef90 and searching the PDB for a match. The best template structures used were selected based on the BLAST alignment score, the WHAT_CHECK score in the PDBFinder2 database and the target coverage. Secondary structures were predicted to aid alignment corrections and loop modeling. Predictions were obtained by creating a profile of related UniRef90 sequences by running PSI-BLAST, using the PSI-Pred secondary structure prediction algorithm.
Initial homology models were built by aligning the target sequences with the available templates. These alignments considered structural information of the templates, as well as the predicted secondary structures and the structure-based alignment corrections were partly based on SSLAN scoring matrices. An indexed version of PDB was used to determine the optimal anchor points and to collect possible loop conformations. Sidechains were initially constructed as graphs and then the initial rotamer solution was determined in the context of a simple repulsive energy function. Loops were optimized by trying different conformations followed by side chain re-optimization. Sidechain rotamers were fine-tuned by steepest descent and simulated annealing energy minimization (EM) in dihedral angle space, considering packing, electrostatic interactions and solvation effects, using the YASARA2 force field. Next, unrestrained refinement of the full model was performed by energy minimization with explicit solvent molecules (water). All calculation tasks were applied to all combinations of templates and alignments giving a set of different homology models for each enzyme. Thus, 38 models were built for Glt1, 47 for Glt3 and 26 for Glt20. Every model was ranked based on the z-score, which describes how many standard deviations the model quality is away from the average high-resolution X-ray structure (negative values indicate low quality with respect to the high-resolution X-ray structure). The overall z-score is a weighted average of individual z-scores capturing correctness of backbone, side-chain dihedrals and packing interactions (overall z-score = 0.145 × Dihedrals + 0.390 × Packing1D + 0.465 × Packing 3D). Finally, for each enzyme, the best parts of the respective model were combined resulting in a hybrid model with a better z-score.

2.2. Model Refinement

All models were refined by molecular dynamics simulations using the force field YAMBER (Yet Another Model Building and Energy Refinement force field) parameterized in crystal space [16]. A simulation cell, 14 Å larger than the model along each axis, with explicit molecules of water as solvent and Na+ and Cl as counter ions, was used in a 500 ps simulation storing snapshots every 25 ps. The simulations were run with time steps of 2.5 fs.
Validation of the respective model was done based on the force field energy obtained for every snapshot (YASARA v15.10.18) [15]. Ramachandran diagrams were made using Coot [17]. Z-scores were calculated using the ProSA program (Protein Structure Analysis) [18]. The best model for each protein was then selected for molecular dynamic simulations and ligand docking.

2.3. Molecular Dynamics

The final model of each enzyme, Glt1, Glt3 and Glt20, was subjected to molecular dynamic simulations (MD) at 298 K for 500 ns using GROMACS 2016 [19,20]. Each system consisted of one protein molecule solvated in explicit molecules of water (TIP3P), containing 0.9% NaCl, in a cubic simulation cell of 10 Å extension from the protein. The AMBER03 [21] force field, periodic boundaries, 8 Å cut off of short-range electrostatic and van der Waals forces and long-range forces calculated by the Particle Mesh Ewald method was applied. The overall protocol has included energy minimization (EM), equilibration and production [22,23]. EM was performed by using the steepest descendent algorithm, with a step size of 0.1 Å, a tolerance of 1000 kJ/mol and a maximum of 50,000 steps. The equilibration included two steps with a simulation time of 100 ps each one, and time steps of 2 fs. Initially, the temperature was stabilized under NVT ensemble with temperature coupling by a modified Berendsen thermostat [24]. After, the pressure was stabilized under NPT ensemble with a pressure coupling by the Parrinello–Rahman method [25]. The production phase was launched for 500 ns, with 2.5 fs time steps, trajectories were saved every 1.25 ns, and root-mean-square deviations (RMSD) of alpha carbons and root-mean-square fluctuation (RMSF) were calculated. Illustrations of secondary structures were elaborated using the vectorial graphic editor Inkscape v 1.0 (https://inkscape.org, accessed on 1 December 2020), and the overall structures were displayed with the VMD v. 1.9.3 program [26].

2.4. Comparison of Modeled Proteins with Crystallographic Structures

The overall RMSD was calculated with the Chimera v 1.10.1 program [27], superimposing the structures with the alignment algorithm Needleman–Wunsch, matrix BLOSUM-62 and the match alignment cut-off of 5.0 Å. The overall superimposed structures and loops from the superimposition were displayed using Chimera v 1.10.1.

2.5. Mutant Construction

The positions of the potential catalytic amino acids were identified via superimposition of the model onto crystallographic structures of enzymes in GH17 (identified via the Cazy database: www.cazy.org, accessed on 1 December 2020). The importance of the respective residue was confirmed by mutagenesis, using the gene encoding Glt20 as template.
The plasmid pHWG1106, encoding MalE-smt3-glt20-his6 (hereafter termed MalE-Glt20, a derivative of Glt20 encoded by glt20 in pJOE4905 [13] was used as template for a single mutant construction to confirm the respective catalytic residue. Two variants were made where either the putative proton donor (Glu120) or nucleophile (Glu209) of Glt20 was replaced with Gln (MalE-glt20:E120Q and MalE-glt20:E209Q, see Figure 1 for residue numbering).
A protocol adapted to the one-step site-directed and site-saturation mutagenesis of Zheng et al. [28] was used to exchange the residue. A 50 μL polymerase chain reaction-reaction (5 μL 10× HF-buffer; 200 ng template; 1 μL forward-primer (100 pmol); 1 μL reverse-primer (100 pmol); 200 μM dNTPs; 2U polymerase (Pfx, Invitrogen, Carlsbad, CA, USA) was run using 94 °C for 3 min preheating; followed by 15 cycles (94 °C for 1 min; 52 °C for 1 min; 68 °C for 10 min); with a final elongation at 68 °C 1 h. The primers used for the creation of the respective mutants are listed in Supplementary Table S3. The primers contain the triplet for the respective encoding amino acid residue and additional a silent point mutation to delete a restriction site close to the exchanged amino acid residue. Successful construction of the two variants was confirmed by sequencing.

2.6. Expression and Purification of -Glt20 Variants

The best results for production of high amounts of soluble Glt-proteins were obtained by expression them as fusion with the maltose binding protein (MBP). In order to facilitate purification of the recombinant Glt-proteins the sequence of a cleavage site (smt3) for the Ulp-protease was introduced between the MBP- and Glt sequence and further a His6- tag was added at the C-terminal end of the protein. After expression of the fusion gene constructs in E. coli the proteins were purified via IMAC. E. coli JM109 harboring pHWG1106 and the two newly constructed variant plasmids, designated pLB101 and pLB102, containing the glt20:E120Q and the glt20:E209Q mutant genes, respectively, were cultivated in LB medium (200 mL) containing 100 µg/mL ampicillin. For gene expression, the cultures were grown at 37 °C until cell density reached an OD600 of 0.3, and were then induced by adding of 0.1% rhamnose and further grown for 4 h at 30 °C. The cells were harvested by centrifugation at 4500× g for 20 min at 4 °C, washed, resuspended in 10 mM potassium phosphate buffer pH 6.5 and disrupted by passing them twice through a French press. After centrifugation (13,000× g for 15 min at 4 °C), the supernatants of the crude cell extracts were subjected to purification of the MalE-Glt20-His6 protein variants by immobilized metal ion affinity chromatography (IMAC). For this, 25 mg E. coli protein was applied onto a 2 mL Talon® metal affinity resin (Clontech, Mountain View, CA, USA) in a column using gravity flow. The resin was washed with 10 mL of washing buffer (50 mM potassium phosphate, 300 mM NaCl, 5 mM imidazole pH 7.0). Bound protein was eluted with 3 mL of elution buffer (50 mM potassium phosphate, 300 mM NaCl, 150 mM imidazole pH 7.0. Fractions containing the respective His6-tagged MBP-Glt-fusion protein were combined and stored in elution buffer at 4 °C and was used for activity analysis. Subsequently, the MalE domain was separated from the Glt20 domain and its mutant derivatives by proteolytic cleavage using specific Ulp1 protease as previously described [29]. After proteolytic cleavage the products were purified via IMAC to remove protease and tags and the eluted Glt-His6 was used to confirm the identity of the Glt and was verified by SDS-PAGE [30], using 12% gels and Coomassie Brilliant Blue R250 staining (data not shown).

2.7. Activity Assay, and Visualization by Thin Layer Chromatography (TLC)

The activity of MalE-Glt20 fusion protein and its catalytic residue mutants (E120Q and E209Q) was assayed using laminarioligosaccharides with a degree of polymerization (DP) of 6 (Lam6, Megazyme). The reaction mixtures were prepared by mixing 10 µL of Lam6 (6.25 mg/mL), 3 µL of 0.5 M phosphate buffer, pH 6.5, and 21 µL of enzyme sample (supernatant), followed by incubation at 30 °C for 24 h. The reaction was stopped by heating at 100 °C, 5 min.
Reaction products (2 µL) were spotted on TLC sheets (Silica 60 F254, Merck Co., Darmstadt, Germany) which were developed with a mixture of butanol/acetic acid/H2O (2:1:1). After 4 h, the developed plate was dried, and the bands were visualized via dipping using orcinol/sulfuric acid staining, followed by heating at 100 °C for 5 min.

2.8. Ligand Modeling

The structure of a laminaripentaose ligand (β-d-Glcp-(1,3)-β-d-Gclp-(1-3)-β-d-Glcp-β-(1,3)-β-d-Gclp-(1-3)-β-d-Glcp) was prepared by MD. Initial atomic coordinates were generated in vacuo, using the oligosaccharide-building tool of YASARA v15.10.18. In the next step, the ligand structure was solvated with explicit molecules of water, Na+ and Cl at 0.9% in a simulation cell, 20 Å larger than the oligosaccharide molecule. The system was heated to 290 °K for 2 ns. The AMBER03 force field was used for the simulation. The RMSD of the atomic coordinates of the atoms (excluding H-atoms) and the energy were monitored by analyzing snapshots every 25 ps. The most stable conformer (lowest force field energy) was selected for docking studies.

2.9. Docking

The refined models of Glt1, Glt3 and Glt20 were used for docking with laminaripentaose ligand (prepared as described above). The oligosaccharide ligand was manually placed in the catalytic cleft of the respective model in a similar orientation as the co-crystallized ligands in RmBgt17A, and some dihedral angles of the laminaripentaose were adjusted to fit the conformations of co-crystallized laminaritriose and laminaribiose in structures 4WTR and 4WTS [14].
A laminarihexaose ligand was also designed by adding an additional glucose residue, in a proper conformation, in the non-reducing end of the laminaripentaose in the complexes in Glt1, Glt3 and Glt20. Finally, local docking was carried out with the AutoDock method [31] implemented in YASARA. Illustrations of protein–ligand interactions were elaborated with Chimera v1.10.1 [27].

3. Results and Discussion

3.1. Homology Modeling and Overall Structure

The catalytic domains of the GH17 bacterial transglycosylases from P. aeruginosa (Glt1), P. putida (Glt3) and B. diazoefficiens (Glt20) share relatively high sequence similarity with each other (especially the two Pseudomonas enzymes, Figure 1) but have low sequence homology with enzymes of known 3D-structure in GH17. The closest structure-determined homologue, and thus far only structure-determined tranglycosylase in GH17 originates from the fungus R. miehei (RmBgt17A) [14]. This enzyme shares 24–27% sequence identity (50–51% related residues) with the bacterial enzymes and has a query sequence coverage of 90–91% with any of the three bacterial sequences investigated here (Figure 1).
To obtain structural data, despite the relatively low identity, hybrid modeling was used, including crystallographic structures of several proteins for modeling some fragments of the structures (detailed in Supplementary Table S2). This, together with molecular dynamics refinement, resulted in acceptable models according to several protein-structure validation approaches, including Ramachandran analysis (Table 1) and Z-scores (Table 2). Ramachandran diagram analysis of the respective model showed that most amino acids were in the preferred regions (more than 95%) and allowed regions (up to 3.9%), while less than 1.1% of the amino acids were outliers (Table 1). The Z-scores of the models were, for all of three transglycosylases, in the acceptable distribution range and comparable with the Z-score for the crystal structure of RmBgt17A (Table 2), which was used as the main template.
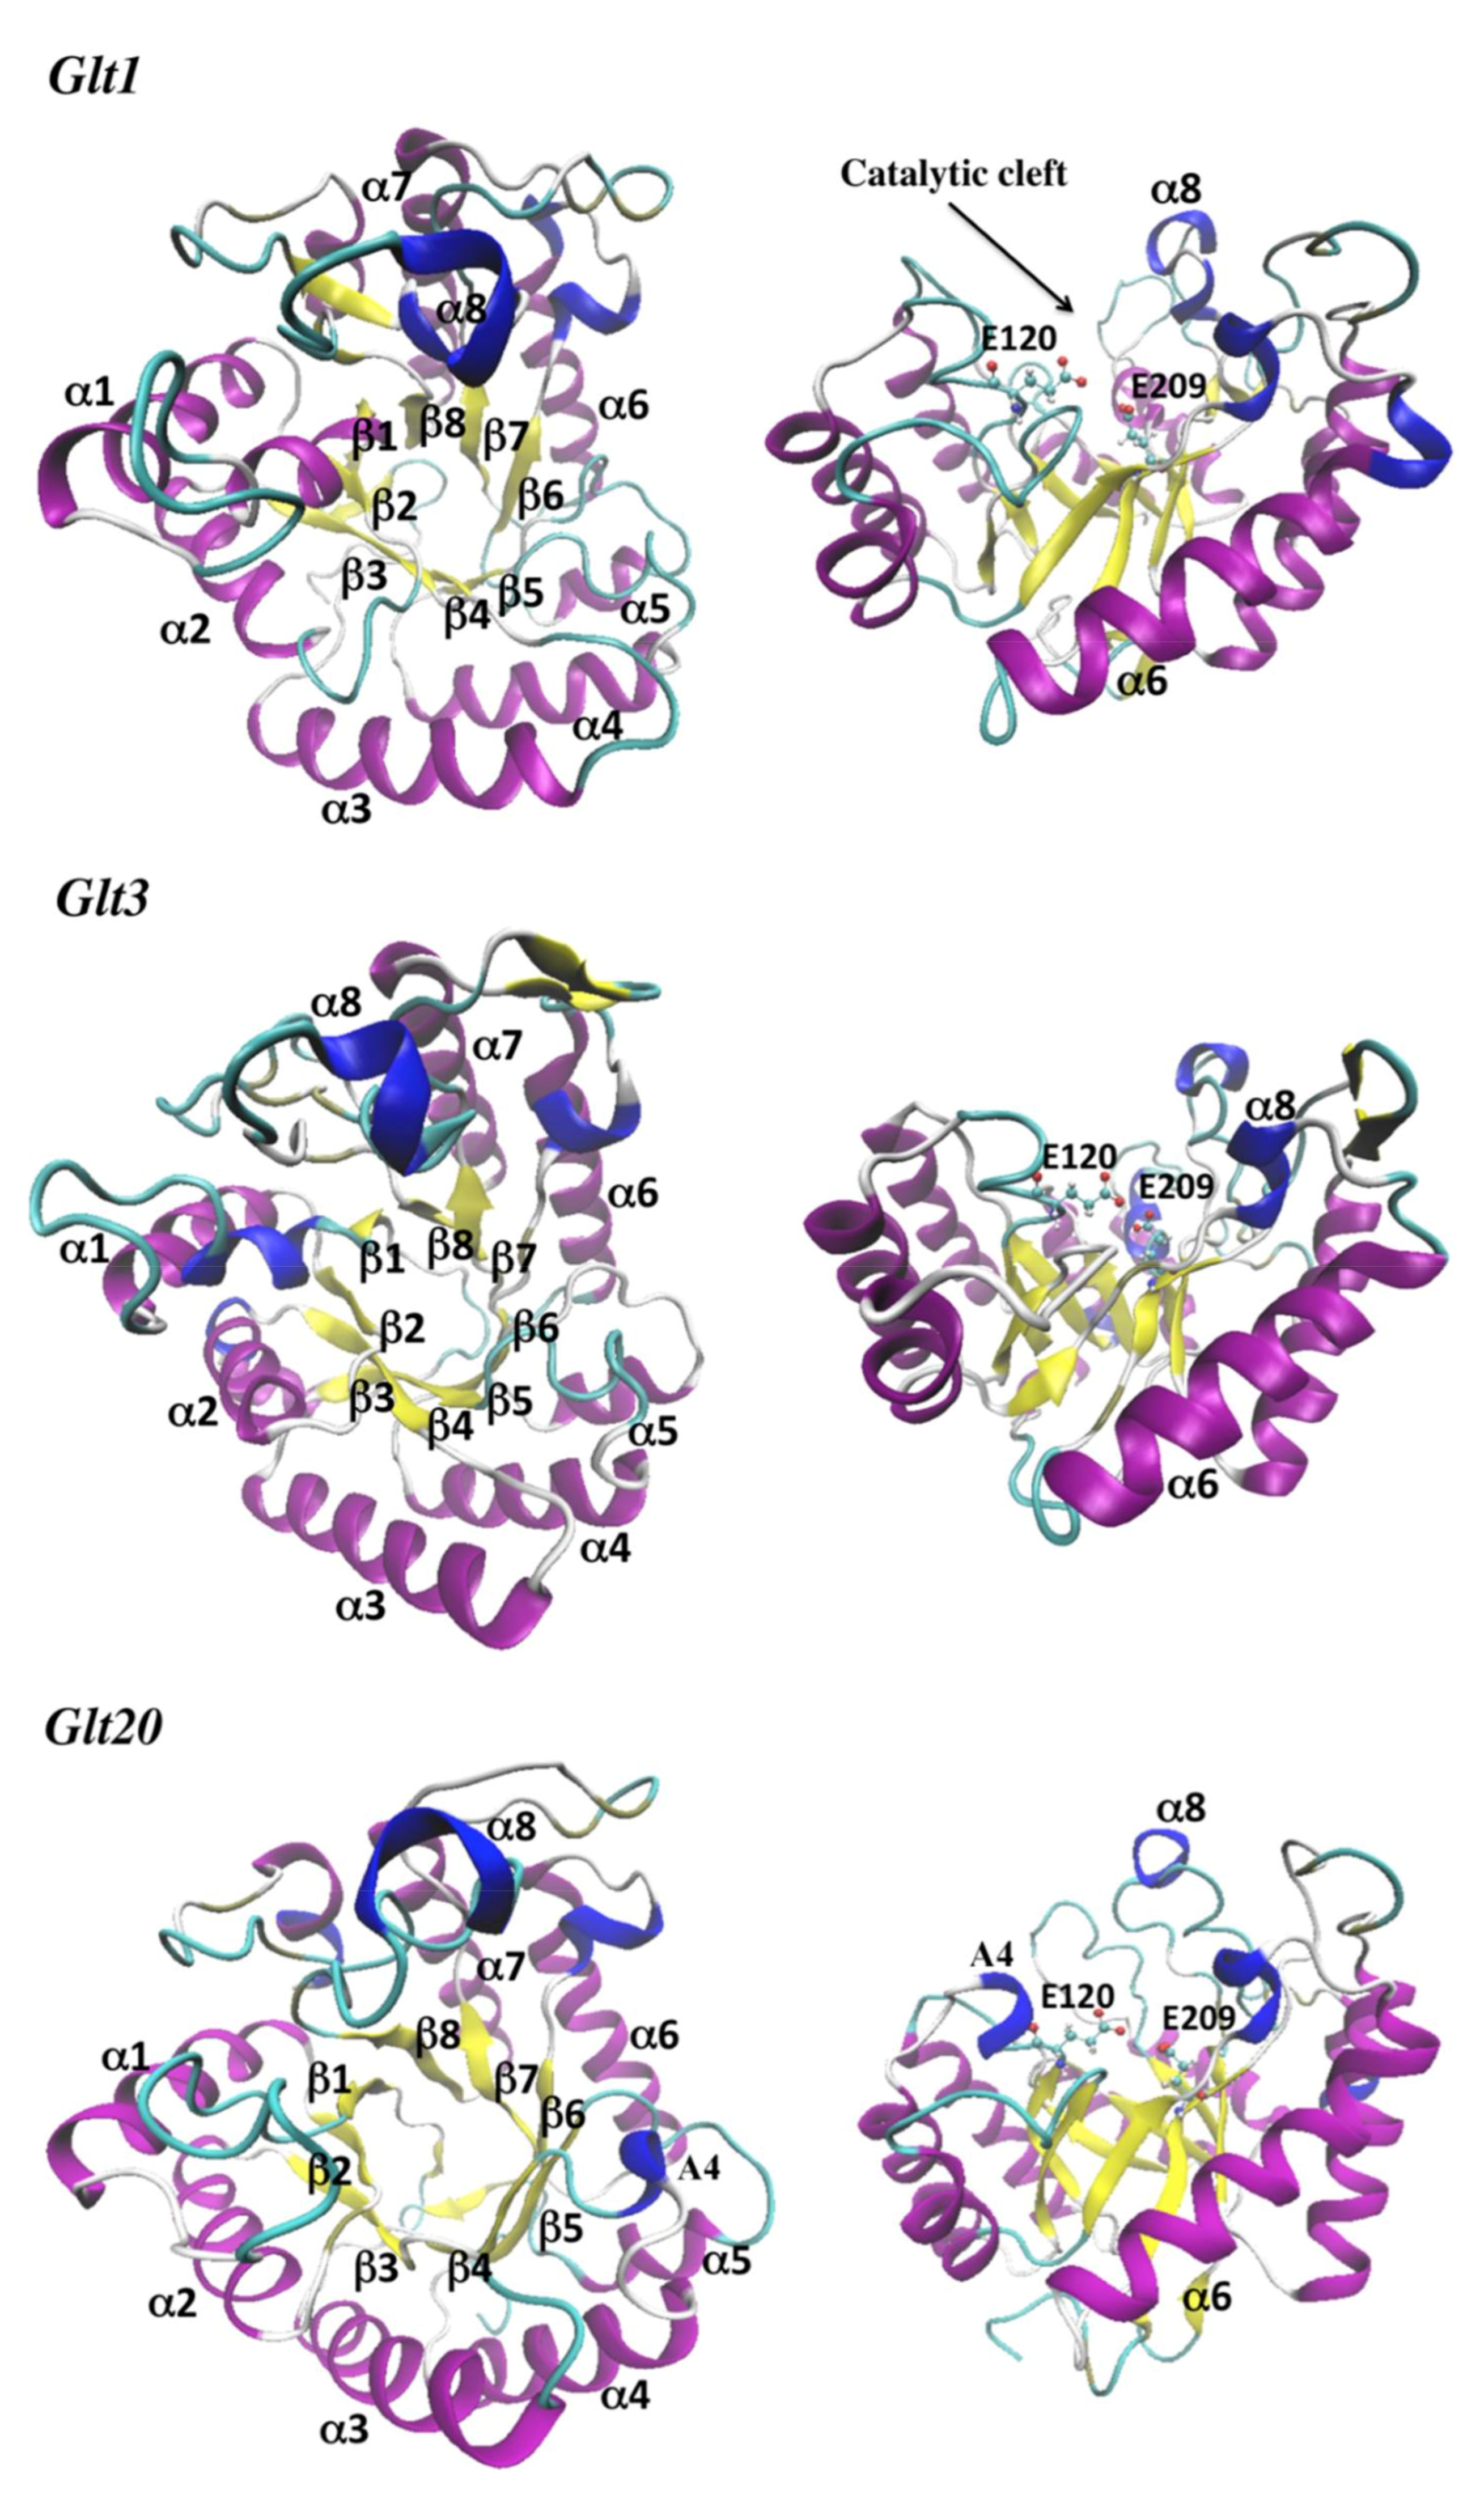
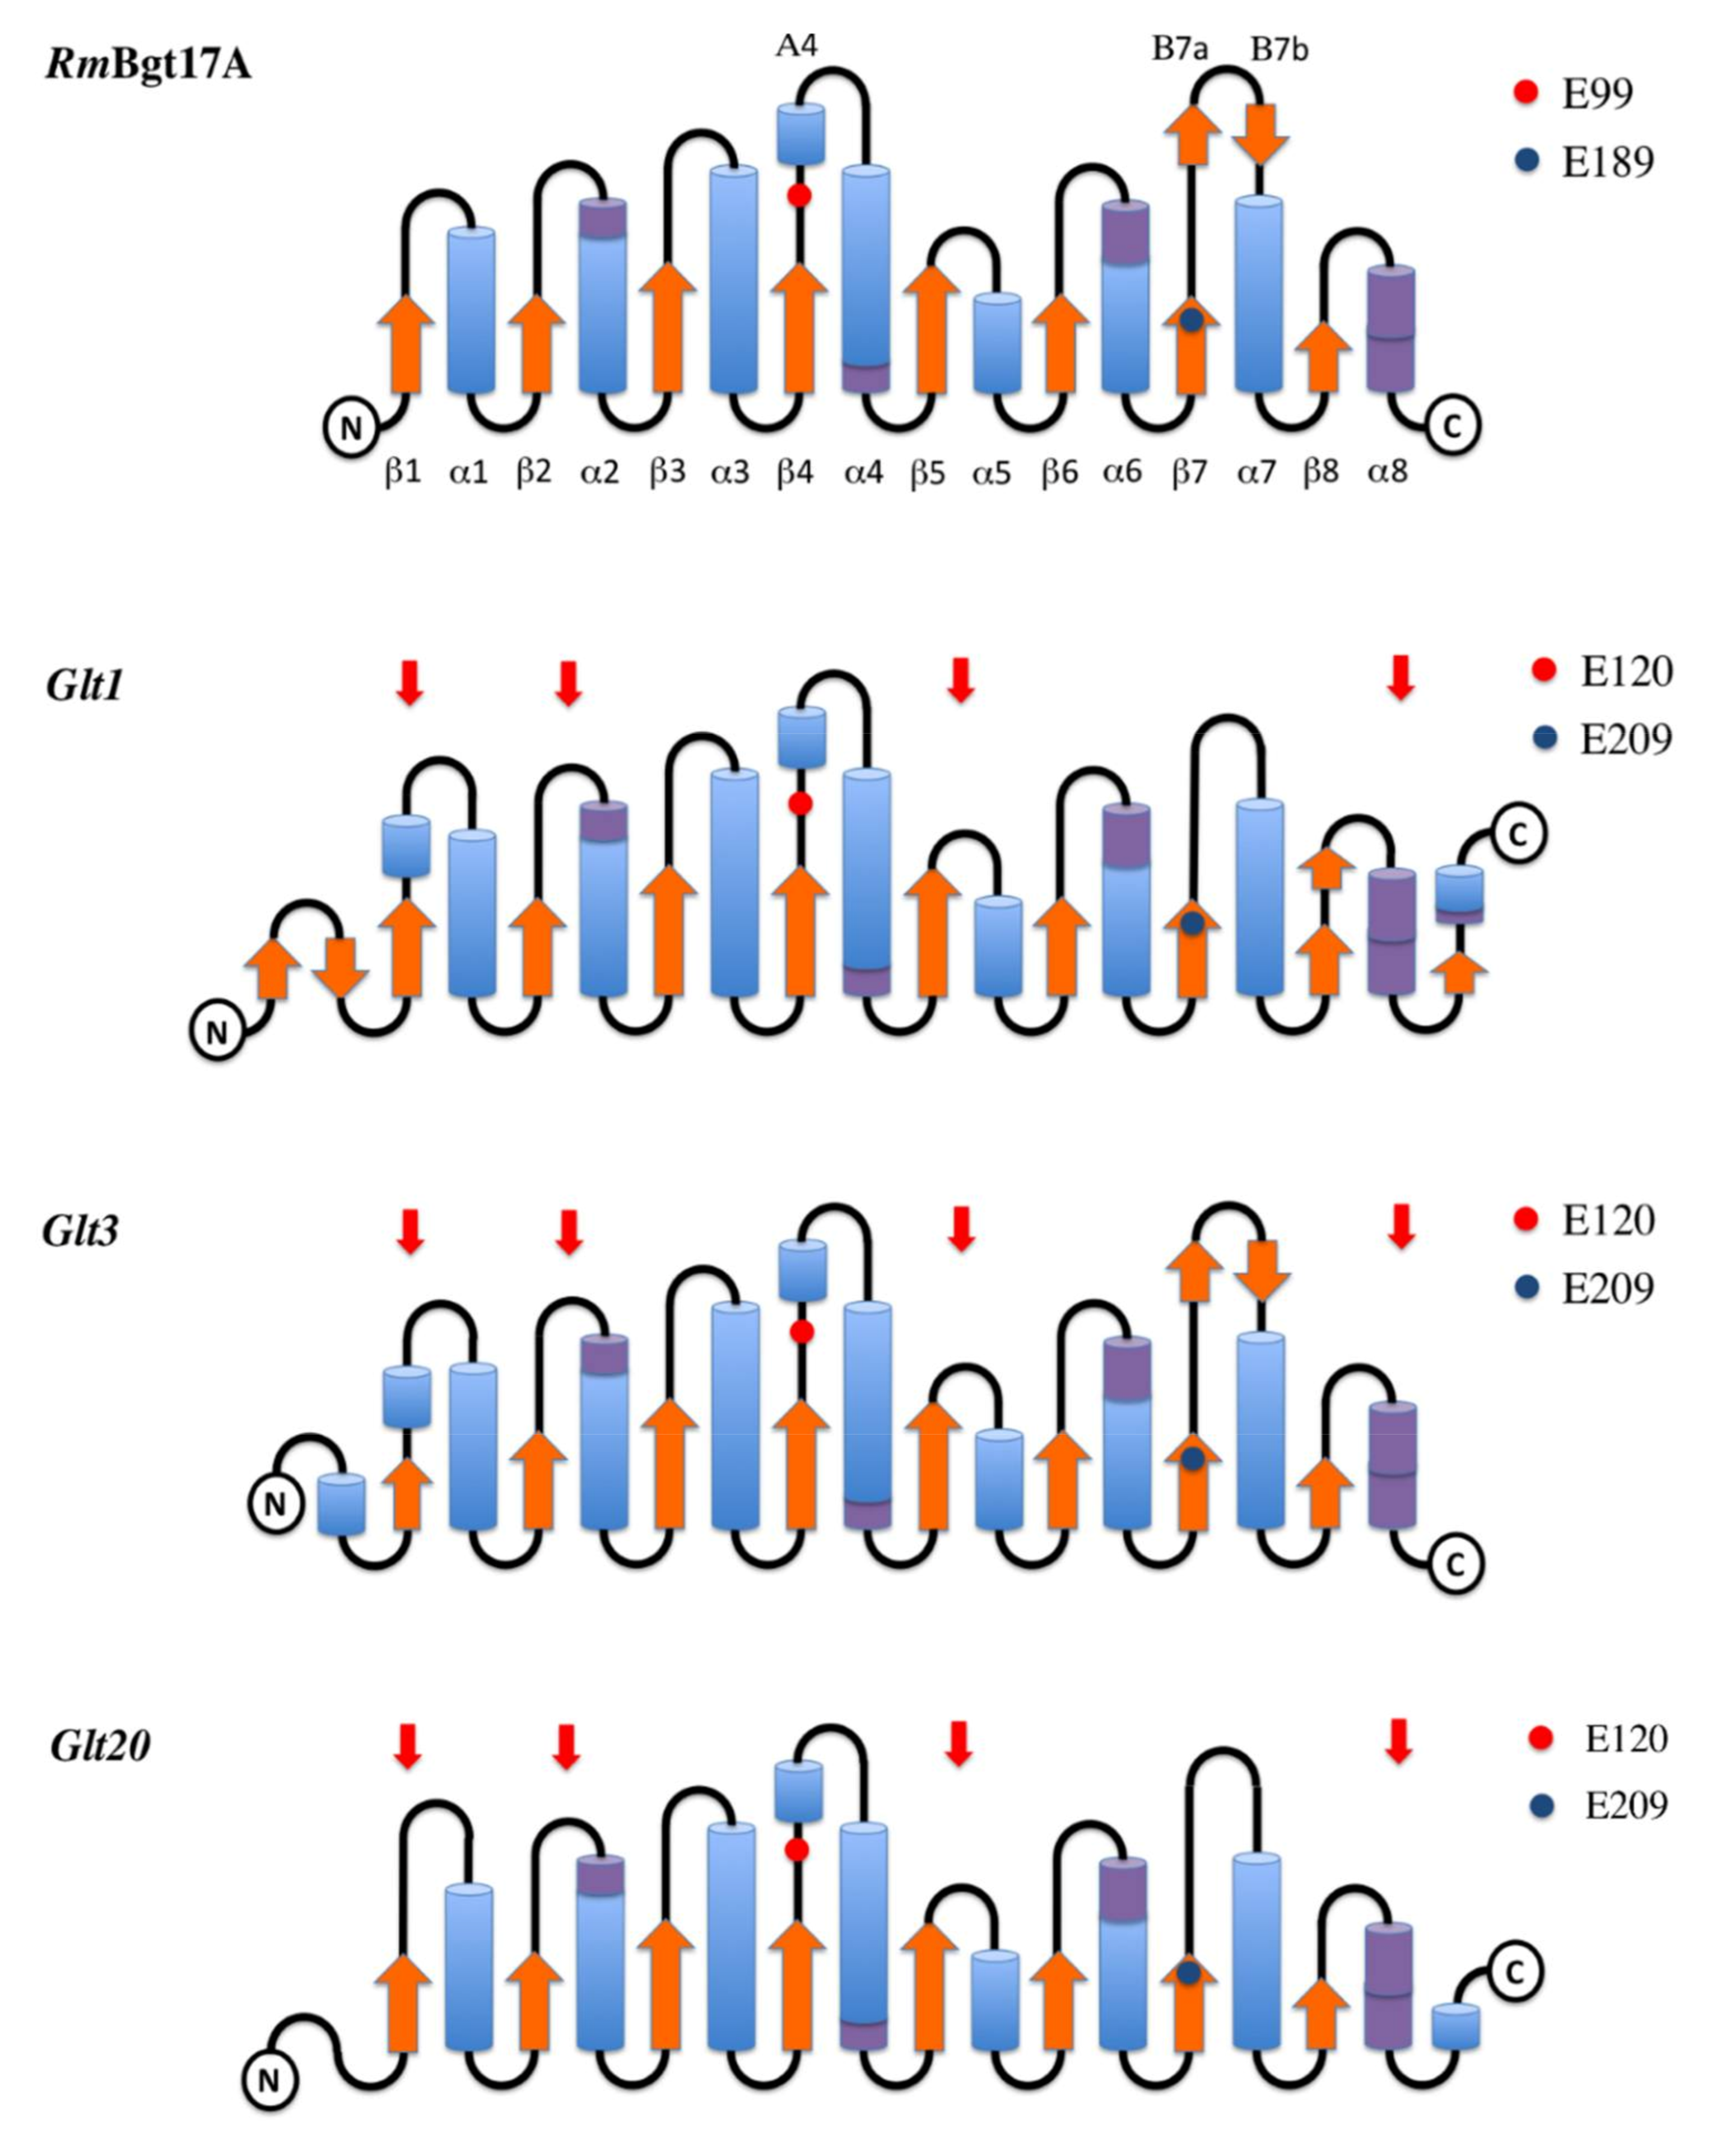
All enzymes displayed the classical (α/β)8 TIM-barrel fold typical for GH17-enzymes and related glycoside hydrolase families classified under clan A (Figure 2). The main differences between the three bacterial enzymes were found in loops surrounding the catalytic cleft. These loops differed in conformation and length (see below for more details). Additional secondary structure elements (short β-strands and/or short α-helices) not present in the crystallographic structure of RmBgt17A, were also found close to the N- and/or C-termini of the amino acid sequences of the catalytic modules (Figure 3). The only non-conserved secondary structure element positioned in the catalytic cleft, was an additional α-helix, proposed for Glt1 and Glt3 next to strand β1 (Figure 3).
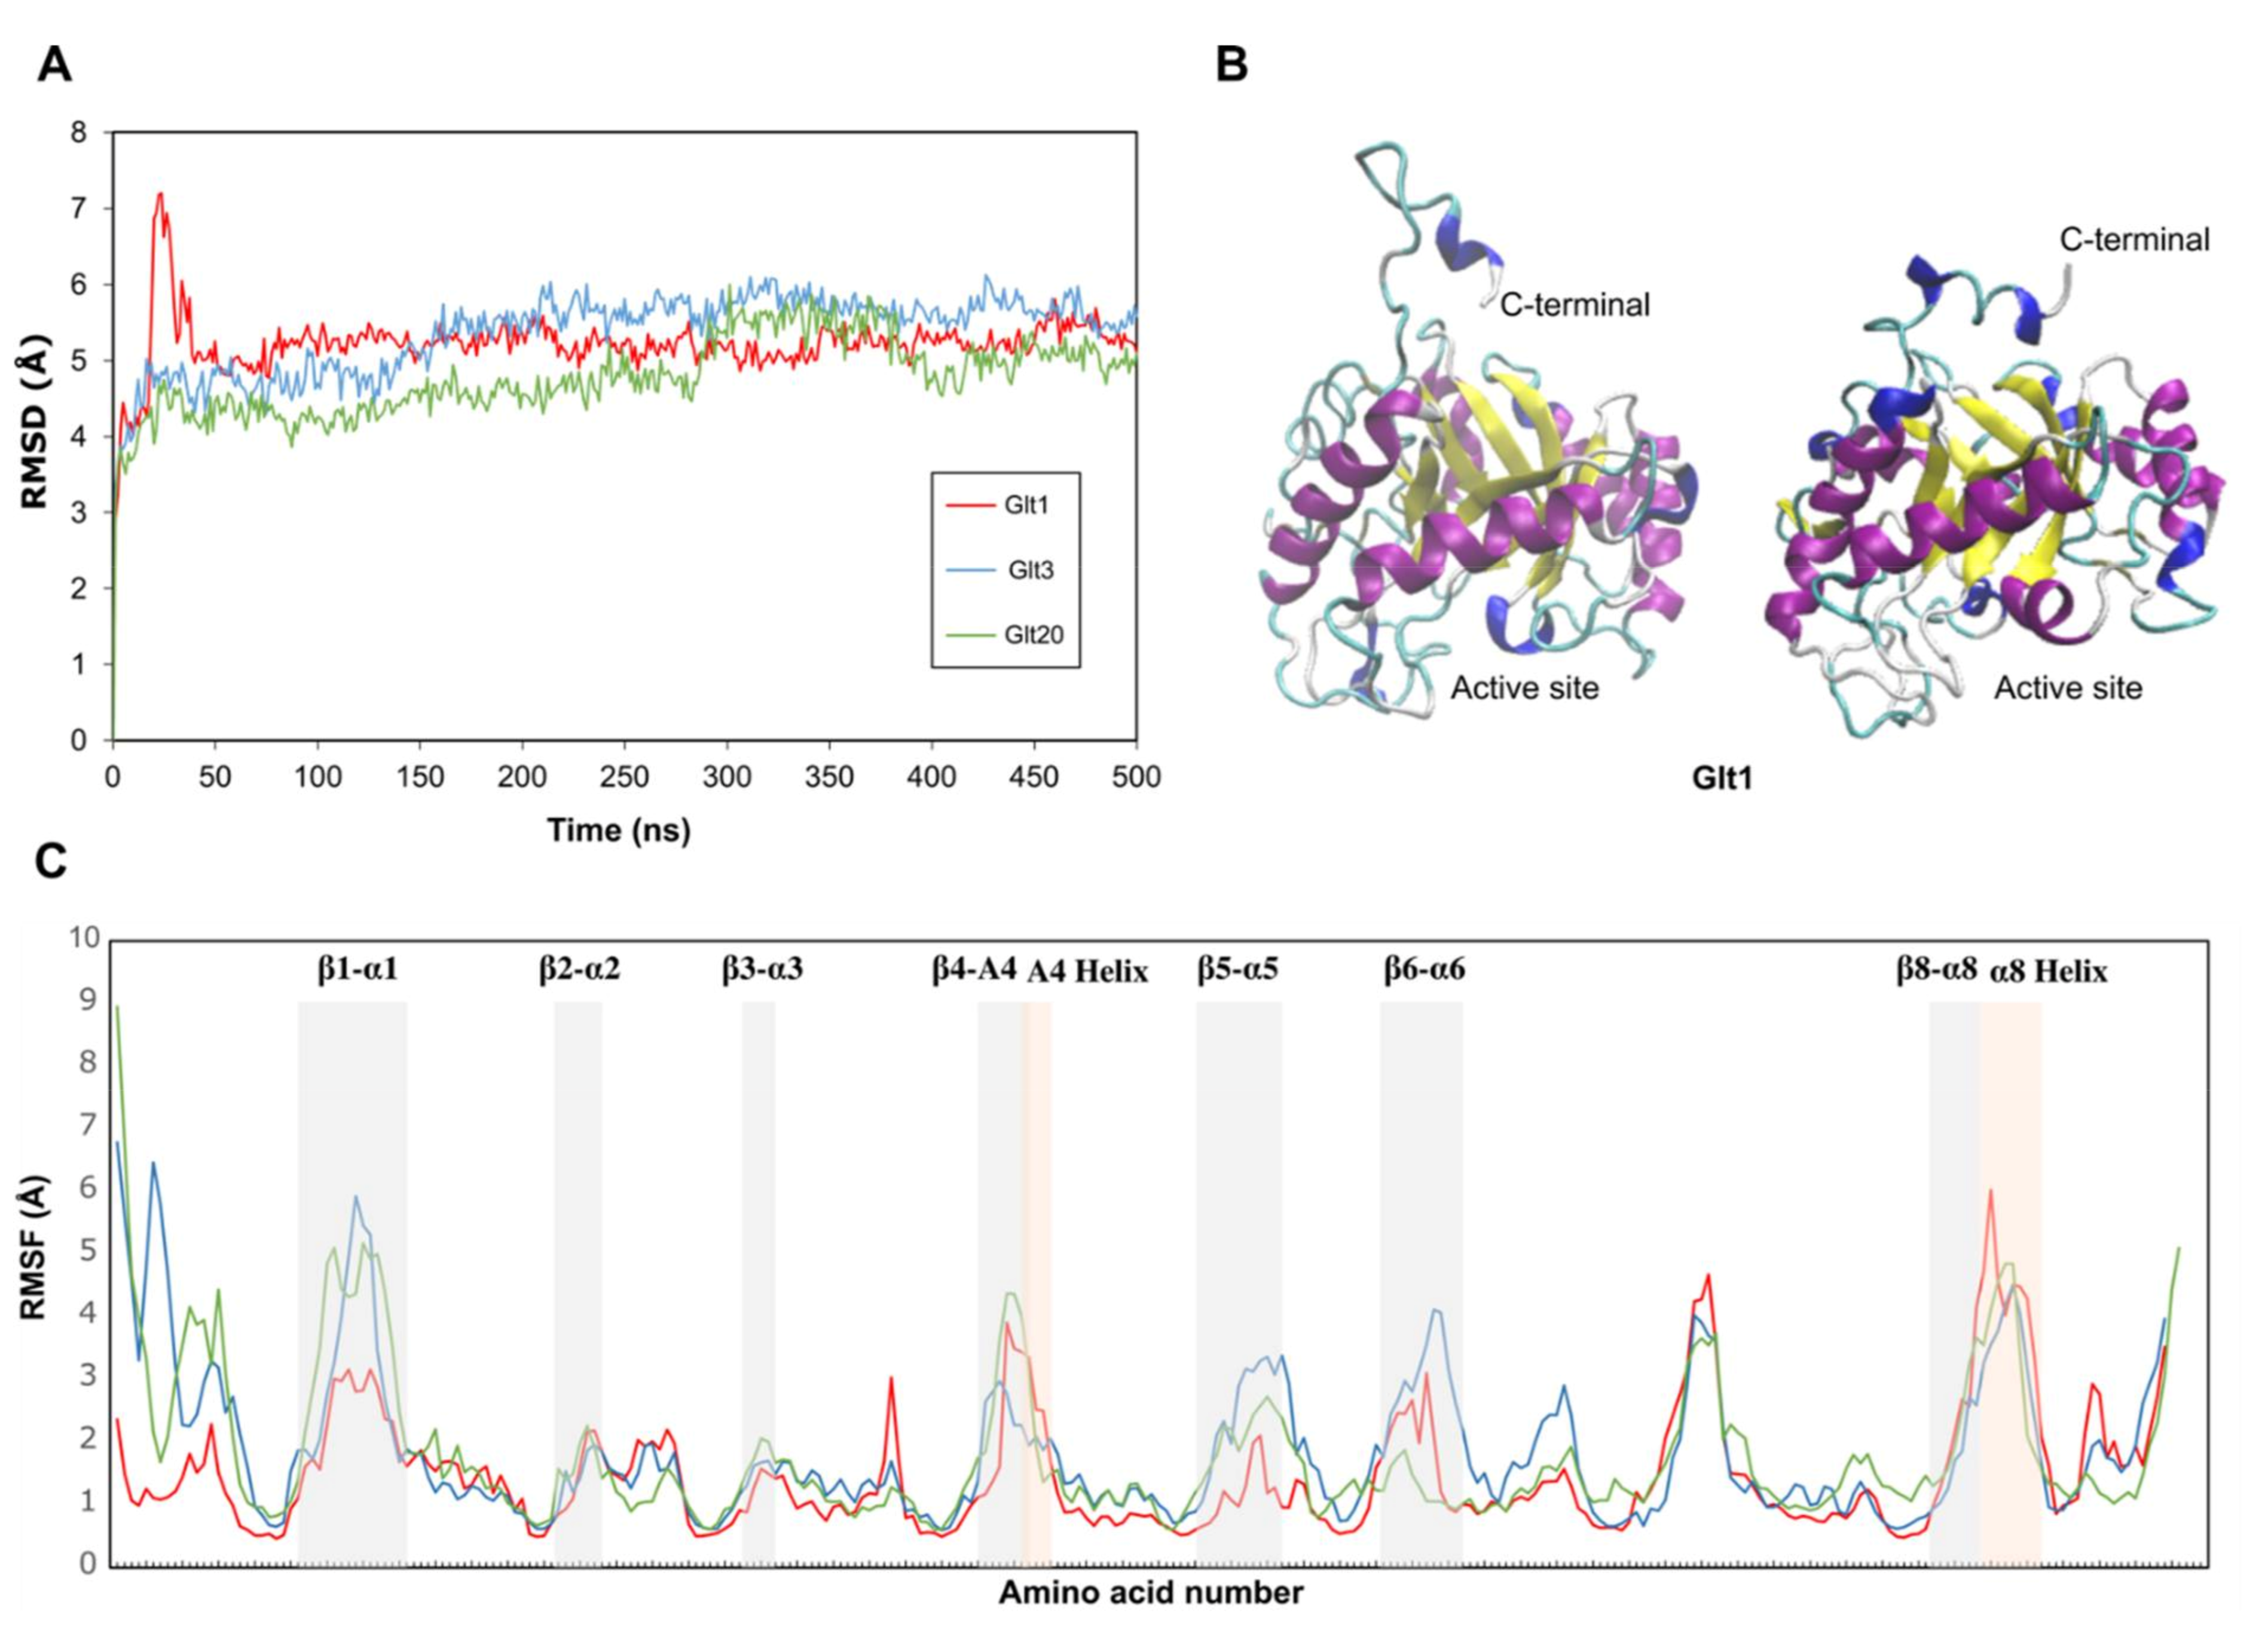
The molecular dynamic simulations at 298 °C with 0.9% NaCl ions for 500 ns, have shown overall conformational variations with an RMSD of alpha carbons between 4 and 6 Å (Figure 4A). The trajectory for Glt1 has a peak from the beginning of the production phase until 38 ns, with a maximum RMSD of 7 Å at 22 ns. This peak corresponds to a significant conformational change in the C-terminal tail, which includes a loop that connects the a8 helix with a short terminal a helix. This region changes from an extended to a contracted form (Figure 4B). After this change, the trajectory evolves without significant variations with an RMSD around 5 Å, with an average structure keeping the C-terminal region in a contracted form. Glt3 and Glt20 do not show significant changes. These models have shown shorter loops in the C-terminal comparing with Glt1 (Figure 3). The RMSF analysis shows high peaks of fluctuations in the amino acids located in all the loops, including the A4 and α8 helixes, that surround the active site (Figure 4C). The highest fluctuations correspond to the loops β1-α1 and β8-α8 and α8 helix.
The RMSF analysis also shows differences between the enzymes. Glt3 and Glt20 have higher flexibility in β1-α1, as well as in β5-α5, in comparison to Glt1, whereas Glt1 and Glt3 have higher flexibility in β6-α6 than Glt20. It is worth noticing that no correlation between sequence similarity and loop fluctuations was found. For example, β1-α1 shows higher flexibility in Glt3 and Glt120. However, the sequence identity is higher 62.5% between Glt1 and Glt3, while 25% between Glt1 and Glt20. A similar situation occurs for loops β5-α5 and β6-α6. Comparison of the modeled structures before molecular dynamic (MD) simulation and the average structure obtained after MD suggests that interactions with surrounding loops can affect the different fluctuations observed in β1-α1, β5-α5, and β6-α6.

3.2. Catalytic Cleft and Sub Site Predictions

The catalytic cleft is constituted by seven loops (β1-α1, β2-α2, β3-α3, β4-A4, β5-α5, β6-α6, and β8-α8) and the α-helices 4 and 8, situated on opposite sides of the active site (Figure 2), at the C-terminal side of the β-strand with the same number (Figure 3).
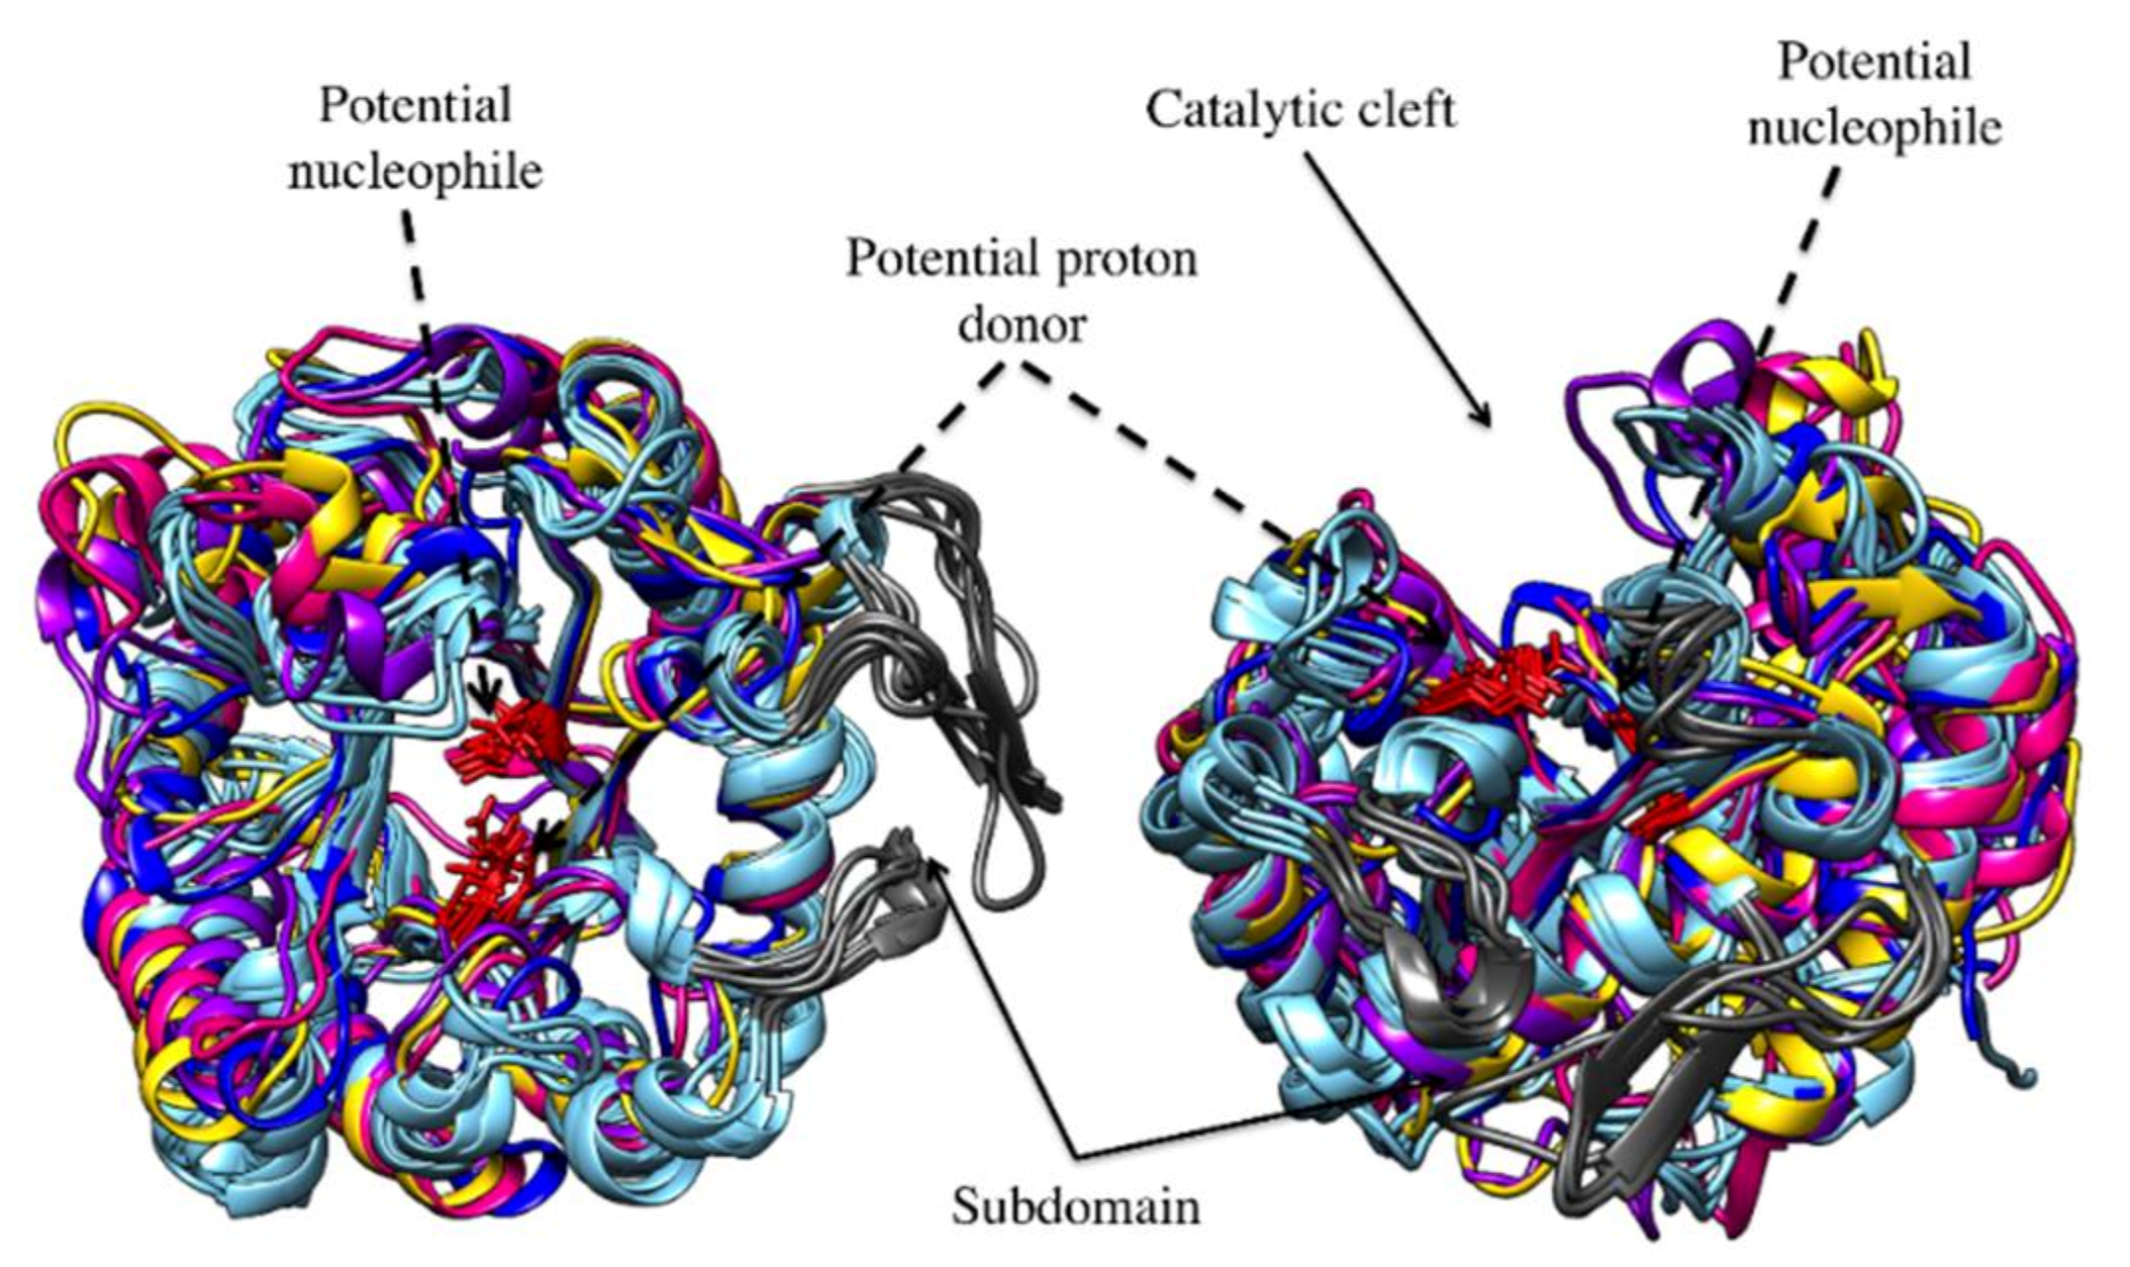
Superimposition of the modeled structures with crystal structures available from GH17 (Table 3), showed that the position of the catalytic residues was conserved in the structures and situated in loop β4-A4 (proton donor) and in the C-terminus of β7 (nucleophile) (Figure 3 and Figure 5). The putative catalytic residues of the proteobacterial transglycosylases are situated at positions corresponding to those of previously identified catalytic residues in crystallized enzymes in GH17 (including both the fungal R. miehi transglycosylase (RmBgt17A) and several endoglucanases from plants). Identification of the residues was strengthened by mutagenesis in Glt20 where the single mutation in the respective putative catalytic residue: MalE-Glt20:E120Q and MalE-Glt20:E209Q (expressed to the same level as the wt (MalE-Glt20) in E. coli) resulted in loss of detectable activity (Supplementary Figure S1), supporting their role in catalysis.
With the exception of RmBgt17A, all crystallized enzymes in GH17 are endo-β-glucanases from plants. The endoglucanases have a higher number of subsites than the fungal transglycosylase and the currently investigated bacterial transglycosylases. The fungal enzyme RmBgt17A has 5 subsites (−3. −2, −1, +1 and +2), in close accordance with the subsites in the bacterial transglycosylases investigated here, for which the catalytic clefts include 6 putative subsites (−4, −3, −2, −1, +1 and +2), while the endo-β-glucanases can have up to 8 subsites (−3. −2, −1, +1, +2, +3, +4 and +5). An additional subdomain (Figure 5) around the α6-helix at the end of the catalytic cleft could be the reason for the extended number of “aglycone” subsites in the endo-β-glucanases [14,32].
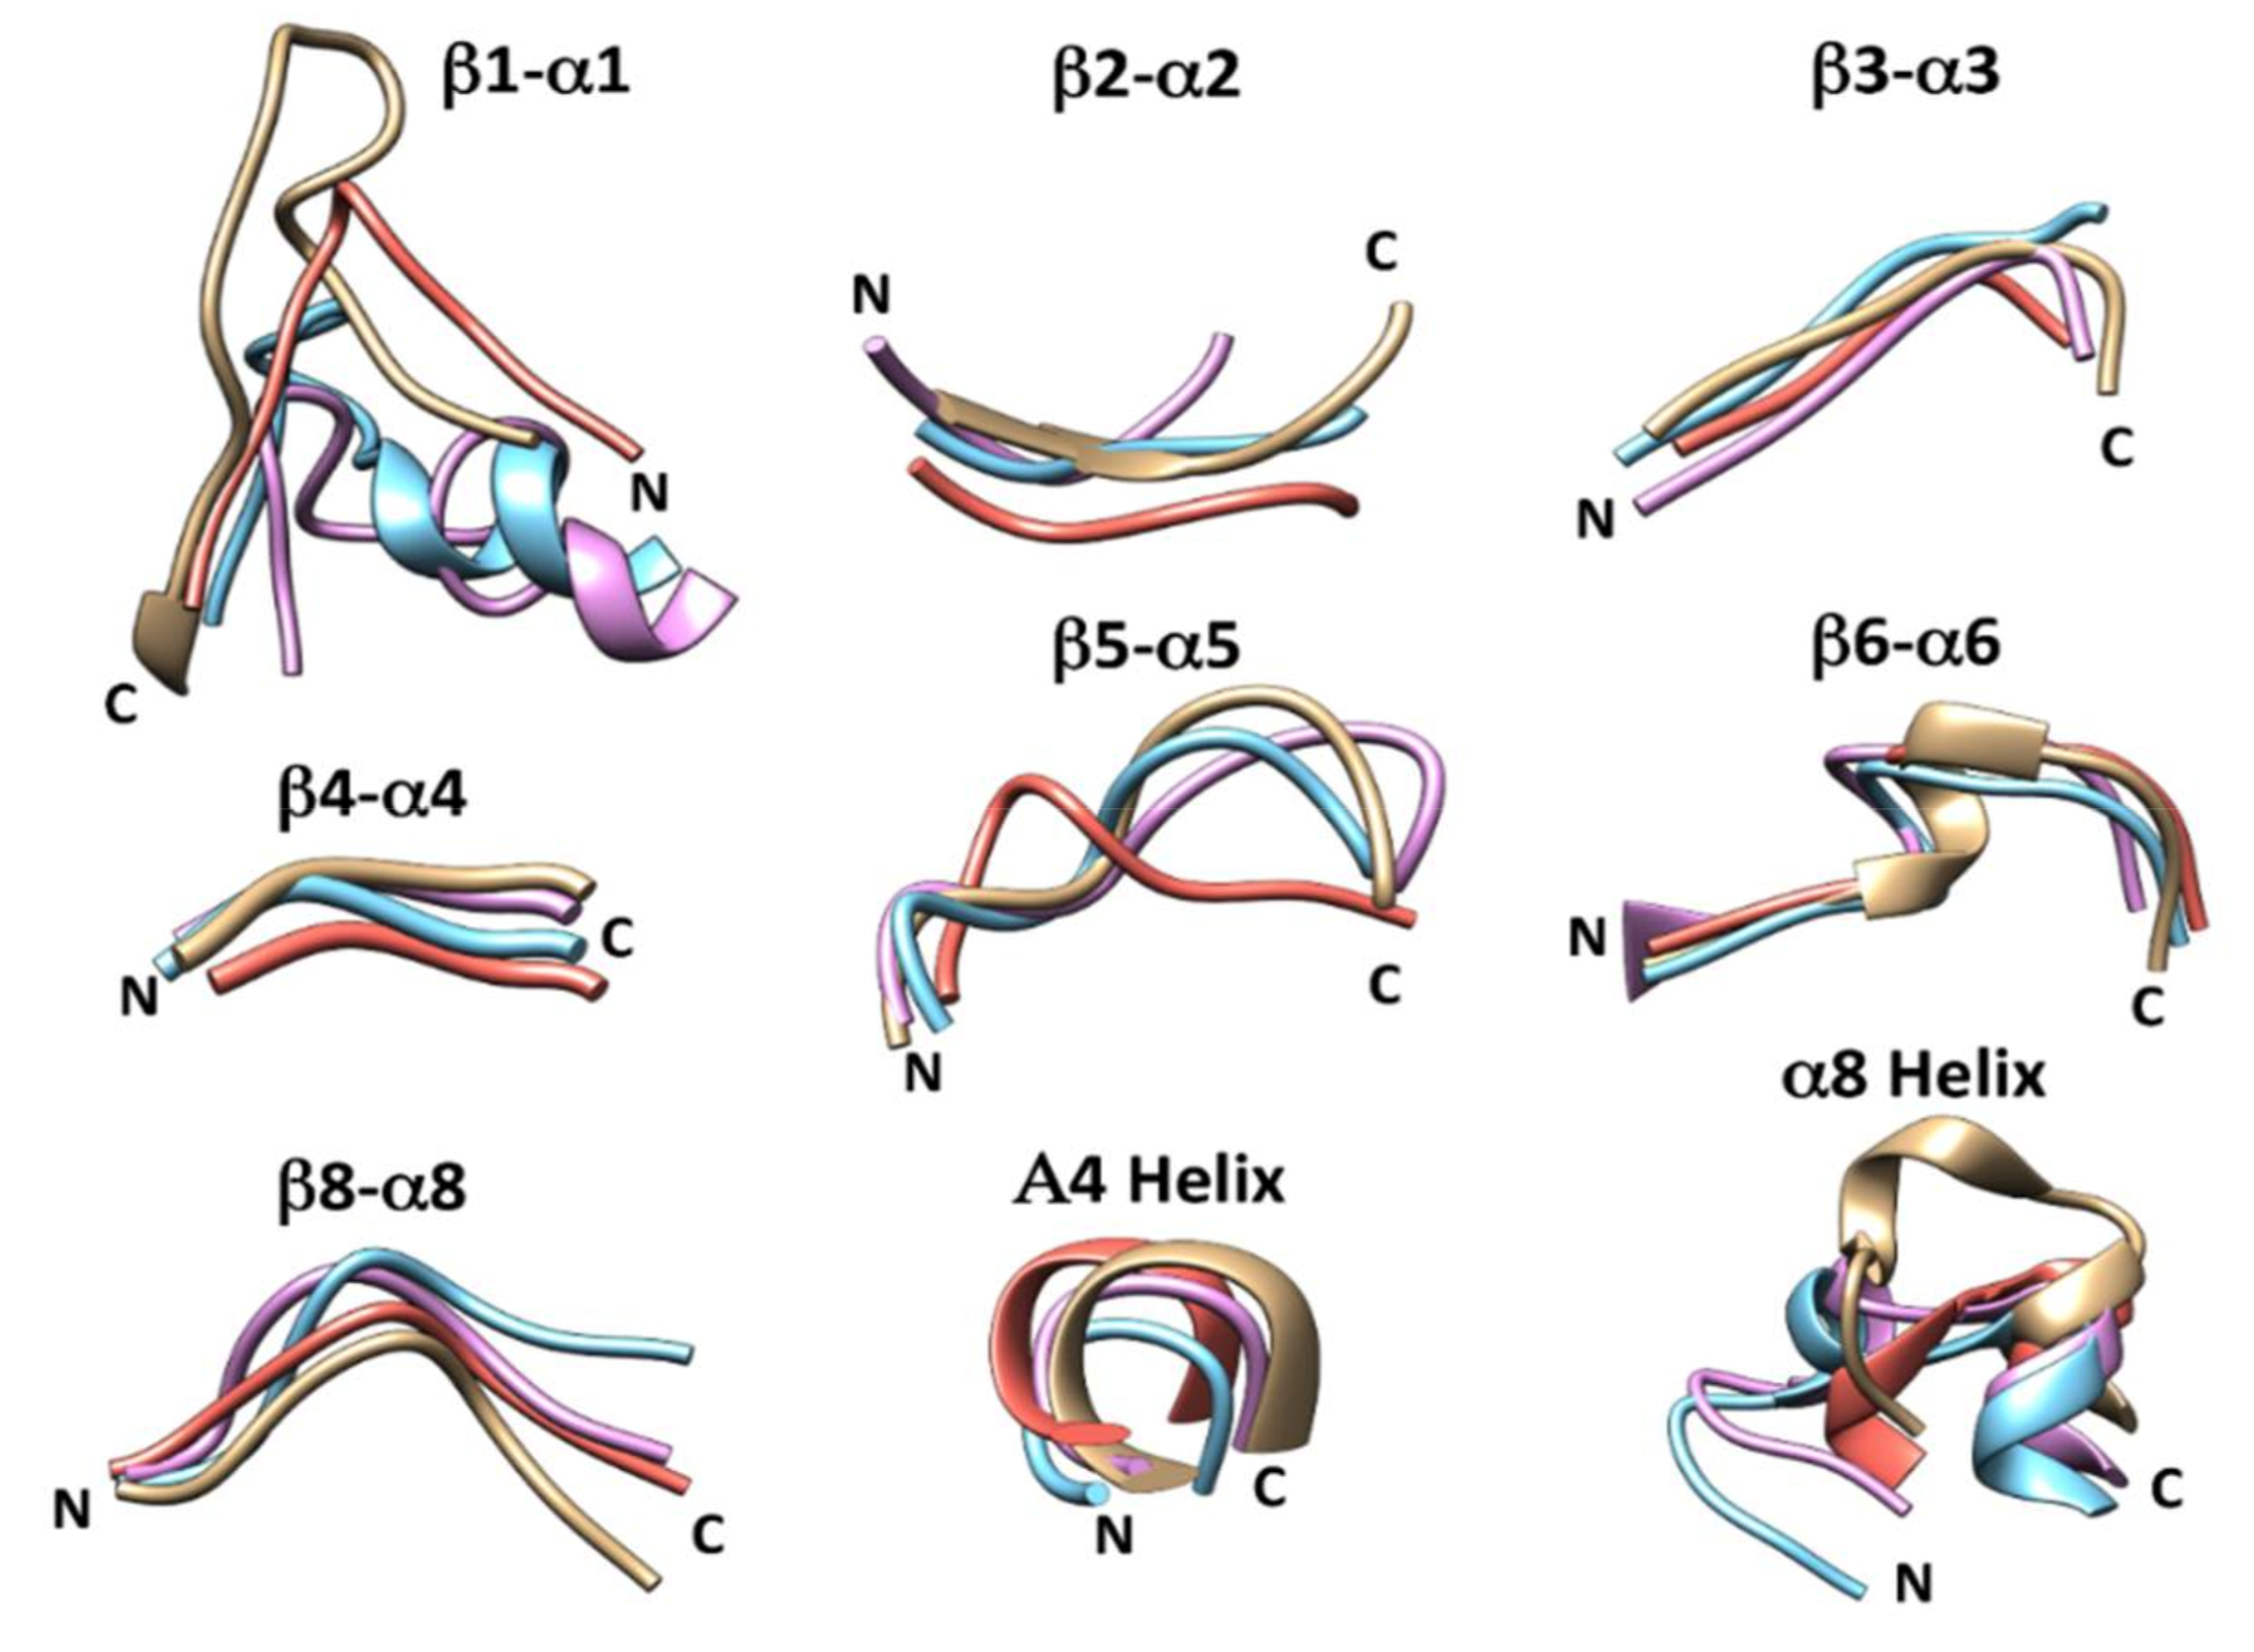
The lengths and conformation of all the loops involved in the catalytic cleft in the bacterial transglycosylases were compared with the crystallographic structure of RmBgt17A (Figure 6 and Table 4). Subsite +2 is surrounded by the loops β5-α5 and β6-α6, subsite +1 by β4-A4 and the A4 helix, the −2 and −1 subsites are surrounded by the β8-α8 loop and the α8 helix while subsite −3 is influenced by the loops β1-α1, β2-α2 and β3-α3. The bacterial transglycosylases also host an additional “glycone” or donor subsite (−4), compared to their fungal counterpart. In Glt1, a putative subsite −4 could be constituted by the loop β1-α1, β2-α2 and Arg101 in the α3-helix. In Glt3, a putative subsite −4 could be constituted by Arg94 and Arg97 in the α3-helix, but in this case, the Arg-residues are situated 2.9 and 3.8 Å, respectively, from the OH- groups of the sugars, which may not be close enough for the interaction. The putative subsite −4 is clearest in Glt20 due to the shape of the cleft and presence of potential hydrogen bonding residues, which are situated in the loops β1-α1, β2-α2 and the Arg94 in the α3-helix (Figure 7).
The main conformational changes between the enzymes are found in the loops located at the end of the catalytic cleft, corresponding to β1-α1 involved in the putative subsite −4. The different conformation of loop β1-α1 in Glt1 and Glt3, compared to Glt20, may be one reason for observed differences in substrate binding, as subsite −4 binds the terminal residue in the non-reducing end of the donor, while in Glt20, the substrate can extend beyond this binding site. The residues involved in the two disulphide bonds (Cys15-Cys43 and Cys218-Cys264) found in the RmBgt17A structure [14], and conserved in other fungal transglycosylases [14], are not present in the proteobacterial enzymes studied in the present work. Particularly interesting is the Cys15-Cys43 disulphide bond, which could affect the flexibility of the loops β1-α1 and β2-α2. According to the models, both loops are important to determine the interactions in the putative subsite −4 in Glt1, Glt3 and Glt20. In subsite −3, only the Trp65 is conserved (Trp87 in Glt1, Glt3and Glt20).
In the other end, the +1 and +2 subsites are surrounded by loops more similar both in conformations and length (Figure 6 and Table 4), and some amino acids involved in the ligand interactions are conserved compared with RmBgt17A, including Trp157 (177 in Glt1, Glt3and Glt20) and Glu158 (178 in Glt1, Glt3 and Glt20). The conserved residues Trp157, E158 of RmBgt17A, have been subjected to mutagenesis (along with the less conserved residue Tyr102, R. miehi numbering) [33]. This work showed that E158, which is also conserved in all the bacterial transglycosylases (Figure 7) was important and its removal increased hydrolytic activity [33].
The α8-helix adopts different conformations in every protein studied (Figure 2 and Figure 7). Molecular dynamic simulations have shown that this α8-helix undergoes important conformational changes and as this secondary element is situated close to the −1 and +1 subsites, it could influence the catalytic mechanism (including the possibility of obtaining branched products in Glt20, see also below).

3.3. Ligand Interactions after Docking of Laminaripentaose and Laminarihexaose

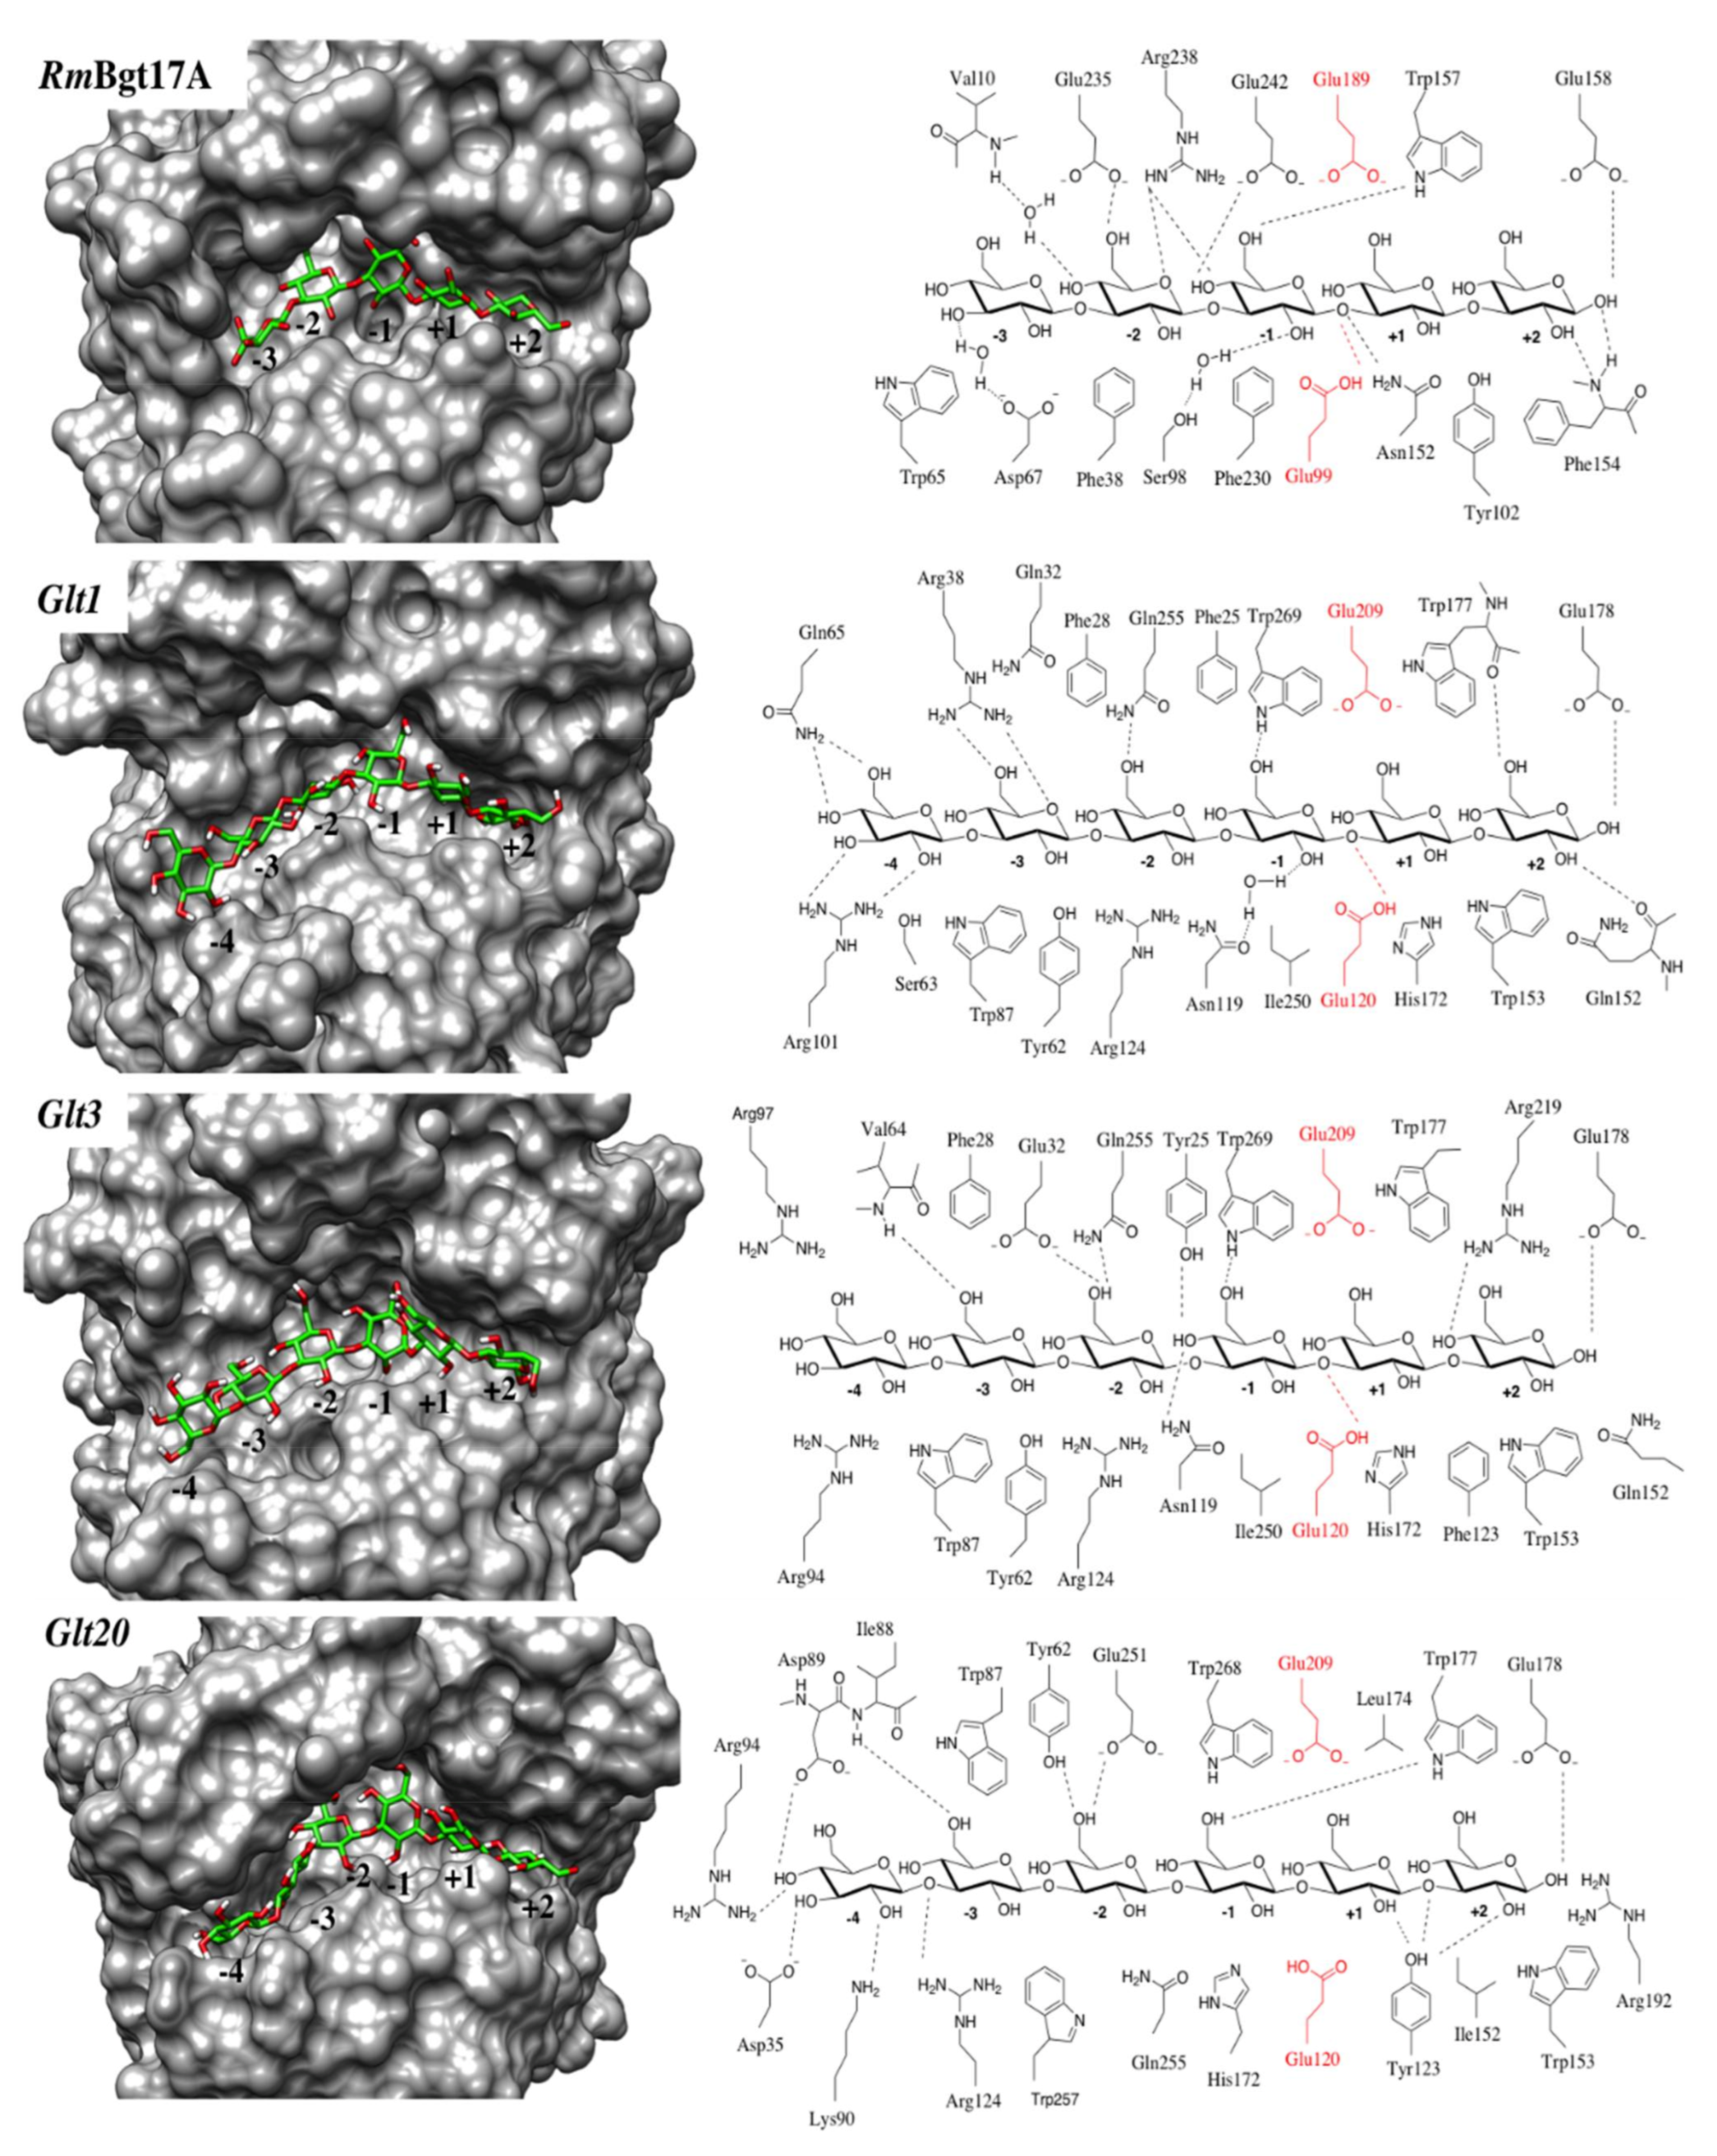
Experimental biochemical studies of β1,3-glucooligosaccharides have shown that RmBgt17A [14] and Glt20 [13] cleave the donor substrate 2 glucose units from the reducing end, releasing a laminaribiose and transferring the rest of the substrate to an acceptor oligosaccharide. In contrast, Glt1and Glt3 transfer laminarioligos of defined length (mainly 3–4 glucose moieties) from the non-reducing end of the substrate to the acceptor oligosaccharide [12]. Despite these differences in product profile, the enzymes are predicted to share most of the amino acids involved in the subsite interactions with the substrates (Figure 7), supporting substrate binding in the same orientation in all enzymes (the reducing end in subsite +2 and non-reducing end in subsite −4). The major cleavage site of Glt1 is at the fourth (β1-3) linkage from the non-reducing end (in accordance with presence of subsite −4 to −1). Glt3 has been shown to cleave the substrate at the third and fourth (β1-3) linkage from the non-reducing end (indicating lower affinity to the −4 subsite). The length of the respective donor experimentally observed for Glt1and Glt3 is thus in accordance with the number of glycone subsites −4 to −1 in Glt1 and Glt3) predicted in the respective enzyme (Figure 7).
To further investigate interacting residues and based on the above subsite-comparison and conformations of laminaritriose (PDB code: 4WTS) and laminaribiose (PDB code: 4WTR) co-crystallized in RmBgt17A [14], the ligand laminaripentaose was placed in the catalytic cleft of the models orientated with the reducing end in the potential subsite +2 and the non-reducing end in the subsite −3. Laminaripentaose MD simulations resulted in the most stable conformer, a structure with an overall shape very close to the crystallographic ligands laminaritetraose and laminaribiose placed together. Only the dihedral angle of the glycosidic bond in the reducing end was rotated 180° to match with the conformation co-crystallized in RmBgt17A of the laminaribiose (PDB 4WTR). After docking calculations, the conformation of the ligand did not change significantly. As the catalytic clefts of Glt1, Glt3 and Glt20 have space for an additional sugar, one glucose residue was added in a putative subsite −4, with a proper conformation and linked to the laminaripentaose by a β-1,3-glycosidic bond. The resulting complexes with laminarihexaose were energetically minimized to determine the putative interactions in subsite −4. It should be noted that the docking simulations performed in the present work do not consider structural water molecules in the catalytic cleft, which could increase the number of hydrogen bonds between ligand and enzyme residues as three water molecules are found in the crystal complexes of RmBgt17A. Due to the absence of these water molecules, some distances between ligand and potential hydrogen bonding amino acids may be relatively long, and these predictions are approximated.
The Glt20 complex is most similar to the RmBgt17A crystallographic complex in terms of interactions with the ligand, since two additional residues, besides Trp65 (87 in Glt20) mentioned in the previous paragraph, Asp67 (Asp89 in Glt20) in subsite −3 and Tyr102 (Tyr123) are conserved and interact with the ligand in a similar way. Other potential interactions are shown in Figure 7.
In Glt1, subsite −4, Gln65 and Arg102 makes two potential hydrogen bonds, each one with the OH-2, OH-3, OH-4 and OH-6 of the non-reducing end glucose of the laminarihexaose. In addition, the hydroxyl group of Ser63 is in the proximity of the sugar residue. In Glt3, Arg94 and Arg97 are in the proximity of the non-reducing end glucose of the laminarihexaose, however the interactions with the sugar via hydrogen bonds is not clear since the interatomic distances of the interacting groups are not close enough, but the addition of water molecules and the dynamic conformations of the loops in this region would favor binding with the ligand in the putative subsite −4.
Different to Glt1 and Glt3, the putative subsite −4 in Glt20 is better defined by the shape of the cleft and the potential hydrogen bond interactions (Figure 7). Asp89 and Arg94 could make hydrogen bonds with the OH-4 of the non-reducing end glucose residue, while Asp35 and Lys90 would interact with the OH-3 and OH-2, respectively.
The relatively high sequence conservation in subsite +1 and +2, in the other end of the cleft, supports binding of the acceptor in a similar orientation in all investigated enzymes, but does not explain the preference of releasing the reducing end disaccharide in RmBgt17A and Glt20. This preference could, however, be regulated by differences in the conformation of the loops surrounding subsites +1 and +2 and perhaps by the conformational changes (observed by MD) of the α8-helix situated on top of the catalytic cleft in subsites −1 and +1 (that could also be important for the branching ability of Glt20, see also below). Release of laminaribiose in Glt20 may thus be promoted by small differences in subsites +1 and +2, where Tyr123 in Glt20 (Tyr102 in RmBgt17A) is replaced by Phe in Glt1, and Glt3. Thus, Glt20 (and RmBgt17A) miss two potential hydrogen bonds between the side chain of the aromatic residue and the hydroxyl groups of the sugar moieties situated in subsites +1 and +2, weakening the interaction with the leaving group (Figure 7).

3.4. Presence of Bound Donor Allows Acceptor Binding to Branching Subsites in Glt20

A deep biochemical characterization of Glt20 showed the enzyme to be an efficient catalyst for transglycosylation when substrates longer than DP4 were used [34]. Studies using laminaripentaose showed that the donor substrate is transferred to the glucose situated in the third position from the non-reducing end of the acceptor substrate with the formation of a β-(1→6) glycosidic bond. Moreover, a branching point was created, predominantly 2 residues from the formed β-(1→6) glycosidic bond, between the reducing end of the donor and third moiety of the acceptor from the non-reducing end [34]. The structural implications of the experimental evidence were studied by molecular modeling of complexes between Glt20 using laminaripentaose (DP5) as ligand (occupying subsites −3 to +2).
The molecular model shows that amino acids in subsites −3, −2 and −1 are mostly polar, while those in subsites +1 and +2 are mostly hydrophobic. Indeed, the hydrogen bonds predicted between the ligand and enzyme in the Glt20-laminaripentaose complex (Figure 7) are mainly in subsites −3 and −2. Weaker (hydrophobic) enzyme-ligand interactions in subsites +1 and +2 are consistent with release of the reducing end laminaribiose moiety. At the same time, the laminaritriose remains bound to subsites −1, −2 and −3, stabilized by hydrogen bonds. In accordance with experimental data, smaller substrates are disadvantaged, which is consistent with experimental evidence, indicating that binding to sub site −3 is crucial for activity.
Nuclear magnetic resonance (NMR) analyses have also demonstrated that Glt20 retains the configuration of the anomeric group [34]. Retaining glycosyl hydrolases form a covalent intermediate between the substrate and the catalytic nucleophile Thus, the covalent intermediate with laminaritriose (in subsite −3, −2, −1) to the catalytic nucleophile E120 (bound via the α-carbon) was modeled for Glt20 (Figure 8B). Energy minimization of this intermediate conserved most of the predicted interactions in subsites −3, −2 and −1, and no significant conformational changes happened, expect in the glucose moiety covalently bound to E120 (Figure 8B). In addition, Asp35 and Lys258 made additional interactions in subsite −3.
Formation of the covalent bond between the ligand and enzymes also created space for accommodation of the laminaripentaose acceptor substrate in the active site (Figure 8C). The third glucose moiety from the non-reducing end of the acceptor was situated perpendicular to the glucose of the covalently bound donor. The two glucose moieties in the non-reducing end were stabilized via interactions with amino acids of the α8-helix and loop 258–265 (Figure 8C), of which the moiety in the non-reducing end is stabilized by Lys258, Arg124 and Asp124. The next glucose moiety is stabilized by the loop 258–265 backbone. These interactions could define the branching subsite −3* and −2*, while the −1* is surrounded by the catalytic residue E209 and the donor substrate. This conformation favors the formation of the β(1–6) bond between the donor and acceptor, giving a branched product, as characterized by NMR and mass spectrometry [34].

4. Conclusions

In summary, in this paper, the modeled structures of the catalytic domains of bacterial GH17 transglycosylases from P. aeruginosa (Glt1), P. putida (Glt3) and B. diazoefficiens (Glt20) were analyzed, and laminaripentaose and laminarihexaose were docked in the catalytic clefts in order to predict the potential interaction between ligands and enzyme. Results from this computational study, combined with previously reported experimental evidence allowed elaborating on a mechanism for the transfer-reaction of both non-reducing end and reducing-end acting transglycosylases, based on binding of the donor substrates in the same orientation in both types of enzymes, while loops in the −4 subsites differ. Despite release from either reducing or non-reducing end, subsites +1 and +2 appear to be most conserved and the difference in release is likely due to changes in hydrogen bonding. Substrate docking in Glt20 indicate that presence of covalently bound donor creates space to accommodate the acceptor oligosaccharide in alternative subsites in the catalytic cleft, promoting a branching point and formation of a 1,6-linkage, and this may be due to the conformation of the α8-helix, which adopts different conformations in every protein studied. The minimum donor size of DP5, can be explained assuming preferred binding of DP4 substrates in subsite −4 to −1, preventing catalysis.

Supplementary Materials

The following are available online at https://www.mdpi.com/article/10.3390/app11094048/s1, Table S1: Parameters used for the prediction of the three-dimensional structure of Glts, Table S2: Contribution of fragments from other models to the hybrid models, Table S3: Mutagenic primers, Figure S1: Activity analysis of the wt MalE-Glt20 and the two single mutants of MalE-Glt20:E120Q and E209Q.

Author Contributions

J.A.L.-P., E.N.K. and G.O.H. designed the current study. L.B.J., O.H.F. and H.W. designed the constructs and did different parts of the cloning production and purification of the enzymes. J.A.L.-P. executed the modeling and molecular dynamics of the catalytic modules. All authors took part in analysis of the results and writing of the manuscript. All authors have read and agreed to the published version of the manuscript.

Funding

This research was funded by the Icelandic Centre of Research (grant number 141341-053), the Swedish Research Council Formas (MariKat, grant No. 2019-02359) and by Macro cascade, a project that has received funding from the Bio-Based Industries Joint Undertaking under the European Union Horizon 2020 research and innovation program under grant agreement No. 720755.

Institutional Review Board Statement

Not applicable.

Informed Consent Statement

Not applicable.

Data Availability Statement

The files of the models presented in this study are available on request from the corresponding author. Other data are available in the article or the Supplementary Materials.

Acknowledgments

The computational simulations were enabled by resources provided by the Swedish National Infrastructure for Computing (SNIC) at Lunarc at Lund University, partially funded by the Swedish Research Council through grant agreement No. 2018-05973.

Conflicts of Interest

The authors declare no conflict of interest.

References

  1. Lairson, L.L.; Henrissat, B.; Davies, G.J.; Withers, S.G. Glycosyltransferases: Structures, functions, and mechanisms. Annu. Rev. Biochem. 2008, 77, 521–555. [Google Scholar] [CrossRef] [PubMed] [Green Version]
  2. Bissaro, B.; Monsan, P.; Faure, R.; O’Donohue, M.J. Glycosynthesis in a waterworld: New insight into the molecular basis of transglycosylation in retaining glycoside hydrolases. Biochem. J. 2015, 467, 17–35. [Google Scholar] [CrossRef]
  3. Lundemo, P.; Karlsson, E.N.; Adlercreutz, P. Eliminating hydrolytic activity without affecting the transglycosylation of a GH1 β-glucosidase. Appl. Microbiol. Biotechnol. 2017, 101, 1121–1131. [Google Scholar] [CrossRef] [Green Version]
  4. Moulis, C.; Guieysse, D.; Morel, S.; Séverac, E.; Remaud-Siméon, M. Natural and engineered transglycosylases: Green tools for the enzyme-based synthesis of glycoproducts. Curr. Opin. Chem. Biol. 2021, 61, 96–106. [Google Scholar] [CrossRef]
  5. Seibel, J.; Jördening, H.-J.; Buchholz, K. Glycosylation with activated sugars using glycosyltransferases and transglycosidases. Biocatal. Biotransform. 2006, 24, 311–342. [Google Scholar] [CrossRef]
  6. Desmet, T.; Soetaert, W. Enzymatic glycosyl transfer: Mechanisms and applications. Biocatal. Biotransform. 2011, 29, 1–18. [Google Scholar] [CrossRef]
  7. Ara, K.Z.G.; Linares-Pastén, J.A.; Jönsson, J.; Viloria-Cols, M.; Ulvenlund, S.; Adlercreutz, P.; Nordberg Karlsson, E. Engineering CGTase to improve synthesis of alkyl glycosides. Glycobiology 2020, 1–10. [Google Scholar] [CrossRef]
  8. Ngo, N.T.; Linares-Pastén, J.A.; Grey, C.; Adlercreutz, P. Synthesis of novel oligomeric anionic alkyl glycosides using laccase/TEMPO oxidation and cyclodextrin glucanotransferase (CGTase)-catalysed transglycosylation. Biotechnol. Bioeng. 2021. [CrossRef]
  9. Cho, E.; Jeong, D.; Choi, Y.; Jung, S. Properties and current applications of bacterial cyclic β-glucans and their derivatives. J. Incl. Phenom. Macrocycl. Chem. 2016, 85, 175–185. [Google Scholar] [CrossRef]
  10. Mah, T.-F.; Pitts, B.; Pellock, B.; Walker, G.C.; Stewart, P.S.; O’Toole, G.A. A genetic basis for Pseudomonas aeruginosa biofilm antibiotic resistance. Nature 2003, 426, 306–310. [Google Scholar] [CrossRef]
  11. Bhagwat, A.A.; Gross, K.C.; Tully, R.E.; Keister, D.L. Beta-glucan synthesis in Bradyrhizobium japonicum: Characterization of a new locus (ndvC) influencing beta-(1→6) linkages. J. Bacteriol. 1996, 178, 4635–4642. [Google Scholar] [CrossRef]
  12. Hreggvidsson, G.O.; Dobruchowska, J.M.; Fridjonsson, O.H.; Jonsson, J.O.; Gerwig, G.J.; Aevarsson, A.; Kristjansson, J.K.; Curti, D.; Redgwell, R.R.; Hansen, C.-E.E.; et al. Exploring novel non-Leloir β-glucosyltransferases from proteobacteria for modifying linear (β1->3)-linked gluco-oligosaccharide chains. Glycobiology 2011, 21, 304–328. [Google Scholar] [CrossRef]
  13. Jonsson Wheat, J.O.; Hreggvidsson, G.O.; Fridjonsson, O.H.; Dobruchowska, J.M.; Kamerling, J.P. Glucan Branching Enzymes and Their Methods of Use. U.S. Patent 14/780,106, 15 September 2016. [Google Scholar]
  14. Qin, Z.; Yan, Q.; Lei, J.; Yang, S.; Jiang, Z.; Wu, S. The first crystal structure of a glycoside hydrolase family 17 beta-1,3-glucanosyltransferase displays a unique catalytic cleft. Acta Crystallogr. Sect. D Biol. Crystallogr. 2015, 71, 1714–1724. [Google Scholar] [CrossRef]
  15. Krieger, E.; Vriend, G. YASARA View—Molecular graphics for all devices—From smartphones to workstations. Bioinformatics 2014, 30, 2981–2982. [Google Scholar] [CrossRef] [PubMed] [Green Version]
  16. Krieger, E.; Darden, T.; Nabuurs, S.B.; Finkelstein, A.; Vriend, G. Making optimal use of empirical energy functions: Force-field parameterization in crystal space. Proteins 2004, 57, 678–683. [Google Scholar] [CrossRef] [PubMed]
  17. Emsley, P.; Lohkamp, B.; Scott, W.G.; Cowtan, K. Features and development of Coot. Acta Crystallogr. Sect. D 2010, 66, 486–501. [Google Scholar] [CrossRef] [Green Version]
  18. Wiederstein, M.; Sippl, M.J. ProSA-web: Interactive web service for the recognition of errors in three-dimensional structures of proteins. Nucleic Acids Res. 2007, 35. [Google Scholar] [CrossRef] [PubMed] [Green Version]
  19. Abraham, M.J.; Murtola, T.; Schulz, R.; Páll, S.; Smith, J.C.; Hess, B.; Lindahl, E. GROMACS: High performance molecular simulations through multi-level parallelism from laptops to supercomputers. SoftwareX 2015, 1, 19–25. [Google Scholar] [CrossRef] [Green Version]
  20. Berendsen, H.J.; van der Spoel, D.; van Drunen, R. GROMACS: A message-passing parallel molecular dynamics implementation. Comput. Phys. Commun. 1995, 91, 43–56. [Google Scholar] [CrossRef]
  21. Duan, Y.; Wu, C.; Chowdhury, S.; Lee, M.C.; Xiong, G.; Zhang, W.; Yang, R.; Cieplak, P.; Luo, R.; Lee, T. A point-charge force field for molecular mechanics simulations of proteins based on condensed-phase quantum mechanical calculations. J. Comput. Chem. 2003, 24, 1999–2012. [Google Scholar] [CrossRef]
  22. Aronsson, A.; Güler, F.; Petoukhov, M.V.; Crennell, S.J.; Svergun, D.I.; Linares-Pastén, J.A.; Nordberg Karlsson, E. Structural insights of RmXyn10A–A prebiotic-producing GH10 xylanase with a non-conserved aglycone binding region. Biochim. Biophys. Acta Proteins Proteom. 2018, 1866, 292–306. [Google Scholar] [CrossRef]
  23. Bustos, A.-S.; Håkansson, A.; Linares-Pastén, J.A.; Nilsson, L. Interaction between myricetin aggregates and lipase under simplified intestinal conditions. Foods 2020, 9, 777. [Google Scholar] [CrossRef] [PubMed]
  24. Bussi, G.; Donadio, D.; Parrinello, M. Canonical sampling through velocity rescaling. J. Chem. Phys. 2007, 126, 014101. [Google Scholar] [CrossRef] [PubMed] [Green Version]
  25. Nosé, S.; Klein, M. Constant pressure molecular dynamics for molecular systems. Mol. Phys. 1983, 50, 1055–1076. [Google Scholar] [CrossRef]
  26. Humphrey, W.; Dalke, A.; Schulten, K. VMD: Visual molecular dynamics. J. Mol. Graph. 1996, 14, 33–38. [Google Scholar] [CrossRef]
  27. Pettersen, E.F.; Goddard, T.D.; Huang, C.C.; Couch, G.S.; Greenblatt, D.M.; Meng, E.C.; Ferrin, T.E. UCSF Chimera— A visualization system for exploratory research and analysis. J. Comput. Chem. 2004, 25, 1605–1612. [Google Scholar] [CrossRef] [Green Version]
  28. Zheng, L.; Baumann, U.; Reymond, J.L. An efficient one-step site-directed and site-saturation mutagenesis protocol. Nucleic Acids Res. 2004, 32, e115. [Google Scholar] [CrossRef] [Green Version]
  29. Motejadded, H.; Altenbuchner, J. Construction of a dual-tag system for gene expression, protein affinity purification and fusion protein processing. Biotechnol. Lett. 2009, 31, 543–549. [Google Scholar] [CrossRef] [PubMed]
  30. Laemmli, U.K. Cleavage of structural proteins during the assembly of the head of bacteriophage T4. Nature 1970, 227, 680–685. [Google Scholar] [CrossRef] [PubMed]
  31. Morris, G.M.; Goodsell, D.S.; Halliday, R.S.; Huey, R.; Hart, W.E.; Belew, R.K.; Olson, A.J. Automated docking using a Lamarckian genetic algorithm and an empirical binding free energy function. J. Comput. Chem. 1998, 19, 1639–1662. [Google Scholar] [CrossRef] [Green Version]
  32. Wojtkowiak, A.; Witek, K.; Hennig, J.; Jaskolski, M. Structures of an active-site mutant of a plant 1,3-beta-glucanase in complex with oligosaccharide products of hydrolysis. Acta Crystallogr. Sect. D Biol. Crystallogr. 2013, 69, 52–62. [Google Scholar] [CrossRef] [PubMed]
  33. Qin, Z.; Yan, Q.; Yang, S.; Jiang, Z. Modulating the function of a β-1, 3-glucanosyltransferase to that of an endo-β-1, 3-glucanase by structure-based protein engineering. Appl. Microbiol. Biotechnol. 2016, 100, 1765–1776. [Google Scholar] [CrossRef] [PubMed]
  34. Dobruchowska, J.M.; Jonsson, J.O.; Fridjonsson, O.H.; Aevarsson, A.; Kristjansson, J.K.; Altenbuchner, J.; Watzlawick, H.; Gerwig, G.J.; Dijkhuizen, L.; Kamerling, J.P. Modification of linear (β1→3)-linked gluco-oligosaccharides with a novel recombinant β-glucosyltransferase (trans-β-glucosidase) enzyme from Bradyrhizobium diazoefficiens. Glycobiology 2016, 26, 1157–1170. [Google Scholar] [CrossRef] [PubMed]
Figure 1. A CLUSTAL OMEGA multiple sequence alignment displaying the amino acid sequences of the modeled proteins (Glt1, Glt3 and Glt20) and the structure determined RmBgt17A (PDB: 4WTP, 4WTR, 4WTS), 264 AA, that was used as main template. Where (*) denotes conserved or identical amino acid, (:) conservative or amino acid with similar biochemical property, and (.) semiconservative amino acid. Alignment data displaying the amino acid residue identity between the respective sequence are displayed below.
Applsci 11 04048 g001
Figure 2. Modeled overall structures of the models obtained for Glt1, Glt3 and Glt20. The (α/β)8 classical TIM-barrel fold is represented as a ribbon diagram. A front view of the TIM-barrel is shown to the left and a side view to the right. The catalytic amino acids are shown in the lateral views using CPK representation, α helixes are in purple, 310 helixes in blue, β-strands in yellow, coil in white and turns in cyan. Notice that A4 helix is present in Glt20.
Applsci 11 04048 g002
Figure 3. Schematic diagrams of super-secondary structures. The variations in loops associated with the catalytic cleft are indicated with red arrows. The potential proton donor amino acid is represented with a red spot between β4 strand and the A4 alpha-helix, while the potential nucleophile is a blue spot in the end of the β7 strand. Predicted β-strands are shown in orange, α-helices in light blue and 310-helices in darker blue.
Applsci 11 04048 g003
Figure 4. Molecular dynamic simulations of Glt1, Glt3 and Glt20. (A) Root-mean-square deviation (RMSD) of alpha carbons. The peak observed the first 38 ns in Glt1 corresponds to a conformational change in a C-terminal loop. (B) Conformational change in the C-terminal loop of Glt1. (C) Root-mean-square fluctuations (RMSF). Peaks corresponding to loops surrounding the active site are indicated in gray, while the helixes in orange.
Applsci 11 04048 g004
Figure 5. Superimposition of the modeled Glt-structures and crystallographic structures available in GH17 (see Table 3). Plant endo-β-glucanases are in cyan, GT RmBglt1A in dark blue, Glt1 in ping, Glt3 in yellow and Glt20 in purple. Additional subdomains in endo-β-glucanases are depicted in grey. Catalytic amino acids are represented as red sticks.
Applsci 11 04048 g005
Figure 6. Comparison of conformations and lengths of the loops and α-helixes involved in the catalytic clefts. Models: Glt1 in cyan, Glt3 in purple and Glt20 in brown. The crystallographic structure of RmBgt17A (PDB code: 4WTR) is in orange (sequences are summarized in Table 4).
Applsci 11 04048 g006
Figure 7. Enzyme–substrate complexes modeled in this work, compared with the co-crystallized complexes RmBgt17A—laminaritriose (4WTS)—laminaribiose (4WTR) [14]. Glt1, Glt3 and Glt20 have a putative additional subsite −4. However, in Glt3, the predicted interactions in −4 subsite are less clear, Arg94 and Arg97 are the closest amino acids to the glucose in the putative −4 subsite.
Applsci 11 04048 g007
Figure 8. Complexes of Glt20 with different ligands. The hydrophobicity surfaces represent the polar residues in blue and the non-polar in red. White represent areas of intermediate polarity. Subsite amino acids: in orange (−3), cyan (−2), purple (−1), green (+1) and yellow (+2) (A) Complex Glt20-laminaripentaose (ligand in green). (B) Covalent intermediate Glt20-laminaritriose (in green), the covalent bond between sugar and enzyme is indicated by the black arrow. (C) Complex Glt20-laminaritriose (green) covalently bound and with docked laminaripentaose acceptor (in pink). Branch subsites are colored in dark pink (−3* and −2*).
Applsci 11 04048 g008
Table 1. Ramachandran diagram analysis.
ProteinPreferred RegionsAllowed RegionsOutliers
Glt1268 (95.04%)11 (3.90%)3 (1.06%) Gln65, Arg217, Ala252
Glt3268 (95.01%)11 (3.90%)3 (1.06%) Ala15, Ala252, Arg217
Glt20272 (95.77%)11 (3.87%)1 (0.35%) Asp15
Table 2. Z-scores of the modeled enzyme structures, calculated by ProSA. The Z-score of the crystallographic structure of RmBgt17A used as the main template for building the hybrid models is included for comparison.
ProteinAAZ-Score
RmBgt17A (4WTS)264−8.92
Glt1284−8.22
Glt3284−8.48
Glt20286−8.38
Table 3. Comparison of the refined models Glt1, Glt3, Glt7 and Glt20 with the crystallographic structures available in family GH17 (see Figure 5).
EnzymeSourcePDB CodeResolution
(Å)
Glt1Glt3Glt20
RMSD (Å)Atom PairsRMSD (Å)Atom PairsRMSD (Å)Atom Pairs
β-1,3-glucanosyl transferase (Bgt17A)Rhizomucor miehei4WTP1.31.1431761.0591401.214152
endo-β-1,3-glucanase/allergen (Mus a 5)Musa
acuminata
2CYG1.451.273891.198801.248115
endo-β-1,3-glucanase (Bgl32)Hordeum
vulgare
1GHS2.301.148871.151811.31198
endo-β-1,3-1,4-glucanase II (EII)/lichenase II β-glucosidase II (Glb2)Hordeum
vulgare
1AQ02.001.141881.100811.194100
endo-β-1,3-glucanase (GluB20-2, GluB20-2)Solanum
tuberosum
3UR81.261.153961.222721.296103
β-1,3-glucanase (Glu1, Glu2, Hev b 2)Hevea
brasiliensis
4HPG2.541.183941.207931.24382
Table 4. Alignment of amino acid sequences of the loops and helices located in the catalytic cleft.
Loopβ1-α1β2-α2β3-α3β4-A4β5-α5β6-α6β8-α8A4 Helixα8 Helix
RmBgt17A9-17
GVNE-NSCPT
38-41
FALS
65-68
WIDR-
97-99
GSE
134-139
VYYKFP-
153-161
AFPYWEGVT
230-235
100-103
VLYR
236-243
PYRG-GVEA
Glt126-41 (26-31) *
SPFRLNQNPQSGRYPS
62-65
YSVQ
87-91
WLGPD
118-120
GNE
152-158
QWHVYRE
173-181
VLPYWEATP
250-255
IEAFDQ
121-124
ALFR
256-267
PWKVSAEGSVGA
Glt326-41 (26-32) *
SPFRLGESPQKGQYPT
62-65
YTVE
87-91
WISPD
118-120
GNE
152-158
QWHIWKE
173-181
LPYWEFVP
250-255
IEAYDQ
121-124
ALFR
256-267
PWKASDEGSVGA
Glt2026-41
APFEGSAHPDIDNIPT
61-64
YSST
87-91
WIDKD
118-120
GNE
152-158
IWNIWRD
173-181
VLPYWENFR
250-255
VEAIDQ
121-124
IYR
256-266
PWKF-FEGGVGP
* Additional α-helix in the middle of loop β1-α1 present only in Glt1 and Glt3.
Publisher’s Note: MDPI stays neutral with regard to jurisdictional claims in published maps and institutional affiliations.