Abstract
The FlexiProb project is a joint effort of three soft matter groups at the Universities of Bielefeld, Darmstadt, and Munich with scientific support from the European Spallation Source (ESS), the small-K advanced diffractometer (SKADI) beamline development group of the Jülich Centre for Neutron Science (JCNS), and the Heinz Maier-Leibnitz Zentrum (MLZ). Within this framework, a flexible and quickly interchangeable sample carrier system for small-angle neutron scattering (SANS) at the ESS was developed. In the present contribution, the development of a sample environment for the investigation of soft matter thin films with grazing-incidence small-angle neutron scattering (GISANS) is introduced. Therefore, components were assembled on an optical breadboard for the measurement of thin film samples under controlled ambient conditions, with adjustable temperature and humidity, as well as the optional in situ recording of the film thickness via spectral reflectance. Samples were placed in a 3D-printed spherical humidity metal chamber, which enabled the accurate control of experimental conditions via water-heated channels within its walls. A separately heated gas flow stream supplied an adjustable flow of dry or saturated solvent vapor. First test experiments proved the concept of the setup and respective component functionality.
1. Introduction
Neutron scattering techniques are well-established routines for the structural and molecular analysis of matter, and they cover a broad field of scientific interest [1,2,3,4,5,6,7,8,9,10]. With techniques such as neutron reflectometry (NR) [11,12,13], which is used for the investigation of vertical thin film compositions, or grazing-incidence small-angle neutron scattering (GISANS) [14,15,16,17], which is used for the investigation of lateral thin film morphology and its order, two powerful methods to study thin films exist. GISANS probes a large material volume by measuring the scattered signal from a neutron beam impinging under a shallow incident angle (typically below 0.5°). Therefore, good statistics over a larger sample area can be achieved while also providing additional enhancements of the surface correlated and sub-surface structural information of the thin film. Nevertheless, for thin film samples, the sampled material volume is still orders of magnitude smaller than for bulk samples. Thus, in conjunction with the available neutron flux, times in GISANS measurement are typically in the range of hours. Only a limited number of facilities worldwide provide the necessary resources and expertise for neutron scattering, and, as such, beamtime is a highly limited resource—even more so with older facilities, e.g., the BER II [17], the Orphée [18], and the JEEP II [19], being shut down.
A new facility like the European spallation source (ESS), which is under construction in Lund, Sweden, will provide an increased flux [20], which is needed for methods such as GISANS. The ESS instrument suite [21] covers a broad field of scientific interests, and, amongst others, it offers two small-angle scattering instruments suitable for investigating soft matter thin films, namely the LOKI [22] and the SKADI [23] instruments. Moreover, the ESS aims to provide a pulsed neutron beam up to 100 times more brilliant than what is currently available and would thus greatly reduce measurement times. This might allow for even more flux-dependent applications of grazing-incidence methods, e.g., in spectroscopy [24]. With an increased flux, the ratio between setup time and actual measurements increases, which makes reducing the setup times a major tool for the overall efficiency of instruments. In order to optimize setup procedures, the FlexiProb project aims for a flexible and fast sample environment exchange system. In this joint project, three independent sample environment systems addressing different scientific topics were designed by the groups of Bielefeld, Darmstadt, and Munich, with the Munich system being presented here. They share an identical base framework that enables a quick and easy exchange mechanism between the setups. It consists of a kinematic mounting system that connects to the floor, a vertical lifting table for an initial vertical alignment, and appropriate spacers with a breadboard on top. The accuracy of the kinematic mounting system is better than 0.1 mm in all directions. On top of the breadboard, the sample environment—which, in our case, consists of the various components for GISANS measurements on soft matter thin films—is assembled. All technical equipment can be installed and adjusted before the experiment and initial alignment and preparation procedures can be done off-instrument. This allows one to quickly and efficiently exchange complete and complex setups by exchanging the whole system (mounting system, lifting table, and breadboard with measurement equipment) in a single step and by reducing or even avoiding the need for adjustments and alignments after the setup is installed at the instrument.
It is crucial for the sample environment to provide stable control over temperature and humidity because various soft matter systems are highly sensitive to these parameters [25,26,27,28,29]. There is a wide range of humidity chambers used for controlling the vapor composition around a sample during neutron scattering experiments [30,31,32]. However, usually the sample size and available space around the sample is very limited, which makes the setup very specific for its intended application. In order to control the humidity in such chambers, saturated salt solutions [33,34,35], heated solvent reservoirs [36,37,38], or solvent-saturated gas flows [32,39,40] are usually used.
In this work, we developed a sample environment that included a spherical 3D-printed humidity chamber for sample placement, a gas flow control assembly for atmospheric control and vapor mixing, a set-up for in situ spectral reflectance measurements, and a goniometer assembly for motion control and accurate sample alignment. All components were assembled on a 1200 × 900 mm2 optical breadboard and were tested for their functionality. Functional activity with neutrons has already been tested at the KWS-1 at the MLZ, Garching, Germany [41,42]. The full testing of the setup, including the off-instrument alignment and preparation procedures, are in place and will be verified as soon as the ESS instruments become operational.
2. Sample Environment Components
2.1. Humidity Chamber
We designed a spherical 3D-printed humidity metal chamber that provides precise control over temperature and, in conjunction with the gas flow assembly, humidity while offering a relatively large volume that can accommodate large samples and additional, interchangeable equipment. It is an upgraded version of a previous design of ours, with an improved control over environmental parameters and an easier general handling of the chamber [43]. The spherical design depicted in Figure 1 enables a homogeneous heat distribution for isothermal and temperature switching experiments while simultaneously preventing condensation due to the lack of sharp edges and corners, which are usually critical points for condensation [44]. The chamber size was reduced to a diameter of 146 mm, with a plane-to-plane distance of the two windows of 138 mm. It is still able to accommodate samples up to a size of 70 × 70 mm2, while the smaller overall chamber volume of 1.0 L compared to the previous volume of 1.4 L allows for faster temperature and humidity switching kinetics. The connection between chamber and lid was changed to a flat geometry in order to facilitate the accurate positioning of the chamber lid, on which the setup for spectral reflectance measurements is mounted. The windows have a height of 30 mm and a width of 90 mm to enable NR measurements. The angle between a window edge and the furthest sample edge (of a 70 × 70 mm2 sample placed in the center) measures to 8.2°, well above the typical scattering angles needed for both NR and GISANS measurements. This ensures that the 3D printed material is not hit by the incident nor the scattered neutron beam (which would produce unnecessary background). It was shown with the previous chamber design that the 3D printed material yields a strong scattering signal when directly hit, but it generates no detectable background otherwise [43,45,46]. As such, NR and GISANS measurements with no measurable background contribution from the chamber itself were already demonstrated. Within the 10-mm-thick walls of the chamber, a pathway of a 6-mm-diameter fluidic channel for temperature control is centered and runs around the chamber, as shown in Figure 1b. The total path length is 2.2 m, thus providing ample contact area for a thorough heat transfer.
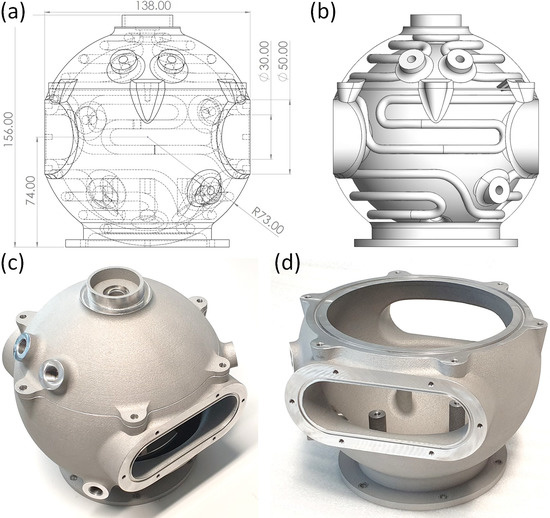
Figure 1.
(a) Wireframe model with important measures indicated in mm. (b) Chamber with the outer surface hidden in order to reveal the fluid pathways embedded within the chamber walls. (c,d) Chamber printed out of AlSi10Mg with all contact surfaces polished.
The chamber is 3D printed from an AlSi10Mg aluminum alloy powder via selective laser melting (SLM) using a metal 3D printer (EOS M290, PROTIQ GmbH, Blomberg, Germany). During the layer-by-layer printing process, the construction chamber was flooded with an inert gas to prevent the oxidation of the material. Afterwards, a heat treatment ensured the homogenization of the intermetallic phase and reduced grain boundaries within the bulk material, improving the direction-independent tensile strength of the chamber. Lastly, the contact surfaces were polished flat to ensure the airtight sealing of the chamber, thereby yielding the printed chamber and lid shown in Figure 1c,d. The lid of the chamber is designed to accommodate the optical lens system of the spectral reflectance setup, while the holes at the side of the chamber are designed as connections to either the internal liquid flow channel or the inside of the chamber, providing in and outlets for the gas flow system and additional electronics.
For measurements, the three pillars at the bottom of the chamber, visible through the chambers window in Figure 1d, are used to mount an aluminum plate with three vertical pins that can be adjusted to accommodate various sample sizes from 10 × 10 to 70 × 70 mm2. The windows are covered by a 0.1 mm aluminum foil clamped against the windows by a 2-mm-thick aluminum counterpart. For further details on the sample holder and the various connections to the chamber, we refer to our previous publication [43].
The temperature within the chamber is controlled by a heated or cooled liquid, in the current case H2O, flowing through the channels within the walls. It is usually adjusted between 10 and 80 °C for soft matter experiments, but it can be extended by using a different heating medium. In order to investigate the temperature distribution around the sample during experiments, we conducted temperature-switching simulations and confirmed them with corresponding laboratory experiments. For that purpose, SolidWorks flow simulation was used to simulate a heated and a cooled liquid flow through the chamber, heating it from 20 to 50 °C and cooling it from 50 to 20 °C, respectively. The liquid flow was set to start through the chamber lid before flowing via a tube to the lower part of the chamber and finally exiting at an intermediate height (see number order in the first image of Figure 2a). For the simulation, a liquid flow speed of 30 mL s−1, a heat transfer coefficient of 10 W m−2 K−1, an ambient temperature of 20 °C, and turbulence free surrounding conditions were assumed. The chosen flow speed is related to the flow speed limit of the heating liquid through the channels. Figure 2a depicts the sectional cuts through the center of the chamber obtained during the heating simulation. The cuts are shown as contour plots, coloring the heat distribution within the chamber in isothermals with a 1 °C range. We find laterally homogeneous heating layers as the temperature quickly changes over a period of around one minute.
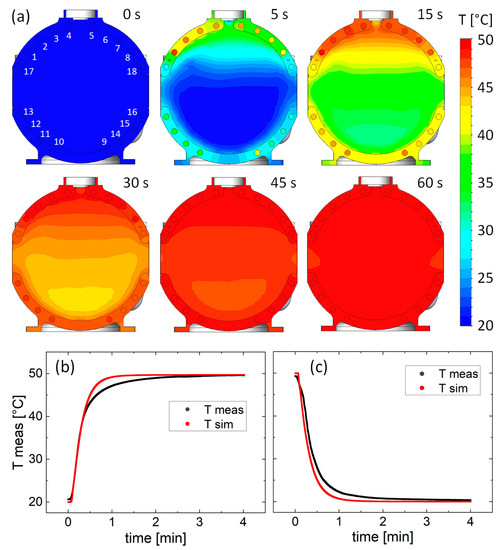
Figure 2.
(a) Contour plots across the sectional views of the chamber during the heating simulation over a period of one minute. Each color corresponds to an isothermal range of 1 °C. The numbers in the first image indicate the flow order of the liquid flow. Temperature was measured at the center of the chamber during the simulation (red) and the laboratory experiment (black) for (b) heating from 20 to 50 °C and (c) cooling from 50 to 20 °C.
An analogous laboratory experiment was conducted, connecting a 50 °C liquid flow to the chamber that was preheated to 20 °C. The liquid flow was provided by a refrigerated heating circulator (FP50-HL, JULABO Labortechnik GmbH, Seelbach, Germany), and the temperature was measured with a combined humidity and temperature sensor (SHT31, Sensirion AG, Steafa, Switzerland) throughout the whole experiment. Figure 2b depicts the temperature evolution at the center of the chamber over the course of the simulation and the laboratory experiment. We find a slightly slower heat evolution during the experiments, which we attribute to heat losses due to air turbulence around the chamber in the laboratory environment not being included in the simulation. Using the same settings as for the heating process, a cooling simulation and experiment were performed by switching back from the 50 °C liquid stream to a 20 °C stream. The temperature evolution at the center of the chamber is depicted in Figure 2c. Again, the evolution of the temperature extracted from the simulation and the measured temperature are in good agreement.
The smaller chamber size (compared to the previous design) and the thus potentially stronger heat discrepancies between the sample center and its edges might affect the homogeneity of the heat distribution, especially for large samples. Therefore, we measured the temperature at the chamber center (c) and 35 mm off-center (oc) in the direction of the windows (where the most heterogeneous temperature distribution was expected) over the course of the previously described temperature jump experiment. The results are depicted in Figure 3, together with the temperature at the two locations obtained from the previous simulation. The simulated temperatures show a discrepancy of less than 0.1 °C, and the curves strongly overlap. In comparison, the measured temperature closer to the chamber windows is slightly trailing behind the measured temperature at the center. However, considering the accuracy of the temperature sensors given with 0.5 °C, the differences are marginal. This supports the presence of the horizontal temperature layers that were found in the contour plots of the simulation and shows that the chamber provides a good temperature stability over the area of large samples.
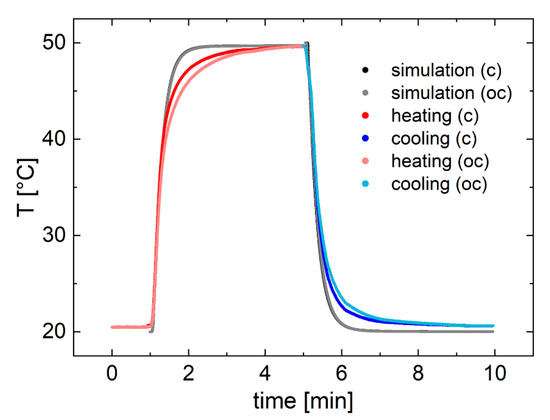
Figure 3.
Temperature sensor data and simulated temperature during the heating and cooling process at the center (c) of the chamber and 35 mm off-center (oc) in the direction of the windows.
2.2. Gas Flow Setup
In order to control and regulate the vapor composition within the chamber, a gas flow setup was installed on top of the optical breadboard. The layout of the gas flow is depicted in Figure 4 and can be grouped into the gas flow circuit (orange), an electrical control circuit (green), and a temperature control circuit (blue). The gas flow circuit consists of a supply of dry nitrogen (A), three remote-controllable gas flow controllers (B), two washing bottles (C), the connection to the humidity chamber (D), and, finally, the gas outlet (E). The gas flow controllers (B) are also part of the electrical control circuit, together with the power supply, the readout system (F), and the required software running on a computer (G). Lastly, the temperature control circuit consists of a thermal bath (H), the tubing within the gas flow chamber, the channels within the humidity chamber, and additional tubing to connect the various parts.
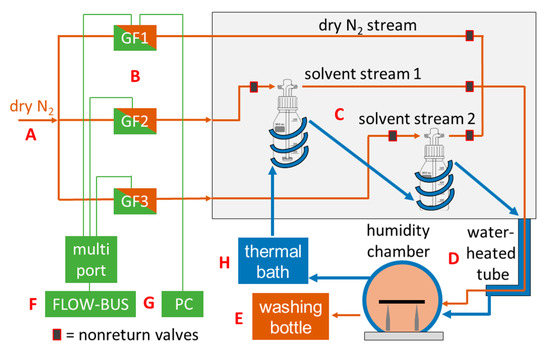
Figure 4.
Scheme of the gas flow system. The gas flow circuit (orange) consists of a dry nitrogen supply (A) regulated by three gas flow controllers (B), two washing bottles for humidification (C), a water heated tube to the chamber (D), and a washing bottle for gas cleaning (E). The control circuit (green) consists of the gas flow controllers (B), a power supply and readout system (F), and a computer with the running software (G). The temperature circuit (blue) consists of a thermal bath (H) and the tubing around the washing bottles to the chamber and within the chamber itself. Non-return valves are used to prevent backflow and uncontrolled diffusion from the washing bottles.
The core parts of the control circuit are three F-201CV-1K0 gas flow controllers calibrated with a system pressure of 2 bar at 20 °C to adjust a nitrogen flow rate between 0 and 1 L min-1, as well as the E-8501-R-00 supply and readout system that provide the power supply and handle the readout and control of the three gas flow controllers (both by Bronkhorst High-Tech B.V.Ak Ruurlo, Netherlands). They are connected by a set of patch cables and a multiport adapter with one connection leading to a remotely located computer via an RS232 connection. The PC is equipped with the FlowDDE software, which is a dynamic data exchange (DDE) server that connects digital instruments to windows applications, such as the FlowView software, a DDE-client program that is used to operate digital instruments. With the software, the gas flow of all three controllers can be adjusted and monitored.
The three flow controllers provide three individual and steady nitrogen gas flows. Two of them are led via polytetrafluoroethylene (PTFE) tubing to two separate 200 mL washing bottles (Neubert-Glas GbR, Geschwenda, Germany) equipped with a glass frit, while the third gas flow is a pure nitrogen line used for drying the chamber or to generate intermediate humidity values. The washing bottles can be filled with water or other solvents, thus allowing for different pure or mixed solvent atmospheres within the chamber. In order to prevent back flow of any solvated gas to the controllers and any uncontrolled diffusion from the washing bottles into the gas supply to the chamber, non-return valves are arranged before and after the washing bottles, as well as on the pure nitrogen line. The three gas streams merge into one and are led via a water-heated tube from the gas flow chamber to the humidity chamber. The gas flow enters the chamber below the aluminum plate on which the sample holder pins are located. Then it diffuses up to the sample through a set of holes in the sample holder base plate in order to prevent turbulences and atmospheric inhomogeneity around the sample. Finally, as the chamber is airtight, an exhaust tube leads the gas flow through another washing bottle to clean the gas flow from potentially hazardous substances.
The temperature of the whole system is regulated by a single thermal bath. As it flows through copper tubes coiled around the bottles, it heats the washing bottles and the whole gas flow chamber. The gas flow chamber is insulated and equipped with a computer fan to ensure a homogeneous temperature distribution, which is monitored with an SHT31 sensor. The heated liquid then flows to the humidity chamber via silicone tubes coiled around the gas flow tube, keeping the gas temperature constant. After heating the chamber as described in the previous section, the liquid flows back to the thermal bath.
In order to test the gas flow system, we adjusted the gas flow through one water-filled washing bottle from 0 to 100% (100% was the equivalent to 1 L min−1) in 20% steps and adjusted the gas flow on the pure nitrogen line accordingly to a total flow of 1 L min−1 (N2 flow at 100 down to 0%). Then, we increased the temperature from 20 to 50 °C and repeated the same experiment. The evolution of the temperature and humidity at the chambers center were recorded with an SHT31 sensor and are shown in Figure 5. The humidity within the chamber starts at 0% RH (0% H2O and 100% N2 flow) before rising to 20% over the course of around 7 min as we adjust the flow rates accordingly (20% H2O and 80% N2 flow). The measured humidity continues to follow the adjusted flow rates in 20% steps, which proves the good control of the gas flow system. Eventually, a humidity of 96%RH (100% H2O and 0% N2 flow) is reached. Condensational losses at the windows and the tubes prevented the humidity from being even higher, although no visible evidence of condensation during and after any performed experiments was found. Furthermore, the equilibration time increases as we aim to obtain a pure water or nitrogen atmosphere, which is due to the relatively large volume of the chamber. After adjusting the flow rates back to a pure nitrogen flow, it takes around 17 min to dry the atmosphere back to below 1% RH. The repeated experiment at a temperature of 50 °C, shows an equally good control over the humidity and similar equilibration times. The highest achieved humidity is slightly lower at 93% RH due to the stronger temperature gradient at the windows. In conclusion, the presented gas flow system allows for the study of a broad and well-controlled temperature and humidity range despite the large chamber volume and generous window sizes. This system was already used in neutron scattering experiments that investigated thin-film responses under changing atmospheric compositions, which also demonstrated the use of solvents other than water [45,46]. The setup currently runs without a feedback loop, as set humidity (via the flow rates) and temperature values are reached accurately.
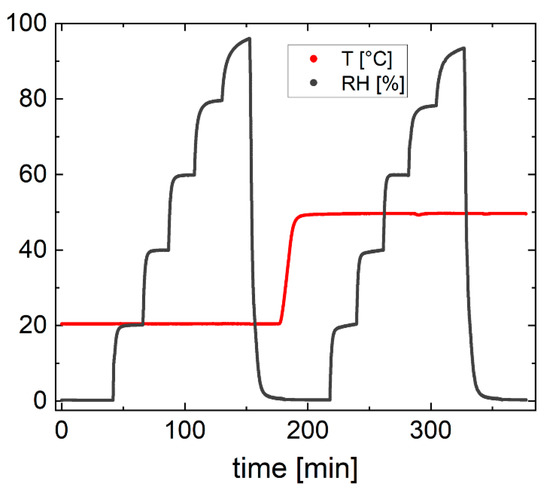
Figure 5.
Humidity (black) and temperature (red) evolution in the center of the humidity chamber during two step-wise increases of the flow rate of a water saturated gas flow mixed with a pure nitrogen flow at 20 and 50 °C. The flow rate of the water-saturated flow started at 0% and was increased in 20% steps to 100%, while the flow rate of the nitrogen stream started at 100% and was decreased accordingly to 0%—thus keeping the total flow at 100%, which was equivalent to a constant flow of 1 L min−1. After each humidification cycle, the flow rates were switched back to 0% water and 100% nitrogen, drying the atmosphere. The highest reached humidity is 96% RH (20 °C) and 93% RH (50 °C).
2.3. In Situ Spectral Reflectance Setup
To complement the neutron scattering data on thin films, thickness measurement techniques are commonly applied, which enable the correlation of morphological and compositional changes within the film to the changes in film thickness. In order to realize this in situ, a spectral reflectance setup was connected to the lid of the humidity chamber. Spectral reflectance can probe film thickness in the nanometer-to-micrometer range and is well-suited to the typical film thicknesses investigated with neutron scattering techniques. Additionally, it provides information on the refractive index of a film, which contributes to the determination of film porosity or water content. Figure 6a schematically shows the spectral reflectance setup. Light from a light source (I) is directed through an optical fiber to a lens assembly (II) on top of the chamber lid. The light is reflected from the sample surface (III), and the thin film interference signal is detected by a spectrometer (IV) and analyzed on an external computer (V).
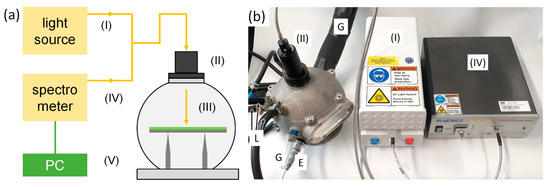
Figure 6.
(a) Scheme of the spectral reflectance setup consisting of a light source (I), a lens assembly to focus the light (II), the sample on which the light gets reflected (III), the spectrometer recording the reflected light (IV), and a computer including the control and analysis software (V). (b) Photograph of the assembly. Connections to the chamber are labeled for the liquid flow (L), the gas flow (G), and the electronics (E) connecting to the sensors.
We use an LS-DT2 deuterium-tungsten light source with a remote-controlled shutter, together with the F20-UV thin film analyzer spectrometer and the LA-GL25-25-25-UV lens assembly in the KM-GL25 kinematic mount (all by Filmmetrics Europe GmbH, Unterhaching, Germany), which is fixed to the extrusion on the chamber lid (see Figure 1c). The LS-DT2 provides a wavelength band from 190 to 1050 nm and is able to probe films within a film thickness range from 1 nm to 40 µm. The one-inch UV lens with a focal length of 25.4 mm is positioned within the lens assembly at a distance of 103 mm above the sample position. A calcium fluoride window installed in the lid of the chamber allows for light in the UV/Vis and NIR range to pass through a 1-cm-diameter hole in to chamber lid. Prior to measurements, a reference measurement of the pristine substrate reflectance is recorded and subtracted from the sample data. Recorded spectra are analyzed with the FILMeasure software using a vertical layer model and give live feedback of the thickness and refractive index during the neutron experiment independently of the collected neutron data.
For exemplary measurements, we prepared a thin film of a poly(N-isopropylacrylamide) (PNIPAM) microgel cross-linked with N,N’-methylenebisacrylamide on a silicon substrate. PNIPAM microgels are temperature-responsive and highly hygroscopic at temperatures below the volume phase transition temperature (VPPT) [47,48,49]. The film was placed in the humidity chamber at a temperature of 20 °C (well below the VPPT [38]) and humidified in 20% RH steps from a dry atmosphere at 0% RH to a humidity of 96% RH. The spectral reflectance setup continuously recorded a spectrum every 10 s. A simple two-layer model, SiO2 and a generic polymer layer with a refractive index of 1.45, was used to model-fit the spectra. The extracted film thickness is shown in Figure 7 as a function of measurement time, together with the humidity within the chamber.
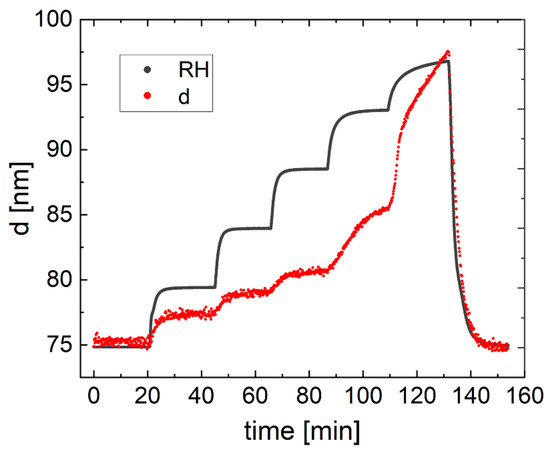
Figure 7.
Film thickness (red) and humidity (black) during a continuous spectral reflectance measurement at 20 °C and a 20%RH step-wise increase of the humidity from 0% to 96% RH.
The obtained thickness data correlates well with the humidity within the chamber. A good fit (goodness of fit >0.999) was achieved for all collected spectra, and a continuous thickness increase of the film with rising humidity is observed. A stronger swelling at higher humidity is observed and is in accordance with neutron reflectometry data collected on such PNIPAM microgel thin films [38]. Overall, we are able to accurately track the thickness via the spectral reflectance setup attached to the chamber lid, allowing for complementary in situ spectral reflectance measurements during GISANS or NR measurements. The setup was already used during a recent NR study and proved to be an important tool to measure the film thickness and refractive index in situ [46].
2.4. Motion Control and Sample Alignment
The alignment of thin film samples for GISANS or NR measurements is crucial and requires high accuracy. Therefore, an inherent alignment system was installed on top of the optical breadboard consisting of a lateral y-translation stage perpendicular to the neutron beam (set as x direction hereafter), a vertical z-translation stage, and an angular translation stage for both rotations around the x- and y-axes. For the y-translation stage, the LS-180 (PI miCos GmbH, Eschbach, Germany) with a 508 mm travel range (as seen in Figure 8a,b) is used. It is equipped with a two-phase bipolar half-coil stepper motor (PK-258-02B, Oriental Motor) and a linear optical encoder with an RS422 quadrature output signal (LIA 20, NUMERIK JENA), and it allows for the positioning of an up-to 100 kg load with an accuracy of 1 µm. The z-translation is achieved with the 5103.A10-35 z-stage, and the angular translation is achieved with the 5203.10 2-circle-segment (both Huber Diffraktionstechnik GmbH & Co. KG, Rimsting, Germany). They are shown in Figure 8c,d equipped with two-phase hybrid stepper motors (ZSS43.200.1.2, Phytron) and optical absolute rotary encoders (OCD-S101G-1413-S060-PRL, Posital/Fraba) with an accuracy of 0.022° (multiturn). The z-stage offers a travel range of 35 mm, while the 2-circle segment offers an angular range of ±14°, which even covers strong tilts as well as the usual angles of up to around 3° that are used in GISANS or NR. Initial height adjustments with a 0.1 mm accuracy are possible by the lifting table that is part of the mounting system. The stages are assembled as shown in Figure 8e, with the linear stage screwed to the optical breadboard, the z-stage mounted on top of the linear stage, and the 2-circle segment located at the very top. The pivot point of the 2-circle segment is 110 mm above its top edge, and the position of the sample within the humidity chamber is 74 mm above its bottom edge. As such, a 36 mm spacer with a 10 mm PTFE plate is used between the 2-circle segment and the chamber, which additionally functions as insulation of the alignment components from the temperature changes of the chamber.
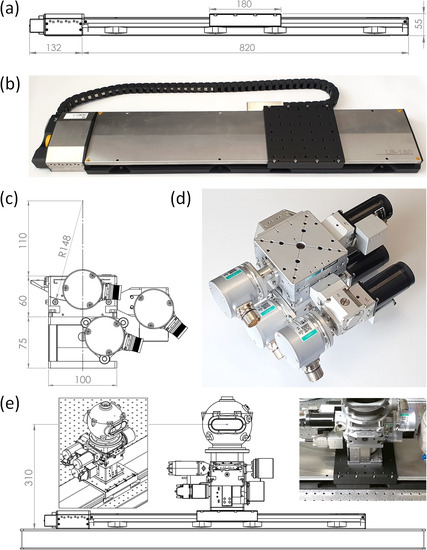
Figure 8.
(a) Technical drawing and (b) photograph of the LS180, used for the horizontal sample alignment. (c) Technical drawing and (d) photograph of the 5103.A10-35 and the 5203.10, used for the vertical and rotational alignment, respectively. (e) Assembly of the components on the breadboard.
In order to control the different stages, a custom-made control unit was assembled based on the Ethernet-based fieldbus system EtherCAT [50] (Ethernet for Control Automation Technology) (Beckhoff Automation GmbH & Co. KG, Verl, Germany). The layout of the motion control unit is shown in Figure 9a. The motors (M1–4) and encoders (E1–4) belong to the LS-180 linear stage (M1, E1), the z-stage (M2, E2), and the 2-circle segment (M3, M4, E3, E4). Three power supply units are installed in a 19-inch rack together with an embedded computer and the required EtherCAT terminals. The 48 V supply feeds the 4 motors, while the 24 V power lines feeds the CX5130 embedded PC and thereby also the internal terminal power circuit. The EL9189 is a 0 V potential distribution terminal to which M1 was connected. The two EL1808 24 V are digital input terminals that registered the limit switches of the four motors (two per terminal). The EL2819 is a digital output terminal that connects the 24 V signal of the automation unit to the three encoders of the z-stage and 2-circle segment, and the two EL5002 are the SSI encoder interfaces for these three encoders. Since E1 provides an RS422 signal, EL5101, which is an incremental encoder interface that registers RS422 differential signals, is used. The four EL7041-0052 are stepper motor terminals to which M1–M4 are directly connected. Lastly, the EL9011 is a bus end cover that terminated the bus station and covers the contacts. If not supplied via a terminal, the motors, encoders, and cable shields are grounded via the power supply.
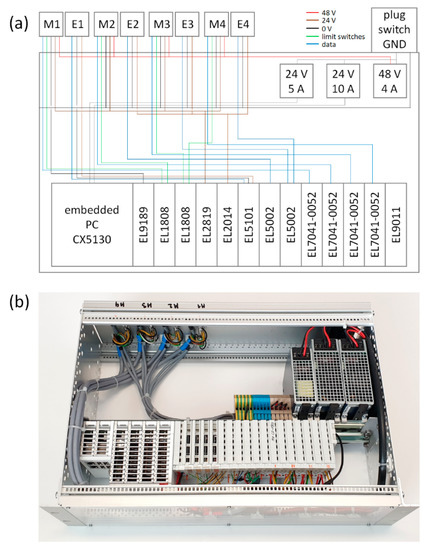
Figure 9.
(a) Wiring of the motion control unit for the four axes. M1–4 and E1–4 correspond to the motors and encoders of the 4 axes (LS-180 is axis 1). The EtherCAT terminals (ELXXXX) control the power supply and data flow of the encoders and motors. (b) Photograph of the assembled control unit.
The complete assembly of the unit can be seen in the photograph shown in Figure 9b, with all cables connected. In order to access and control the different axes, TwinCAT 3 is installed on the embedded computer. In cooperation with the motion control group at the ESS, the motors and encoders of the used stages were integrated into a project that allows for the accurate control over each axis and their remote access. Laboratory tests were conducted to ensure that all axes are working properly.
3. Conclusions
In the framework of the FlexiProb project, we designed and built a sample environment for the investigation of soft matter thin films via GISANS for the use at the ESS. The presented setup includes four core components: a spherical, 3D printed humidity chamber; a gas flow control setup; a spectral reflectance measurement setup; and a motion control system. The 3D-printed spherical humidity chamber with embedded fluid channels is optimized to reduce condensation and provide a homogeneous temperature distribution around the thin film sample. Temperature simulations and measurements show a layered temperature profile for temperature switches, with no significant temperature gradient even over large samples. The three-channel gas flow setup provides well-controlled mixed vapor atmospheres of pure nitrogen and two solvents. Gas compositions within the chamber can be easily adjusted via the regulation of the flow rates of the three channels. Laboratory experiments confirmed the accurate control and a humidity of 96%RH was achieved for an exemplary water saturated gas-stream despite the large chamber volume. The spectral reflectance measurement setup installed on top of the chamber lid enables in situ thickness measurements during neutron experiments. Exemplary measurements demonstrated the functionality of the setup. Finally, the motion control setup consisting of four axes for lateral (perpendicular to neutron beam), vertical, and angular movement enables the accurate positioning of the sample for alignment and experimentation. The custom assembled control unit is based on the Beckhoff EtherCAT technology and optimized for future integration at the ESS. Thus, for the ESS instruments, a versatile GISANS sample environment that can be used for early science at the ESS is available.
Author Contributions
Conceptualization, R.v.K., T.H., and P.M.-B.; planning and discussion of setup components, T.W., L.P.K., M.K., A.J.S., L.W., S.J., H.F., O.L., H.S., and A.H.; construction and test of setup components, T.W. and L.P.K.; writing—original draft preparation, T.W.; writing—review and editing, L.P.K., M.K., A.J.S., L.W., S.J., H.F., O.L., H.S., A.H., R.v.K., T.H., and P.M.-B.; visualization, T.W. and L.P.K.; supervision, P.M.-B.; project administration, T.H.; funding acquisition, R.v.K., T.H., and P.M.-B. All authors have read and agreed to the published version of the manuscript.
Funding
This research was funded by the German Federal Ministry for Education and Research (BMBF) within the project “FlexiProb” sample environment grant number 05K2016.
Institutional Review Board Statement
Not applicable.
Informed Consent Statement
Not applicable.
Data Availability Statement
Derived data supporting the findings of this study are available from the corresponding author upon reasonable request.
Acknowledgments
We gratefully acknowledge the ESS Motion Control Group for help implementing the control of the translation stages. We thank Judith Houston for fruitful discussions. We thank Christina Geiger and Julija Reitenbach for valuable discussions and testing of setup components.
Conflicts of Interest
The authors declare no conflict of interest.
References
- Kiel, J.W.; Mackay, M.E.; Kirby, B.J.; Maranville, B.B.; Majkrzak, C.F. Phase-sensitive neutron reflectometry measurements applied in the study of photovoltaic films. J. Chem. Phys. 2010, 133, 74902. [Google Scholar] [CrossRef]
- Clulow, A.J.; Tao, C.; Lee, K.H.; Velusamy, M.; McEwan, J.A.; Shaw, P.E.; Yamada, N.L.; James, M.; Burn, P.L.; Gentle, I.R.; et al. Time-resolved neutron reflectometry and photovoltaic device studies on sequentially deposited PCDTBT-fullerene layers. Langmuir 2014, 30, 11474–11484. [Google Scholar] [CrossRef]
- Jerliu, B.; Dörrer, L.; Hüger, E.; Borchardt, G.; Steitz, R.; Geckle, U.; Oberst, V.; Bruns, M.; Schneider, O.; Schmidt, H. Neutron reflectometry studies on the lithiation of amorphous silicon electrodes in lithium-ion batteries. Phys. Chem. Chem. Phys. 2013, 15, 7777–7784. [Google Scholar] [CrossRef]
- Ohisa, S.; Matsuba, G.; Yamada, N.L.; Pu, Y.-J.; Sasabe, H.; Kido, J. Precise Evaluation of Angstrom-Ordered Mixed Interfaces in Solution-Processed OLEDs by Neutron Reflectometry. Adv. Mater. Interfaces 2014, 1, 1400097. [Google Scholar] [CrossRef]
- Ueda, S.; Koizumi, S.; Ohira, A.; Kuroda, S.; Frielinghaus, H. Grazing-incident neutron scattering to access catalyst for polymer electrolyte fuel cell. Physica B 2018, 551, 309–314. [Google Scholar] [CrossRef]
- Cavaye, H.; Smith, A.R.G.; James, M.; Nelson, A.; Burn, P.L.; Gentle, I.R.; Lo, S.-C.; Meredith, P. Solid-state dendrimer sensors: Probing the diffusion of an explosive analogue using neutron reflectometry. Langmuir 2009, 25, 12800–12805. [Google Scholar] [CrossRef] [PubMed]
- Junghans, A.; Watkins, E.B.; Barker, R.D.; Singh, S.; Waltman, M.J.; Smith, H.L.; Pocivavsek, L.; Majewski, J. Analysis of biosurfaces by neutron reflectometry: From simple to complex interfaces. Biointerphases 2015, 10, 19014. [Google Scholar] [CrossRef]
- Simič, R.; Kalin, M.; Hirayama, T.; Korelis, P.; Geue, T. Fatty Acid Adsorption on Several DLC Coatings Studied by Neutron Reflectometry. Tribol. Lett. 2014, 53, 199–206. [Google Scholar] [CrossRef]
- Cousin, F.; Jestin, J.; Chaboussant, G.; Gautrot, S.; Menelle, A.; Ott, F. Probing simultaneously the volume and surface structure of nanospheres adsorbed at a solid-liquid interface by GISANS. Eur. Phys. J. Spec. Top. 2009, 167, 177–183. [Google Scholar] [CrossRef]
- Lipfert, F.; Frielinghaus, H.; Holderer, O.; Mattauch, S.; Monkenbusch, M.; Arend, N.; Richter, D. Polymer enrichment decelerates surfactant membranes near interfaces. Phys. Rev. E Stat. Nonlinear Soft Matter Phys. 2014, 89, 42303. [Google Scholar] [CrossRef]
- Russell, T.P. X-ray and neutron reflectivity for the investigation of polymers. Mater. Sci. Rep. 1990, 5, 171–271. [Google Scholar] [CrossRef]
- Penfold, J.; Thomas, R.K. The application of the specular reflection of neutrons to the study of surfaces and interfaces. J. Phys. Condens. Matter 1990, 2, 1369–1412. [Google Scholar] [CrossRef]
- Majkrzak, C.F.; Felcher, G.P. Neutron Scattering Studies of Surfaces and Interfaces. MRS Bull. 1990, 15, 65–72. [Google Scholar] [CrossRef]
- Müller-Buschbaum, P.; Gutmann, J.S.; Stamm, M. Dewetting of confined polymer films: An X-ray and neutron scattering study. Phys. Chem. Chem. Phys. 1999, 1, 3857–3863. [Google Scholar] [CrossRef]
- Müller-Buschbaum, P.; Gutmann, J.S.; Cubitt, R.; Stamm, M. Probing the in-plane composition of thin polymer films with grazing-incidence small-angle neutron scattering and atomic force microscopy. Colloid Polym. Sci. 1999, 277, 1193–1199. [Google Scholar] [CrossRef]
- Kraus, J.; Müller-Buschbaum, P.; Kuhlmann, T.; Schubert, D.W.; Stamm, M. Confinement effects on the chain conformation in thin polymer films. Eur. Lett. 2000, 49, 210–216. [Google Scholar] [CrossRef]
- Helmholtz Zentrum Berlin Website. Available online: https://www.helmholtz-berlin.de/projects/rueckbau/ber/index_en.html (accessed on 28 April 2021).
- Laboratoire Léon Brillouin Website. Available online: http://www-llb.cea.fr/en/Phocea/Vie_des_labos/News/index.php?id_news=7680 (accessed on 28 April 2021).
- Institute for Energy Technology (IFE) Website. Available online: https://ife.no/en/permanent-closure-of-the-jeep-ii-research-reactor-at-kjeller/ (accessed on 28 April 2021).
- Garoby, R.; Vergara, A.; Danared, H.; Alonso, I.; Bargallo, E.; Cheymol, B.; Darve, C.; Eshraqi, M.; Hassanzadegan, H.; Jansson, A.; et al. The European Spallation Source Design. Phys. Scr. 2018, 93, 14001. [Google Scholar] [CrossRef]
- Andersen, K.H.; Argyriou, D.N.; Jackson, A.J.; Houston, J.; Henry, P.F.; Deen, P.P.; Toft-Petersen, R.; Beran, P.; Strobl, M.; Arnold, T.; et al. The instrument suite of the European Spallation Source. Nucl. Instrum. Methods Phys. Res. Sect. A 2020, 957, 163402. [Google Scholar] [CrossRef]
- Jackson, A.; Kanaki, K. Ess Construction Proposal: Loki—A Broad-Band Sans Instrument. Zenodo 2013. [Google Scholar] [CrossRef]
- Jaksch, S.; Chennevière, A.; Désert, S.; Kozielewski, T.; Feilbach, H.; Lavie, P.; Hanslik, R.; Gussen, A.; Butterweck, S.; Engels, R.; et al. Technical Specification of the Small-Angle Neutron Scattering Instrument SKADI at the European Spallation Source. Applied Sciences 2021, 11, 3620. [Google Scholar] [CrossRef]
- Frielinghaus, H.; Gvaramia, M.; Mangiapia, G.; Jaksch, S.; Ganeva, M.; Koutsioubas, A.; Mattauch, S.; Ohl, M.; Monkenbusch, M.; Holderer, O. New tools for grazing incidence neutron scattering experiments open perspectives to study nano-scale tribology mechanisms. Nucl. Instrum. Methods Phys. Res. Sect. A 2017, 871, 72–76. [Google Scholar] [CrossRef]
- Schmidt, S.; Motschmann, H.; Hellweg, T.; von Klitzing, R. Thermoresponsive surfaces by spin-coating of PNIPAM-co-PAA microgels: A combined AFM and ellipsometry study. Polymer 2008, 49, 749–756. [Google Scholar] [CrossRef]
- Hertle, Y.; Hellweg, T. Thermoresponsive copolymer microgels. J. Mater. Chem. B 2013, 1, 5874. [Google Scholar] [CrossRef]
- Kreuzer, L.P.; Widmann, T.; Bießmann, L.; Hohn, N.; Pantle, J.; Märkl, R.; Moulin, J.-F.; Hildebrand, V.; Laschewsky, A.; Papadakis, C.M.; et al. Phase Transition Kinetics of Doubly Thermoresponsive Poly(sulfobetaine)-Based Diblock Copolymer Thin Films. Macromolecules 2020, 53, 2841–2855. [Google Scholar] [CrossRef]
- Kreuzer, L.P.; Widmann, T.; Hohn, N.; Wang, K.; Bießmann, L.; Peis, L.; Moulin, J.-F.; Hildebrand, V.; Laschewsky, A.; Papadakis, C.M.; et al. Swelling and Exchange Behavior of Poly(sulfobetaine)-Based Block Copolymer Thin Films. Macromolecules 2019, 52, 3486–3498. [Google Scholar] [CrossRef]
- Wang, W.; Kaune, G.; Perlich, J.; Papadakis, C.M.; Bivigou Koumba, A.M.; Laschewsky, A.; Schlage, K.; Röhlsberger, R.; Roth, S.V.; Cubitt, R.; et al. Swelling and switching kinetics of gold coated end-capped poly(N -isopropylacrylamide) thin films. Macromolecules 2010, 43, 2444–2452. [Google Scholar] [CrossRef]
- Gonthier, J.; Barrett, M.A.; Aguettaz, O.; Baudoin, S.; Bourgeat-Lami, E.; Demé, B.; Grimm, N.; Hauß, T.; Kiefer, K.; Lelièvre-Berna, E.; et al. BerILL: The ultimate humidity chamber for neutron scattering. J. Neutron Res. 2019, 21, 65–76. [Google Scholar] [CrossRef]
- Plaza, N.Z.; Pingali, S.V.; Qian, S.; Heller, W.T.; Jakes, J.E. Informing the improvement of forest products durability using small angle neutron scattering. Cellulose 2016, 23, 1593–1607. [Google Scholar] [CrossRef]
- Arima-Osonoi, H.; Miyata, N.; Yoshida, T.; Kasai, S.; Ohuchi, K.; Zhang, S.; Miyazaki, T.; Aoki, H. Gas-flow humidity control system for neutron reflectivity measurements. Rev. Sci. Instrum. 2020, 91, 104103. [Google Scholar] [CrossRef]
- Carotenuto, A.; Dell’Isola, M. An experimental verification of saturated salt solution-based humidity fixed points. Int. J. Thermophys. 1996, 17, 1423–1439. [Google Scholar] [CrossRef]
- Harroun, T.A.; Fritzsche, H.; Watson, M.J.; Yager, K.G.; Tanchak, O.M.; Barrett, C.J.; Katsaras, J. Variable temperature, relative humidity (0–100%), and liquid neutron reflectometry sample cell suitable for polymeric and biomimetic materials. Rev. Sci. Instrum. 2005, 76, 65101. [Google Scholar] [CrossRef]
- Young, J.F. Humidity control in the laboratory using salt solutions-a review. J. Appl. Chem. 1967, 17, 241–245. [Google Scholar] [CrossRef]
- Demé, B.; Cataye, C.; Block, M.A.; Maréchal, E.; Jouhet, J. Contribution of galactoglycerolipids to the 3-dimensional architecture of thylakoids. FASEB J. 2014, 28, 3373–3383. [Google Scholar] [CrossRef] [PubMed]
- Bießmann, L.; Kreuzer, L.P.; Widmann, T.; Hohn, N.; Moulin, J.-F.; Müller-Buschbaum, P. Monitoring the Swelling Behavior of PEDOT:PSS Electrodes under High Humidity Conditions. ACS Appl. Mater. Interfaces 2018, 10, 9865–9872. [Google Scholar] [CrossRef] [PubMed]
- Widmann, T.; Kreuzer, L.P.; Hohn, N.; Bießmann, L.; Wang, K.; Rinner, S.; Moulin, J.-F.; Schmid, A.J.; Hannappel, Y.; Wrede, O.; et al. Hydration and Solvent Exchange Induced Swelling and Deswelling of Homogeneous Poly(N-isopropylacrylamide) Microgel Thin Films. Langmuir 2019, 35, 16341–16352. [Google Scholar] [CrossRef] [PubMed]
- Thijs, H.M.L.; Becer, C.R.; Guerrero-Sanchez, C.; Fournier, D.; Hoogenboom, R.; Schubert, U.S. Water uptake of hydrophilic polymers determined by a thermal gravimetric analyzer with a controlled humidity chamber. J. Mater. Chem. 2007, 17, 4864. [Google Scholar] [CrossRef]
- Oerter, E.J.; Singleton, M.; Thaw, M.; Davisson, M.L. Water vapor exposure chamber for constant humidity and hydrogen and oxygen stable isotope composition. Rapid Commun. Mass Spectrom. 2019, 33, 89–96. [Google Scholar] [CrossRef]
- Feoktystov, A.V.; Frielinghaus, H.; Di, Z.; Jaksch, S.; Pipich, V.; Appavou, M.-S.; Babcock, E.; Hanslik, R.; Engels, R.; Kemmerling, G.; et al. KWS-1 high-resolution small-angle neutron scattering instrument at JCNS: Current state. J. Appl. Crystallogr. 2015, 48, 61–70. [Google Scholar] [CrossRef]
- Frielinghaus, H.; Feoktystov, A.; Berts, I.; Mangiapia, G. KWS-1: Small-angle scattering diffractometer. JLSRF 2015, 1. [Google Scholar] [CrossRef]
- Widmann, T.; Kreuzer, L.P.; Mangiapia, G.; Haese, M.; Frielinghaus, H.; Müller-Buschbaum, P. 3D printed spherical environmental chamber for neutron reflectometry and grazing-incidence small-angle neutron scattering experiments. Rev. Sci. Instrum. 2020, 91, 113903. [Google Scholar] [CrossRef]
- Medici, M.-G.; Mongruel, A.; Royon, L.; Beysens, D. Edge effects on water droplet condensation. Phys. Rev. E: Stat. Nonlinear Soft Matter Phys. 2014, 90, 62403. [Google Scholar] [CrossRef] [PubMed]
- Kreuzer, L.P.; Lindenmeir, C.; Geiger, C.; Widmann, T.; Hildebrand, V.; Laschewsky, A.; Papadakis, C.M.; Müller-Buschbaum, P. Poly(sulfobetaine) versus Poly(N -isopropylmethacrylamide): Co-Nonsolvency-Type Behavior of Thin Films in a Water/Methanol Atmosphere. Macromolecules 2021, 54, 1548–1556. [Google Scholar] [CrossRef]
- Geiger, C.; Reitenbach, J.; Kreuzer, L.P.; Widmann, T.; Wang, P.; Cubitt, R.; Henschel, C.; Laschewsky, A.; Papadakis, C.M.; Müller-Buschbaum, P. PMMA- b -PNIPAM Thin Films Display Cononsolvency-Driven Response in Mixed Water/Methanol Vapors. Macromolecules 2021, 54, 3517–3530. [Google Scholar] [CrossRef]
- Burmistrova, A.; Richter, M.; Eisele, M.; Üzüm, C.; Klitzing, R. von. The Effect of Co-Monomer Content on the Swelling/Shrinking and Mechanical Behaviour of Individually Adsorbed PNIPAM Microgel Particles. Polymers 2011, 3, 1575–1590. [Google Scholar] [CrossRef]
- Burmistrova, A.; von Klitzing, R. Control of number density and swelling/shrinking behavior of P(NIPAM–AAc) particles at solid surfaces. J. Mater. Chem. 2010, 20, 3502–3507. [Google Scholar] [CrossRef]
- Backes, S.; Krause, P.; Tabaka, W.; Witt, M.U.; von Klitzing, R. Combined Cononsolvency and Temperature Effects on Adsorbed PNIPAM Microgels. Langmuir 2017, 33, 14269–14277. [Google Scholar] [CrossRef] [PubMed]
- Buttner, H.; Jansen, D. Real-time Ethernet: The EtherCAT solution. Comput. Control Eng. 2004, 15, 16–21. [Google Scholar] [CrossRef]
Publisher’s Note: MDPI stays neutral with regard to jurisdictional claims in published maps and institutional affiliations. |
© 2021 by the authors. Licensee MDPI, Basel, Switzerland. This article is an open access article distributed under the terms and conditions of the Creative Commons Attribution (CC BY) license (https://creativecommons.org/licenses/by/4.0/).