Article

A New Two-Stage Approach to Coordinate Electrical Vehicles for Satisfaction of Grid and Customer Requirements

by
Trinnapop Boonseng
,
Anawach Sangswang
*,
Sumate Naetiladdanon
and
Samundra Gurung
Department of Electrical Engineering, Faculty of Engineering, King Mongkut’s University of Technology Thonburi (KMUTT), Bangkok 10 140, Thailand
*
Author to whom correspondence should be addressed.
Appl. Sci. 2021, 11(9), 3904; https://doi.org/10.3390/app11093904
Submission received: 11 March 2021 / Revised: 12 April 2021 / Accepted: 20 April 2021 / Published: 26 April 2021
(This article belongs to the Section Electrical, Electronics and Communications Engineering)

Abstract

:

Featured Application

Scheduling of electric vehicles to improve both the system and consumer benefits.

Abstract

Recently due to air pollution concerns, a large number of electric vehicles have been integrated into the electric distribution system. However, the uncoordinated charging of this technology can cause different voltage issues. This paper proposes a two-stage optimization approach with active and reactive power control to coordinate electric vehicles with both grid-to-vehicle and vehicle-to-grid capabilities to satisfy both grid requirements and electric vehicle prosumer requirements. The system requirements considered are voltage deviation and unbalance and the electric vehicle prosumer requirements considered are minimization of charging and battery degradation costs. The coordination problem is formulated as an optimization problem, where the first stage objectives are: minimization of voltage unbalance, customer charging and battery degradation costs. The first stage optimization problem is solved using the meta-heuristic optimization algorithm known as particle swarm optimization to obtain an optimized real power schedule for the electric vehicles. The second stage is then solved of which the objective is to minimize the bus voltage deviation and provides the reactive power schedule for electric vehicles. All the analyses were carried out on the IEEE 34 bus distribution system and the study results show that the proposed method allows prosumers to charge at a minimum cost without any grid voltage unbalance factors and under/over voltage problems under different scenarios. Thus, this work can be beneficial for system operators or electric vehicle aggregators to create a day-ahead schedule.

1. Introduction

Recently, CO2 emission has been a major public concern due to its serious environmental impact, of which major sources are industries and the fossil fuel-dependent transportation sector. The electric vehicle (EV) is an empirically-proven technology that can alleviate dependency on the excessive use of oil and can help to decrease CO2 intensity and gasoline consumption [1]. Consequently, there is a growing trend in many countries, especially in residential and commercial areas, for the use of EVs [2]. However, the increasing number of EVs cause a high demand for electricity, which can have detrimental impacts on existing power systems.
In the uncoordinated charging of EVs, customers arrive at their homes in the evening and start to charge their vehicles immediately, which may cause different issues, such as transformer ageing [3], load unbalance in the residential area due to use of single-phase AC charger [4,5,6], power quality, peak loading, frequency stability issues, etc.
There have been a number of studies that try to schedule/manage time charging/discharging of EVs properly to avoid these problems and is commonly known as smart charging. From an EV aggregator perspective, the management of an EV fleet should consider different significant constraints related to the electricity grid, ecosystem, and customers. The authors of [7] used the EVSCP model, which aims to control an EV fleet to minimize the charging cost. Their results showed the efficiency and effectiveness of the model, but there was no mention about the grid effect. The authors of [8] presented an intelligent fleet disposition algorithm, mixed with electricity generating companies, which mitigate both financial and ecological parameters by collecting customer behavior (including V2G) and power generating profiles (including renewable energy). Their results showed that charging cost and CO2 were decreased by 22% and 33% respectively a year. Yet the method lacked an energy management system that made the method difficult to implement in the real-world. Three novel algorithms for the integration of EV to control a large fleet so as to flatten the duck curve in California was proposed in [9]. The researchers of [10] proposed V2G scheduling for a railway station to increase the load factor and minimize the annual energy invoice of the station. However, [9,10] did not considered the benefits to customers if they participated in the time scheduling. Most power system issues use multi-objective optimal power flow (MOOPF) to achieve objective functions in power systems, and have now become an essential application to deal with several objectives [11,12,13,14,15]. Strategies for smart charging then used multi-objective meta-heuristic optimization algorithms [16], of which the objectives are to benefit either some grid requirements, such as voltage unbalance and frequency stability, or customer requirements, such as minimize charging costs, battery degradation costs, etc. [17]. The constraints to this optimization problem are normally EVs charging, also called Grid2Vehicle (G2V), or discharging EVs, also called Vehicle2Grid (V2G). This optimization problem is solved using some meta-heuristics to find an optimized schedule for EVs. Reference [18] proposed a method to mitigate problems, such as peak shaving and valley filling, and the method to mitigate power quality is given in [19,20]. References [21,22,23] proposed methods to improve system frequency stability under disturbance and methods to maximize EV prosumer revenue are discussed in [24,25,26,27]. However, meta-heuristic optimization algorithms with multi-objective functions have drawback with their weight factors, as they need to vary each of the weights properly to achieve optimal solutions in all objective functions. Otherwise, the solution is trapped in a local optimal solution. A huge power system with a load flow calculation requires the consideration of variable decisions with enormous and complex computational requirements which are difficult to search in terms of global optimal solution and grid requirements/customer satisfactions could not be met [28]. The authors of [29] reviewed several techniques for multi-stage optimization dealing with real-world problems, particularly in energy management. The partial decision making of multi-stage optimization can cause complexity in problems, but this model enables decision makers to alter decision at a later stage. The results of multi-stage models have potential to find better solution than all decisions at only one stage.
Although many studies have proposed smart charging with different objectives, only a few studies have focused on the benefits to both the customer and power systems. Some of these works are listed in Table 1. Coordinated smart charging using V2G to minimize charging costs and battery degradation costs was studied in [30]. Reference [31] presented an approach to coordinate V2G by focusing specifically on battery health. Customer benefits and maintaining system voltage levels using V2G technology was studied in [32]. The authors of [33] proposed an approach to minimize charging costs and voltage deviations. Reference [34] presented multi-objective optimization, including different objectives, such as charging costs, voltage drops, and voltage unbalance. Reference [35] used V2G with a reactive droop control and Reference [36] used different phase connections (phase switcher) to minimize voltage unbalance and voltage deviations. The researchers of [37] scheduled the active/reactive power of V2G to regulate the voltage and minimize losses in a system. The authors of [38] used DGs to mitigate the voltage unbalance and improve voltage magnitude in connected EV buses. It can be observed from Table 1 that most of the literature only considered customer objectives [30,31,32] or system objectives [35,36,37,38]; there are few works in the literature which considered both [33,34]. The researchers of [33] did not consider the reactive power exchange of V2G nor battery degradation costs, which are crucial for discharging EVs. The authors of [34] included different objectives, such as charging costs and voltage deviation, but did not consider voltage unbalance, battery degradation, or the reactive power capability of EVs. Thus, this paper tries to address these research gaps and proposes a two-stage strategy where, in the first stage, different objectives, such as customer charging costs, battery degradation costs, and voltage unbalance, are considered, and, in second stage, the voltage deviation problem is considered.
Thus, this paper tries to address the research gaps outlined in the paragraphs above. It proposes a two-stage strategy to mitigate different electrical issues, such as VUF, voltage deviation, and prosumer costs, using V2G technology. The two-stage problem is formulated as an optimization problem and is solved using a meta-heuristic optimization algorithm, particle swarm optimization (PSO). The first stage targets the problem of VUF and customer costs by scheduling EV charging and the second stage targets voltage deviation with the help of reactive power injection from EVs. Thus, the major contributions of this paper are as follows:
  • The development of a framework to fulfill grid requirements, such as voltage unbalance factors, voltage deviations, and prosumer requirements, such as charging cost and battery health, using V2G technology.
  • Consideration of different scenarios, such as a change in load profile, penetration level, and price changes, have also been considered. Furthermore, this study also conducts a detailed comparison of the proposed method with other recent approaches.
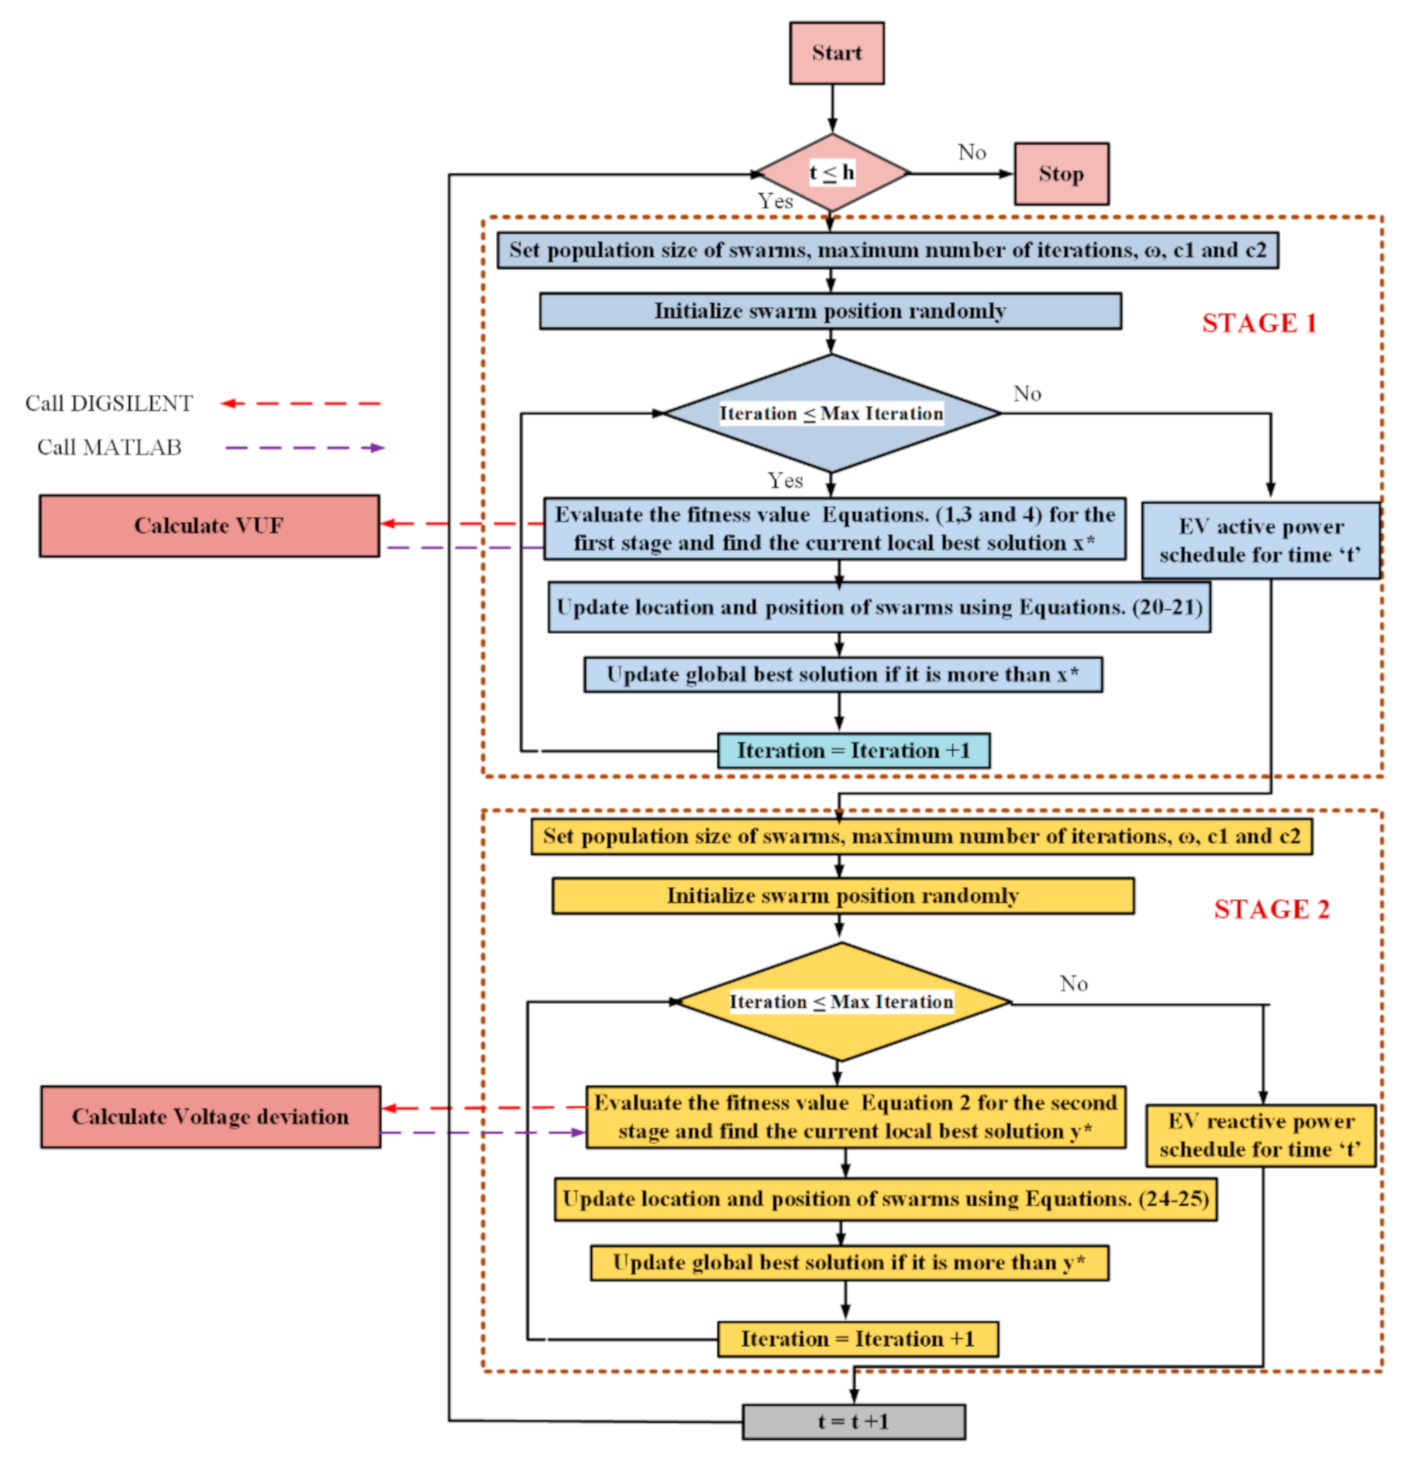
  • Presentation of a method to solve the proposed method with real-time data exchange between DIgSILENT and MATLAB.
This paper is organized as follows: Section 2 provides a brief discussion of the proposed method, followed by the formulation of the optimization problem in Section 3. Section 4 discusses the application of PSO to solve the proposed optimization problem, followed by results and a discussion in Section 5. The conclusions of our study are presented in Section 6.

2. Description of the Proposed Method

Figure 1 shows a pictorial description of a possible application of the proposed method by both the aggregator and the distribution system operator (DSO). The DSO provides a day-ahead load forecast and grid requirements (voltage deviation, VUF in this paper) to the aggregator and the aggregator collects the possible arrival and departure times of EVs. The aggregator can then provide all this information to the proposed method, which will then provide an optimized schedule of EVs to satisfy both grid and customer benefits.
A plot of the proposed method to coordinate EVs is shown in Figure 2 and a brief description of this process is as follows:
(i).
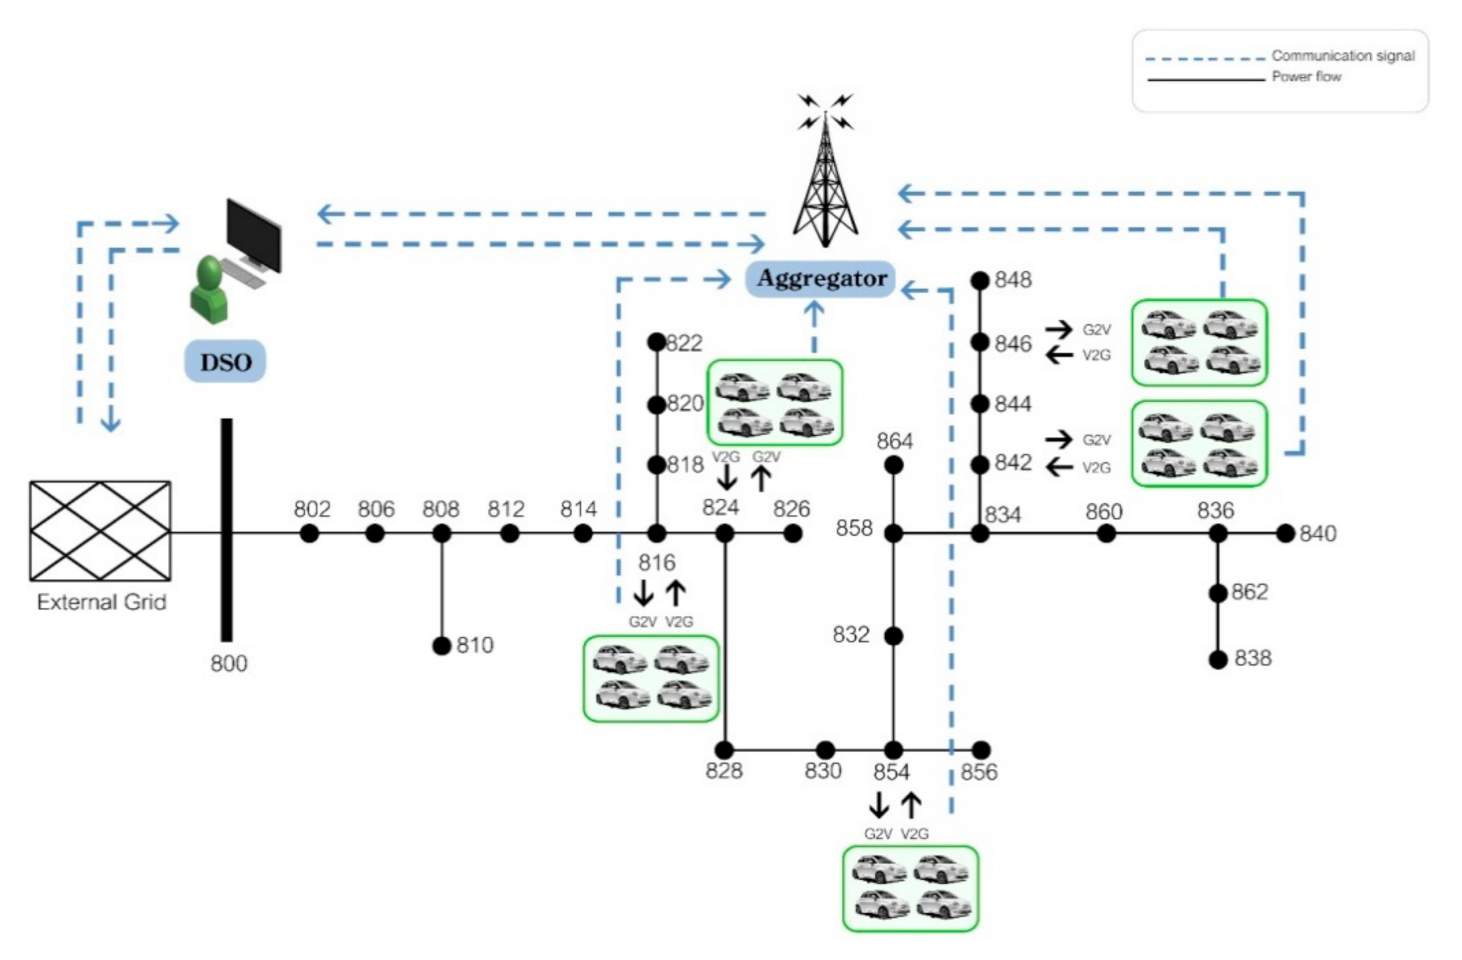
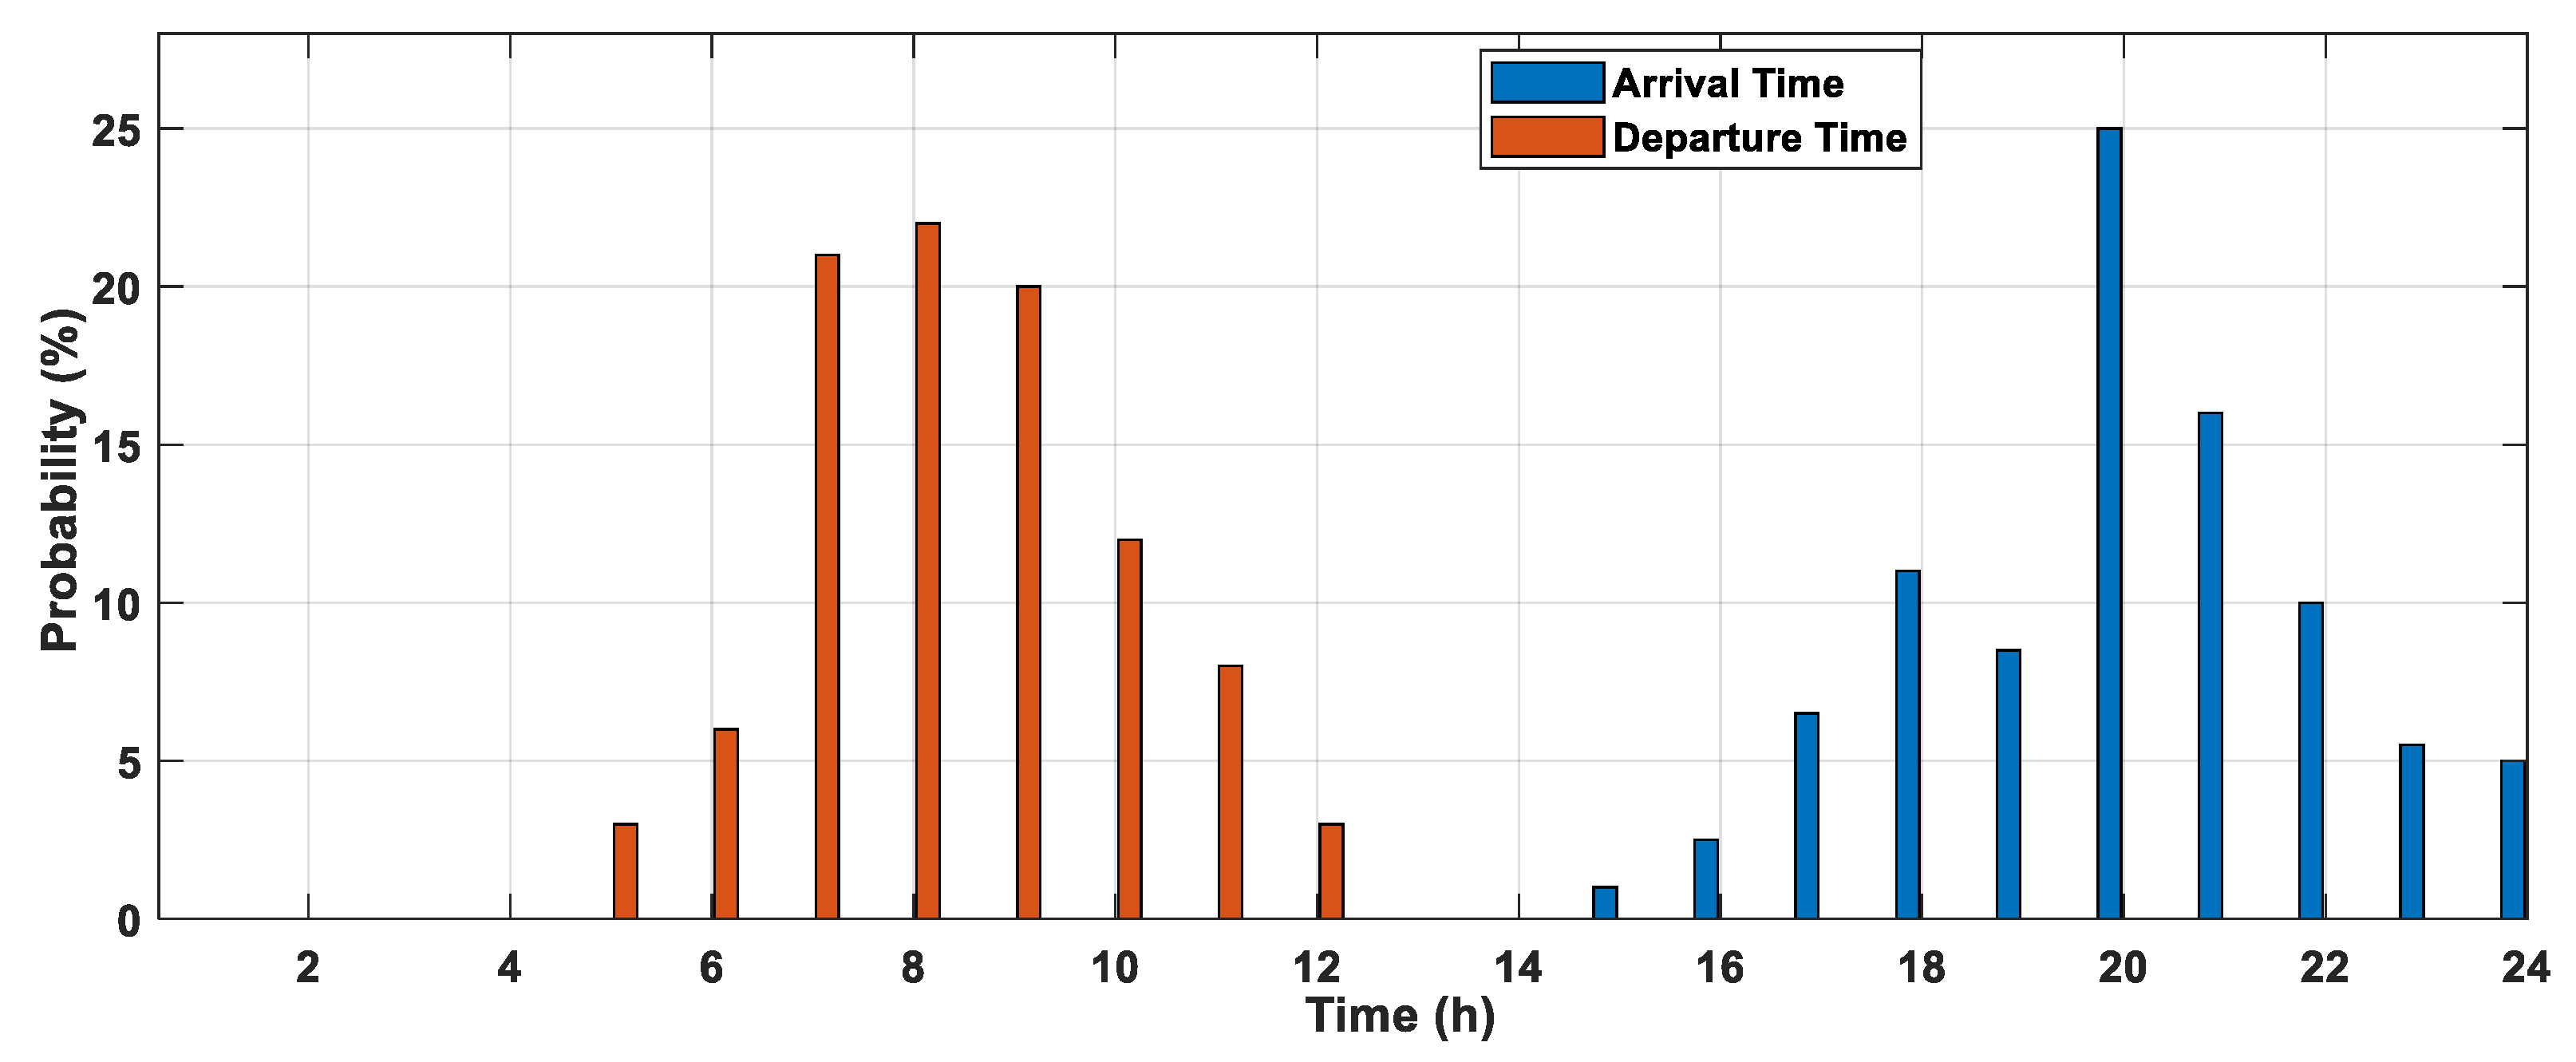
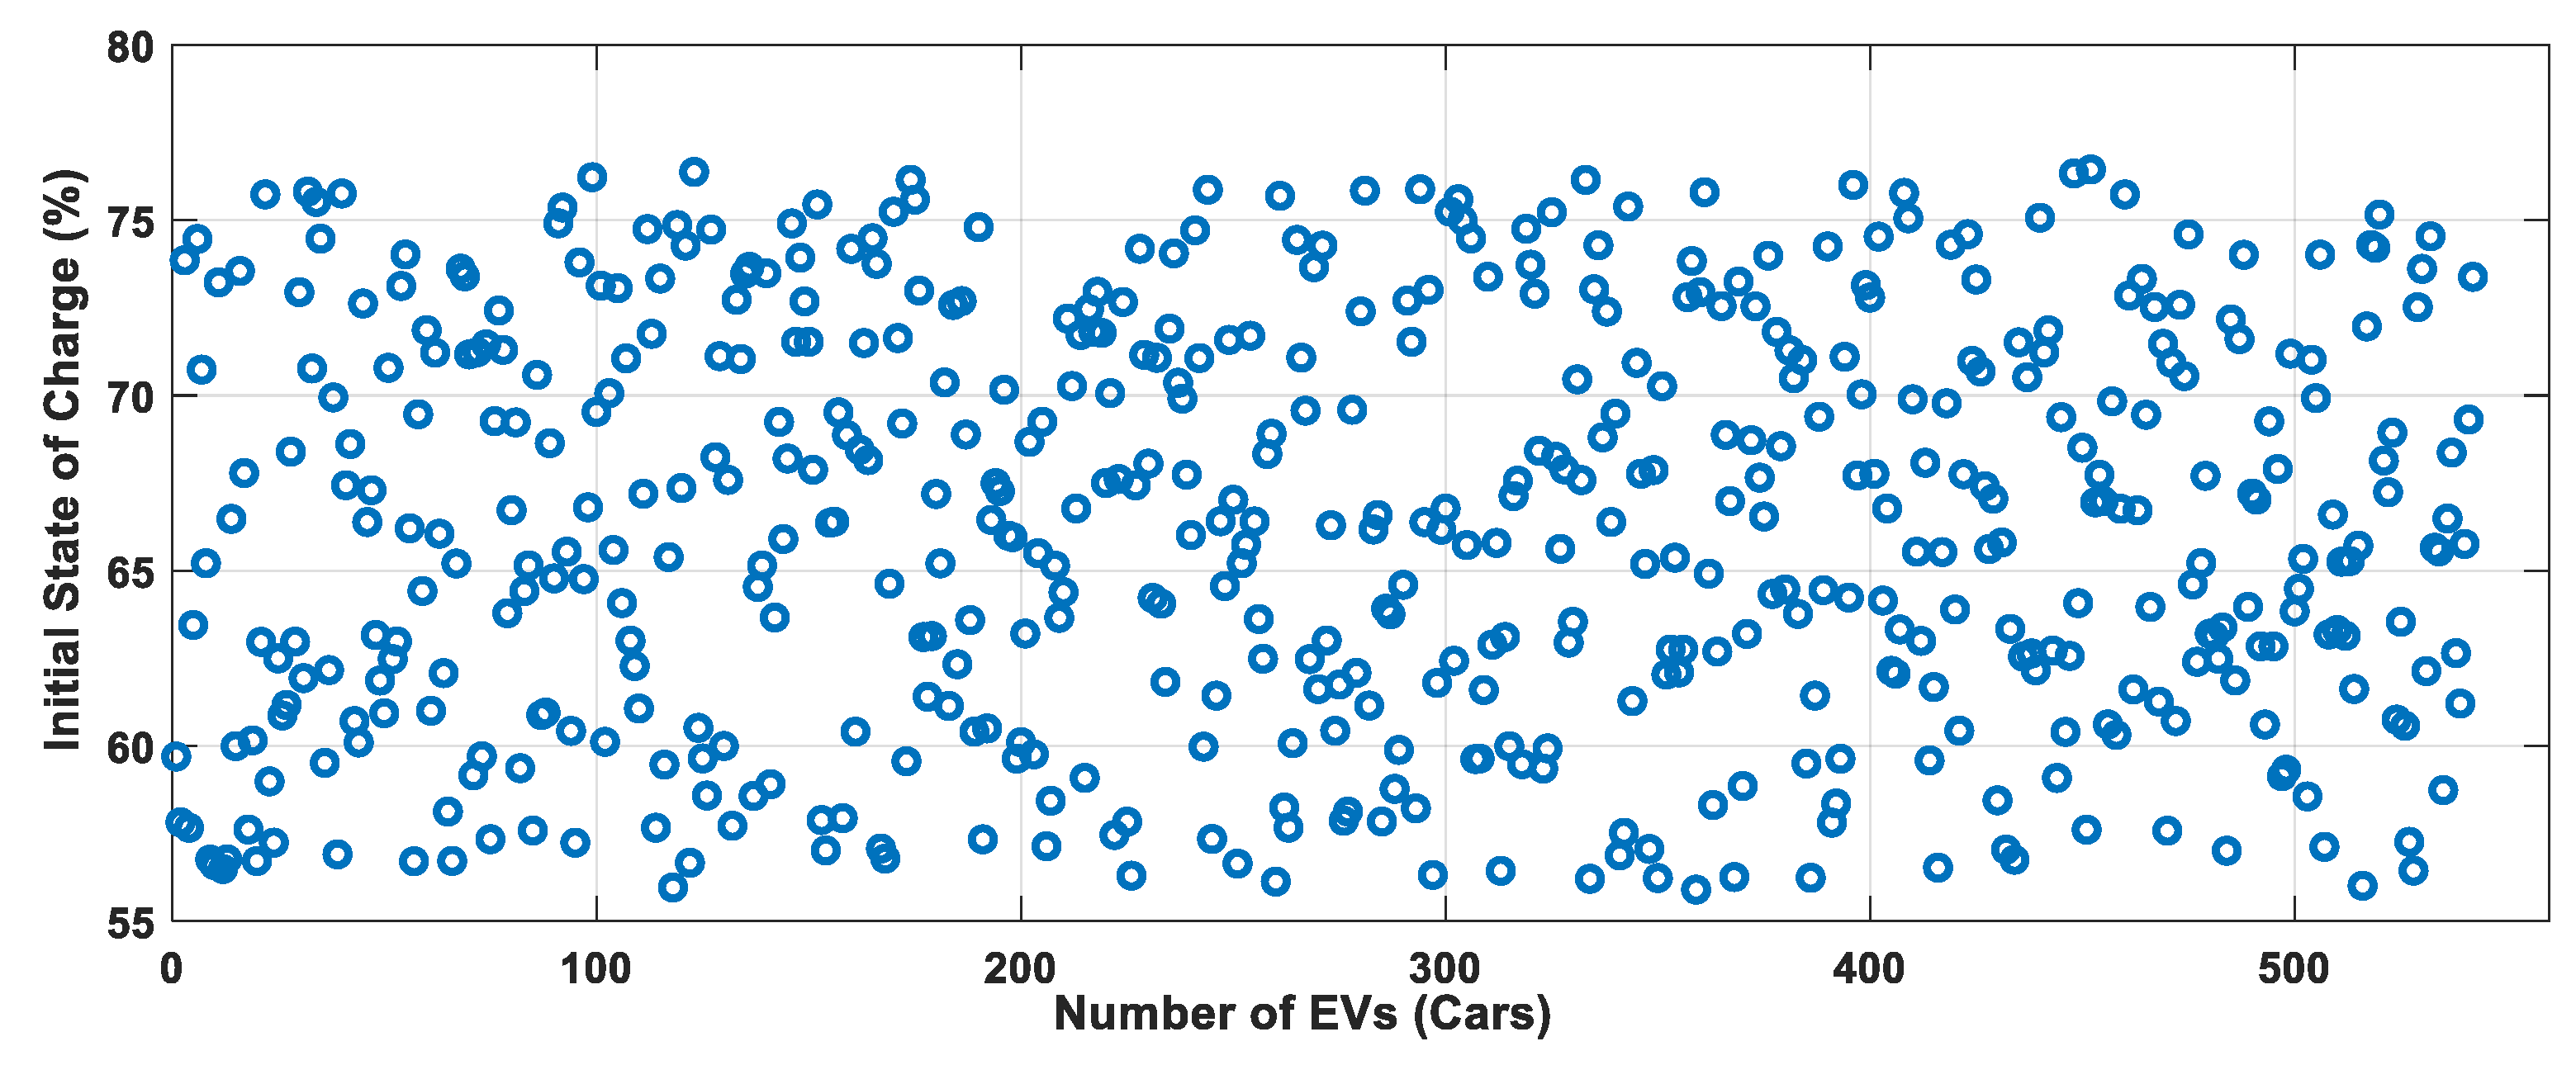
The first step requires the preparation of the data of EV-user behaviors, e.g., plug-in time, plug-out time, daily distance, initial SOC, wear costs, information of the test systems, such as the residential baseload, dynamic price, and significant parameters of the PSO optimization algorithm.
(ii).
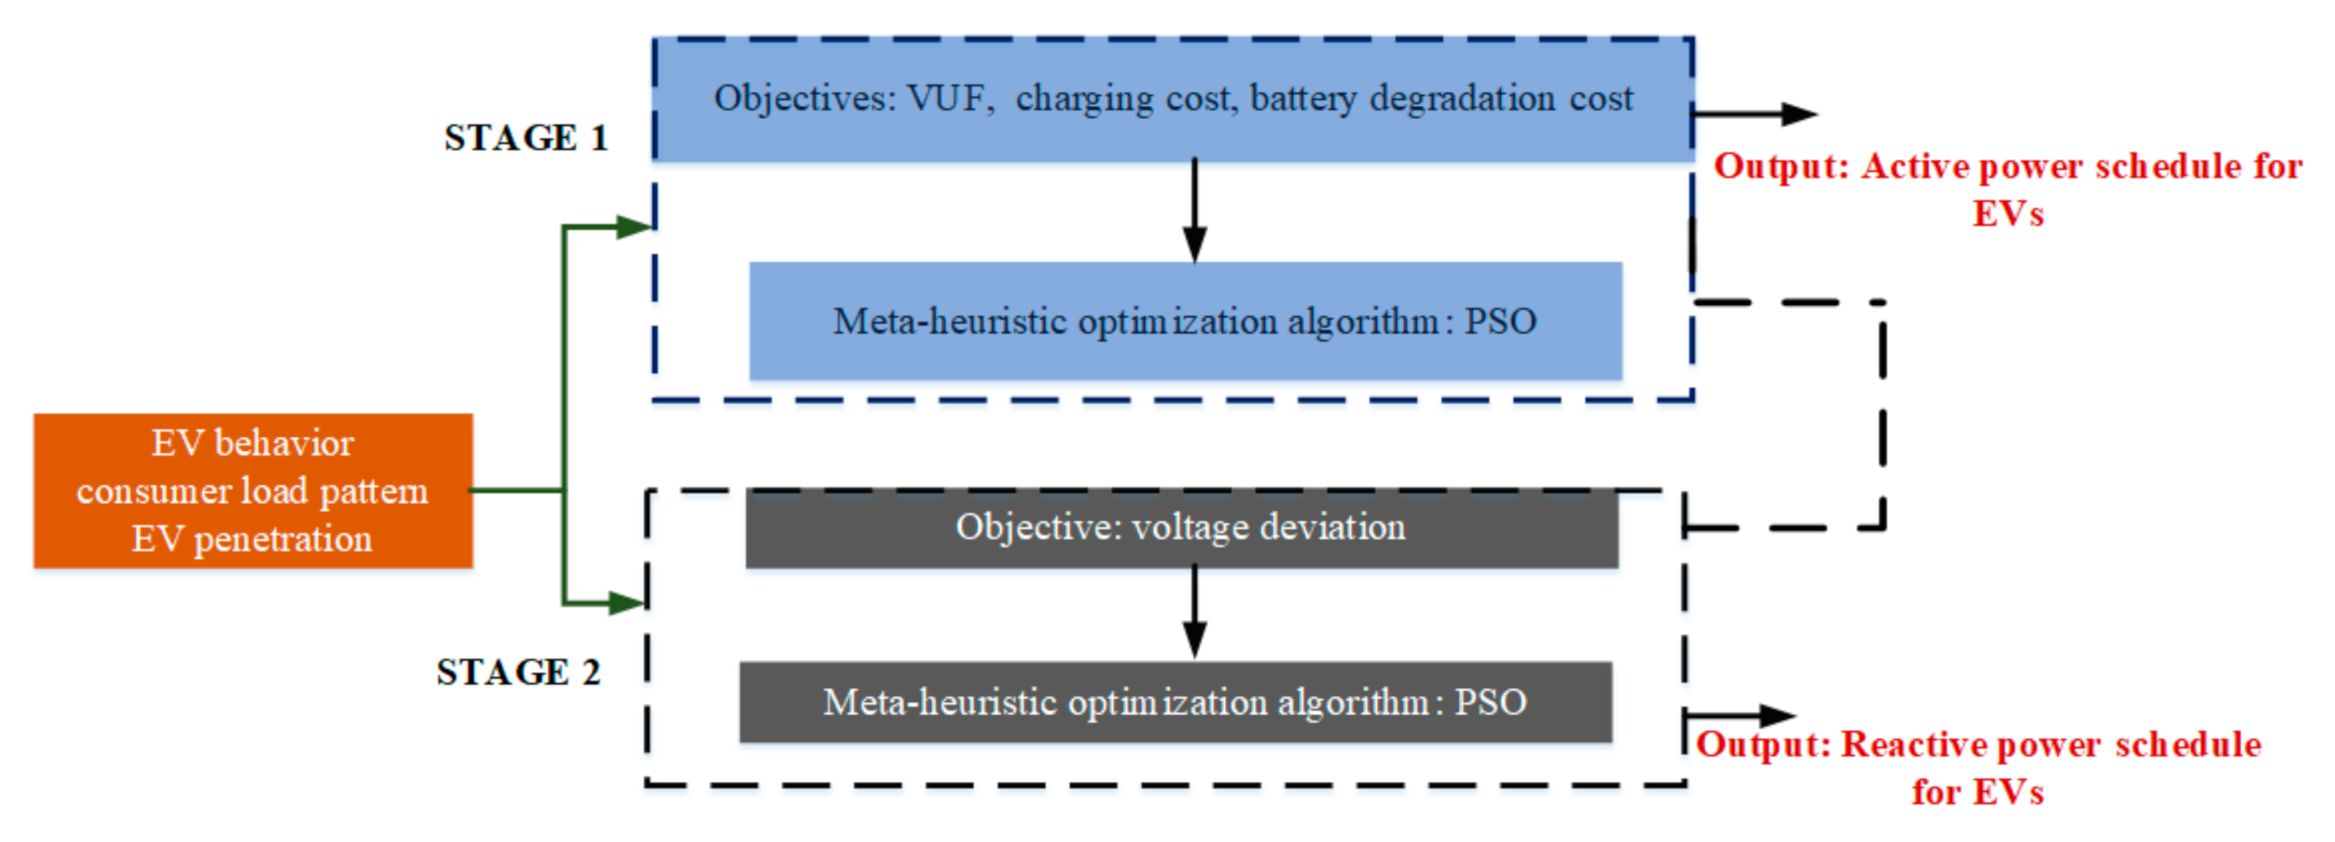
Stage 1 uses the input data from the previous step for further processing and formulates an optimization problem in which the objectives are to minimize VUF, EV charging costs, and battery degradation costs. This optimization problem is then solved using the PSO. The output from Stage 1 provides an optimized power schedule for charging (G2V)/discharging (V2G) as well as the best costs for customers.
(iii).
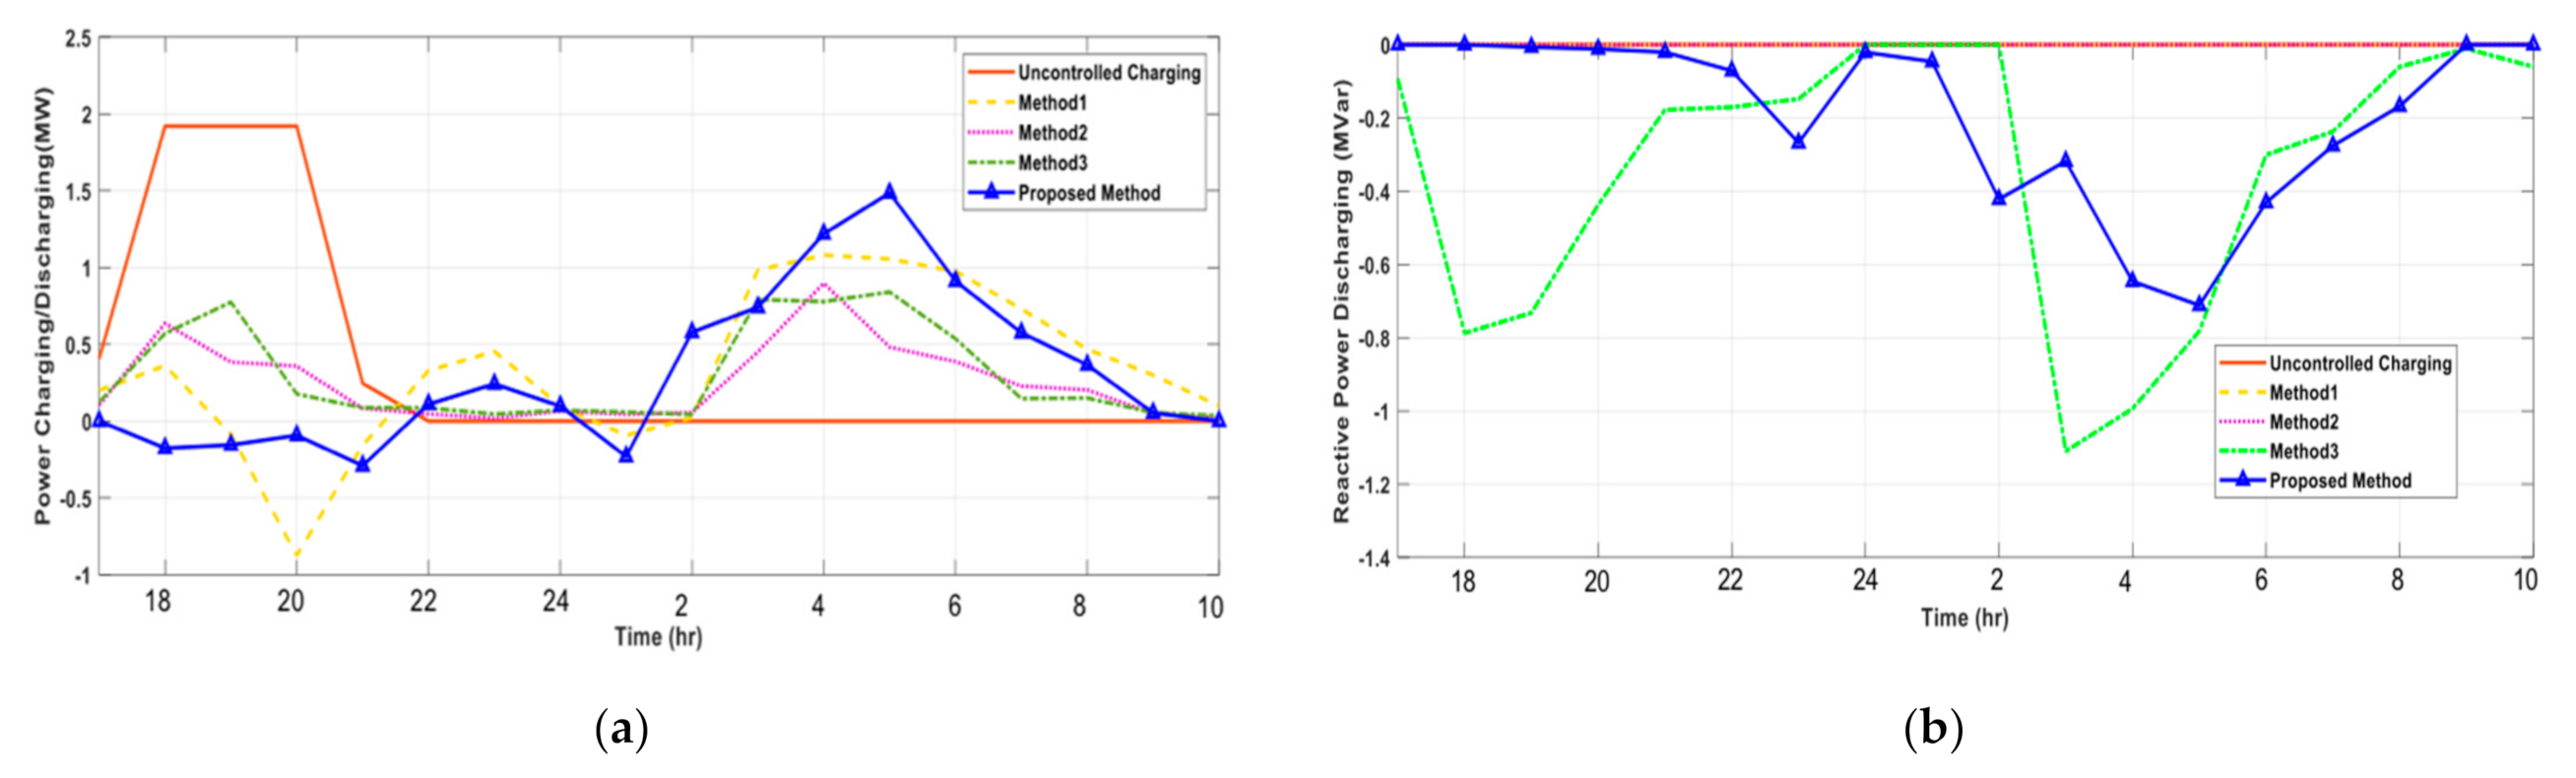
Once the electrical schedule for EVs is obtained, Stage 2 will use this information to formulate another optimization problem with the purpose of minimizing voltage deviation. The constraint to this optimization is the reactive power capability of V2Gs, which can be produced/absorbed by controlling the inverter [39,40]. Moreover, the reactive power compensation from EVs will not cause any degradation to the battery [41,42]. Thus, Stage 2 provides a reactive power schedule for EVs.

3. Optimization Problem Formulation

This section discusses the formulation of the optimization problem to mitigate different electrical problems, such as voltage unbalance factors and voltage deviations, minimization of customer charging, and battery degradation costs.

3.1. Objective Function

3.1.1. Voltage Unbalance

Voltage unbalance is given by Equation (1) and the goal is to minimize this quantity according to the IEEE standard [43] by controlling the active/reactive power from EVs.
F 1 = M i n i m i z e n = 1 N V n , t V n , t +
The minimization of F1 will reduce the VUF of the network.

3.1.2. Voltage Deviation

The second objective of the proposed approach is to minimize the voltage deviation between the actual and desired voltage values. This can also be controlled by charging/discharging of the active and reactive power from EVs.
F 2 = M i n i m i z e t = 1 24 n = 1 N | V M e a s ( n , t ) V Re f |
The minimization of F2 will help to keep the bus voltages closer to the desired values.

3.1.3. Customer Costs

A major objective from the customer perspective is to minimize charging costs and maximize discharging intervals. However, battery life will deteriorate if there is excessive discharging, and so this price (wp) must be included in the optimization problem and is calculated using the method described in [44]. The objective functions for customers are given by Equations (3) and (4).
F 3 = M i n i m i z e n = 1 N ( ( P E V _ C h g ( n , t ) × C t ) ( P E V _ D c h g ( n , t ) × R V 2 G ) ) × Δ t
The minimization of F3 will reduce the charging costs by managing charging/discharging in proper time.
F 4 = M i n i m i z e n = 1 N ( P E V _ C h g ( n , t ) η c h + P E V _ D c h g ( n , t ) η D c h ) w p × Δ t )
The minimization of F4 will help customers to decrease the battery degradation costs.

3.2. Constraints

All the objective functions given by Equations (1)–(4) are subject to several constraints. Equation (5) ensures that the number of EVs charging and discharging does not exceed the total number of EVs in the system. Equations (6) and (7) control EV charging and discharging, and Equations (8) and (9) ensure that EVs will not charge and discharge at the same time.
N C h g + N D c h g = N t o t a l
x C h g , i   P C h g M i n P C h g , i x C h g , i   P C h g M a x
x D c h g , i   P D c h g M i n P D c h g , i x D c h g , i   P D c h g M a x
x C h g , i ( 0 , 1 )
x D c h g , i ( 0 , 1 )
The constraints for the maximum efficiency of charging and discharging are presented in Equations (10) and (11), respectively. Equation (12) computes the maximum amount of available reactive power exchange from an EV, which is taken as 58% of the maximum rated power of EVs in this study [39,45]. Equation (13) defines the range of the reactive power discharge.
P E V _ C h g , i = η C h g × P C h g , i
P E V _ D c h g , i = P D c h g , i η D c h g
Q D c h g M a x , i = ( 0.58 × P E V _ C h g / D c h g , i )
Q D c h g M a x , i Q D c h g , i Q D c h g M a x , i
Equations (14)–(16) calculate the SOC values and helps them to be in the customer desired range.
S O C i , t = S O C i , t 1 + ( η c h × P E V _ C h g , i P E V _ D c h g , i η D c h ) P N C , i
S O C min S O C i , t S O C max
S O C f i n a l = S O C d e s i r e d
Equations (17) and (18) are the power flow constraints.
P i , t P d , i , t V i , t j = 1 N b u s V j , t ( G i j cos ϕ i j , t + B i j sin ϕ i j , t ) = 0
Q i , t Q d , i , t V i , t j = 1 N b u s V j , t ( G i j cos ϕ i j , t + B i j sin ϕ i j , t ) = 0

4. Application of PSO to Solve the Proposed Optimization Problem

Meta-heuristic optimization algorithms are highly popular for solving complex, non-linear, and non-convex optimization problems. Particle swarm optimization (PSO) is one such popular meta-heuristic optimization algorithm and is based on swarm-intelligence, which is popularly used to obtain a global solution for several problems [46]. PSO uses the position and velocity of swarms to find a global solution. Thus, it was chosen to solve the proposed optimization problem formulated in the previous section of this paper.
The proposed method is used for minimizing four objective functions (VUF, VD, CC, BC). A high penetration with different phase connections can cause voltage unbalance and voltage deviations. The proposed method is separated into two stages, where the first stage aims to minimize voltage unbalance, charging costs, and battery degradation costs by using active power as a decision variable. The second stage aims only to minimize voltage deviation by obtaining the optimal active power to calculate the proportional reactive power, which is the decision variable of the second stage. The advantage of dealing with voltage deviation in the second stage is to avoid overvoltage occurring in some time intervals if it is located in first stage, and it is able to improve positive sequence voltage, which reduces voltage deviation, as well as VUF, according to Equation (6). Another advantage is that decreasing the objectives in the first stage decreases complicated searching of global optimal solution.
The major steps of the proposed method are shown in Figure 3 and are as follows:
Step 1: Specification of the total number of iterations, population size, and hours (h).
Step 2: Random initialization of the particle position according to the population size in each bus that connects to EVs.
P E V = [ P E V , 1 j , P E V , 2 j , P E V , 3 j , P E V , i j ]
Step 3: Find the position of P E V , i at j + 1   iteration P E V , i j + 1 and velocity of the P E V , i j + 1 at j + 1   iteration v i j + 1 as:
P E V , i j + 1 = P E V , i j + v i j + 1
v i j + 1 = ω v i j + c 1 r a n d 1 j ( p b e s t i j P E V , i j ) + c 2 r a n d 2 j ( g b e s t k j P E V , i j )
Step 4: Calculate the fitness values for the Stage I objective functions given by Equations (1), (3), and (4). The weight sum method is used to combine the multiple objectives into a single one.
M i n x F w s = θ 1 ( F 1 ( x ) / F 1 , n o r ) + θ 2 ( F 2 ( x ) / F 2 , n o r ) + θ n ( F n ( x ) / F n , n o r )
This process utilizes DIgSILENT software to run the unbalance load flow and obtain the value of the fitness function.
Step 5: PSO will then compare the obtained fitness with the global best solution. The global best solution is changed if the local best solution is better.
Step 6: Continue until a maximum number of iterations is reached.
Step 7: Proceed to the second stage and initialize the constraints according to the population size for each bus, which has EVs, using Equation (23) when EVs are charging and discharging.
Q E V = [ Q E V , 1 j , Q E V , 2 j , Q E V , 3 j , Q E V , i j ]
Step 8: Find the position of the particle at j + 1 iteration Q E V , i j + 1 and velocity of the particle at j + 1 iteration v i j + 1 as Step 3.
Q E V , i j + 1 = Q E V , i j + v i j + 1
v i j + 1 = ω v i , k j + c 1 × r a n d 1 j ( p b e s t i , k j Q E V , i j ) + c 2 × r a n d 2 j ( g b e s t k j Q E V , i j )
Step 9: Compute the fitness function by solving Equation (6). This step utilizes DIgSILENT software.
Step 10: Find the best current and global solution.
Step 11: Continue until a maximum number of iterations is reached.
Step 12: Store the optimal PChg, PDchg, QDchg,G2V, QDchg,V2G.
Step 13: Increase the hours and stop when the maximum hour is reached.
Step 14: Generate the final schedule for the EVs.

5. Simulation Results and Discussion

5.1. Description of the Test System

This study uses the IEEE 34 distribution system as the test system. The EVs are added randomly at buses 816, 824, 854, 842, and 846, as shown in Figure 1. The residential load profile for this study is taken from [47] and the charging/discharging price is taken from [48]. This study assumes all EVs are a Nissan Leaf model, and the battery size and the range under full charge are 24 kWh and 170 km, respectively [49]. A Board Level II Type charger is assumed to be used in this study. This is a single-phase AC IEC 61851-1 standard charger that connects to AC with a rating of 240 V and 32 A [50]. The driving behavior is generated randomly for all EV users based on data from [51]. The arrival/departure times (Figure 4) are randomly generated from [34]. Moreover, a daily distance of around 40–75 km a day is used to calculate the initial state of charge given by Equation (26) and is also shown in Figure 5. Different EV penetration levels have been used for this study, and the details are given in Table 2.
S O C I n i t i a l = 100 % × ( D M D D ) D M
The proposed method is analyzed under three different scenarios: case study when EV penetration varies from 30% to 100% (Table 2), case study when there are different price signals according to seasons (Figure 6), and case study when there are different load profiles according to weekdays and weekends (Figure 7). Furthermore, we also compared the performance of the proposed method to four other methods.
Uncontrolled Charging: EV charging when the users arrives (the arrival time is assigned randomly from 5:00 p.m. to 12:00 a.m., as shown in Figure 4).
Randomly as:
Method 1: CC, VUF, VD with P-V2G (both system and customer objectives) [29,30]
Method 2: CC, BC (only customer objective) [26,27,28]
Method 3: VUF, VD with Q-V2G (only system objective) [31,32,33,34]
All the results are only shown for bus 846 and in the 5 p.m.–10 a.m. time period, which represents the worst-case scenarios for this study. Table 3 and Table 4 show the simulation parameters for the constraints and PSO used in this study, respectively.

5.2. Results and Discussion under Different Scenarios

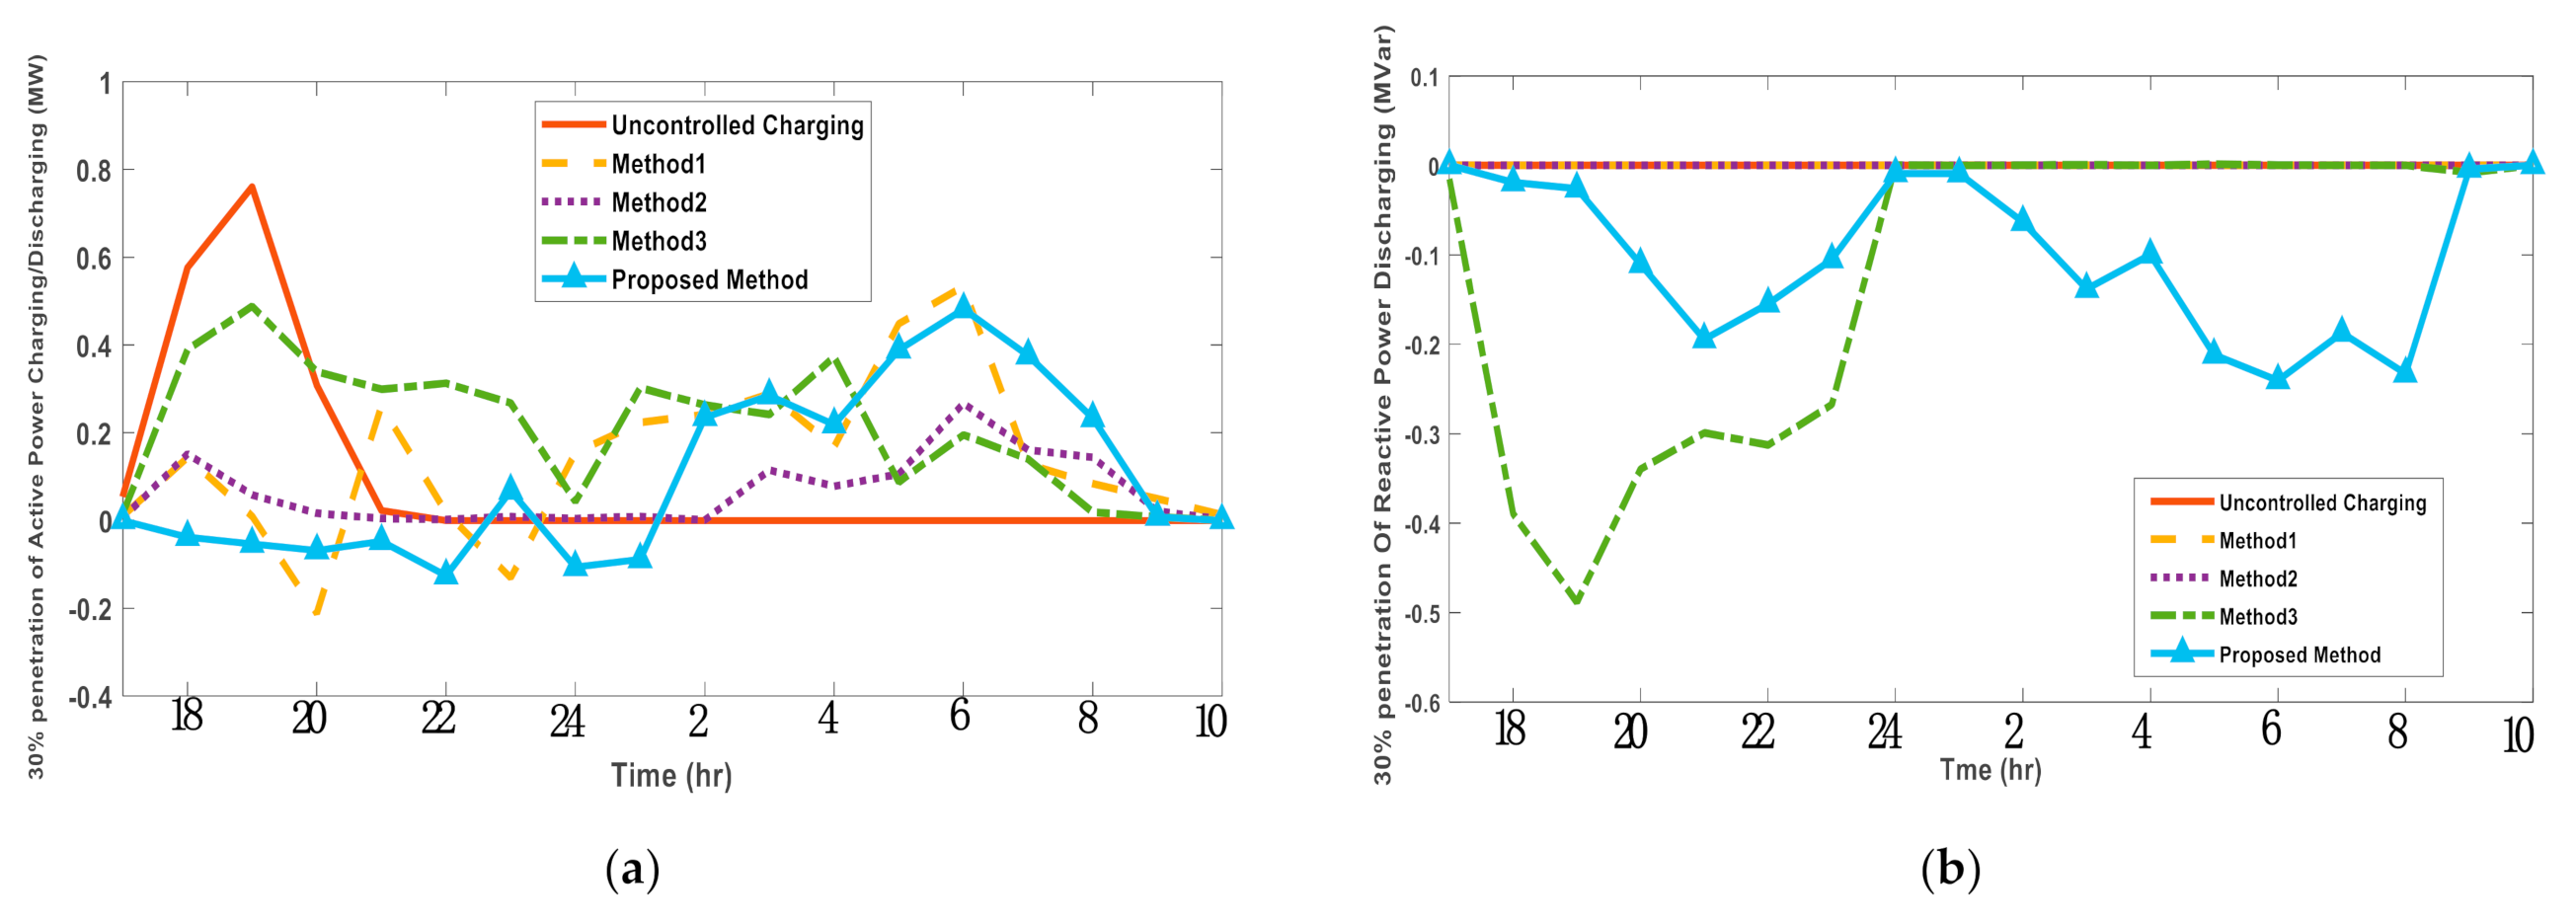
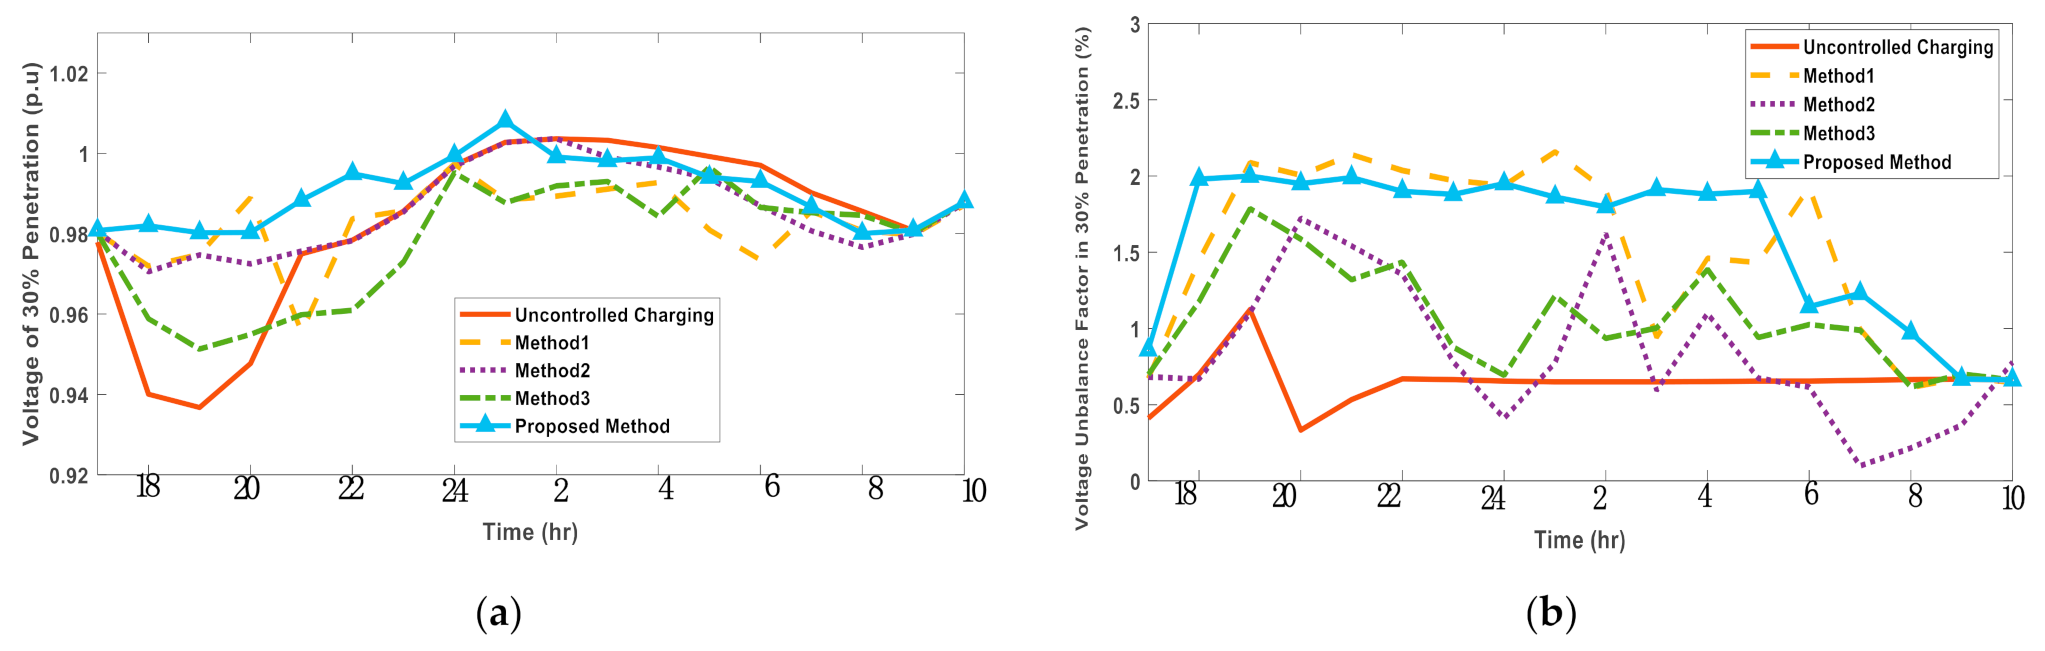
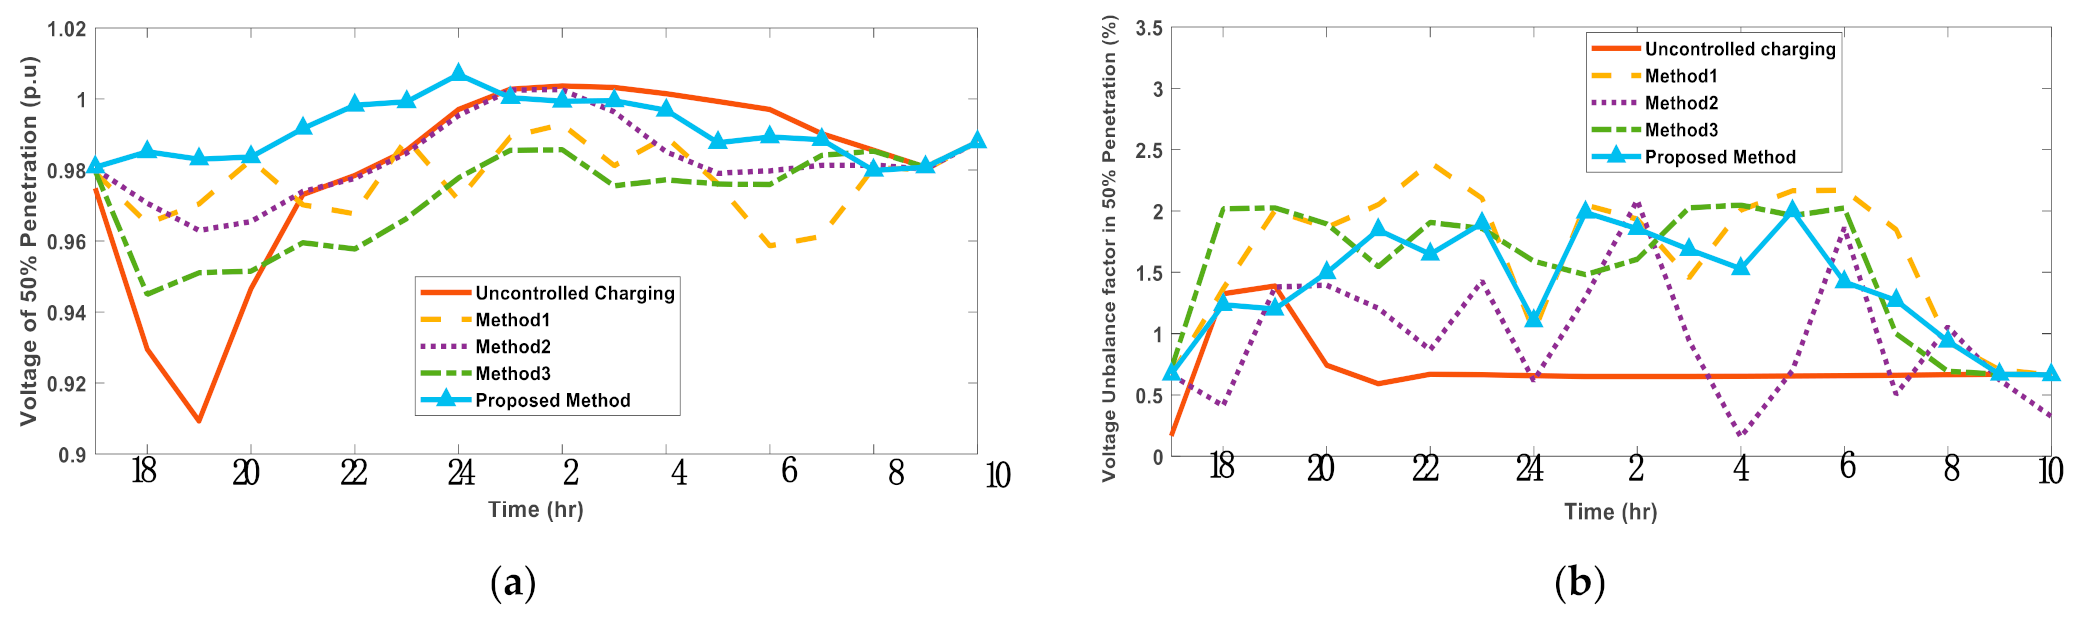
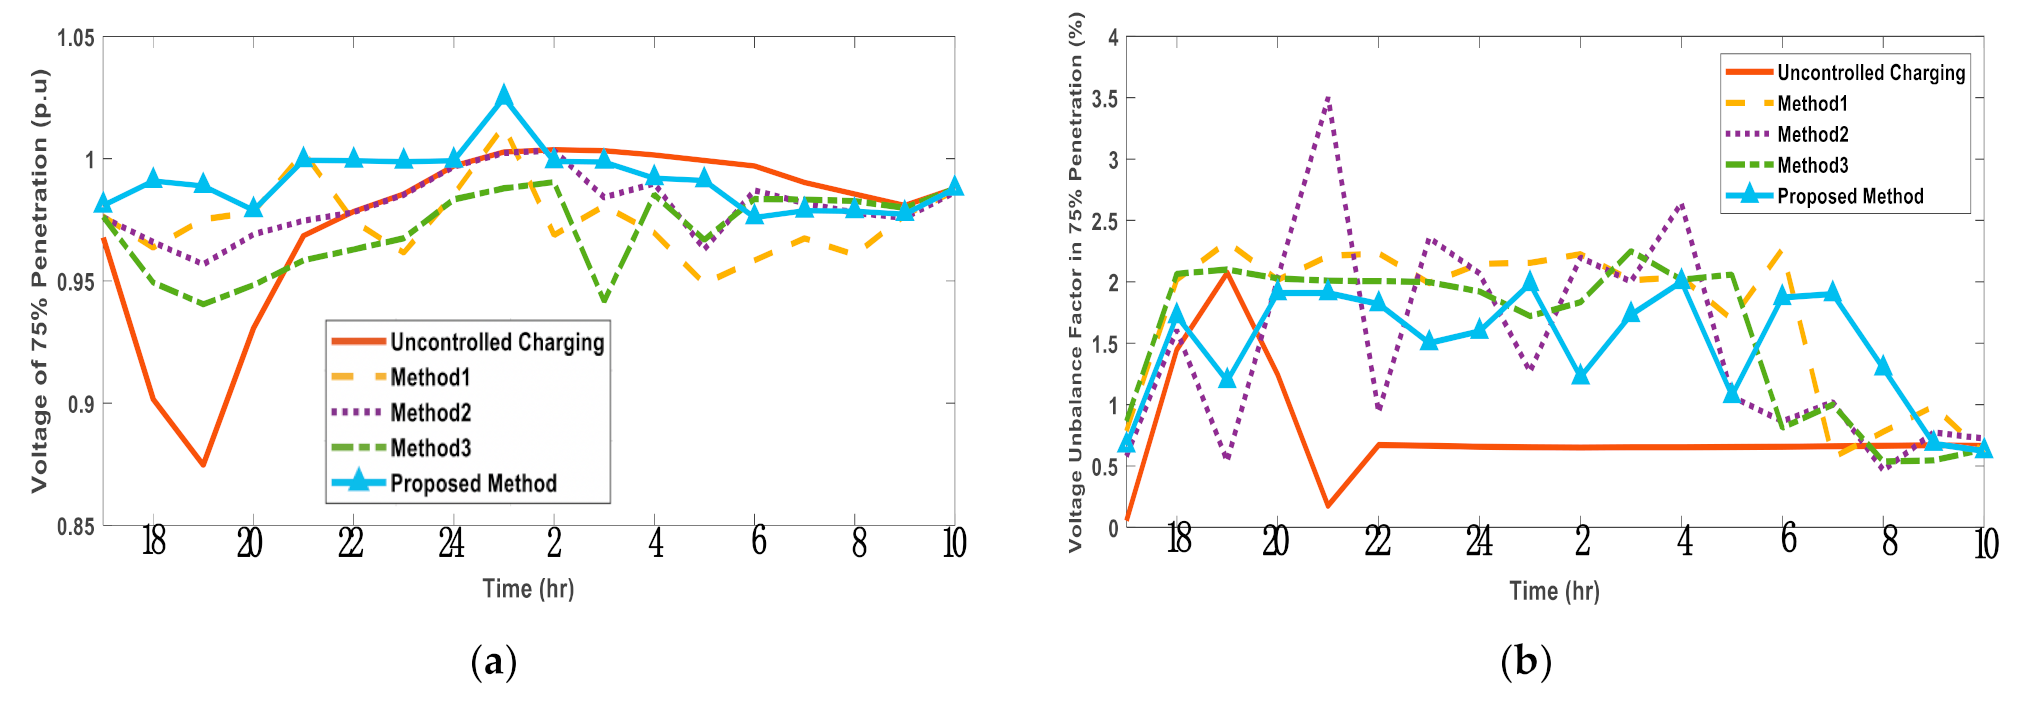
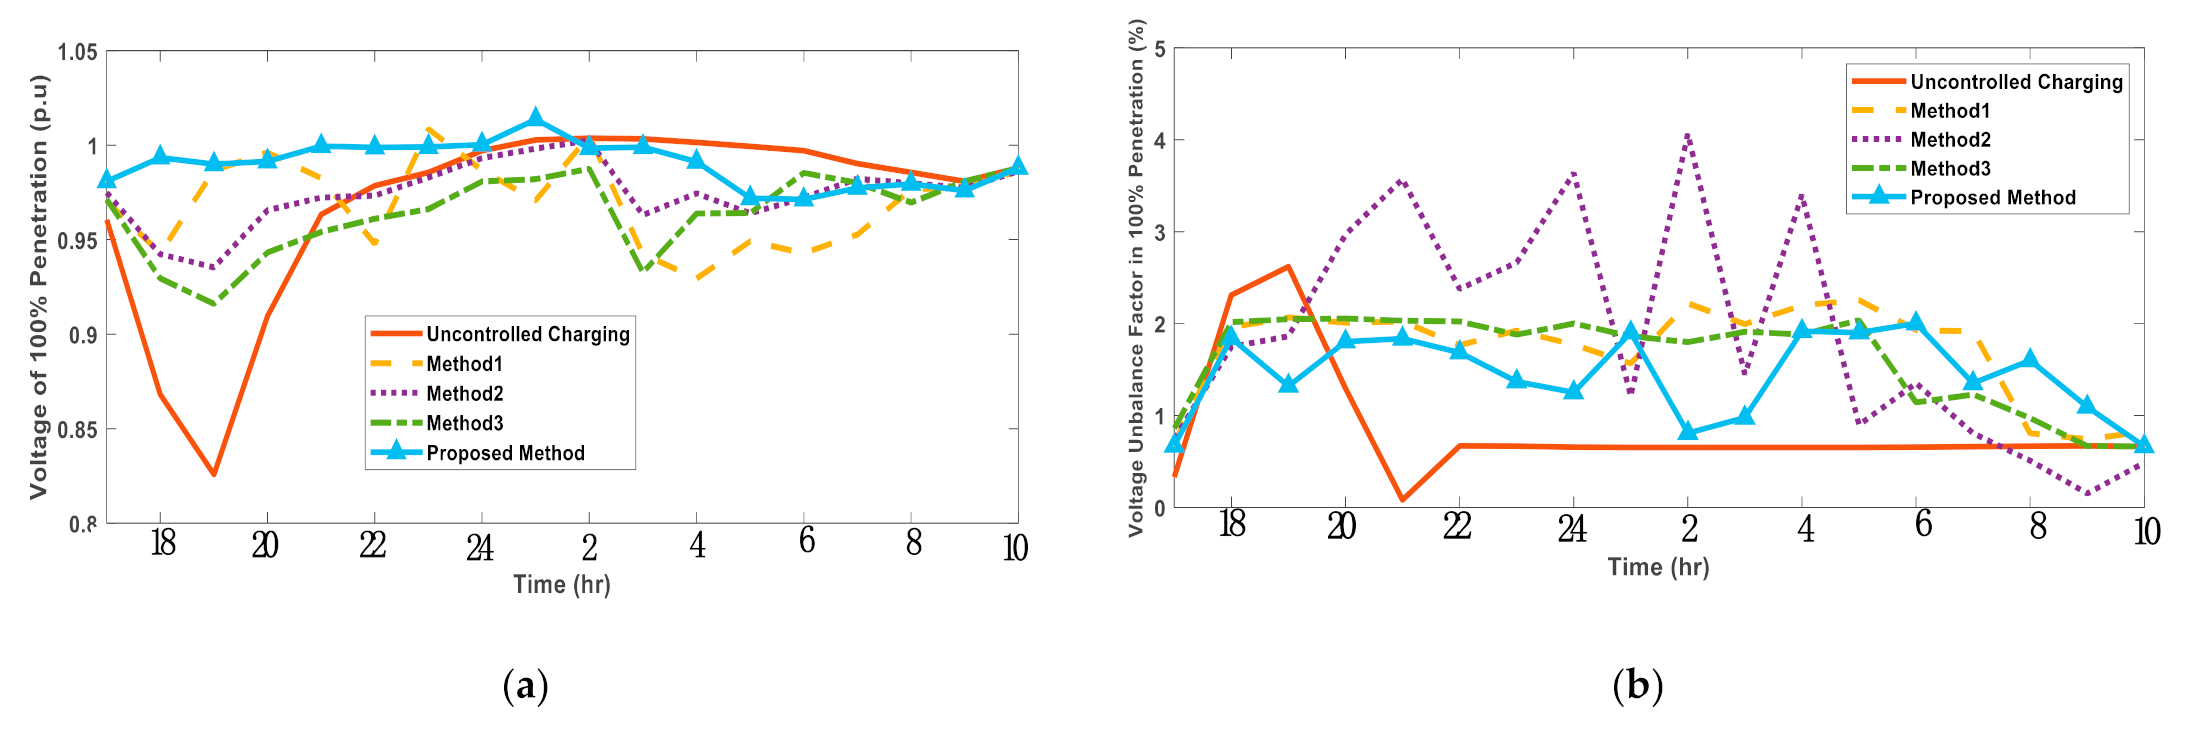
5.2.1. Case Study under Different EV Penetration Levels

This case study analyzes the performance of different methods for different penetration levels. At 30% penetration, we can observe from Figure 8a that the proposed method activates the V2G mode during the peak period and starts charging during the off-peak period. Similarly, the reactive power discharge with the proposed method can be seen in Figure 8b. Figure 9a shows that there is a severe undervoltage problem with uncoordinated charging during peak load conditions, whereas the system voltage is close to the desired limit with the proposed method. We can observe from Figure 9b that the VUF lies under 2% for all methods except Method 1.
Figure 10a shows the result for 50% penetration; it can be seen that Methods 1 and 3 are unable to maintain the voltage level near the prescribed limit (±5%) for this case study. The other methods, however, can keep the bus voltage at the prescribed limits. The plot of VUF, as shown by Figure 10b, shows that the VUF also lies within the prescribed limit of the proposed method for this case study.
At 75% penetration, the bus voltage profile is improved for most methods, but lies closest to the desired voltage with the proposed method, as shown by Figure 11a. The plot of VUF as given by Figure 11b shows that the VUF exceeds the 2% limit with other methods but it lies within the limits for the proposed method.
Figure 12a,b shows the plots of the bus voltage and VUF at a 100% penetration level. It can be seen from the figures that both the bus voltage and the VUF also lie within the prescribed limits using the proposed method compared to other methods.
Figure 13 shows that the final SOC lies within the desired limits for customers with the application of the proposed method.

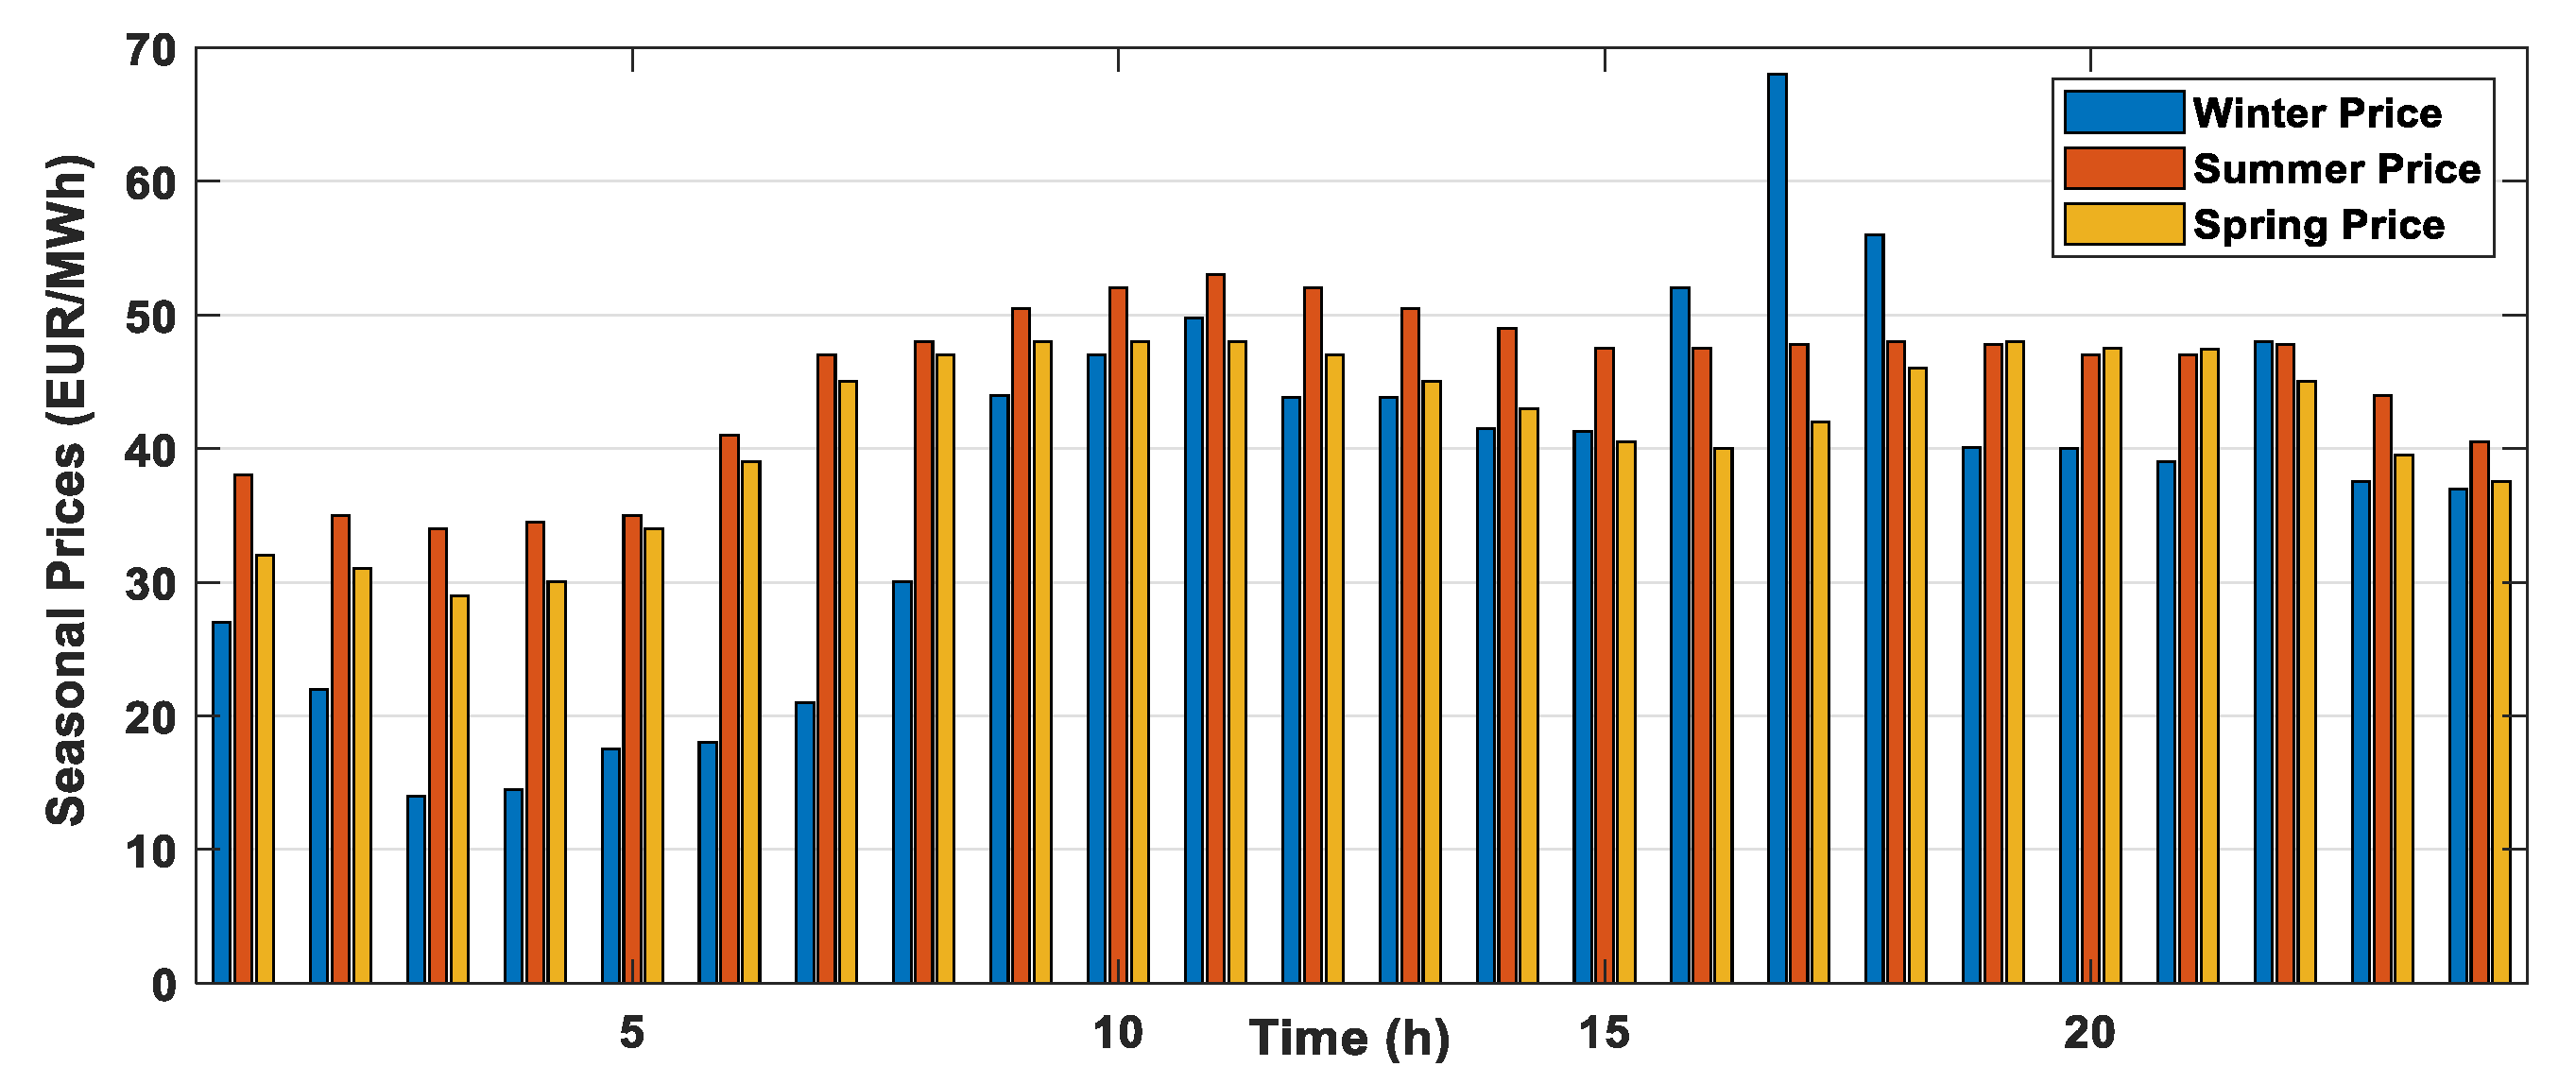
5.2.2. Case Study under Different Price Signals

This scenario considers analysis under different price signals. Three price signals corresponding to three different seasons (winter, summer, and spring on weekdays) have been considered for the analysis. An EV penetration of 100% is assumed for this scenario as it represents the worst-case scenario based on the results obtained in the previous section.
Figure 14a,b shows the active and reactive power schedules obtained using different methods. The plot given in Figure 15a, shows that the bus voltage lies well below the prescribed limit with uncoordinated charging. However, the voltage profile improves with Method 1 and is nearest to the prescribed limit with the proposed method. The plot of VUF as shown by Figure 15b shows that the VUF is worse with Method 2 but lies within the limit for the other methods. A similar inference can also be made from Figure 16 and Figure 17 regarding voltage and VUF for other seasonal price variations.
Figure 18a–c shows that the total costs for the winter, summer, and spring seasons are lowest with the proposed method, but the battery degradation costs are a little bit expensive with the proposed method. However, the revenue savings from the charging costs and the reward from V2G far outweigh the battery degradation costs with the proposed method.
We can observe from Table 5 that the total cost is lowest with the proposed method compared to the other methods and the VUF and voltage also lie within the prescribed limits for this scenario.

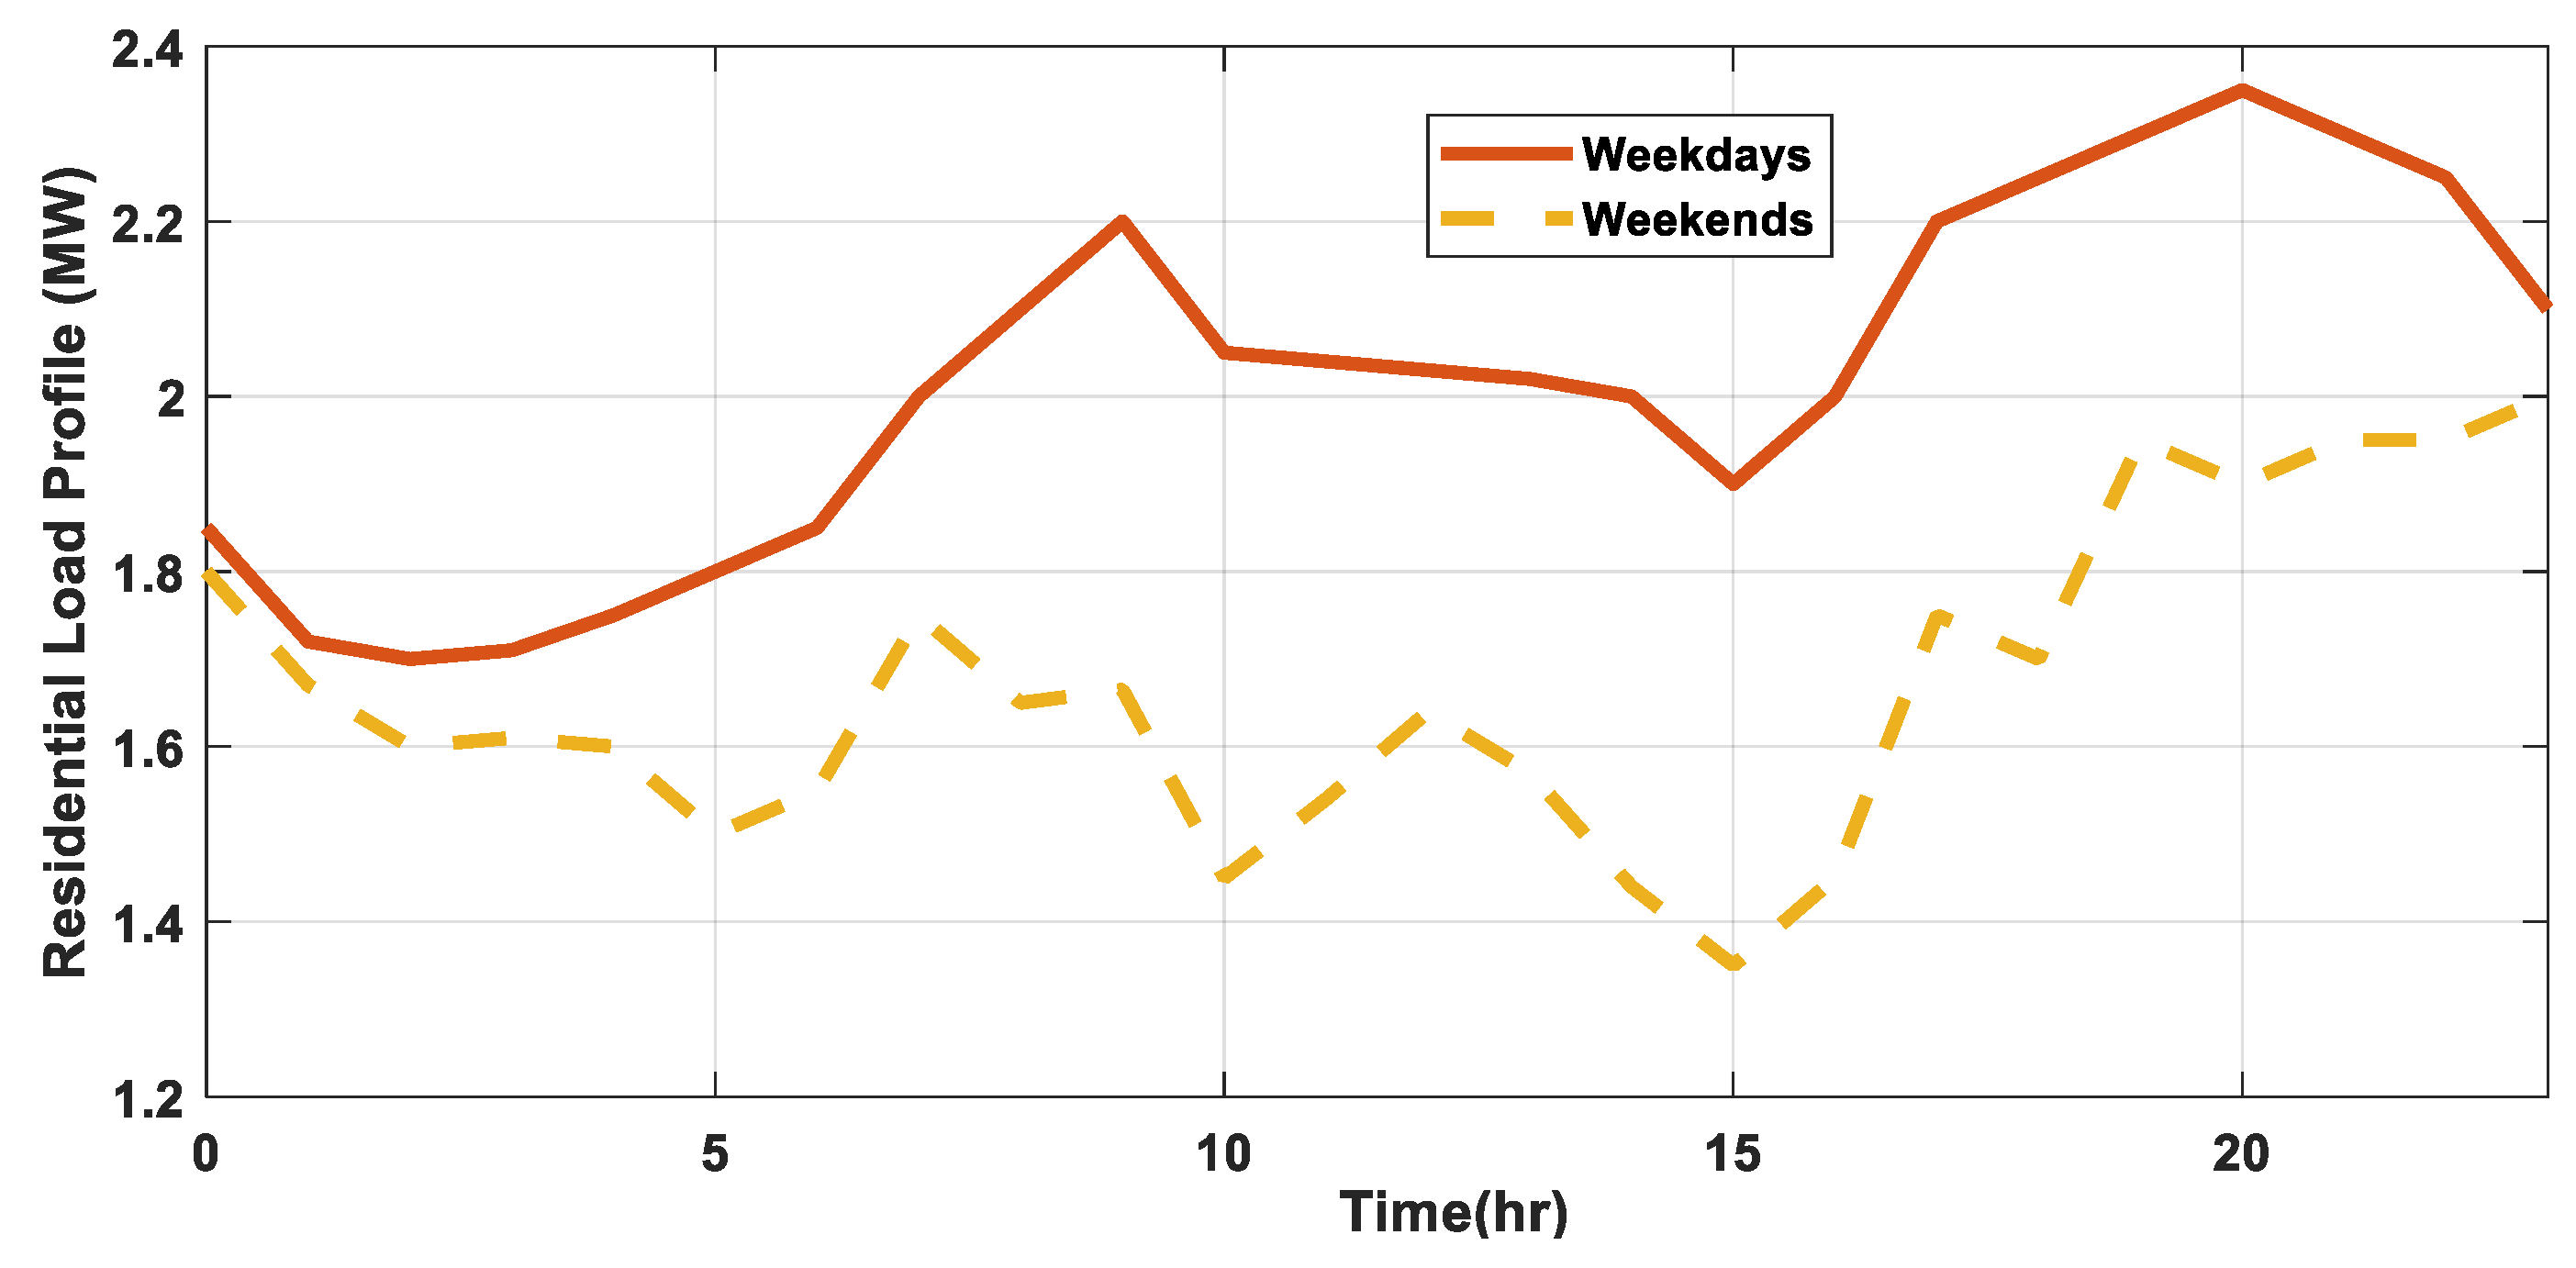
5.2.3. Case Study under Weekend Load Profile

This scenario considers an analysis of the weekend load profile for domestic consumers (Figure 7). From the previous case study, it can be assumed that the proposed method is able to provide VUF, voltage in prescribed limits with the lowest total cost.
Figure 19a,b shows the active and reactive power schedule obtained using different methods under this scenario, and it can be seen that the proposed method charges and discharges less under peak load hours. The plot of the bus voltage as given by Figure 20a shows that the bus voltage lies well below the prescribed limit with uncoordinated charging. However, the voltage profile is nearest to the prescribed limit with the proposed method for this case study as well. The VUF, as shown by Figure 20b, shows that the VUF lies within limits with the proposed method, for both weekdays and weekends.
Figure 21a shows that the proposed method is able to provide the lowest total cost for weekdays/weekends for different residential power demands, which can also be inferred from the results in Table 6. Figure 21b shows that the final SOC lies within the prescribed limits for weekends with the application of the proposed method.

5.2.4. Discussion

The results from the case study under different EV penetration levels show that the voltage deviation problem gets worse when EV penetration ranges from 30% to 100% in uncoordinated charging, and the voltage unbalance problem get worse when EV penetration ranges from 75% to 100% with uncoordinated charging. The results show that all of these problems are reduced with the proposed method and that the final desired SOC is maintained.
In the case study under different EV price signals, the impact of voltage deviation and the voltage unbalance problem is worst with uncoordinated charging. The proposed method schedules times for charging/discharging of both the active power and reactive power of EVs in such a manner that it largely improves voltage profile and reduces VUF with customer benefits compared to the uncoordinated charging.
In the case study under a weekend load profile, the voltage unbalance problem does not occur with uncoordinated charging but the bus voltage is below the desired limit. The proposed method is capable of scheduling EVs to improve both the system and customer requirements.
However, battery degradation costs with the proposed method, in all case studies, are a bit higher than with uncoordinated charging, Method 2, Method 3, and Method 4, but the benefits from the total costs are better with proposed method, which helps to outweigh this drawback.
Method 2 is exclusively designed to minimize the charging costs and battery degradation costs and thus the total cost is the second lowest after the proposed method. However, as the researchers do not control VUF, its value is high compared to other methods for all seasons. This shows that EVs with V2G have to consider VUF failure, which can lead to deterioration of the system.
This study shows that battery degradation has little impact on voltage deviation. However, it is an important objective to consider as it directly affects battery lifetime.

6. Conclusions

This paper proposes a two-stage approach to schedule EV charging with both G2V and V2G capabilities to improve grid voltage, reduce VUF, and reduce prosumer charging costs.
Our study yielded the following findings:
(i).
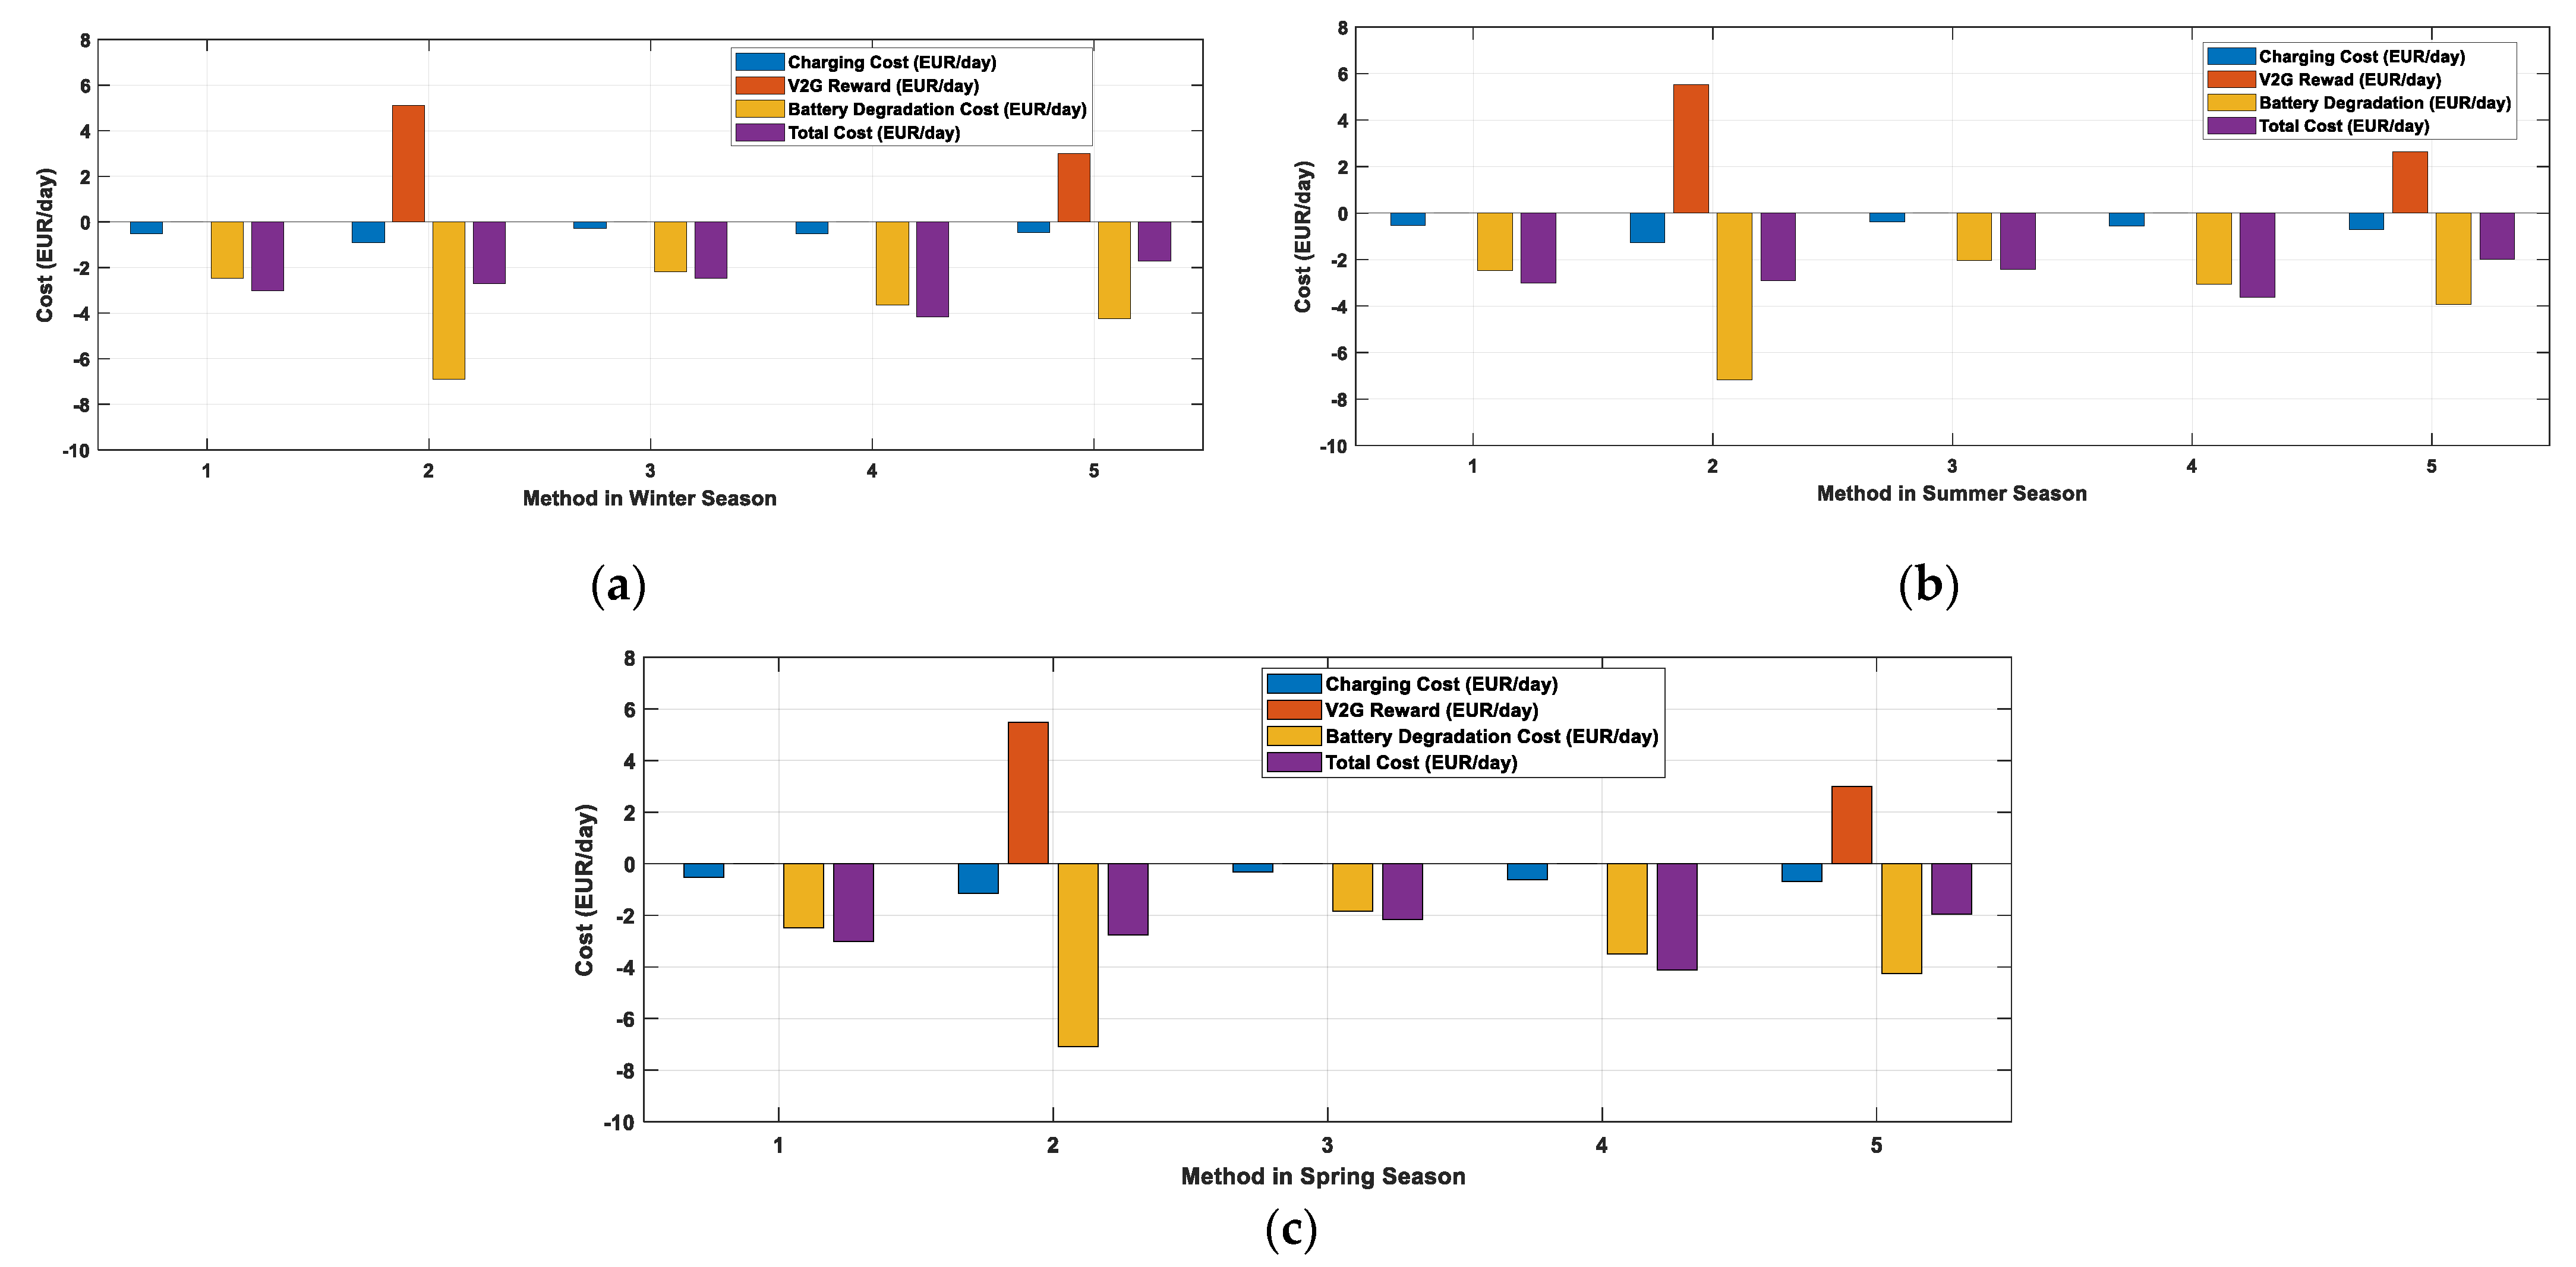
The proposed method provides the lowest cost for customers to charge/discharge their EVs compared with other existing methods for all the scenarios considered in this study. For the summer season, the total cost using the proposed method is around 1.515 times lower than uncontrolled charging and 1.206 times lower than the result obtained using the method which provided the least cost next to the proposed method. A similar trend was seen for other scenarios considered in this study.
(ii).
The battery degradation costs with the proposed method are around 1.756 times lower than Method 1 but 1.64, 1.86, and 1.37 times higher than with uncontrolled charging, and Methods 2 and 3, respectively, when EV penetration is 100%. Similar results were obtained for other case studies taken in this paper.
(iii).
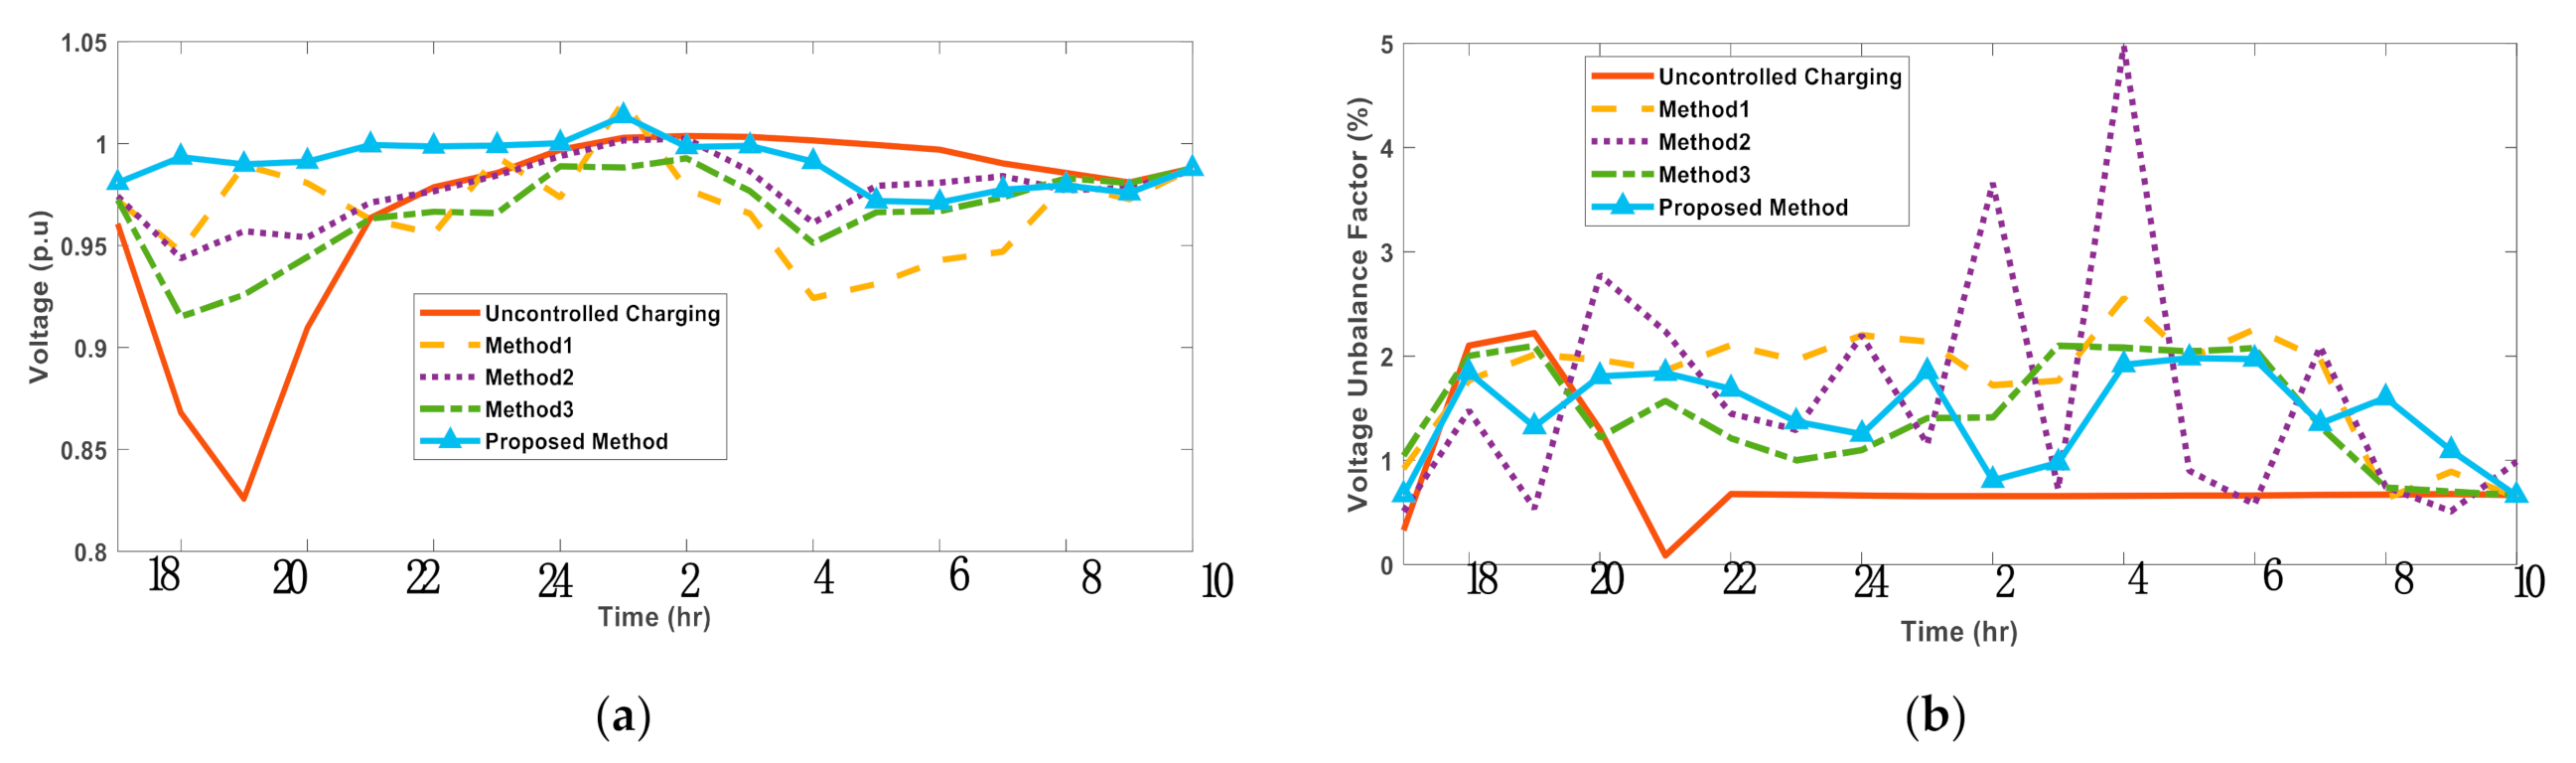
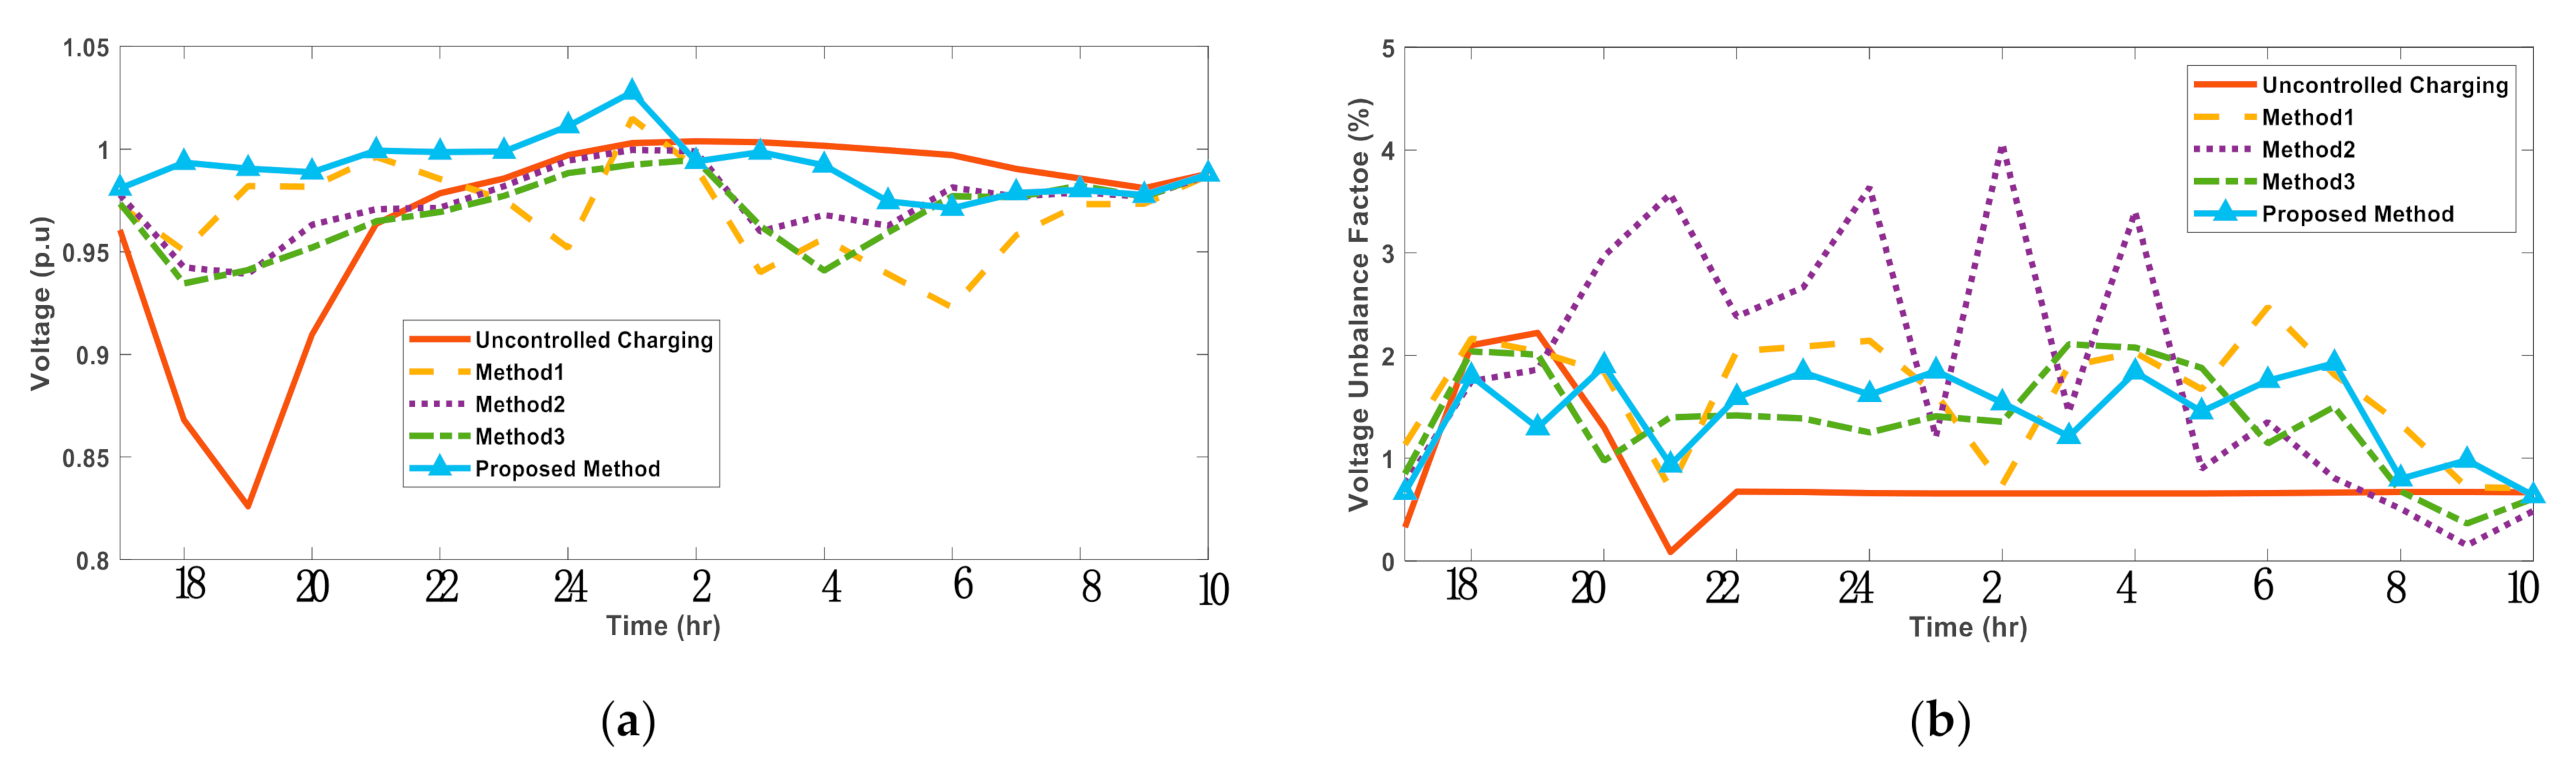
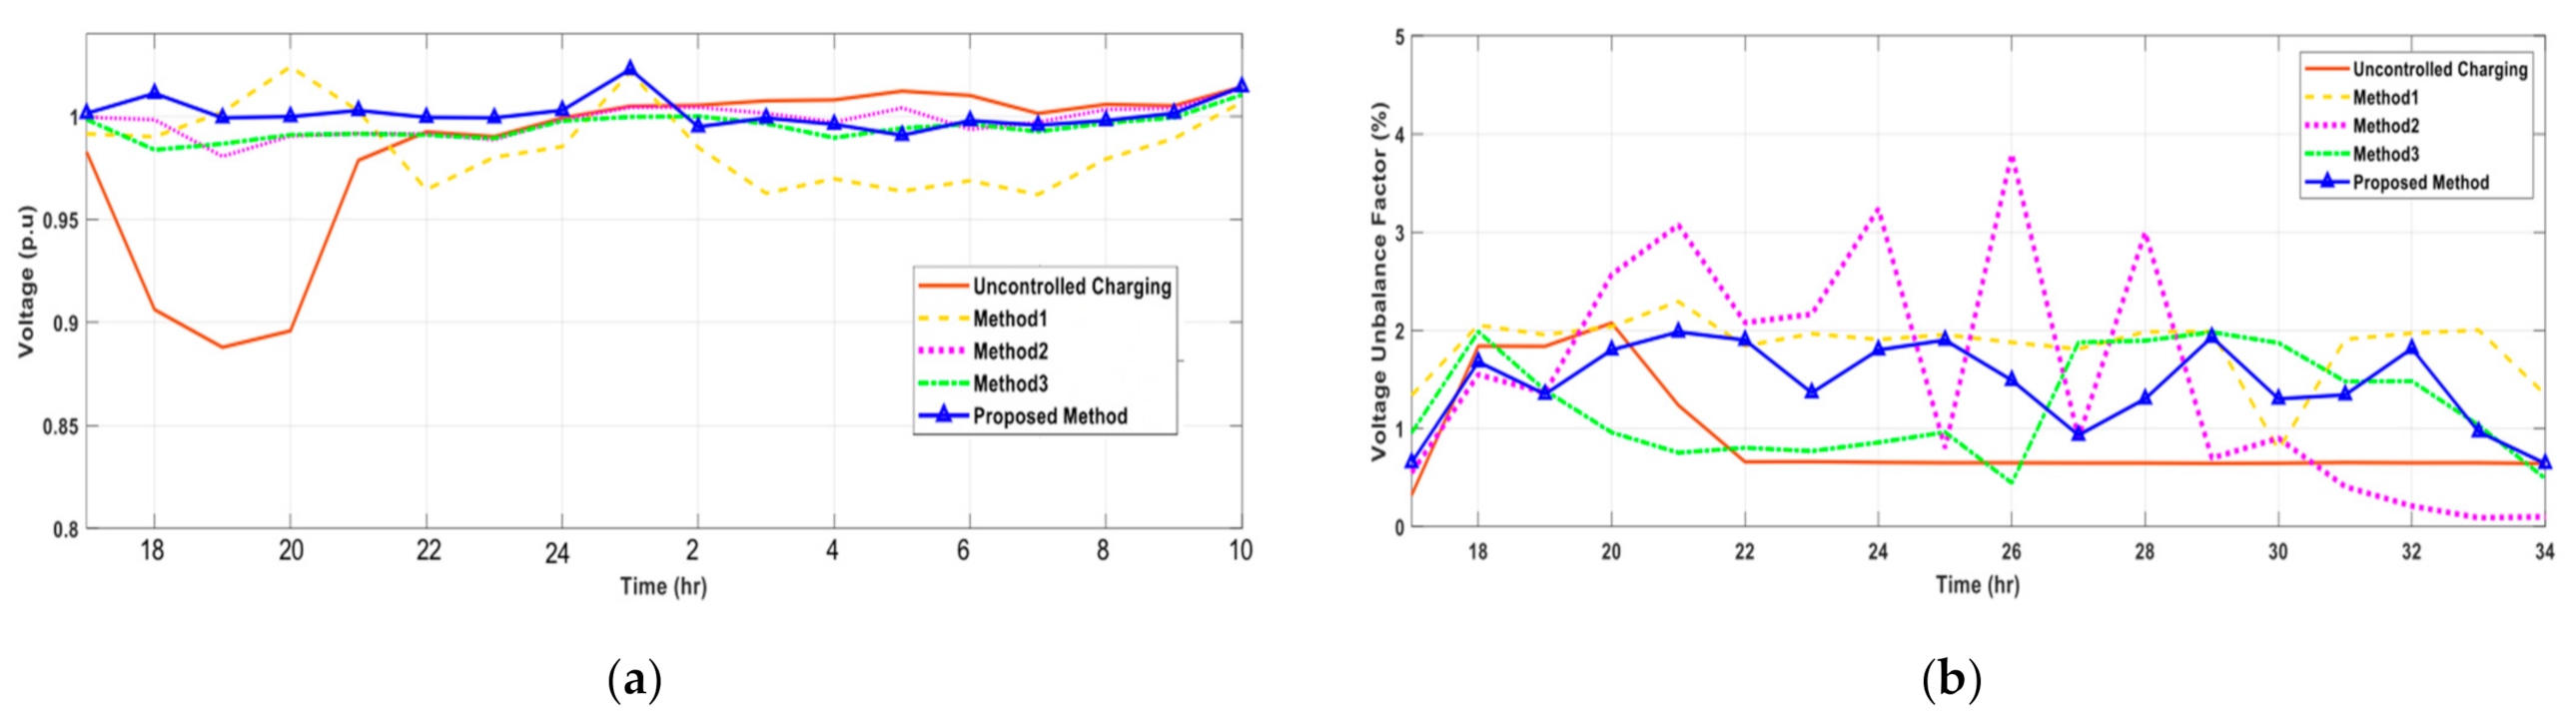
The minimum voltages (p.u) of the critical bus for winter, summer, spring, 100% penetration scenario, weekday and weekend load profiles were 0.97, 0.98, 0.975, 0.97, and 0.99, respectively, and the maximum voltages (p.u) of the critical bus for winter, summer, spring, 100% penetration scenario, weekday and weekend load profile were 1.01, 1.02, 1.01, 1.01, and 1.02, respectively, which shows that the voltage profile lies within the ±5% voltage limit. However, the minimum voltage under uncontrolled charging lies below the desired limits for all the scenarios.
(iv).
The values of VUF under uncontrolled charging for winter, summer, spring, 100% penetration scenario, weekday and weekend load profile were 2.1, 2.1, 2.1, 2.1, and 2, respectively. The values of VUF with the proposed method for winter, summer, spring, 100% penetration scenario, weekday and weekend load profile were 1.98, 1.98, 1.95, 1.98, and 1.98, respectively. Thus, it can be seen that the VUF also lies within the prescribed limit (<2% IEEE standard) with the application of the proposed method for all the case studies considered in this study.
This study is limited to only main two grid requirements, namely VUF and voltage deviation; however, there are many other grid requirements, such as minimization of loss, maximization of reliability, stability improvement, reactive power pricing, etc. Thus, this work can be extended to consider these objectives. Thus, our future work will use multi-objective optimization, such as NSGA-III, to coordinate EVs while considering many objectives.

Author Contributions

Methodology, A.S., S.N. and S.G.; software, T.B.; supervision, A.S.; validation, A.S. and S.N.; writing—original draft, T.B.; writing—review and editing, T.B., A.S., S.N. and S.G. All authors have read and agreed to the published version of the manuscript.

Funding

This research received no external funding.

Institutional Review Board Statement

Not applicable.

Informed Consent Statement

Not applicable.

Data Availability Statement

Not applicable.

Acknowledgments

The authors would like to express thanks for the Petchra Pra Jom Klao research scholarship, funded by the King Mongkut’s University of Technology, Thonburi, for the support.

Conflicts of Interest

The authors declare no conflict of interest.

Nomenclature

B i , j Susceptance
C t Charging Cost in time t (EUR/kWh)
C C Capital Cost (EUR/kWh)
C S L V Salvage value of the battery (EUR/kWh)
C L , N o V 2 G Battery cycle life wthout V2G mode (days)
C L , V 2 G Battery cycle life wth V2G mode (days)
c 1 , c 2 Accerlelation Coefficent
D D Daily distance of EV (km)
D M Maximum distance of EV type (km)
E 0 Initial rated energy (kWh)
E D r i v i n g Energy in driving (kWh)
E V 2 G Energy in V2G (kWh)
F n ( x ) , F n , n o r Objective function and normalized function
g b e s t i , k j global best of PSO
G i , j Conductance (S)
K w Spectively denote the initial and final SOC (kWh/kWh)
N Number of nodes in the system.
N C h g , N D c h g Number of EVs charging, discharging
p b e s t i , k j Local best for PSO
P C h g M a x , P D c h g M a x Maximum power charging/discharging (kW)
P C h g , i , P D c h g , i Individual EVs charging/discharging (kW)
P E V _ C h g ( n , t ) Power charging at node n (kW)
P E V _ D c h g ( n , t ) Power discharging at node n (kW)
P i , t , P d , i , t Active power supply and demand of bus i at time t (kW)
Q D c h g M a x , i Maximum individual reactive power discharging (kVar)
Q D c h g , i Individual reactive power discharging (kVar)
Q i , t , Q d , i , t Reactive power supply and demand of bus i at time t (kVar)
r a n d 1 , r a n d 2 Random number
R V 2 G V2G reward (EUR/kWh)
S O C i , t Individual state of charging of EV i at time t
S O C i n i t i a l , S O C f i n a l Initial/final state of charging of EVs
S O C max , S O C min , Maximum/minimum stage of charge of EVs
S f Scaling factor of battery wear during driving
V i , t , V j , t Voltage of bus i and j at time t
v i , k j velocity of a swarm i in j-th iteration
V M e a s ( n , t ) Measured voltage at node n
V Re f Reference voltage
V Negative sequence components in voltage
V + Positive sequence components in voltage
w p wear price (EUR/kWh)
w p , V 2 G wear price with V2G (EUR/kWh)
w p , N o V 2 G wear price with V2G (EUR/kWh)
x C h g , i , x D c h g , i Charging / discharging   indicator ( 0 , 1 )
x i , k j , y i , k j Position in Stage 1 and 2 of a swarm i in j-th iteration
Δ t Differential time (1 h)
η c h Efficiency of charging
η D c h Efficiency of discharging
η C h g , η D c h g Efficiancy of charging/discharging
ω Inertial weight factor
θ n Weight of multi objective function
ϕ i j , t Voltage phase angle between buses i and j at time t
ACAlternating current
BCBattery degradation cost
CCCharging cost
DCDirect current
DGsDistributed generation
EVElectric vehicle
EVsElectric vehicles
G2VGrid to vehicle
PSOparticle swarm optimization
SOCState of charge
VDVoltage deviation
VUFVoltage unbalance factor
V2GVehicle to grid

References

  1. Ribberink, H.; Entchev, E. Electric Vehicles—A One-Size-Fits-All Solution for Emission Reduction from Transportation? In Proceedings of the 2013 World Electric Vehicle Symposium and Exhibition (EVS27), Barcelona, Spain, 17–20 November 2013; pp. 1–77. [Google Scholar]
  2. IEA. Global EV Outlook 2019; IEA: Paris, France, 2019; Available online: https://www.iea.org/reports/global-ev-outlook-2019 (accessed on 15 September 2020).
  3. Muratori, M. Impact of Uncoordinated Plug-in Electric Vehicle Charging on Residential Power Demand. Nature Energy. Available online: https://www.nature.com/articles/s41560-017-0074-z (accessed on 15 October 2020).
  4. Bohn, S.; Agsten, M.; Dubey, A.; Santoso, S. A Comparative Analysis of PEV Charging Impacts—An International Perspective. In Proceedings of the SAE 2015 Word Congress& Exhibition, Detroit, MI, USA, 21–23 April 2015. [Google Scholar]
  5. Voltage Characteristics of Public Distribution Systems. ISO Standard DIN EN 50160. 2011. Available online: https://copperalliance.org.uk/uploads/2018/03/542-standard-en-50160-voltage-characteristics-in.pdf (accessed on 20 October 2020).
  6. The United Illuminating Company. Available online: http//www.uinet.com (accessed on 20 October 2020).
  7. Sassi, O.; Oulamara, A. Joint Scheduling and Optimal Charging of Electric Vehicles Problem. In Computational Science and Its Applications—ICCSA 2014. Hrsg. von D. Hutchison. Bd. 8580. Lecture Notes in Computer Science; Springer International Publishing: Berlin/Heidelberg, Germany, 2014; pp. 76–91. [Google Scholar]
  8. Betz, J.; Werner, D.; Lienkamp, M. Fleet Disposition Modeling to Maximize Utilization of Battery Electric Vehicles in Companies with On-Site Energy Generation. Transp. Res. Procedia 2016, 19, 241–257. [Google Scholar] [CrossRef]
  9. Le Floch, C.; Belletti, F.; Saxena, S.; Bayen, A.M.; Moura, S. Distributed optimal charging of electric vehicles for demand response and load shaping. In Proceedings of the 2015 54th IEEE Conference on Decision and Control (CDC), Osaka, Japan, 15–18 December 2015. [Google Scholar]
  10. Sarabi, S.; Davigny, A.; Riffonneau, Y.; Robyns, B. V2G electric vehicle charging scheduling for railway station parking lots based on binary linear programming. In Proceedings of the 2016 IEEE International Energy Conference (ENERGYCON), Leuvan, Belguim, 4–8 April 2016. [Google Scholar]
  11. Chaib, A.E.; Bouchekara, H.R.E.H.; Mehasni, R.; Abido, M.A. Optimal power flow with emission and non-smooth cost functions using backtracking search optimization algorithm. Int. J. Electr. Power Energy Syst. 2016, 81, 64–77. [Google Scholar] [CrossRef]
  12. Warid, W.; Hizam, H.; Mariun, N.; Abdul-Wahab, N. Optimal Power Flow Using the Jaya Algorithm. Energies 2016, 9, 678. [Google Scholar] [CrossRef]
  13. He, X.; Wang, W.; Jiang, J.; Xu, L. An Improved Artificial Bee Colony Algorithm and Its Application to Multi-Objective Optimal Power Flow. Energies 2015, 8, 2412–2437. [Google Scholar] [CrossRef] [Green Version]
  14. Niknam, T.; Narimani, M.R.; Jabbari, M.; Malekpour, A.R. A modified shuffle frog leaping algorithm for multi-objective optimal power flow. Energy 2011, 36, 6420–6432. [Google Scholar] [CrossRef]
  15. Sahu, S.; Barisal, A.K.; Kaudi, A. Multi-objective optimal power flow with DG placement using TLBO and MIPSO: A comparative study. Energy Procedia 2017, 117, 236–243. [Google Scholar] [CrossRef]
  16. Kim, H.-Y.; Kim, M.-K.; Kim, S. Multi-Objective Scheduling Optimization Based on a Modified Non-Dominated Sorting Genetic Algorithm-II in Voltage Source Converter. Energies 2017, 10, 986. [Google Scholar] [CrossRef] [Green Version]
  17. Tan, K.M.; Ramachandaramurthy, V.K.; Yong, J.Y. Integration of electric vehicles in smart grid: A review on vehicle to grid technologies and optimization techniques. Renew. Sustain. Energy Rev. 2016, 53, 720–732. [Google Scholar] [CrossRef]
  18. Sarabi, S.; Davigny, A.; Courtecuisse, V.; Riffonneau, Y.; Robyns, B. Potential of vehicle-to-grid ancillary services considering the uncertainties in plug-in electric vehicle availability and service/localization limitations in distribution grids. Appl. Energy 2016, 171, 523–540. [Google Scholar] [CrossRef]
  19. Hu, J.; Morais, H.; Sousa, T.; Lind, M. Electric vehicle fleet management in smart grids: A review of services, optimization and control aspects. Renew. Sustain. Energy Rev. 2016, 56, 1207–1226. [Google Scholar] [CrossRef] [Green Version]
  20. Sousa, T.; Soares, T.; Morais, H.; Castro, R.; Vale, Z. Simulated annealing to handle energy and ancillary services joint management considering electric vehicles. Electr. Power Syst. Res. 2016, 136, 383–397. [Google Scholar] [CrossRef]
  21. Knezović, K.; Marinelli, M.; Zecchino, A.; Andersen, P.B.; Traeholt, C. Supporting involvement of electric vehicles in distribution grids: Lowering the barriers for a proactive integration. Energy 2017, 134, 458–468. [Google Scholar] [CrossRef] [Green Version]
  22. Li, Z.; Chowdhury, M.; Bhavsar, P.; He, Y. Optimizing the performance of vehicle-to-grid (V2G) enabled battery electric vehicles through a smart charge scheduling model. Int. J. Automot. Technol. 2015, 16, 827–837. [Google Scholar] [CrossRef]
  23. Leo, M.; Kavi, K.; Anders, H.; Moss, B. Ancillary Service Revenue Opportunities from Electric Vehicles via Demand Response; School of Natural Resources and Environment University of Michigan: Ann Arbor, MI, USA, 2011. [Google Scholar]
  24. Shi, W.; Wong, V.W.S. Real-time vehicle-to-grid control algorithm under price uncertainty. In Proceedings of the International Conference on Smart Grid Communications (SmartGridComm), Brussels, Belgium, 17–20 October 2011. [Google Scholar]
  25. He, Y.; Venkatesh, B.; Guan, L. Optimal scheduling for charging and discharging of electric vehicles. IEEE Trans. Smart Grid 2012, 3, 1095–1105. [Google Scholar] [CrossRef]
  26. Jin, C.; Tang, J.; Ghosh, P. Optimizing electric vehicle charging: A customer’s perspective. IEEE Trans. Veh. Technol. 2013, 62, 2919–2927. [Google Scholar] [CrossRef]
  27. Richardson, P.; Flynn, D.; Keane, A. Local versus centralized charging strategies for electric vehicles in low voltage distribution systems. IEEE Trans. Smart Grid. 2011, 3, 1020–1028. [Google Scholar] [CrossRef]
  28. Sen, G.D.; Sharma, J.; Goyal, G.R.; Singh, A.K. A Multi-objective PSO (MOPSO) algorithm for optimal active power dispatch with pollution control. IIETA 2017, 4, 113–119. [Google Scholar] [CrossRef]
  29. Bakker, H.; Dunke, F.; Nickel, S. A structuring review on multi-stage optimization under uncertainty: Aligning concepts from theory and practice. Omega 2020, 96, 102080. [Google Scholar] [CrossRef]
  30. Kolawole, O.; Al-Anbagi, I. Electric Vehicles Battery Wear Cost Optimization for Frequency Regulation Support. IEEE Access 2019, 7, 130388–130398. [Google Scholar] [CrossRef]
  31. Liang, H.; Liu, Y.; Li, F.; Shen, Y. Dynamic Economic/Emission Dispatch Including PEVs for Peak Shaving and Valley Filling. IEEE Trans. Ind. Electron. 2019, 66, 2880–2890. [Google Scholar] [CrossRef]
  32. Maigha; Crow, M.L. Electric Vehicle Scheduling Considering Co-Optimized Customer and System Objectives. IEEE Trans. Sustain. Energy 2018, 9, 410–419. [Google Scholar] [CrossRef]
  33. Sharma, I.; Cañizares, C.; Bhattacharya, K. Smart Charging of PEVs Penetrating into Residential Distribution Systems. IEEE Trans. Smart Grid 2014, 5, 1196–1209. [Google Scholar] [CrossRef]
  34. García-Villalobos, J.; Zamora, I.; Knezović, K.; Marinelli, M. Multi-objective optimization control of plug-in electric vehicles in low voltage distribution networks. Appl. Energy 2016, 180, 155–168. [Google Scholar] [CrossRef] [Green Version]
  35. Jabalameli, N.; Su, X.; Ghosh, A. Online Centralized Charging Coordination of PEVs with Decentralized Var Discharging for Mitigation of Voltage Unbalance. IEEE Power Energy Technol. Syst. J. 2019, 6, 152–161. [Google Scholar] [CrossRef]
  36. Kikhavani, M.R.; Hajizadeh, A.; Shahirinia, A. Charging coordination and load balancing of plug-in electric vehicles in unbalanced low-voltage distribution systems. IET Gener. Transm. Distrib. 2020, 14, 389–399. [Google Scholar] [CrossRef]
  37. Nafisi, H.; Agah, S.M.M.; Abyaneh, H.A.; Abedi, M. Two-Stage Optimization Method for Energy Loss Minimization in Microgrid Based on Smart Power Management Scheme of PHEVs. IEEE Trans. Smart Grid 2016, 7, 1268–1276. [Google Scholar] [CrossRef]
  38. Islam, M.R.; Lu, H.; Hossain, J.; Islam, M.R.; Li, L. Multi-objective Optimization Technique for Mitigating Unbalance and Improving Voltage Considering Higher Penetration of Electric Vehicles and Distributed Generation. IEEE Syst. J. 2020, 14, 3676–3686. [Google Scholar] [CrossRef]
  39. Manbachi, M.; Farhangi, H.; Palizban, A.; Arzanpour, S. A novel Volt-VAR Optimization engine for smart distribution networks utilizing Vehicle to Grid dispatch. Int. J. Electr. Power Energy Syst. 2016, 74, 238–251. [Google Scholar] [CrossRef]
  40. Monteiro, V.; Pinto, J.G.; Exposto, B.; Goncalves, H.; Ferreira, J.C.; Couto, C. Assessment of a battery charger for electric vehicles with reactive power control. In Proceedings of the IEEE IECON 2012: 38th Annual Conference on Industrial Electronics Society, Montreal, QC, Canada, 25–28 October 2012. [Google Scholar]
  41. Kisacikoglu, M.C.; Ozpineci, B.; Tolbert, L.M. Examination of a PHEV bidirectional charger system for V2G reactive power compensation. In Proceedings of the IEEE APEC 2010: Twenty-Fifth Annual Applied Power Electronics Conference, Plam Spring, CA, USA, 22–25 February 2010. [Google Scholar]
  42. Kisacikoglu, M.C.; Ozpineci, B.; Tolbert, L.M. Reactive power operation analysis of a single-phase EV/PHEV bidirectional battery charger. In Proceedings of the IEEE ICPE & ECCE 2011: 8th International Conference on Power Electronics and ECCE Asia, Jeju, Korea, 30 May–3 June 2011. [Google Scholar]
  43. IEEE. IEEE Recommended Practice for Monitoring Electric Power Quality 1159–1995; Institute of Electrical and Electronics Engineers, Inc.: New York, NY, USA, 1995; pp. 1–80. [Google Scholar]
  44. Farzin, H.; Fotuhi-Firuzabad, M.; Moeini-Aghtaie, M. A Practical Scheme to Involve Degradation Cost of Lithium-Ion Batteries in Vehicle-to-Grid Applications. IEEE Trans. Sustain. Energy 2016, 7, 1730–1738. [Google Scholar] [CrossRef]
  45. Fasugba, M.A.; Krein, P.T. Gaining vehicle-to-grid benefits with unidirectional electric and plug-in hybrid vehicle chargers. In Proceedings of the 2011 IEEE Vehicle Power and Propulsion Conference, Chicago, IL, USA, 6–9 September 2011. [Google Scholar]
  46. Yang, X.S. Engineering Optimisation: An Introduction with Metaheuristic Applications; John Wiley and Sons: Hoboken, NJ, USA, 2010. [Google Scholar]
  47. Babaei, S.; Steen, D.; Tuan, L.A.; Carlson, O.; Bertling, L. Effects of Plug-in Electric Vehicles on distribution systems: A real case of Gothenburg. In Proceedings of the 2010 IEEE PES Innovative Smart Grid Technologies Conference Europe (ISGT Europe), Gothenberg, Sweden, 11–13 October 2010. [Google Scholar]
  48. Mahat, P.; Handl, M.; Kanstrup, K.R.; Lozano, A.P.; Sleimovits, A. Price based electric vehicle charging. In Proceedings of the 2012 IEEE Power and Energy Society General Meeting, San Diego, CA, USA, 22–26 July 2012. [Google Scholar]
  49. Nissan Leaf 24 kWh & 30 kWh Charging Guide. Available online: https://www.zap-map.com/charge-points/Nissan-leaf-2430kwh-charging-guide/ (accessed on 1 October 2020).
  50. Akbari, M.; Brenna, M.; Longo, M. Optimal Locating of Electric Vehicle Charging Stations by Application of Genetic Algorithm. Sustainability 2018, 10, 1076. [Google Scholar] [CrossRef] [Green Version]
  51. Darabi, Z.; Ferdowsi, M. Aggregated Impact of Plug-in Hybrid Electric Vehicles on Electricity Demand Profile. IEEE Trans. Sustain. Energy 2011, 2, 501–508. [Google Scholar] [CrossRef]
Figure 1. Application of the proposed method for customer and grid benefits.
Applsci 11 03904 g001
Figure 2. Proposed method to schedule EVs.
Applsci 11 03904 g002
Figure 3. Application of PSO to solve the proposed method.
Applsci 11 03904 g003
Figure 4. Arrival time and departure time [34].
Applsci 11 03904 g004
Figure 5. Initial state of charge of 100% penetration (542 cars).
Applsci 11 03904 g005
Figure 6. Seasonal prices.
Applsci 11 03904 g006
Figure 7. Residential load profile with different electric load profiles.
Applsci 11 03904 g007
Figure 8. Schedule of (a) active power for EVs for different methods; (b) reactive power for EVs for different methods under 30% EV penetration.
Applsci 11 03904 g008
Figure 9. Bus 846 (a) voltage and (b) VUF under 30% EV penetration.
Applsci 11 03904 g009
Figure 10. Bus 846 (a) voltage and (b) VUF under 50% EV penetration.
Applsci 11 03904 g010
Figure 11. Bus 846 (a) voltage and (b) VUF under 75% EV penetration.
Applsci 11 03904 g011
Figure 12. Bus 846 (a) voltage and (b) VUF under 100% EV penetration.
Applsci 11 03904 g012
Figure 13. State of charge for the proposed method.
Applsci 11 03904 g013
Figure 14. Schedule of (a) active power for EVs under different methods and (b) reactive power for EVs under different methods for price signals in the spring season.
Applsci 11 03904 g014
Figure 15. Bus 846 (a) voltage and (b) VUF for price signals in the spring season.
Applsci 11 03904 g015
Figure 16. Bus 846 (a) voltage and (b) VUF for price signals in the summer season.
Applsci 11 03904 g016
Figure 17. Bus 846 (a) voltage and (b) VUF for price signals in the winter season.
Applsci 11 03904 g017
Figure 18. Total cost for (a) winter, (b) summer, and (c) spring (1 = uncoordinated charging; 2 = Method 1; 3 = Method 2; 4 = Method 3; 5 = proposed method).
Applsci 11 03904 g018
Figure 19. Schedule of (a) active power for EVs using different methods for weekend electric load profiles and (b) reactive power for EVs under different methods for weekend electric load profiles.
Applsci 11 03904 g019
Figure 20. Bus 846 (a) voltage and (b) VUF for weekend electric load profiles.
Applsci 11 03904 g020
Figure 21. Total cost and SOC. (a) Charging cost in different electric load profiles (weekend). (b) Average SOC in different electric load profiles (weekend).
Applsci 11 03904 g021
Table 1. Comparison of recent works on coordinated charging of EVs.
Related WorkCustomer Objective FunctionSystem Objective FunctionV2G Technology
Charging CostBattery DegradationVoltage
Unbalance
Voltage
Deviation
V2G in
Active Power
V2G in
Reactive Power
[30]---
[31]----
[32]---
[33]----
[34]--
[35]---
[36]---
[37]---
[38]----
Proposed Method
Table 2. EV penetration for different phases and nodes.
Phase APhase BPhase C
EV Bus Connection816824854842846816824854842846816824854842846
30% (162 EVs)2210210504115210211500
50% (271 EVs)321103102005125310313540
75% (407 EVs)452344310234633743134337154
100% (542 EVs)553213521932137246512252462413
Table 3. Simulation parameters for constraints.
ParameterValue
E 0 24 kWh
E D r i v i n g 0.4 p.u
E V 2 G 0.3 p.u
P C h g ( t , n ) M a x 7.68 kW
P D c h g ( t , n ) M a x 7.2 kW
C t Obtained from Figure 6
R V 2 G 0.324 EUR/kWh
S O C I n i t i a l Obtained from Figure 5
S O C f i n a l 95%
Δ t 1 h
η i , t C h g 93%
η i , t D c h g 93%
C C 110.97 EUR/kWh
C S L V 60% of CC
S f 2.22
K w 0.00015 kWh/kWh
C L , N o V 2 G 1035.19 days (3 years)
C L , V 2 G 706.214 days (2 years)
w p , N o V 2 G 0.179 EUR/kWh
w p , V 2 G 0.122 EUR/kWh
Table 4. Simulation parameters for PSO.
ParameterValue
c11.4962
c21.4962
Iteration50
Population size25
Weight for VUF in Stage 1 (θ1)0.5
Weight for CC in Stage 1 (θ2)0.25
Weight for BC in Stage 1 (θ3)0.25
Table 5. Comparison results of case study under different price signals.
100% PenetrationWeekdayUncontrolled ChargingMethod 1Method 2Method 3Proposed Method
WinterMax VUF (%)2.12.2421.98
Min Voltage (p.u)0.8250.940.940.950.97
Max Voltage (p.u)1110.981.01
Total Cost (EUR/day)−3.00−2.70−2.47−4.15−1.723
SummerMax VUF (%)2.12.242.11.98
Min Voltage (p.u)0.820.9250.940.9350.98
Max Voltage (p.u)11.0110.991.02
Total Cost (EUR/day)−3.015−2.9−2.4−3.61−1.99
SpringMax VUF (%)2.12.552.11.95
Min Voltage (p.u)0.850.9250.940.9250.975
Max Voltage (p.u)11.0110.971.01
Total
Cost (EUR/day)
−3.006−2.75−2.169−4.21−1.94
Table 6. Comparison of result of the case study under different load profiles.
100% PenetrationWinterUncontrolled ChargingMethod 1Method 2Method 3Proposed Method
WeekdayMax VUF (%)2.12.2421.98
Min Voltage (p.u)0.8250.940.940.950.97
Max Voltage (p.u)1110.981.01
Total Cost (EUR/day)−3.00−2.70−2.47−4.15−1.723
WeekendMax VUF (%)22.253.821.98
Min Voltage (p.u)0.890.960.970.970.99
Max Voltage (p.u)1.011.031.011.011.02
Total Cost (EUR/day)−2.33−2.11−2.42−4.18−1.76
Publisher’s Note: MDPI stays neutral with regard to jurisdictional claims in published maps and institutional affiliations.

