Article

Mathematical Modelling of a Static Concentrating Photovoltaic: Simulation and Experimental Validation

by
Firdaus Muhammad-Sukki
1,2,*,
Haroon Farooq
3,
Siti Hawa Abu-Bakar
4,
Jorge Alfredo Ardila-Rey
5,
Nazmi Sellami
6,
Ciaran Kilpatrick
6,
Mohd Nabil Muhtazaruddin
2,*,
Nurul Aini Bani
2 and
Muhammad Zulkipli
7
1
School of Engineering & the Built Environment, Edinburgh Napier University, Merchiston Campus, 10 Colinton Road, Edinburgh EH10 5DT, UK
2
Razak Faculty of Technology and Informatics, Universiti Teknologi Malaysia, Jalan Sultan Yahya Petra, Kuala Lumpur 54100, Malaysia
3
Electrical Engineering RCET, University of Engineering and Technology, Lahore 54890, Punjab, Pakistan
4
Renewable Energy Research Laboratory, Electrical Engineering Section, British Malaysian Institute, Universiti Kuala Lumpur, Jalan Sungai Pusu, Selangor 53100, Malaysia
5
Department of Electrical Engineering, Universidad Técnica Federico Santa María, Santiago de Chile 8940000, Chile
6
School of Engineering, Robert Gordon University, The Sir Ian Wood Building, Riverside East, Garthdee Road, Aberdeen AB10 7GJ, UK
7
Faculty of Engineering Technology, Universiti Tun Hussein Onn Malaysia, Pagoh Higher Education Hub, KM1, Jalan Panchor, Pagoh, Johor 84600, Malaysia
*
Authors to whom correspondence should be addressed.
Appl. Sci. 2021, 11(9), 3894; https://doi.org/10.3390/app11093894
Submission received: 29 March 2021 / Revised: 22 April 2021 / Accepted: 23 April 2021 / Published: 25 April 2021
(This article belongs to the Section Energy Science and Technology)

Abstract

:
For the past twenty years, there has been increasing interest and investment in solar photovoltaic (PV) technology. One particular area of interest is the development of concentrating PV (CPV), especially for use in building integration. Many CPV designs have been developed and investigated. This paper aims at producing a mathematical modelling using MATLAB programme to predict the current-voltage (I-V) and power-voltage (P-V) characteristics of a static CPV. The MATLAB programme could also simulate the angular response of the CPV designs-which has never been explored in the previous literature. In this paper, a CPV known as the rotationally asymmetrical dielectric totally internally reflecting concentrator (RADTIRC) was analysed. A specific RADTIRC design that has an acceptance angle of ±40° was investigated in this paper. A mathematical modelling was used to simulate the angular characteristics of the RADTIRC from −50° to 50° with an increment 5°. For any CPV, we propose that the value of opto-electronic gain, Copto-e needs to be included in the mathematical model, which were obtained from experiments. The range of incident angle (±50°) was selected to demonstrate that the RADTIRC is capable of capturing the sun rays within its acceptance angle of ±40°. In each simulation, the I-V and P-V characteristics were produced, and the short circuit current (Isc), the open-circuit voltage (Voc), the maximum power (Pmax), the fill factor (FF) and the opto-electronic gain (Copto-e) were determined and recorded. The results from the simulations were validated via experiments. It was found that the simulation model is able to predict the I-V and P-V characteristics of the RADTIRC as well as its angular response, with the highest error recorded for the Isc, Voc, Pmax, FF and Copto-e was 2.1229%, 5.3913%, 9.9681%, 4.4231% and 0.0000% respectively when compared with the experiment.

1. Introduction

Over the previous few decades, there has been increasing interest and investment in solar photovoltaic (PV) technology, primarily based on the increasing efficiency of solar cells and the increased economic viability of generating electricity using this method. The solar PV system’s operating principle is based on the photovoltaic effect of photons of light interacting with electrons within a solar cell, primarily composed of doped silicon to create a p-n junction. This interaction causes the electrons within the junction to be released creating an electron hole which is filled by a free electron within the p-n junction, given a continuous source of light these individual interactions compound resulting in a flow of electrons and subsequently, generate a current. Typically, a commercial silicon solar cell produces around 0.5–0.6 V with a current between 28 and 35 mA/cm2 [1]. Therefore, to allow solar energy to be used for practical applications, solar cells are group together into solar panels. Depending on the application, solar panels can be grouped and arranged into solar arrays, providing a larger surface area, generating significantly more electricity.
There are ongoing work to enhance the performance of the PV cells. Masouleh et al. [2] studied different diffraction nano gratings which then are deposited on top of the gallium arsenide (GaAs) based solar cell and showed promising results in improving the cell’s light absorption. Das et al. [3] simulated the performance of a multi-junction solar cell and showed that this cell can increase the maximum power by a factor of 3 when compared with a conventional PV cell. Jithin et al. [4] carried out the synthesis of titanium dioxide (TiO2) nanorods embedded nanopillar and argued that this technique can be used to enhance the efficiency of dye-sensitized solar cells (DSSCs). Zhang et al. [5] attempted to optimise the performance of an organic solar cell by studying the mechanisms of exciton diffusion and managed to obtain a power conversion efficiency of 16.35%. Al Kurdi et al. [6] researched on the use of a naphthalene diimide side-chain polymer as an electron-extraction layer to create a perovskite solar cell and achieved a power conversion efficiency of 14%. Angmo et al. [7] reported a roll-to-roll fabrication method which enables the mass production of the perovskite solar and the cell maintains a power conversion efficiency of 15.2%.
As the most expensive component within a PV system is the solar cell itself [8], numerous methods are developed to optimise the energy produced from a single solar cell. This includes tracking systems which change the direction that the solar arrays face, to track the sun as it rises and falls over the course of a day and more advanced tracking systems are capable of multiple axis of movement to track seasonal changes in the suns location [9]. These systems significantly improve the amount of energy acquired over time from the solar panels, but due to their moving components, this also comes with the drawback of increased maintenance and a greater initial investment cost.
Another method of improving the solar panel’s efficiency is to increase the apparent surface area of the cell using a lens (also commonly known as concentrator) or series of lenses (concentrators) to focus the solar energy from a large surface area onto a relatively small exit area where a solar cell is attached; if setup correctly this allows a solar panel to be constructed using a fraction of the number of solar cells it would typically require for a traditional solar panel of an equivalent surface area [10]. Additionally, depending on the shape of the lenses, the panel may absorb a high percentage of solar energy when it is not directly orientated towards the source of light, further increasing the efficiency of the system compared to a traditional solar panel. To further increase solar cells’ efficiency and economic viability, the two optimisation techniques can be combined into an integrated system capable of focusing the light source onto a solar cell and orientating the panel towards the source of light.
Recently, there are increasing interest of integrating the concentrating PV (CPV) technology into a building [11,12,13,14]. A report published in 2021 by the Market Data Forecast indicated that the global concentrating PV (CPV) is now exceeding $790 million and will continue to achieve a compound annual growth rate of 14.5% until 2026 [15]. A joint report in 2017 by the Fraunhofer Institute for Solar Energy Systems (ISE) and the National Renewable Energy Laboratory (NREL) projected that the levelised cost of electricity of both the CPV and traditional PV system will achieve a competitive value of minimum €0.05/kWh by 2030 [16]. Researchers have developed various concentrator designs for building integration. The most prominent one is the design proposed by Welford and Winston [17] known as the compound parabolic concentrator (CPC). The CPC design itself has evolved over the years, i.e., 2D extrusion of a symmetrical reflective CPC [18], 2D extrusion of a symmetrical dielectric CPC [19], 3D rotationally symmetric dielectric CPC [20], reflective asymmetric CPC [21], dielectric asymmetric CPC [22] and crossed CPC [23]. Besides the CPC design, other concentrator designs explored previously include flat-plate static concentrator [24], extrusion of reflective parabolic concentrator [25], 3D refractive static concentrator [26], 3D dielectric totally internally reflecting concentrator [27], circular rotational square hyperboloid concentrator [28] and luminescent solar concentrator (LSC) [29]. All the CPV designs were tested experimentally under standard test conditions to identify their I-V and P-V characteristics.
Researchers have attempted various ways to improve the CPV performance. Lin et al. [30] proposed the use of hybrid perovskites to improve the CPV performance and their simulations indicated that these cells could work beyond the Shockley–Queisser limit with concentrators capable of concentrating 10–100 Suns (1 Sun = 1000 W/m2). Wang et al. [31] developed a new metal halide perovskites to enhance the CPV performance and demonstrated that the cell accomplished the highest efficiency of 23.6% under 14 Suns. Huo et al. [32] improved the quantum dots solar cells (QDSC) through the multi-photon absorption (MPA) to produce high densities of excitons, and achieved a 21.29% efficiency when tested with polymer lens CPVs that has a geometrical concentration gain of 4.08. Neo et al. [33] increased the performance of an LSC by introducing a thick zinc chalcogenide and achieved an efficiency of 0.53%. Meinardi et al. [34] on the other hand utilised indirect-bandgap semiconductor nanostructures to attain an LSC with an optical efficiency of 2.85%.
As the PV systems have developed there has been an increasing demand to model their performance and predict the amount of energy that shall be generated under a set of given conditions. As a result of this, equivalent circuits of typical non-concentrating PV cells have been developed as well as other mathematical models to attempt to predict the performance characteristics and potential output power of a PV cell, i.e., to identify the current-voltage (I-V) and power-voltage (P-V) characteristics [35,36,37,38,39]. Note that these models differ between each other; each one of the model requires different parameters. To ensure the effectiveness of these models, often they are verified via experiments. These models also only demonstrated the simulation at normal incidence; no analysis were carried out to show the angular response of these typical non-concentrating PV cell.
Although they are various PV models available, we found that there is limited literature on the modelling of concentrating PV (CPV) to characterise the output of the CPV design. Kaddour and Benyocef [40] simulated and modelled a parabolic concentrator, however, their work only showed the effect of meteorological parameters (i.e., direct solar isolation, ambient temperature, air density, sun elevation angel and the wind speed) on the energy output. Benrhouma et al. [41] used MATLAB to compare the performance of a CPV module with and without cooling system. However, their model only showed the variations of the CPV’s temperature against the ambient temperature and direct normal irradiance. Fernández et al. [42] attempted to estimate the maximum power of a high CPV (HCPV) module under real conditions. Their model was created by using ‘a simple-easy- to-use equation’. They compared their model with experimental data and found that the model achieved a root mean square error of 3.48%. All these work [40,41,42] did not indicate or specify the I-V and P-V characteristics of the CPV.
Mammo et al. [23] demonstrated a MATLAB simulation to determine the I-V and P-V characteristics of a reflective crossed CPC. Their model required the short circuit current and the open circuit voltage to be determined from experiments while the other parameters were provided by the manufacturers. Although the model showed the I-V and P-V characteristics, the results were not compared with the experiments–hence it is not possible to identify the effectiveness of their model.
Li et al. [43] described in detail the design and testing of a MATLAB simulation to model a reflective crossed CPC. They described the steps for extracting the model’s parameters using the open and closed circuit conditions as well as the maximum power point, through an iterative calculation until convergence. They identified five important parameters to be used in the model. They recommended that the diode ideality factor, the diode saturation current and the series resistor to be determined using an optimisation algorithm, while the photocurrent and the series resistor were determined analytically and iteratively. Having implemented the model, they then compared the performance of the simulations against the predicted characteristics from the PV cells datasheet and six sets of experimental results using different PV modules, resulting in an average error of 5.53%.
Both the models by Mammo et al. [23] and Li et al. [43] only considered the simulation at normal irradiance. There were no analysis carried out to show the angular response of these CPV designs.
This paper aims at presenting a mathematical model to predict the I-V and power-voltage P-V characteristics of a static concentrator known as the rotationally asymmetrical dielectric totally internally reflecting concentrator (RADTIRC) and estimates the angular response of the RADTIRC. The paper is structured as follow: Section 1 provides an introduction with a brief literature on different models developed by other researchers, Section 2 offers the methodology of the work, Section 3 describes the mathematical formulation of the CPV model, Section 4 demonstrates simulation process, Section 5 discusses the results from the model and compares them with the experimental result, and finally Section 6 is the conclusion.

2. Methodology

This paper presents a simplified mathematical model of a single-diode equivalent circuit for a CPV structure using analytical methods under MATLAB programming environment. The model developed here utilised a stepwise approach proposed by Vinod et al. [38] when they model a JAP6-72-320/4BB solar PV module using Simulink. The solar PV cell datasheet from the manufacturer Narec (National Renewable Energy Centre) and the results from previous experiments when characterising the RADTIRC were used during modelling. The I-V and P-V characteristics generated from the simulations were compared with values obtained from the experiment.

3. Mathematical Formulation of the CPV

3.1. RADTIRC as the Reference for the Model

The RADTIRC (see Figure 1) was invented by Ramirez-Iniguez et al. [44] with the aim to improve the electrical yield which could minimise the amount of costly PV material; hence reducing the cost of PV system [45]. The procedure to create the RADTIRC has been described thoroughly by Ramirez-Iniguez et al. [44]. For the past few years, several analyses have been carried out to evaluate the concentrator’s performance such as evaluating its geometrical concentration gain and its optical concentration gain [45], identifying the most cost-effective fabrication technique to mass-produce the concentrator [46], integration in a double-glazed window [47] and calculating its annual energy output [48]. Based on these studies, it was found that it is more desirable to utilise a shorter RADTIRC that have a larger half-acceptance angle and a lower geometrical concentration gain than the ones with a smaller half-acceptance angle and a higher geometrical concentration gain because: (i) it requires less material hence minimises the cost of material; (ii) it captures the sun energy for extended period during daytime; and (iii) the concentrator exhibits a more uniform distribution of flux, i.e., the amount of ‘hot spots’ diminished on the PV cell, which translates to a lower temperature, and eventually allows the RADTRIC-PV structure to function at its optimum efficiency level. Similar findings were also recorded by Sarmah et al. [49] and Mallick and Eames [50] when optimising their static CPVs.
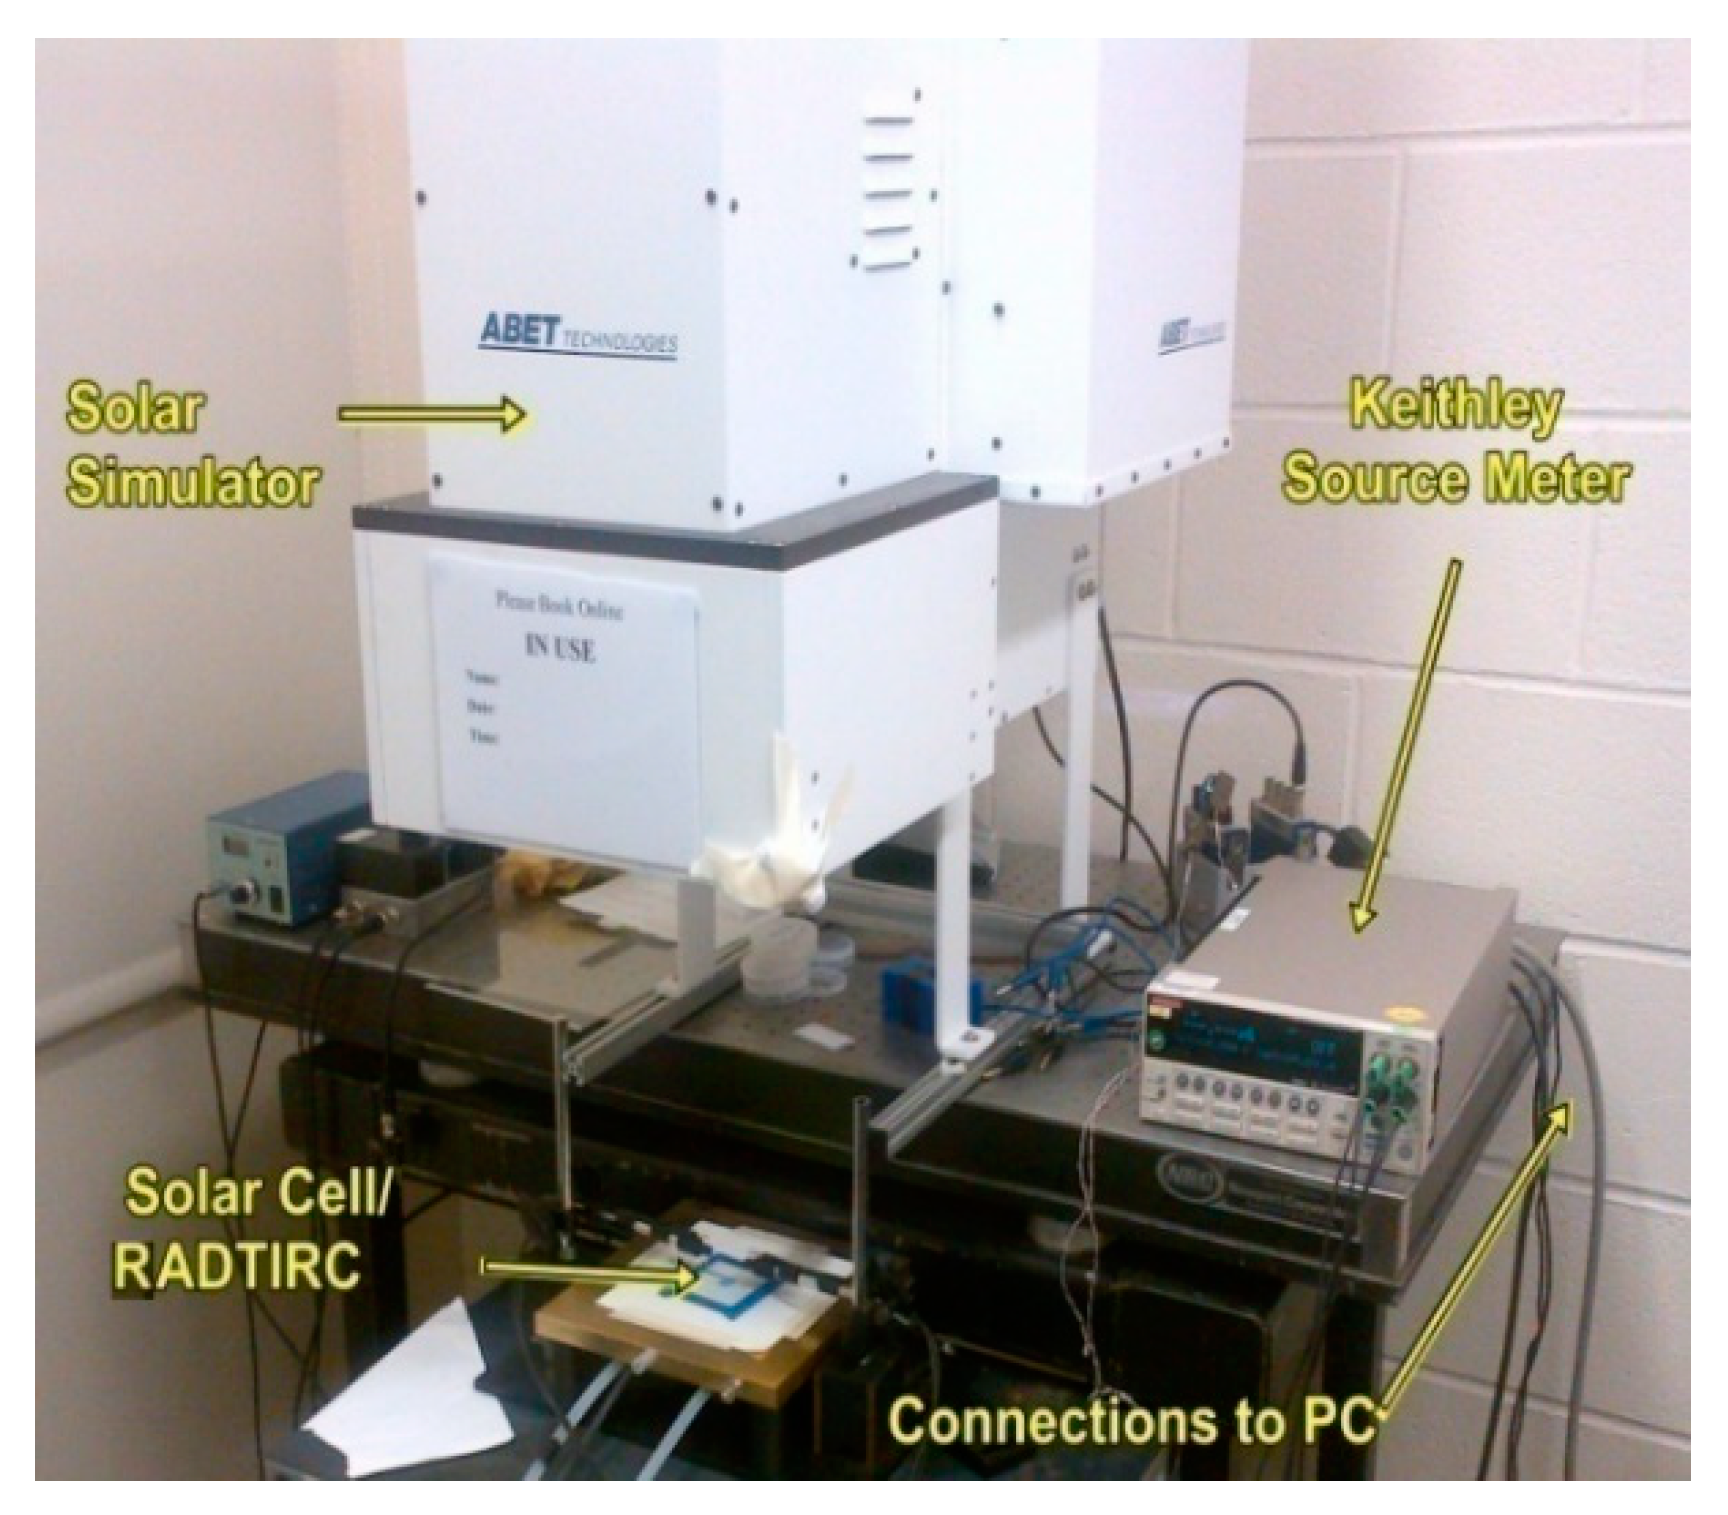
The indoor experiments to characterise the RADTIRC-PV structure have been presented by Muhammad-Sukki et al. in [51]. The RADTIRC has a geometrical concentration gain of 4.91, a height of 3 cm and a square exit aperture area of 1 cm2. The concentrator is designed to achieve a half-acceptance angle of ±40° along its x-axis. The indoor experiments utilised a Class A solar simulator produced by Abet Technologies from the Sun 2000 model, a Keithley 2400 source meter, which are connected to a computer that has been installed with a National Instrument software. The experiments were conducted under STCs to mimic the simulation conditions, and the setup is depicted in the following Figure 2.
The angular response of the RADTIRC-PV structure and the bare PV cell were investigated at different incident angles between −50° and 50°. The angular response enables the opto-electronic gain, Copto-e of the RADTIRC to be determine at different angle of incidence. The opto-electronic gain of the RADTIRC at each angle of incidence is presented in Table 1. The opto-electronic gain is a ratio of short circuit current generated from RADTIRC-PV to the one generated from a bare PV cell. Sellami and Mallick [52] define the opto-electronic gain as a product of optical efficiency and the geometrical concentration gain of a concentrator. The optical efficiency value determines the amount of sun rays that travel from the concentrator aperture to its exit aperture [17]. It takes into consideration the rays that are loss due to reflection, scattering and absorption. In the case of dielectric material, it also considers the rays that escape from the side profile of the concentrator. The value of optical efficiency is ≤1 [53]. Freier [54] has demonstrated that the optical efficiency value is also independent of the irradiance value.
Specifically for any CPV, we propose that the value of opto-electronic gain, Copto-e needs to be included in the mathematical model, which was obtained from experiments. Any CPV will focus the solar irradiance from a large area into a smaller area where a solar PV is placed [55]. The relationship between the value of irradiance with the inclusion of CPV, Gcon and the opto-electronic gain, Copto-e, the solar irradiance, G, the irradiance at reference 1000 W/m2, Gref and the incidence angle, θ is presented in Equation (1). Note that for a non-CPV, the value of Copto-e is equal to 1.
G con = C opto e ( G G ref ) cos θ

3.2. Mathematical Model of a PV Cell

A solar PV cell can be transformed into an equivalent electrical circuit to predict its current and voltage output. Ideally, a PV cell’s equivalent circuit is represented by a diode connected in parallel with a photocurrent, Iph, (i.e., a light generated current source). However, in reality, additional parameters must be considered, including the resistivity of the material, the ohmic losses and the shunt resistance’s effect on the cell. These parameters can be modelled as the shunt resistance, Rsh and series resistance, Rs. The equivalent circuit of the PV cell can be represented by a single-diode model (see Figure 3). Several researchers enhanced the single-diode model by including an additional diode into the circuit [56,57,58,59]. The new representation is denoted the two-diode model. This extra diode corresponds to the recombination effects of the charge carriers [60,61]. Despite providing a more precise representation of the PV cell’s outputs, the two-diode model requires much longer computational time compared with the previous single-diode model [60].
The expression for the single-diode model’s output current is given by the following Equation (2) [61]:
I = I ph I d I sh
where Id is the diode current. Equation (1) can then be transcribed as [23]:
I = I ph I s [ exp ( q ( V + IR s ) n d kT 1 ) ] V + IR s R sh
where Is is the saturation current for the diode, while nd corresponds to the diode ideality factor, q is the electron charge (1.602 × 10⁻¹⁹ C), k is the Boltzman constant (1.38 × 10⁻²³ J/K), T is the temperature of the p-n junction (in Kelvin), and V is the voltage across the PV cell.
In this model, it is required to compute Iph, Irs and Is. These values will be determined from the following equations. Iph is independent of V (or Rs), linearly dependent on the solar irradiance and is also affected by the temperature. This relationship is presented in the following Equation (4) [38].
I ph = ( I sc + α ( T T ref ) ) G con
where Tref is 25 °C and α is the current temperature coefficient.
Vinod et al. [38] indicated that the reverse saturation current, Irs and the saturation current, Is are determined using Equations (5) and (6), where the value of the energy bandgap, Eg is provided by the manufacturer. The key parameters for the solar PV cell are tabulated in Table 2. These parameters were provided by the manufacturer of the solar PV cell, Narec (National Renewable Energy Centre).
I rs = I sc / [ exp ( qV oc n d 1 kT ) 1 ]
I s = I rs [ T T ref ] 3 exp [ ( qE g n d k ) ( 1 T 1 T ref ) ]

4. Simulation Process

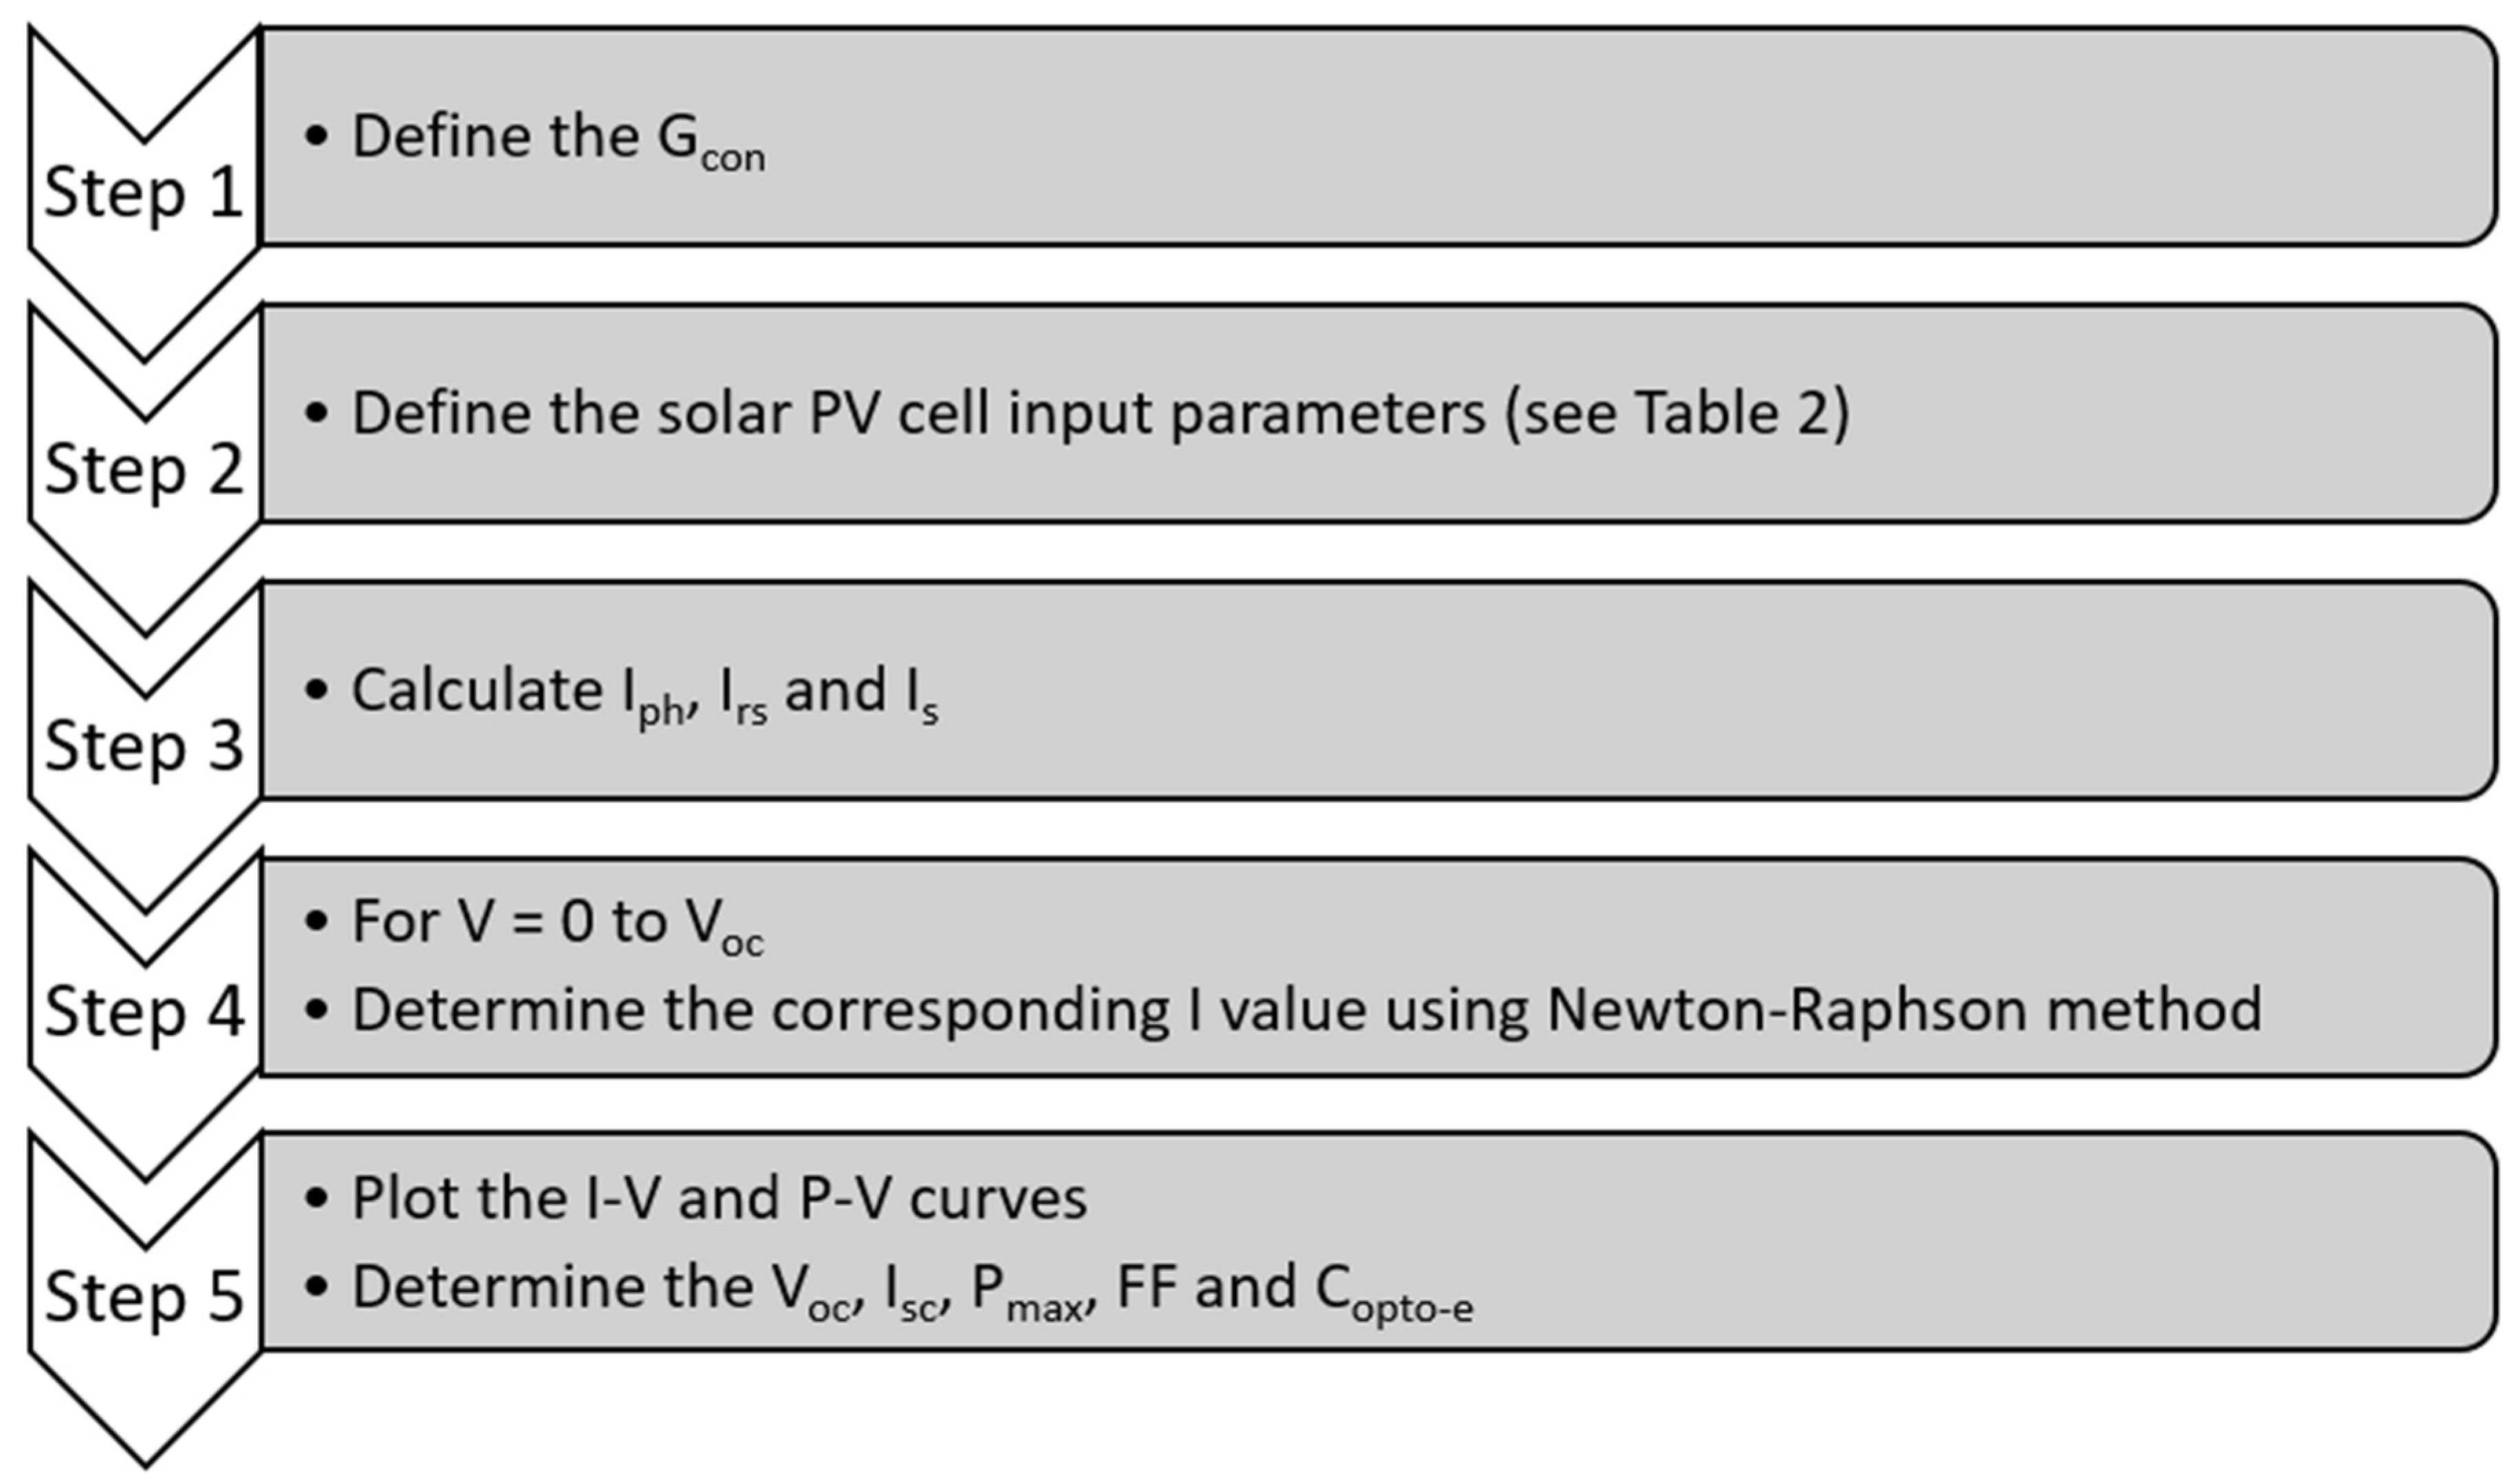
A MATLAB code was developed to envisage the electrical power output produced from the RADTIRC-PV structure using Equations (1)–(6). The code was developed to simulate the angular characteristics of the RADTIRC-PV structure from −50° to 50° with an increment 5°. Figure 4 demonstrates the steps needed to produce the I-V and P-V curves at each incident angle. A 0° incident angle means that the sun rays are perpendicular to the RADTIRC. The range of incident angle (±50°) was selected to demonstrate that the RADTIRC is capable of capturing the sun rays within its acceptance angle of ±40°. The code takes into account several parameters e.g., solar irradiance, opto-electronic gain (Equation (1)) and the key parameters of the solar PV cell. The code then calculate analytically the value of Iph, Irs and Is.
Afterwards, by evaluating Equations (4)–(6) and substituting back into Equation (3) and using Newton Raphson iteration method, the corresponding I value is obtained for voltages ranging from 0 to Voc. The corresponding value of power, P is calculated by multiplying the corresponding values of I and V. The I-V and P-V curves are then plotted at the end of the programme. In each simulation, the I-V and P-V characteristics were produced, and the short circuit current (Isc), the open-circuit voltage (Voc), the maximum power (Pmax), the fill factor (FF) and the opto-electronic gain (Copto-e) were determined and recorded.
The I-V and P-V characteristics generated from the simulations were compared with values obtained from the experiment described in Section 3.1. The relative error, RE for the each reading is calculated using the formula presented in Equation (7) [62] where ts and texp are the simulation and experimental values respectively. Table A1, Table A2, Table A3 and Table A4 in the Appendix demonstrated the comparison of simulation and experimental values (short circuit current, open circuit voltage, maximum power, fill factor, opto-electronic gain and the relative error) for the RADTIRC-PV structure and the bare PV cell.
RE = | t s t exp t s | × 100 %

5. Results and Discussions

Figure 5 depicted the simulated I-V and P-V characteristics of the RADTIRC-PV structure and the bare PV cell at normal incidence. The simulations were performed under a solar irradiance of 1000 W/m2 and at a temperature of 25 °C. From the simulations, the bare PV cell generated 0.0350 A of short circuit current, 0.5860 V of open-circuit voltage and 0.0165 W of maximum power output. The inclusion of RADTIRC in the structure increases the short circuit voltage to 0.1460 A, the open-circuit voltage to 0.0627 V and the maximum output power to 0.0740 W. The simulated opto–electronic gain, (calculated by dividing the short circuit current generated from the concentrator by the one produced from a bare PV cell), is calculated to be 4.1714.
The performances of the RADTIRC-PV structure and the bare PV cell were investigated at different incident angles between −50° and 50° to evaluate its angular response. In each simulation, the short circuit current (Isc), the open-circuit voltage (Voc), the maximum power (Pmax), the fill factor (FF) and the opto-electronic gain (Copto-e) were determined and recorded. The I-V and P-V characteristics generated from the simulations were compared with values obtained from the experiment.
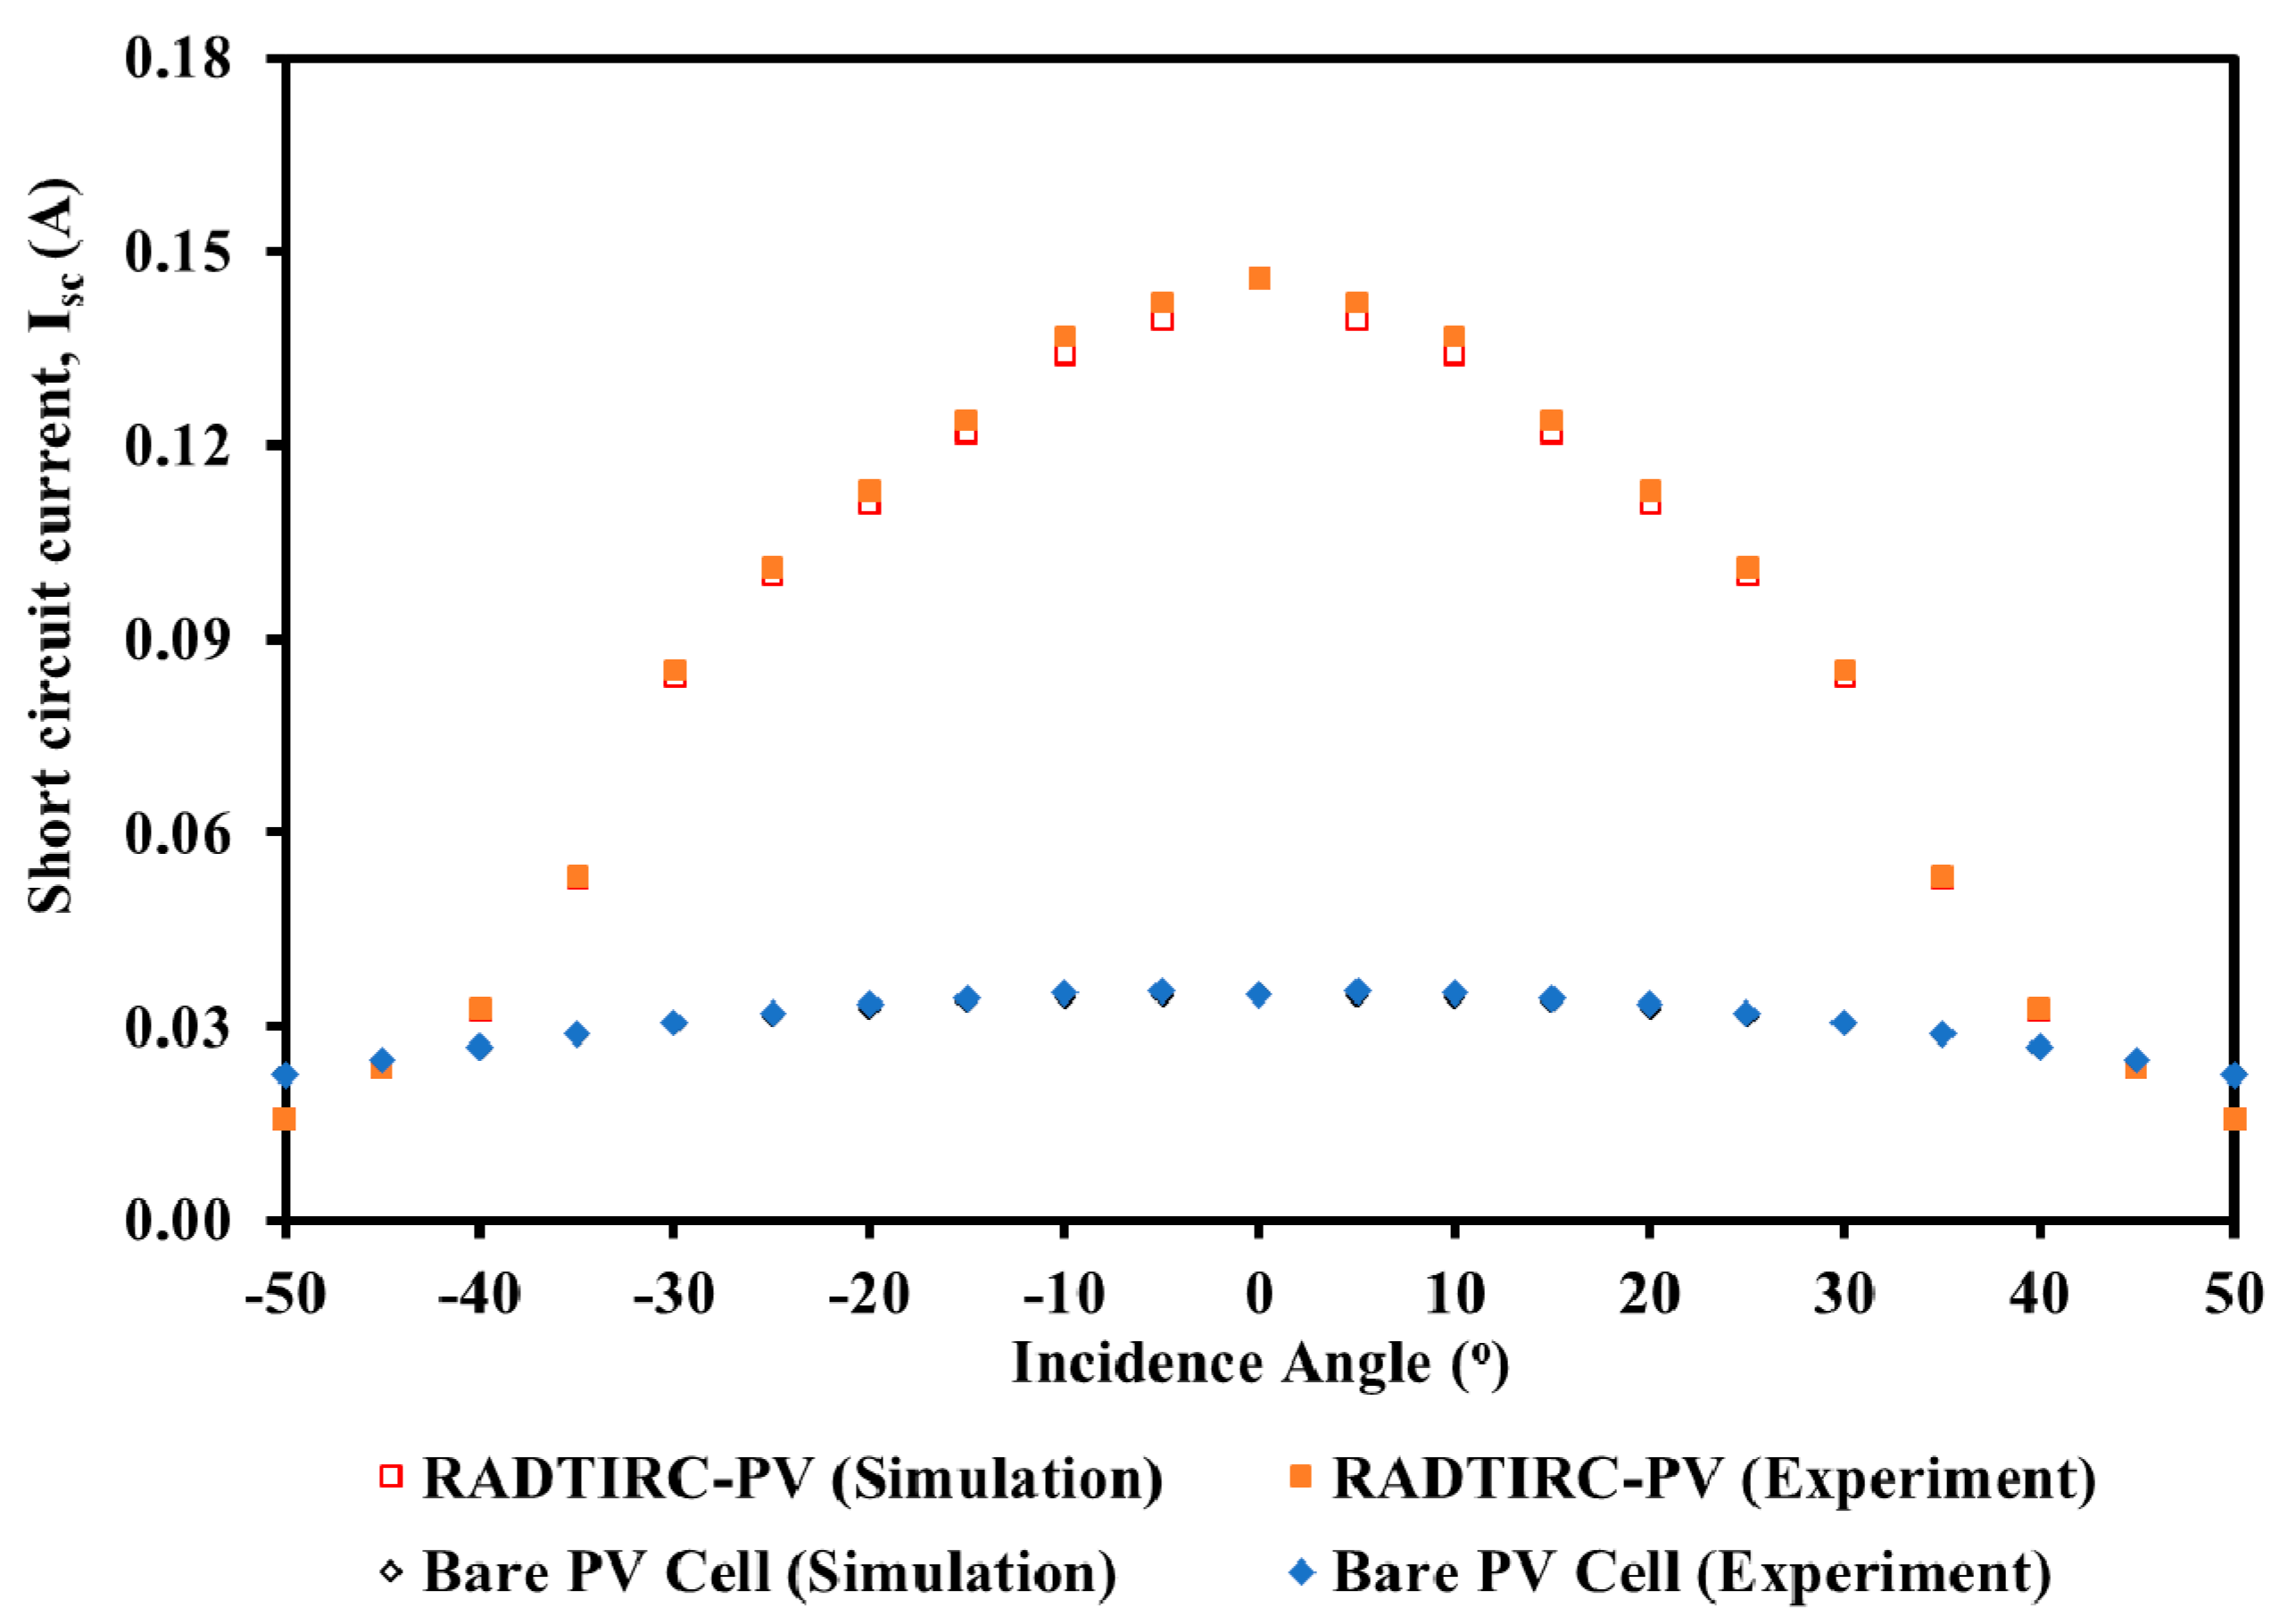
Figure 6 shows the comparison of the short circuit currents obtained from simulations and experiments for the RADTIRC-PV structure and a bare PV cell at STCs at different incident angles. For the RADTIRC-PV structure, the short circuit current experienced a drop from a maximum value of 0.1460 A at the normal incidence to 0.1219 A at the incident angles of ±15°. The short circuit current’s value reduced to less than half of the peak value when the incident angle is beyond ±30°. The value of the short circuit current produced from the RADTIRC-PV structure is less than the one generated from the bare PV cell outside the design half-acceptance angle of ±40°. This adheres to theory where outside the half-acceptance angle, the sun rays will not be directed to the exit aperture, rather they escape through the side profile of the concentrator [17]. It can be concluded that the RADTIRC-PV structure generates much higher short circuit current than the bare PV cell within the ‘design’ half-acceptance angles.
A similar trend is demonstrated by the bare PV cell, where the value of the simulated short circuit current gradually dropped from the 0.0350 A at normal incidence to lower values when the incident angle was increased from 0° to ±50°. The simulation values of the short circuit current agreed well with the experiment values for both the RADTIRC-PV structure and the bare PV cell, with the highest relative error of 2.1229% for both recorded at the incident angle of ±10°.
Specifically for the RADTIRC, the relative error for short circuit current value between simulation and experiment at normal incidence is 0.0000%, which is much better than the results obtained by Li et al. [43] which recorded a value of 1.5604% at similar setup.
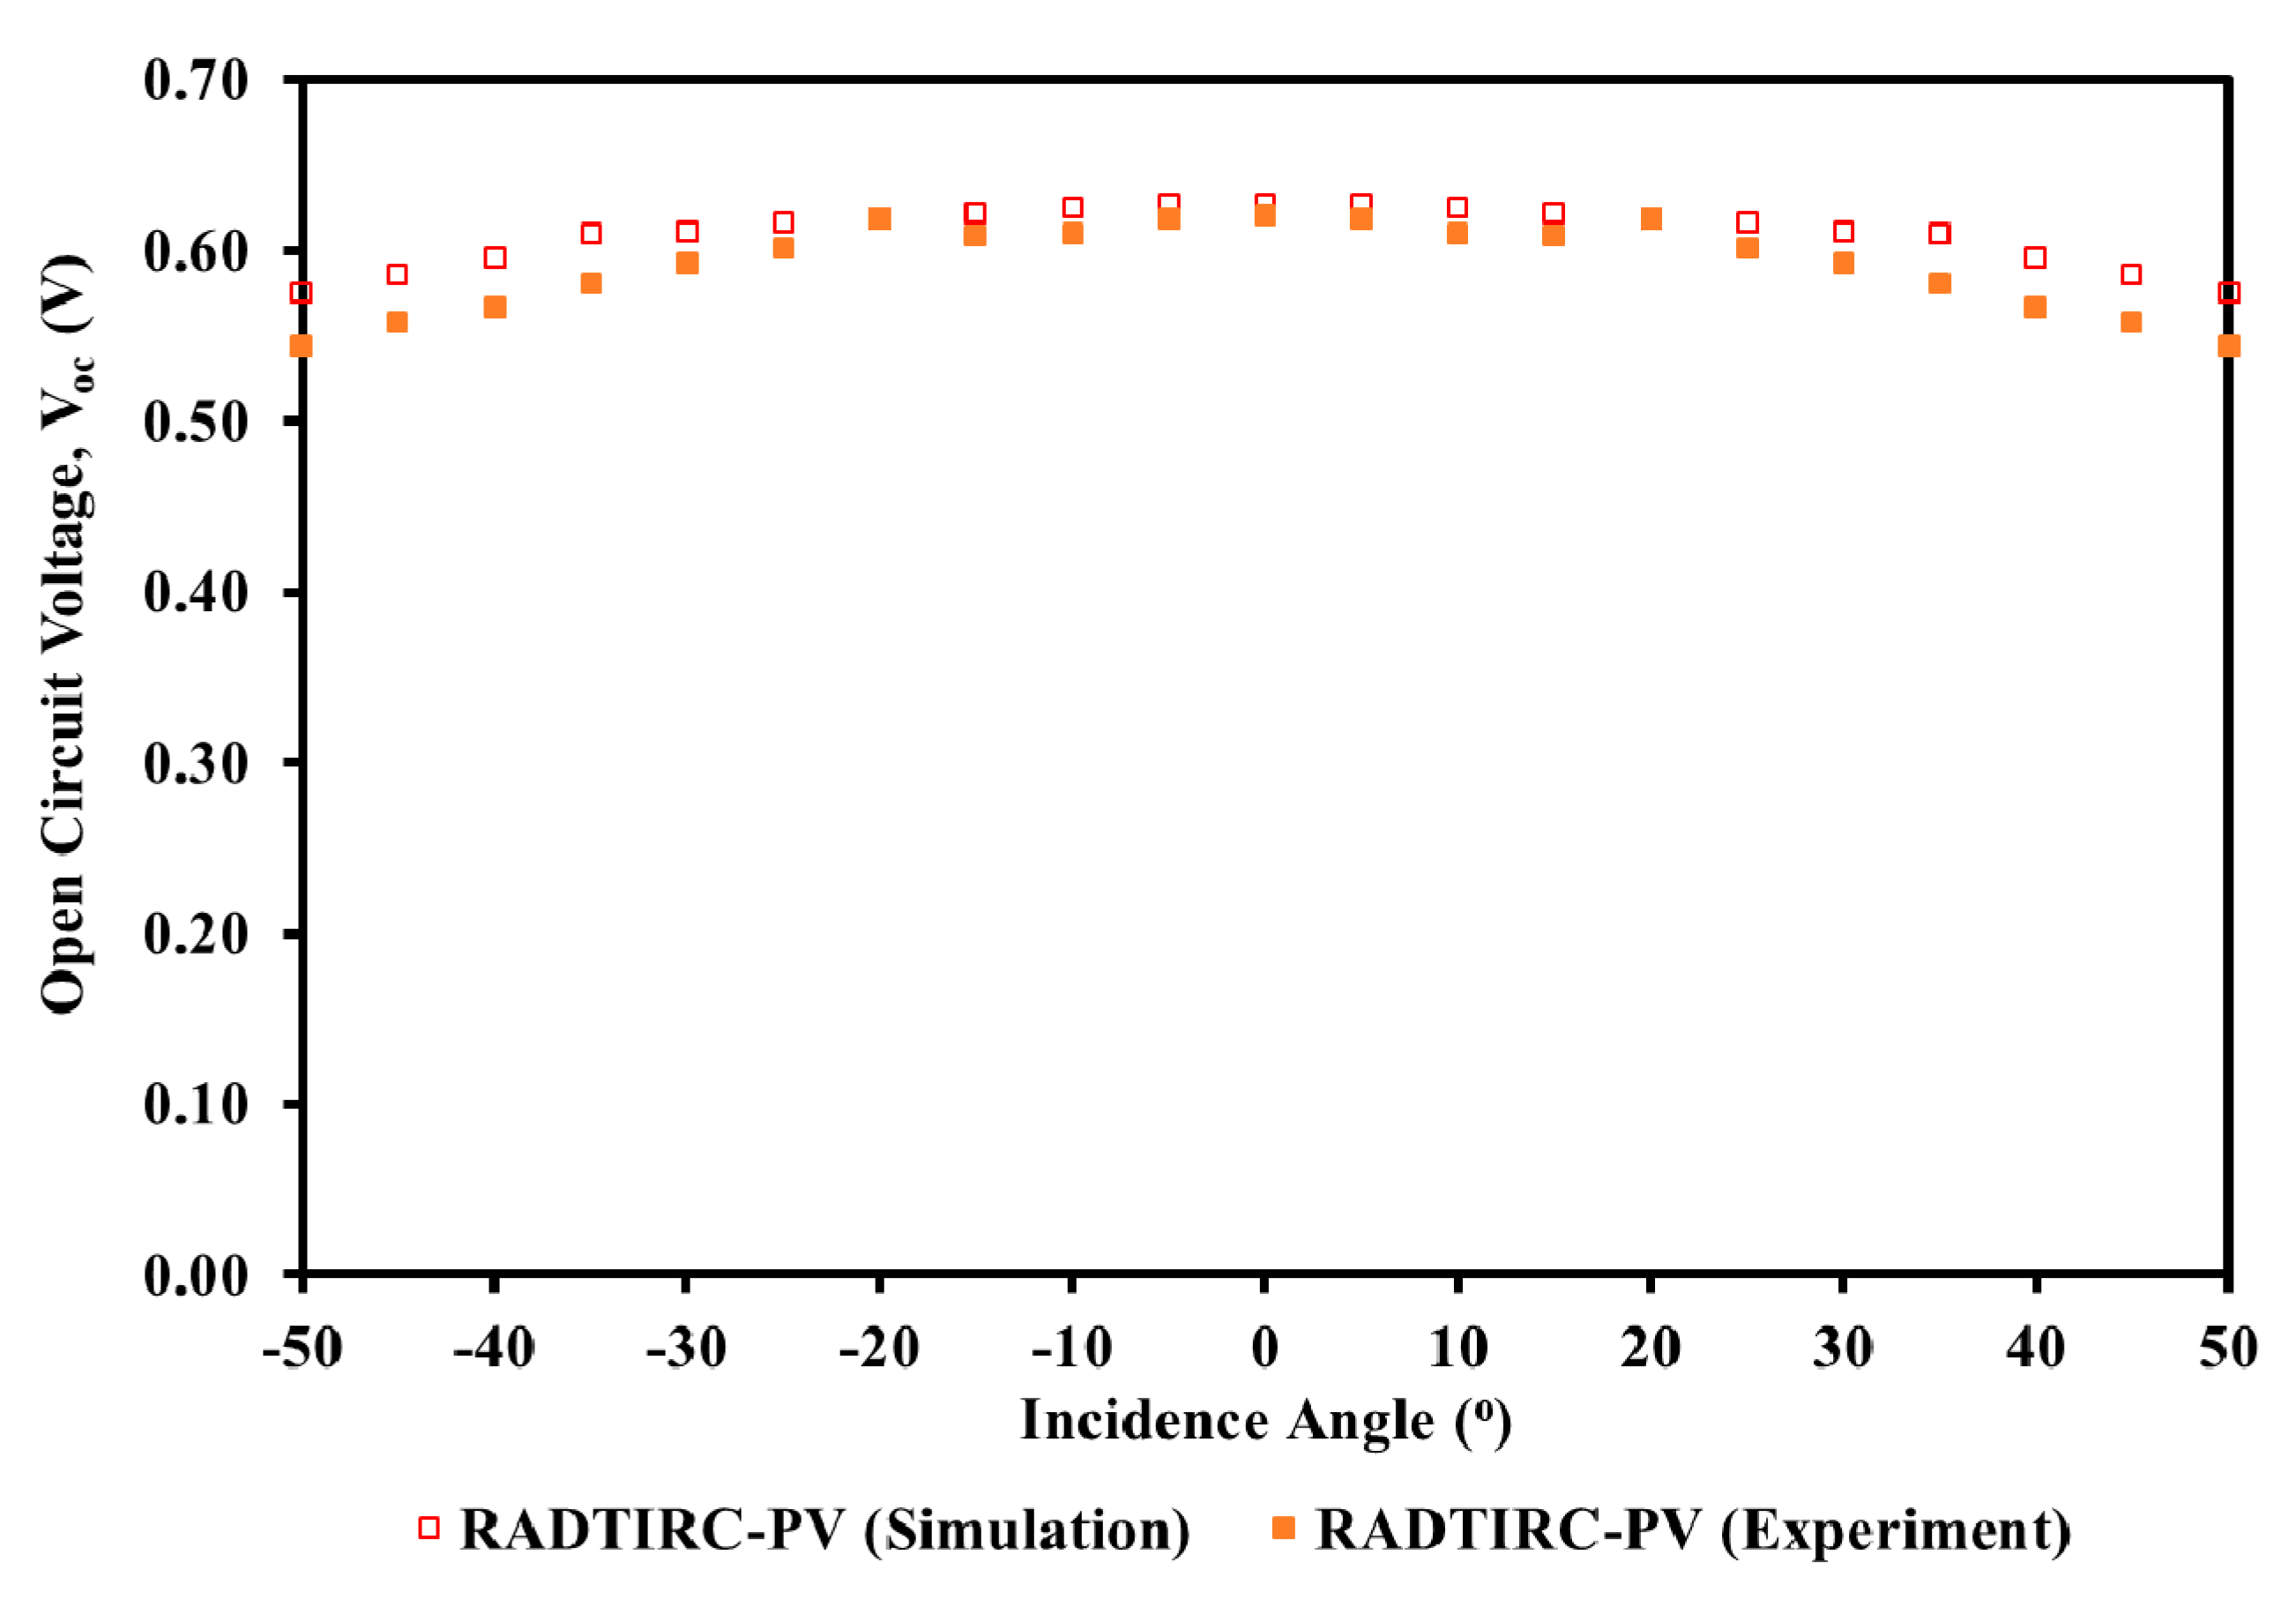
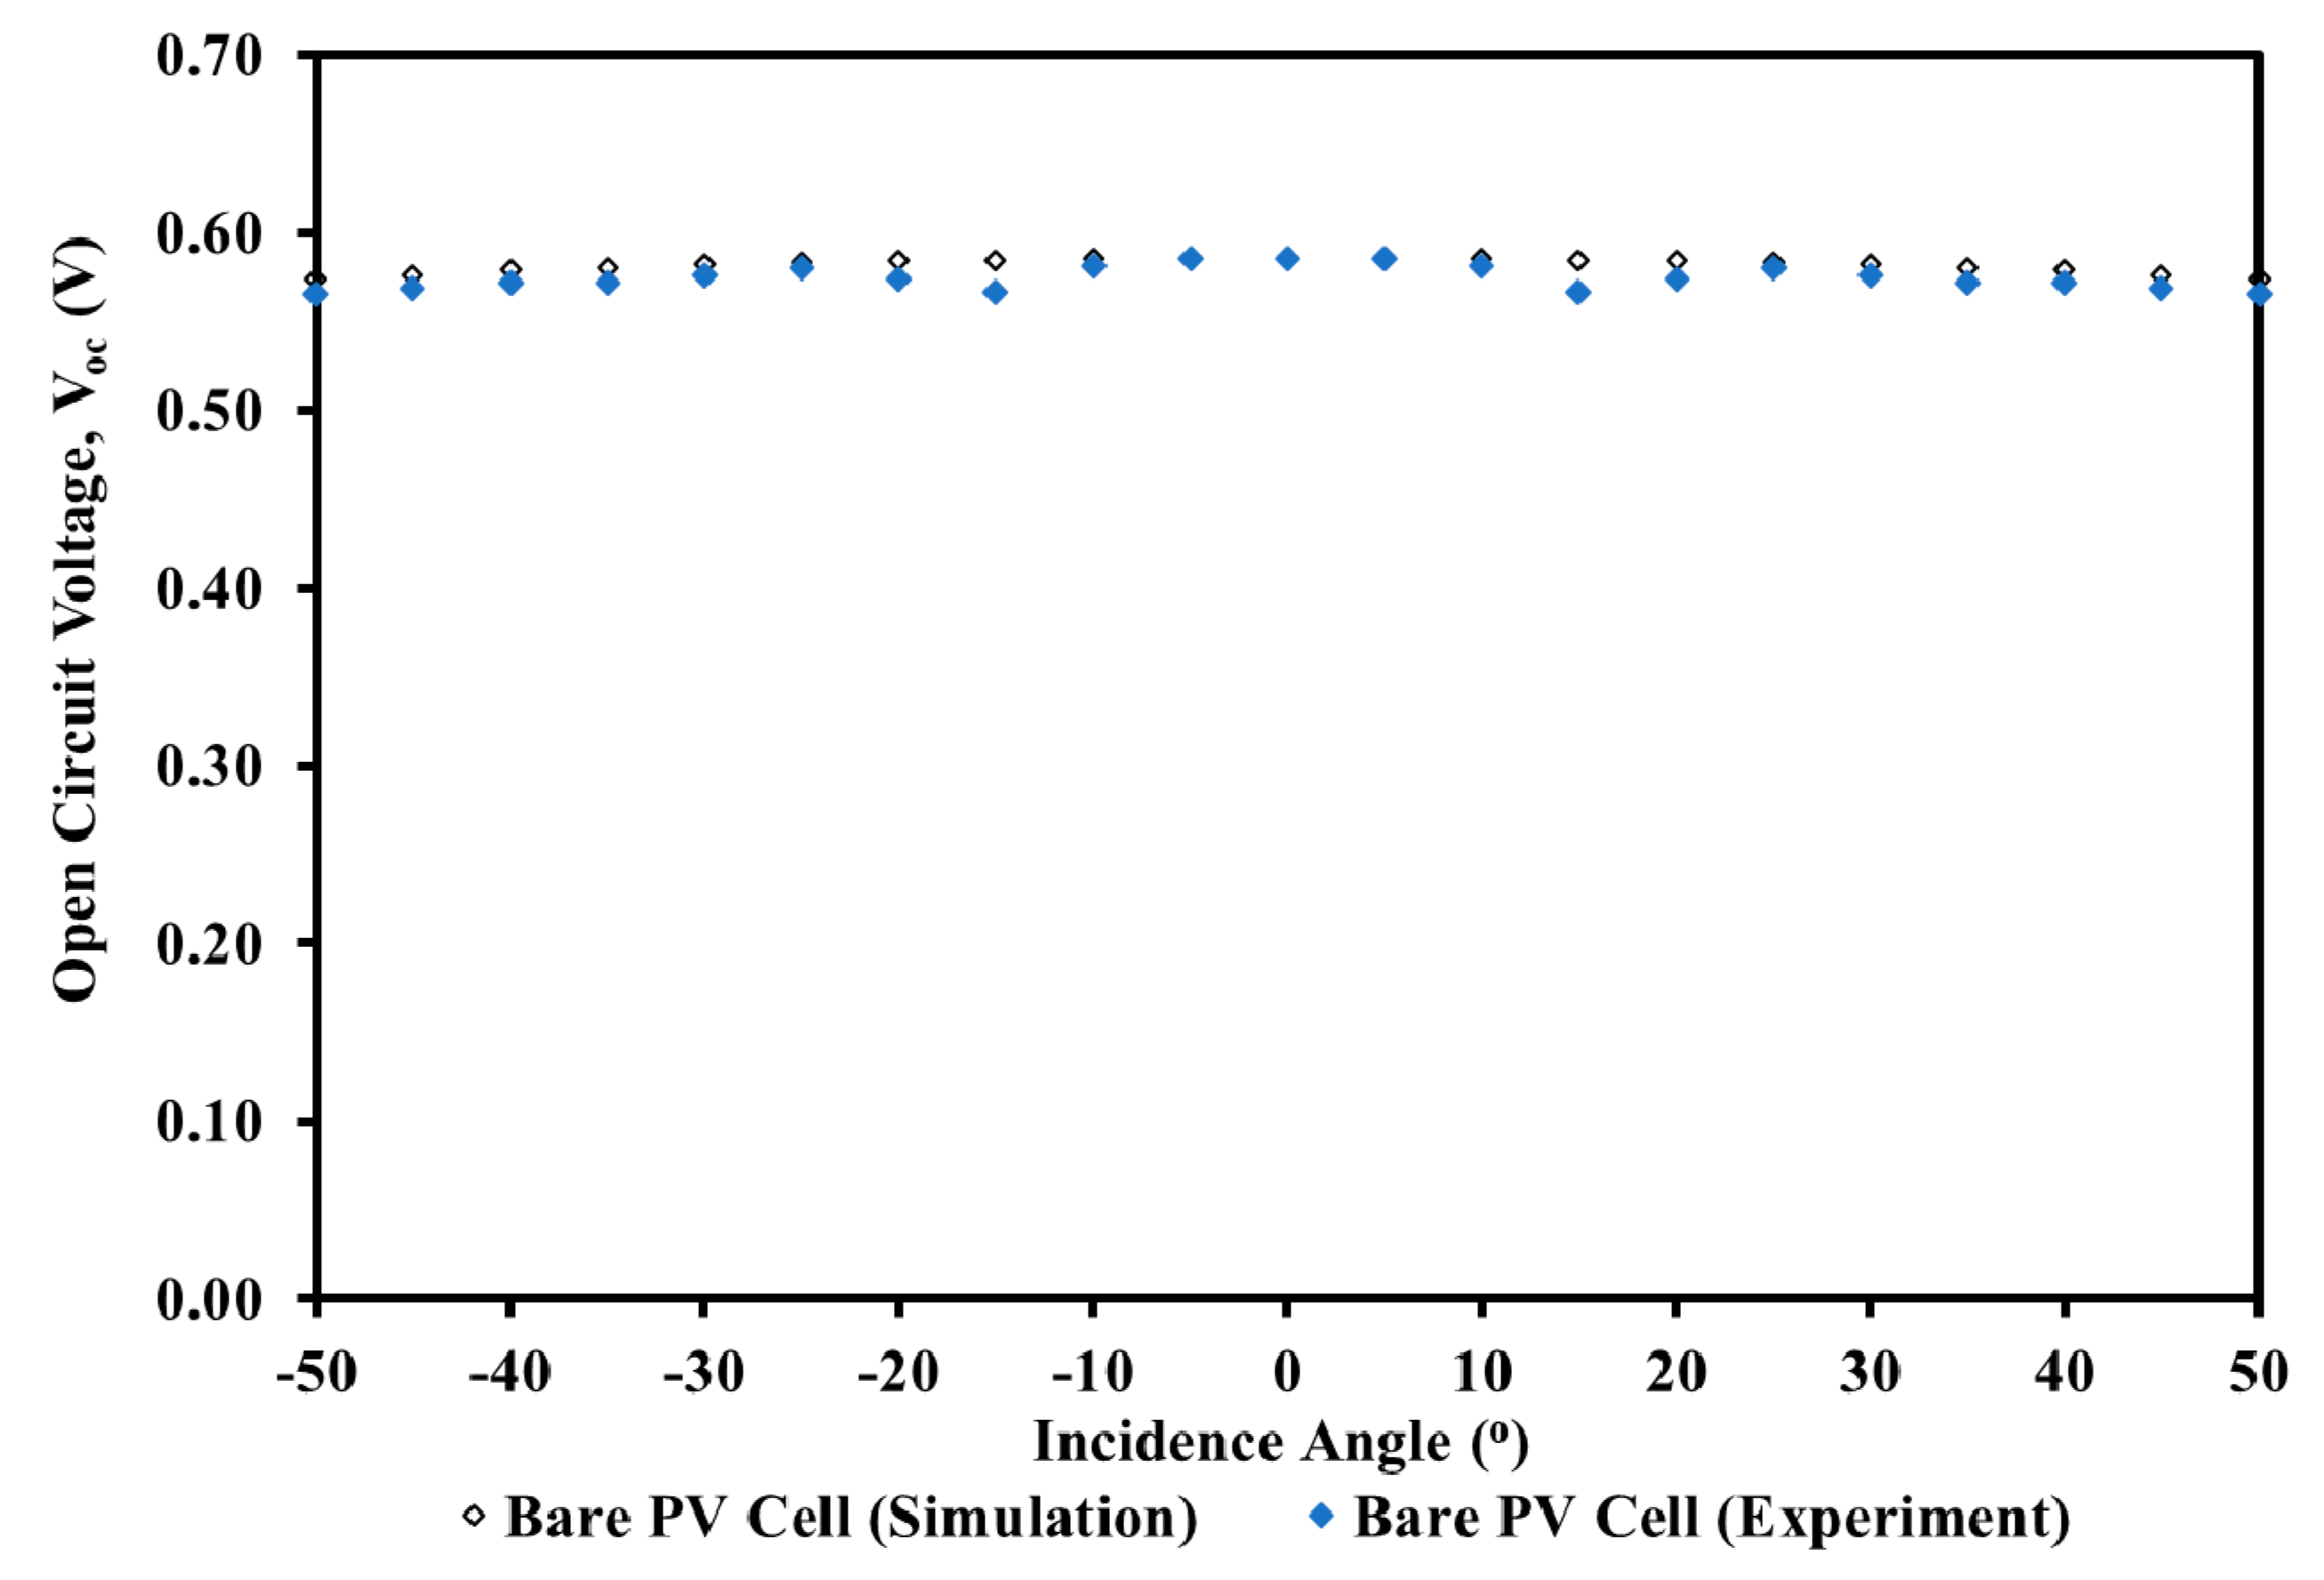
Figure 7 and Figure 8 show the comparison of the open circuit voltages obtained from simulations and experiments for the RADTIRC-PV structure and a bare PV cell at STCs at a different angle of incidence, correspondingly. The simulated open circuit voltage for the RADTIRC-PV structure experienced a gradual drop from a maximum value of 0.6270 V at the normal incidence to 0.5440 V at ±50° angle of incidence. The simulation values of the open-circuit voltage agreed well with the experiment values for the RADTIRC-PV structure, with the maximum relative error of 5.3913% recorded at the angle of incidence of ±50°.
Meanwhile, the simulated open circuit voltage for the bare PV cell experienced a gradual drop from a maximum value of 0.5860 V at the normal incidence to 0.5740 V at ±50° angle of incidence. The maximum relative error of 3.0769% recorded at the angle of incidence of ±15° when the simulation was compared with the experiment.
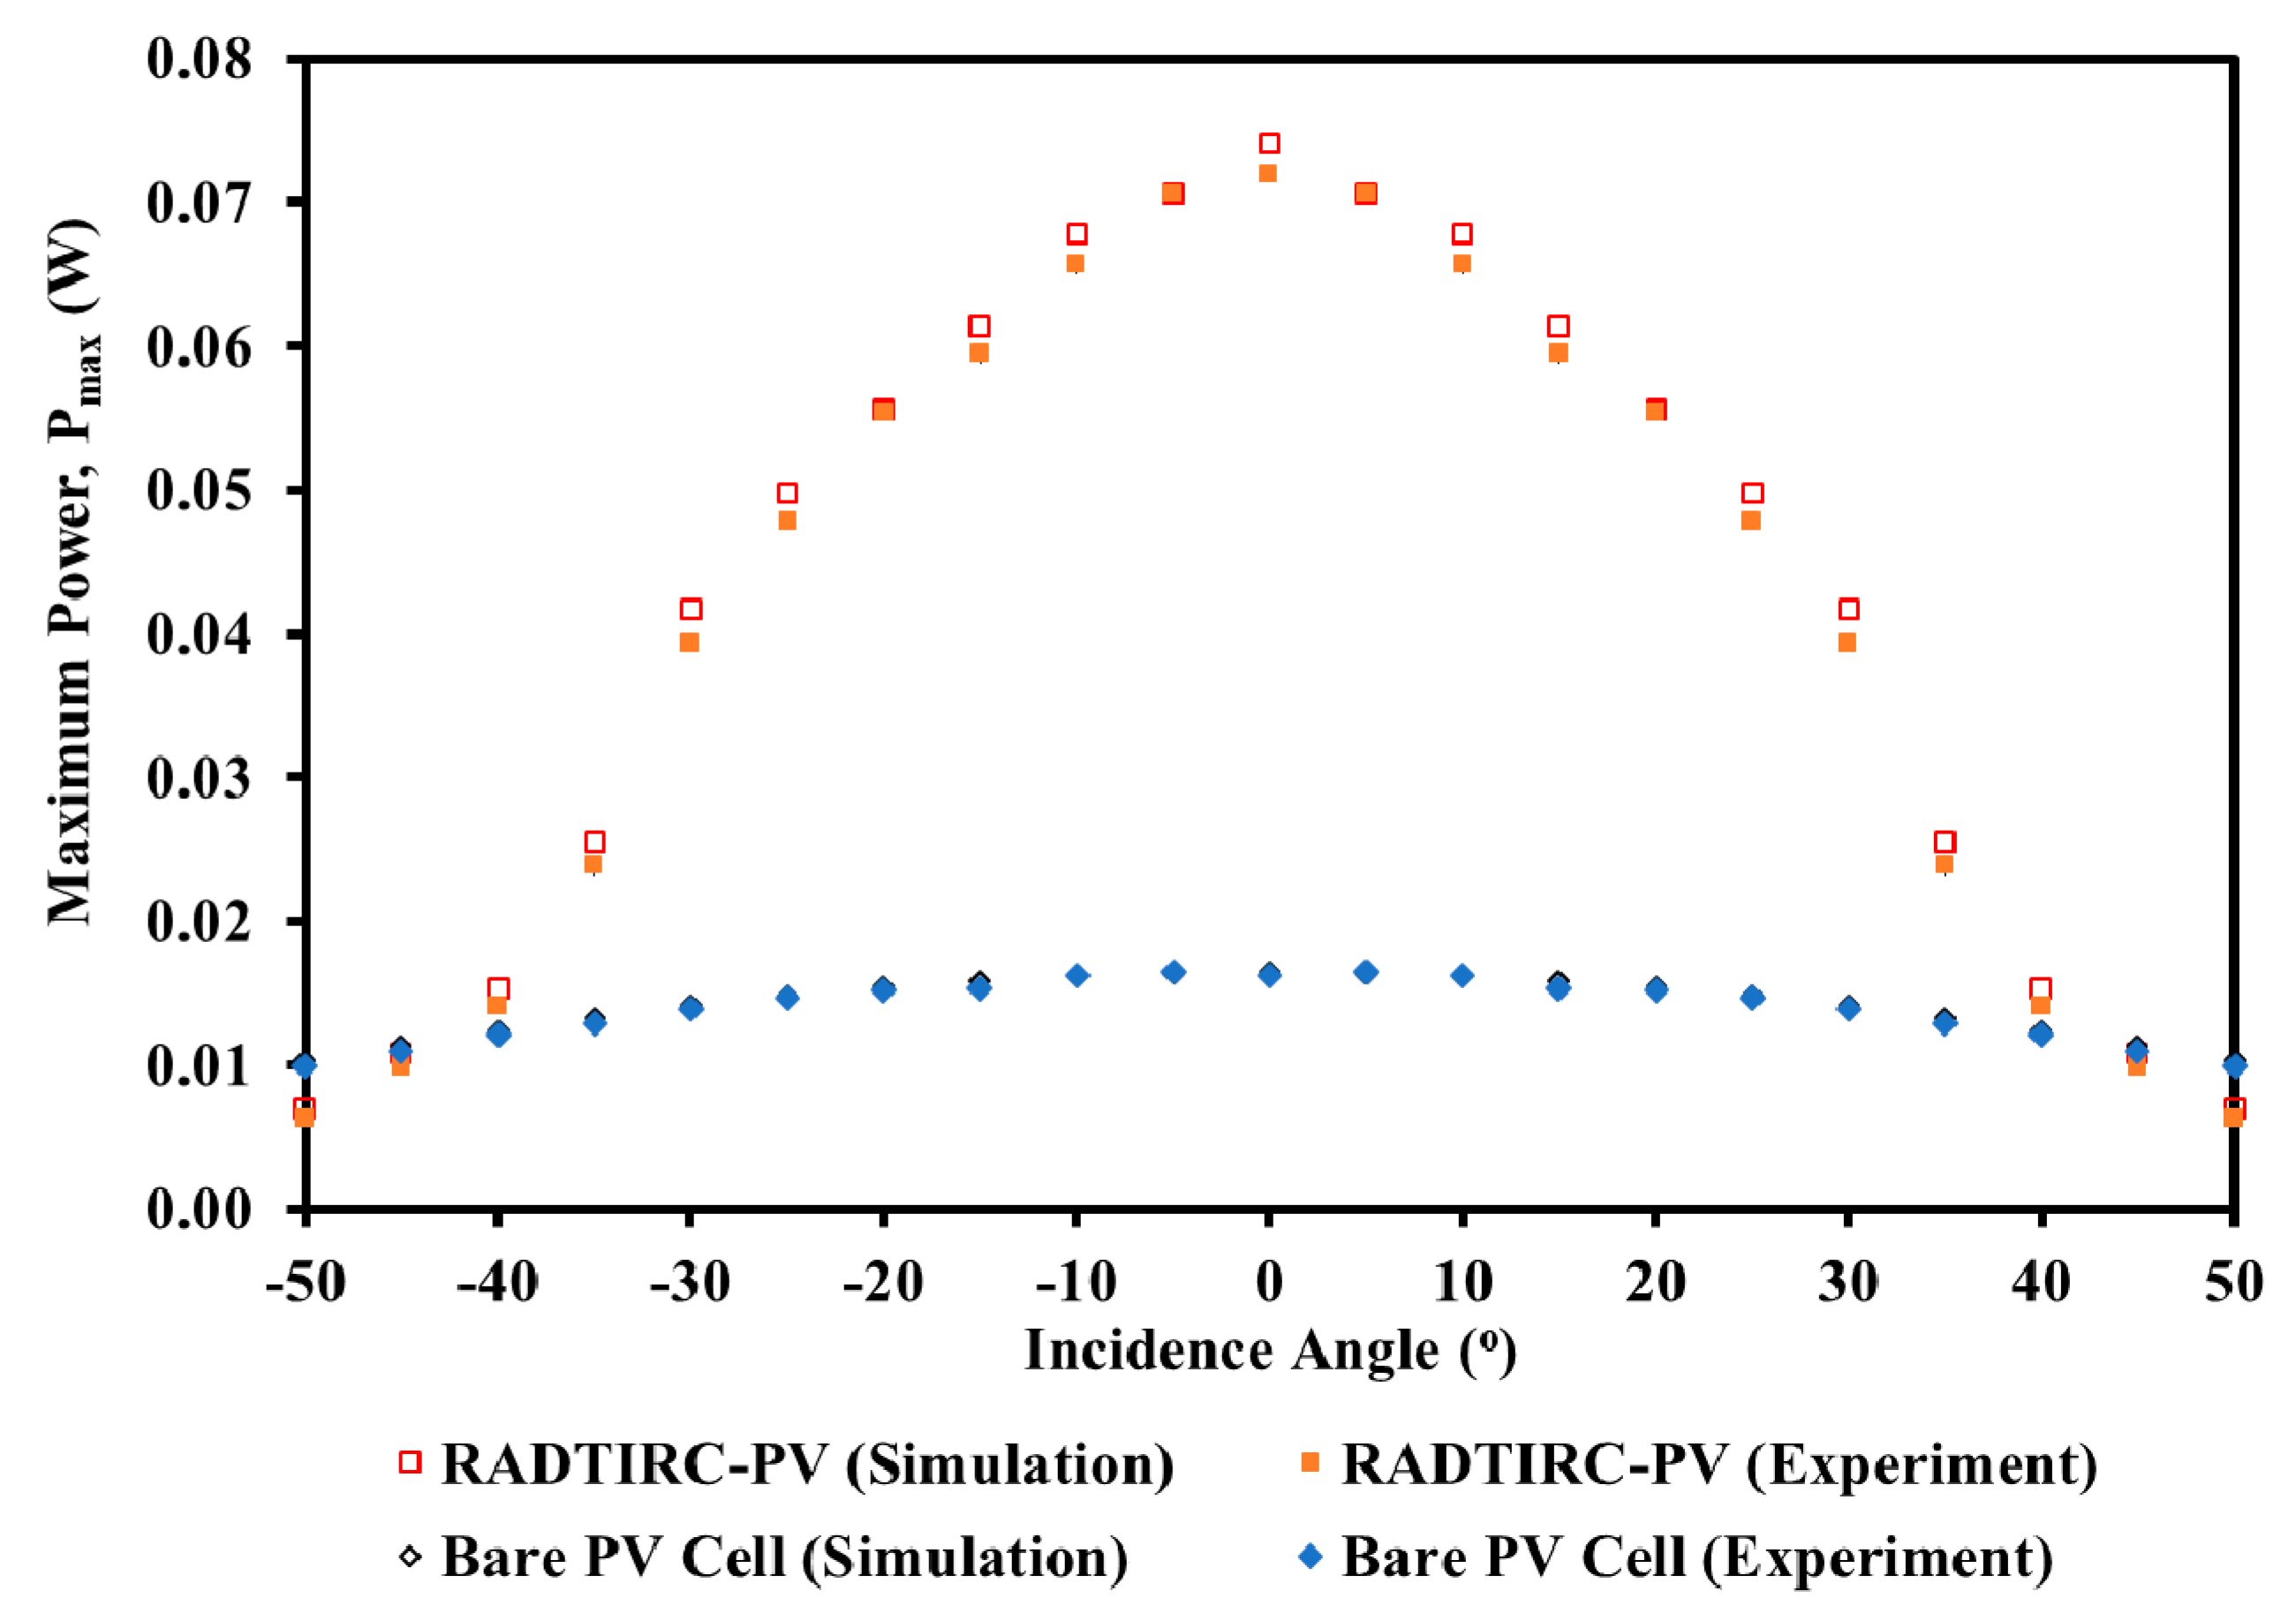
Looking at the maximum power generation, Figure 9 shows the comparison of the values obtained from simulations and experiments for the RADTIRC-PV structure and a bare PV cell at STCs at different incident angles. For the RADTIRC-PV structure, the simulations indicated that the peak value of 0.0740 W was achieved at normal incidence. This value reduced to 0.0613 W at ±15° angle of incidence. The maximum power value continued to drop reduced to less than half of the peak value when the incident angle is beyond ±30°. The maximum power value produced from the RADTIRC-PV structure is less than the one produced from the bare PV cell outside the design half-acceptance angle of ±40°.
A similar trend is demonstrated by the bare PV cell, where the value of the simulated maximum power gradually dropped from the peak value of 0.0165 W at normal incidence to lower values when the incident angle was raised from 0° to ±50°.
The maximum power simulation values showed a good agreement with the experiment values for the RADTIRC-PV structure, with the highest error of 9.9681% recorded at the incident angle of ±50°. As for the bare PV cell, the maximum relative error of 3.7463% was recorded at the angle of incidence of ±15° when the simulation was compared with the experiment.
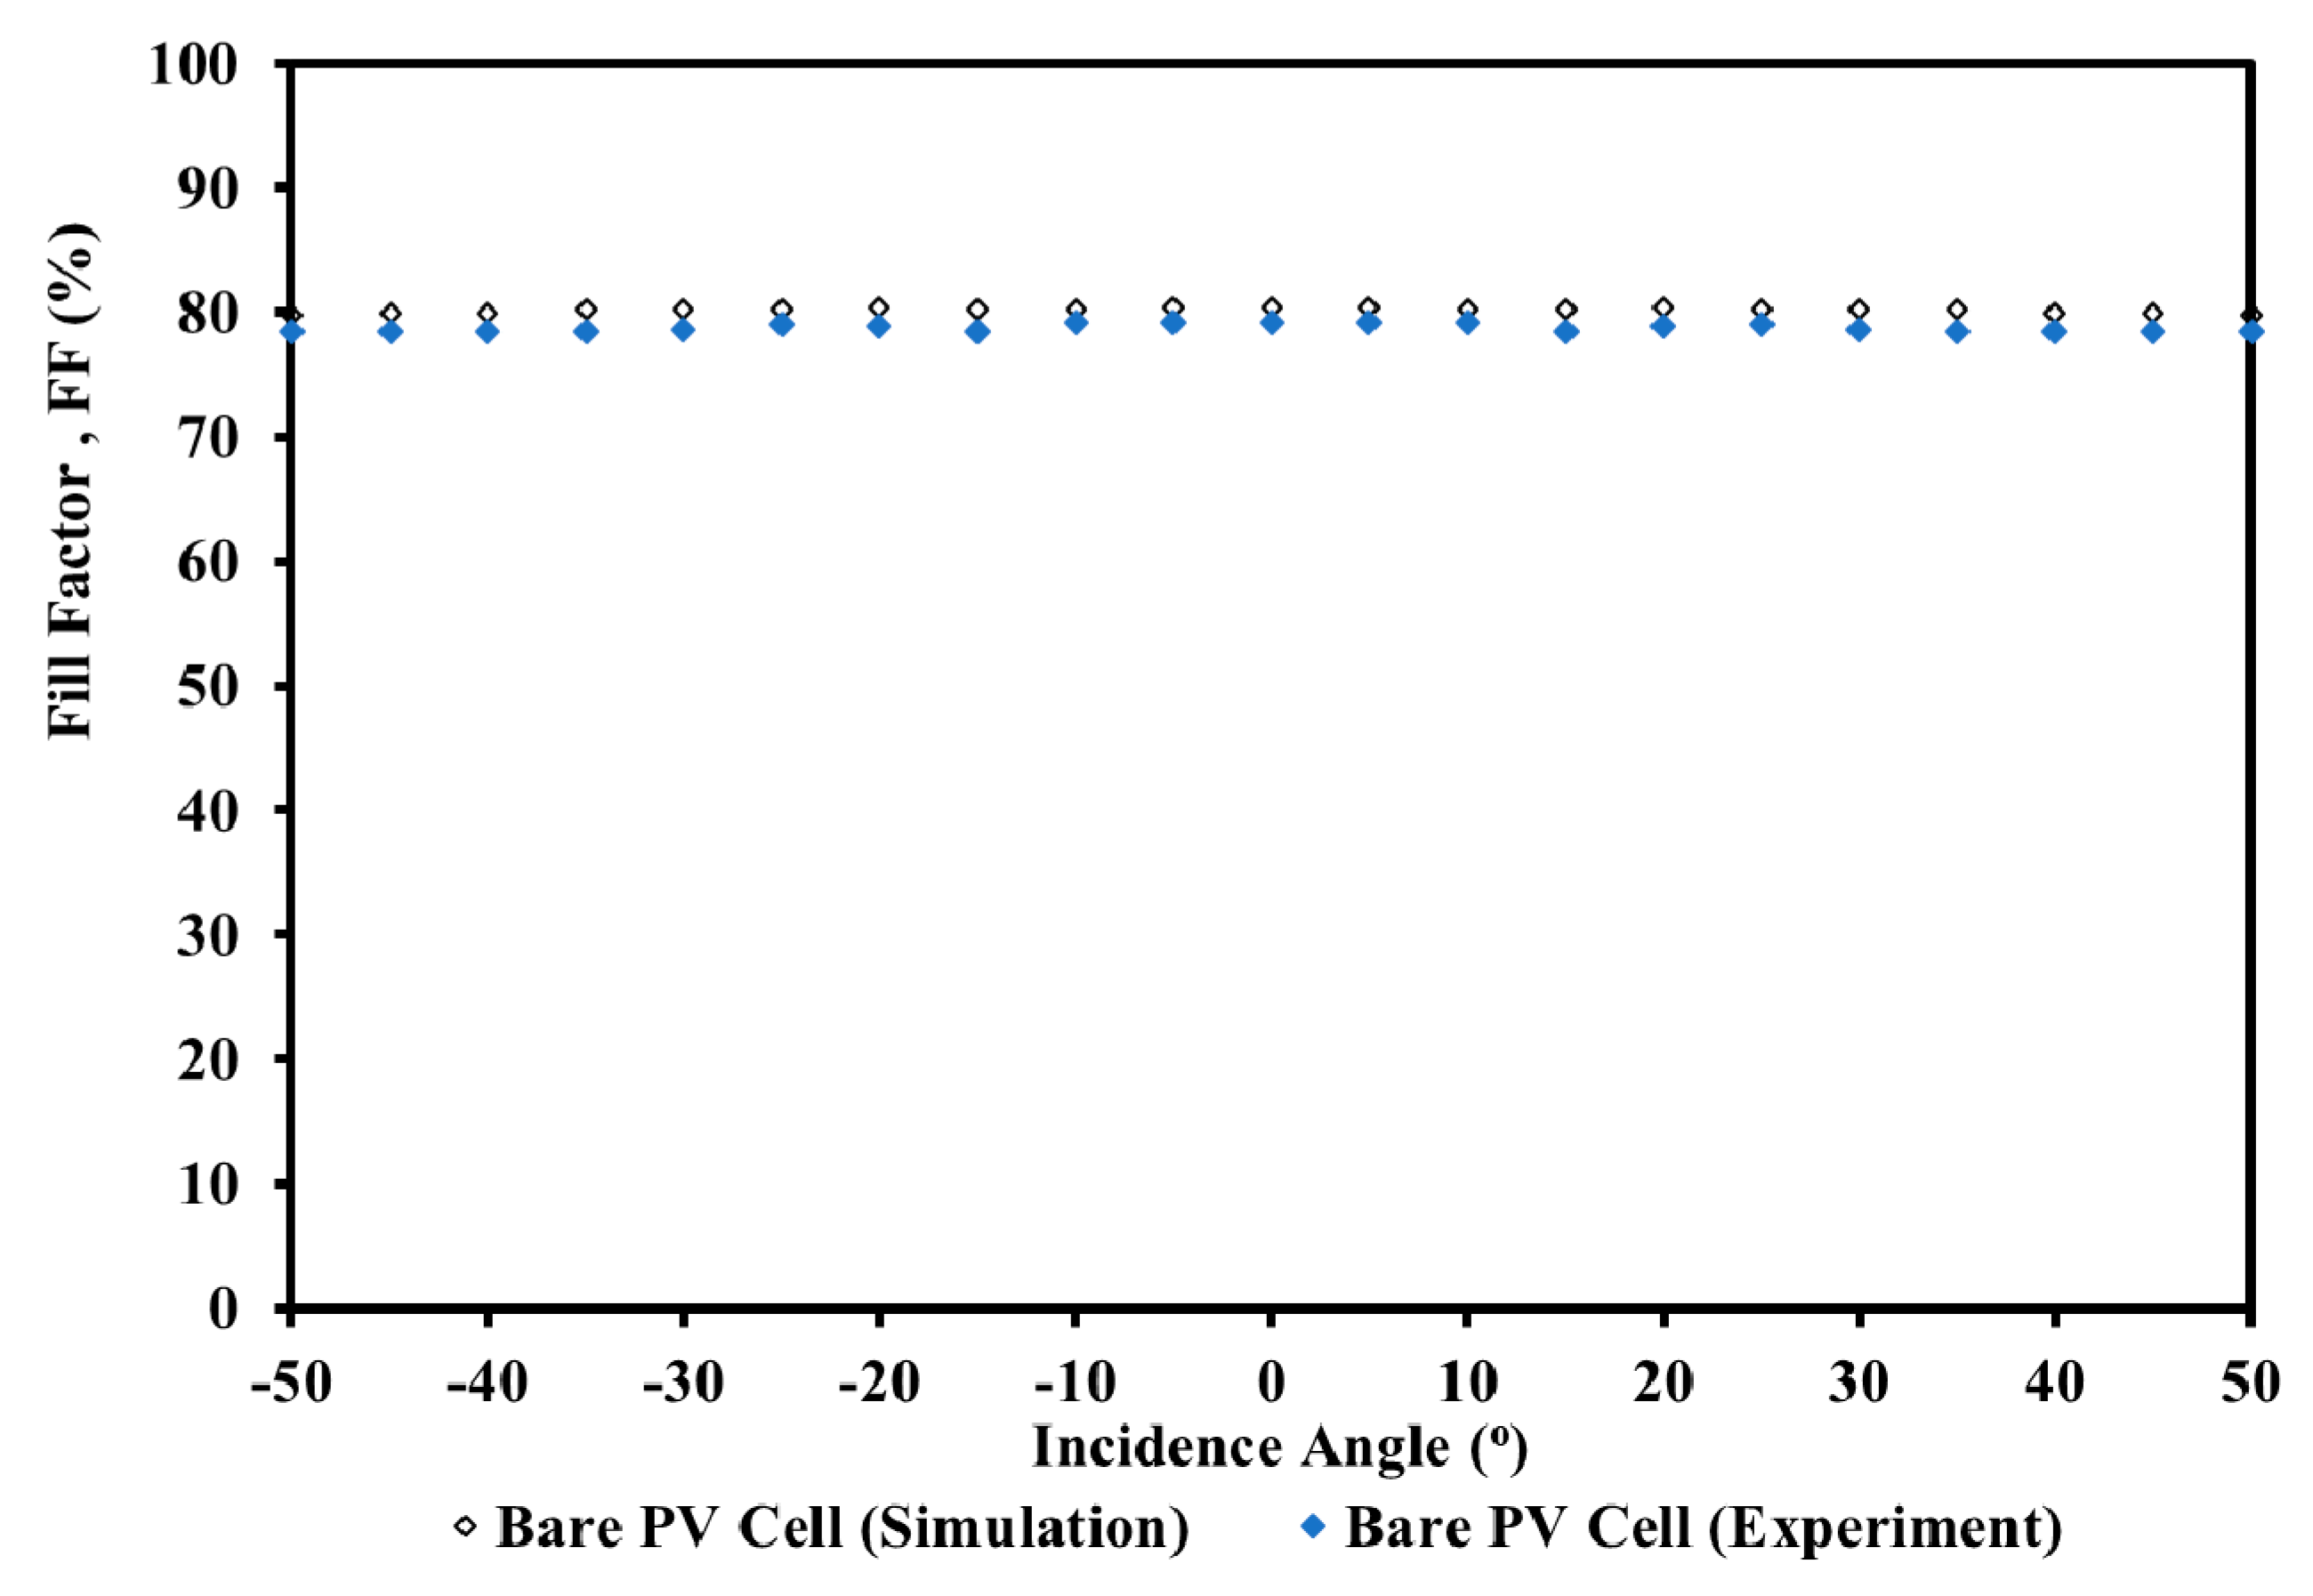
Figure 10 and Figure 11 show the comparison of the fill factor obtained from simulations and experiments for the RADTIRC-PV structure and a bare PV cell at STCs at a different angle of incidence, respectively. The simulated fill factor for the RADTIRC-PV structure varied between 77.6704% and 80.9228%. The simulation values of fill factor agreed well with the experiment values for the RADTIRC-PV structure, with the maximum relative error of 4.4231% recorded at the angle of incidence of ±50°.
Meanwhile, the simulated fill factor for the bare PV cell varied between 79.7782% and 80.3597%. The maximum relative error of 2.4014% recorded at the angle of incidence of ±15° when the simulation was compared with the experiment.
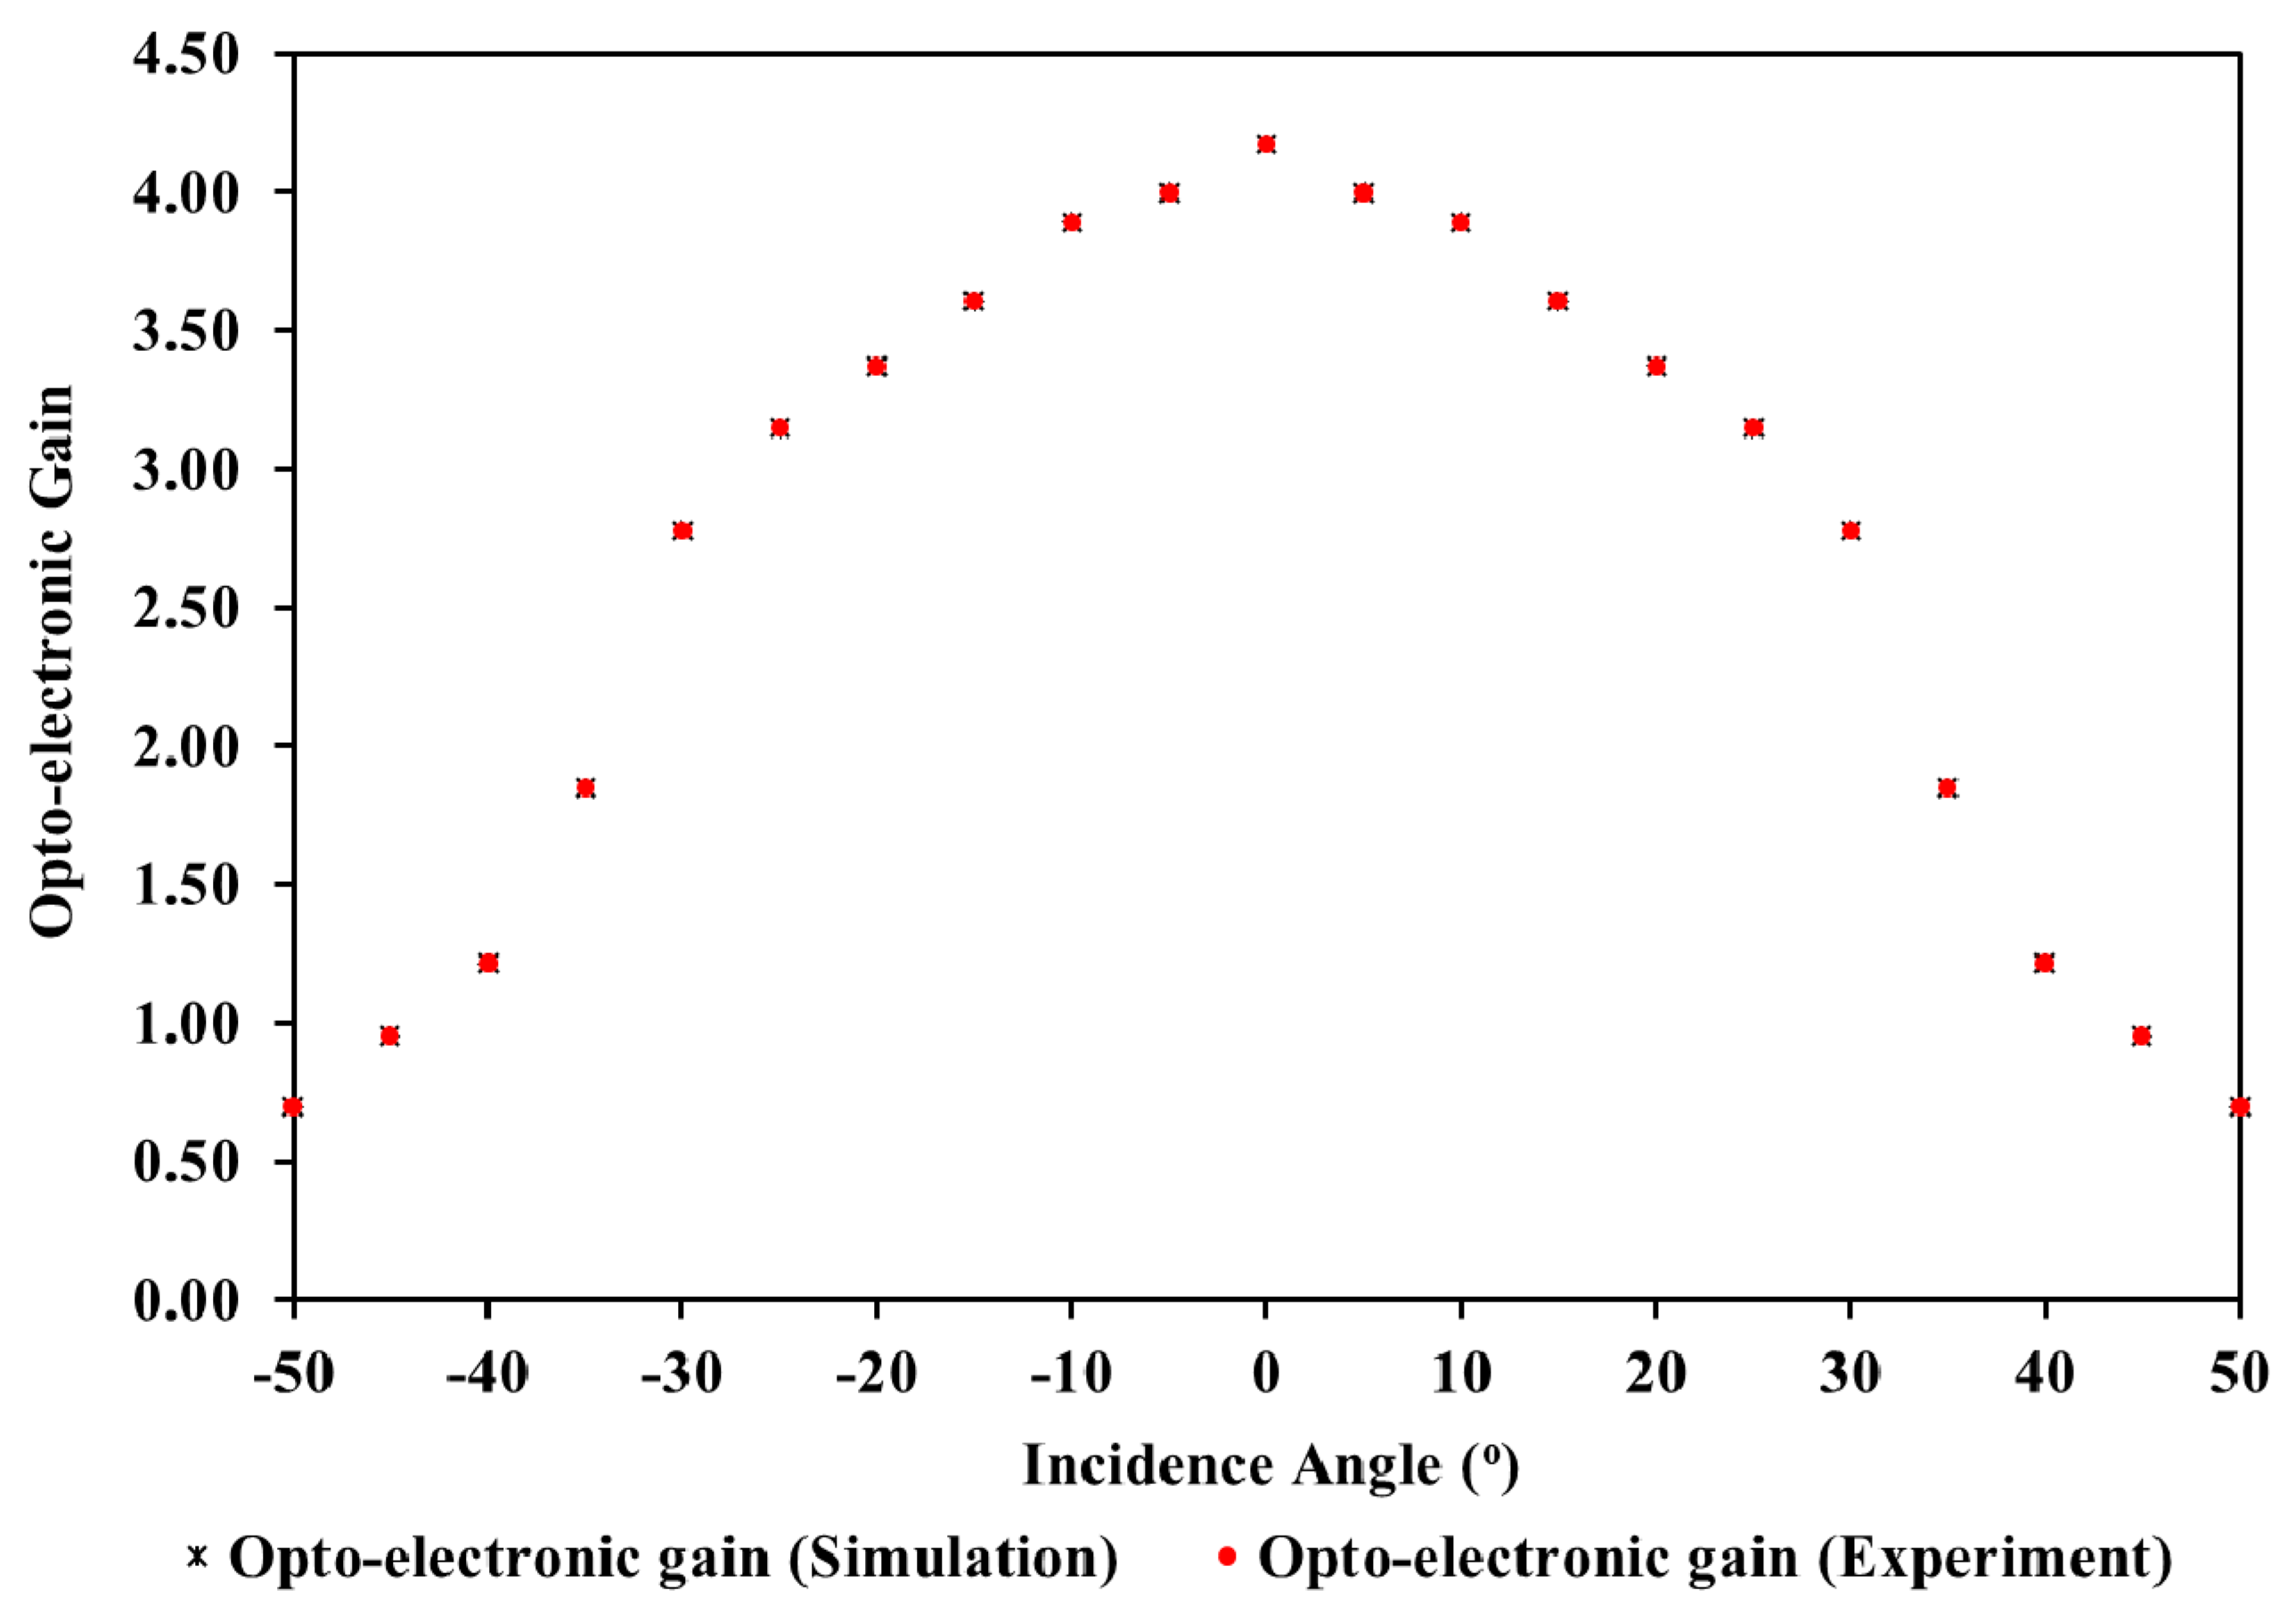
Figure 12 shows the assessment of the opto-electronic gains obtained from simulations and experiments for the RADTIRC-PV structure and a bare PV cell at STCs. The simulated opto-electronic gain experienced a drop from a maximum value of 4.1714 at the normal incidence to 3.6047 at ±15° angle of incidence. The opto-electronic gain value reduced to less than half of the maximum value when the incident angle is beyond ±30°. The opto-electronic gain value is less than one beyond the design half-acceptance angle of ±40°. The simulations shows very good agreement with the experiment, with no error relative error recorded at 4 decimal points.
The difference between the simulation and experimental values can be contributed by several reasons. One of the most important one is the effect of temperature on the solar cell. During the experiments, the RADTIRC-PV and the bare PV cells were exposed for a period of 5 s to obtained one set of I and V readings. This short exposure increases the cell’s temperature. The temperature has minimal effect on the short circuit current [63], but noticeable effect on the open circuit voltage and subsequently the maximum power output [64]. The effect of temperature was more apparent on CPV design when compared with the bare cell due to an increase in radiation concentration at the exit aperture [65,66]. This leads to much higher errors on the RADTIRC-PV readings.
Other source of errors include (i) errors during the manufacturing processes which made the physical dimensions of the RADTIRC to deviate from the dimensions of the CAD design dimensions, the entrance aperture’s irregular surfaces and over-polishing on the RADTIRC’s side profile; (ii) errors that occurred during the assembly processes where the effective area of the PV cell was reduced due to soldering of the tabbing wire on the solar PV cells, misalignment between the exit aperture of the RADTIRC and the solar cells, as well as losses at the lower part of the RADTIRC profile due to the index matching gel; and (iii) errors attributed to the rays of the sun such as reflection on the front surface of the concentrator and scattering which reduces the total rays arriving at the PV cell attached to exit aperture of the RADTIRC.

6. Conclusions

There has been an increasing demand to be able to model the performance and predict the amount of energy that could be generated from any solar PV cell. As a result of this, equivalent circuits of PV cells have been developed as well as other mathematical models to attempt to predict the performance characteristics and potential output power of a PV cell by many researchers. This paper discussed a MATLAB code’s performance, which was developed to simulate the I-V and P-V characteristics of the RADTIRC-PV structure. This paper also proposed and demonstrated for the first time the angular response of a CPV was simulated using MATLAB and the simulation results were verified through the experiment.
The performances of the RADTIRC-PV structure and the bare PV cell were simulated under STCs at different incident angles ranging from −50° to 50° and the results were compared with the ones obtained from indoor experiments. The simulation values of the short circuit current agreed well with the experiment values for the RADTIRC-PV structure, with the maximum relative error of 2.1229% obtained at the incident angle of ±10°. For the open-circuit voltage, the highest relative error of 5.3913% achieved at the incident angle of ±50°. The maximum power’s simulation values achieved the highest relative error of 9.9681% logged at the incident angle of ±50° when compared with the experimental value. Looking at the fill factor’s simulation values, the highest relative error of 4.4231% recorded at the incident angle of ±50° when compared with the experimental value. As for the opto-electronic gain, no error was recorded when the simulation was compared with the experiment. Further research needs to be carried out to determine the cause of peak error occurrences at specific incident angles. It can be concluded that the simulation model is able to predict the I-V and P-V characteristics of the RADTIRC-PV structure with good accuracy when compared with the experiment. It is expected the development of this code will enable the stakeholders to compute the I-V and P-V characteristics of any CPV as well as predicting the angular response of the CPV in a short period of time.

Author Contributions

Conceptualisation, F.M.-S.; Data curation, F.M.-S.; Formal analysis, F.M.-S., S.H.A.-B. and C.K.; Funding acquisition, F.M.-S., S.H.A.-B., J.A.A.-R., M.N.M. and N.A.B.; Investigation, F.M.-S., S.H.A.-B. and C.K.; Methodology, F.M.-S.; Project administration, F.M.-S.; Resources, F.M.-S.; Software, F.M.-S. and N.S.; Supervision, F.M.-S.; Validation, F.M.-S., S.H.A.-B. and N.S.; Visualization, F.M.-S. and S.H.A.-B.; Writing–original draft, F.M.-S., S.H.A.-B., N.S. and C.K.; Writing–review & editing, F.M.-S., H.F., S.H.A.-B., J.A.A.-R., N.S., C.K., M.N.M., N.A.B. and M.Z. and All authors have read and agreed to the published version of the manuscript.

Funding

The authors would like to thank Edinburgh Napier University for the Research Excellence Grant (REG) under the SEBE SEED-Corn fund and the Universiti Teknologi Malaysia for the Visiting Researcher (Publication) scheme (Q.J090000.21A4.00D20). The Article Processing Charges (APC) is funded by Agencia Nacional de Investigación y Desarrollo (ANID) through the projects Fondecyt regular 1200055 and Fondef ID19I10165 and by the Universidad Técnica Federico Santa María (UTFSM) through the project PI_m_19_01.

Data Availability Statement

Raw data can be obtained by contacting the lead author Firdaus Muhammad-Sukki.

Conflicts of Interest

The authors declare no conflict of interest. The funders had no role in the design of the study; in the collection, analyses, or interpretation of data; in the writing of the manuscript, or in the decision to publish the results.

Appendix A

Table A1. Comparison of simulation and experimental value for the RADTIRC-PV structure.
Incident Angle
(°)
SimulationExperimentRelative Error
Voc
(V)
Isc
(A)
Pmax
(W)
Voc
(V)
Isc
(A)
Pmax
(W)
Voc
(%)
Isc
(%)
Pmax
(%)
00.62700.14600.07400.62100.14600.07200.95690.00002.7074
±50.62700.13950.07060.61900.14200.07061.27591.81600.0168
±100.62500.13420.06780.60950.13700.06572.48002.12293.0815
±150.62200.12190.06130.60850.12400.05952.17041.75293.0085
±200.61900.11090.05560.61900.11300.05540.00001.85700.2555
±250.61600.09980.04970.60100.10100.04792.43511.19553.7888
±300.61100.08430.04170.59280.08510.03942.97870.95385.5375
±350.61000.05300.02550.58050.05320.02384.83610.45236.6623
±400.59600.03260.01530.56620.03270.01415.00000.32997.4529
±450.58600.02350.01080.55800.02350.00994.77820.19698.5441
±500.57500.01570.00700.54400.01560.00635.39130.43379.9681
Table A2. Comparison of simulation and experimental value for the bare PV cell.
Incident Angle
(°)
SimulationExperimentRelative Error
Voc
(V)
Isc
(A)
Pmax
(W)
Voc
(V)
Isc
(A)
Pmax
(W)
Voc
(%)
Isc
(%)
Pmax
(%)
00.58600.03500.01650.58600.03500.01620.00000.00001.4684
±50.58600.03490.01640.58550.03550.01650.08531.81600.2868
±100.58600.03450.01620.58100.03520.01620.85322.12290.0304
±150.58500.03380.01590.56700.03440.01533.07691.75293.7463
±200.58400.03290.01540.57350.03350.01521.79791.85701.7812
±250.58300.03170.01480.58000.03210.01470.51461.19550.9565
±300.58200.03030.01410.57600.03060.01391.03090.95382.0716
±350.58000.02870.01330.57200.02880.01291.37930.45233.1050
±400.57900.02680.01240.57200.02690.01211.20900.32992.8453
±450.57600.02470.01140.56900.02470.01101.21530.19693.3874
±500.57400.02250.01030.56600.02240.00991.39370.43373.5023
Table A3. Comparison of simulation and experimental value for the fill factor of the RADTIRC-PV and the bare PV cell.
Incident Angle
(°)
SimulationExperimentRelative Error
Bare PV
(FF)
RADTIRC-PV
(FF)
Bare PV
(FF)
RADTIRC-PV
(FF)
Bare PV
(%)
RADTIRC-PV
(%)
080.359779.179680.873479.44411.46841.7673
±580.341179.202080.714980.31331.41790.4975
±1080.284679.268180.836178.66741.26612.6828
±1580.328278.399280.879878.80562.40142.5646
±2080.330578.879480.922879.24441.80642.0740
±2580.289778.988780.912178.84681.62042.5525
±3080.202078.608980.902478.02451.98633.5572
±3580.198878.440779.070777.20412.19222.3607
±4079.997178.413478.669776.38651.97972.9023
±4580.000478.395678.379375.42802.00593.7654
±5079.778278.412377.670474.23501.71214.4231
Table A4. Comparison of simulation and experimental value for the opto-electronic gain.
Incident Angle
(°)
SimulationExperimentRelative Error
(%)
04.17144.17140.0000
±54.00004.00000.0000
±103.89203.89200.0000
±153.60473.60470.0000
±203.37313.37310.0000
±253.14643.14640.0000
±302.78102.78100.0000
±351.84721.84720.0000
±401.21561.21560.0000
±450.95140.95140.0000
±500.69640.69640.0000

References

  1. Qazi, S. Mobile photovoltaic systems for disaster relief and remote areas. In Standalone Photovoltaic (PV) Systems for Disaster Relief and Remote Areas; Reading, L., Ed.; Elsevier: Cambridge, MA, USA, 2017; pp. 83–112. [Google Scholar]
  2. Fadakar Masouleh, F.; Das, N.; Rozati, S. Nano-structured gratings for improved light absorption efficiency in solar cells. Energies 2016, 9, 756. [Google Scholar] [CrossRef] [Green Version]
  3. Das, N.; Wongsodihardjo, H.; Islam, S. Modeling of multi-junction photovoltaic cell using MATLAB/Simulink to improve the conversion efficiency. Renew. Energy 2015, 74, 917–924. [Google Scholar] [CrossRef]
  4. Jithin, M.; Saravanakumar, K.; Ganesan, V.; Reddy, V.R.; Razad, P.M.; Patidar, M.M.; Jeyadheepan, K.; Marimuthu, G.; Sreelakshmi, V.R.; Mahalakshmi, K. Growth, mechanism and properties of TiO2 nanorods embedded nanopillar: Evidence of lattice orientation effect. Superlattices Microstruct. 2017, 109, 145–153. [Google Scholar] [CrossRef]
  5. Zhang, K.N.; Jiang, Z.N.; Wang, T.; Qiao, J.W.; Feng, L.; Qin, C.C.; Yin, H.; So, S.K.; Hao, X.T. Exploring the mechanisms of exciton diffusion improvement in ternary polymer solar cells: From ultrafast to ultraslow temporal scale. Nano Energy 2021, 79, 105513. [Google Scholar] [CrossRef]
  6. Al Kurdi, K.; McCarthy, D.P.; McMeekin, D.P.; Furer, S.O.; Tremblay, M.H.; Barlow, S.; Bach, U.; Marder, S.R. A naphthalene diimide side-chain polymer as an electron-extraction layer for stable perovskite solar cells. Mater. Chem. Front. 2021, 5, 450–457. [Google Scholar] [CrossRef]
  7. Angmo, D.; DeLuca, G.; Scully, A.D.; Chesman, A.S.R.; Seeber, A.; Zuo, C.; Vak, D.; Bach, U.; Gao, M. A lab-to-fab study toward roll-to-roll fabrication of reproducible perovskite solar cells under ambient room conditions. Cell Rep. Phys. Sci. 2021, 2, 100293. [Google Scholar] [CrossRef]
  8. Masson, G.; Kaizuka, I. Trends in Photovoltaic Applications 2020; IEA PVPS: Paris, France, 2020. [Google Scholar]
  9. Martinez-Plaza, D.; Abdallah, A.; Figgis, B.W.; Mirza, T. Performance improvement techniques for photovoltaic systems in Qatar: Results of first year of outdoor exposure. Energy Procedia 2015, 77, 386–396. [Google Scholar] [CrossRef] [Green Version]
  10. Alamoudi, A.; Saaduddin, S.M.; Munir, A.B.; Muhammad-Sukki, F.; Abu-Bakar, S.H.; Mohd Yasin, S.H.; Karim, R.; Bani, N.A.; Mas’ud, A.A.; Ardila-Rey, J.A.; et al. Using static concentrator technology to achieve global energy goal. Sustainability 2019, 11, 3056. [Google Scholar] [CrossRef] [Green Version]
  11. Li, G.; Xuan, Q.; Akram, M.W.; Golizadeh Akhlaghi, Y.; Liu, H.; Shittu, S. Building integrated solar concentrating systems: A review. Appl. Energy 2020, 260, 114288. [Google Scholar] [CrossRef]
  12. Marín-Sáez, J.; Chemisana, D.; Atencia, J.; Collados, M.V. Outdoor performance evaluation of a holographic solar concentrator optimized for building integration. Appl. Energy 2019, 250, 1073–1084. [Google Scholar] [CrossRef]
  13. Day, J.; Senthilarasu, S.; Mallick, T.K. Enhanced efficiency for building integrated concentrator photovoltaic modules based on rare earth doped optics. Sol. Energy Mater. Sol. Cells 2019, 199, 83–90. [Google Scholar] [CrossRef]
  14. Xuan, Q.; Li, G.; Lu, Y.; Zhao, X.; Su, Y.; Ji, J.; Pei, G. A general optimization strategy for the annual performance enhancement of a solar concentrating system incorporated in the south-facing wall of a building. Indoor Built Environ. 2020, 29, 1386–1398. [Google Scholar] [CrossRef]
  15. Market Data Forecast. Concentrator Photovoltaic (CPV) Market. Segmentation by Product (Reflector and Refractor), by Application (Utility and Commercial), by Concentration Level (High. and Low) and Region. Industry Forecast. of 2021 to 2026; Telangana, India, 2021; Available online: https://www.marketdataforecast.com/market-reports/concentrator-photovoltaic-market (accessed on 1 April 2021).
  16. Wiesenfarth, M.; Philipps, S.P.; Bett, A.W.; Horowitz, K.; Kurtz, S. Current Status of Concentrator Photovoltaic (CPV) Technology; National Renewable Energy Lab: Denver, CO, USA, 2017.
  17. Welford, W.T.; Winston, R. High. Collection Nonimaging Optics; Academic Press: Cambridge, MA, USA, 1989; ISBN 9780127428857. [Google Scholar]
  18. Rönnelid, M.; Perers, B.; Karlsson, B. Construction and testing of a large-area CPC-collector and comparison with a flat plate collector. Sol. Energy 1996, 57, 177–184. [Google Scholar] [CrossRef]
  19. Pei, G.; Li, G.; Su, Y.; Ji, J.; Riffat, S.; Zheng, H. Preliminary ray tracing and experimental study on the effect of mirror coating on the optical efficiency of a solid dielectric compound parabolic concentrator. Energies 2012, 5, 3627–3639. [Google Scholar] [CrossRef]
  20. Goodman, N.B.; Ignatius, R.; Wharton, L.; Winston, R. Solid-dielectric compound parabolic concentrators: On their use with photovoltaic devices. Appl. Opt. 1976, 15, 2434–2436. [Google Scholar] [CrossRef] [PubMed]
  21. Mallick, T.K.; Eames, P.C.; Norton, B. Non-concentrating and asymmetric compound parabolic concentrating building façade integrated photovoltaics: An experimental comparison. Sol. Energy 2006, 80, 834–849. [Google Scholar] [CrossRef]
  22. Sarmah, N.; Richards, B.S.; Mallick, T.K. Design, development and indoor performance analysis of a low concentrating dielectric photovoltaic module. Sol. Energy 2014, 103, 390–401. [Google Scholar] [CrossRef]
  23. Mammo, E.D.; Sellami, N.; Mallick, T.K. Performance analysis of a reflective 3D crossed compound parabolic concentrating photovoltaic system for building façade integration. Prog. Photovolt. Res. Appl. 2013, 21, 1095–1103. [Google Scholar] [CrossRef]
  24. Uematsu, T.; Yazawa, Y.; Joge, T.; Kokunai, S. Fabrication and characterization of a flat-plate static-concentrator photovoltaic module. Sol. Energy Mater. Sol. Cells 2001, 67, 425–434. [Google Scholar] [CrossRef]
  25. Gajbert, H.; Hall, M.; Karlsson, B. Optimisation of reflector and module geometries for stationary, low-concentrating, façade-integrated photovoltaic systems. Sol. Energy Mater. Sol. Cells 2007, 91, 1788–1799. [Google Scholar] [CrossRef]
  26. Yoshioka, K.; Goma, S.; Hayakawa, S.; Saitoh, T. Preparation and properties of an experimental static concentrator with a new three-dimensional lens. Prog. Photovolt. Res. Appl. 1997, 5, 139–145. [Google Scholar] [CrossRef]
  27. Ning, X.; Winston, R.; O’Gallagher, J. Dielectric totally internally reflecting concentrators. Appl. Opt. 1987, 26, 300–305. [Google Scholar] [CrossRef] [PubMed]
  28. Freier, D.; Ramirez-Iniguez, R.; Gamio, C.; Jafry, T.; Muhammad-Sukki, F. Novel nonimaging solar concentrator for portable solar systems for developing countries. In Proceedings of the 2017 IEEE PES Power Africa, Accra, Ghana, 27–30 June 2017; pp. 307–310. [Google Scholar]
  29. Slooff, L.H.; Bende, E.E.; Burgers, A.R.; Budel, T.; Pravettoni, M.; Kenny, R.P.; Dunlop, E.D.; Büchtemann, A. A luminescent solar concentrator with 7.1% power conversion efficiency. Phys. Status Solidi Rapid Res. Lett. 2008, 2, 257–259. [Google Scholar] [CrossRef] [Green Version]
  30. Lin, Q.; Wang, Z.; Snaith, H.J.; Johnston, M.B.; Herz, L.M. Hybrid perovskites: Prospects for concentrator solar cells. Adv. Sci. 2018, 5, 1700792. [Google Scholar] [CrossRef]
  31. Wang, Z.; Lin, Q.; Wenger, B.; Christoforo, M.G.; Lin, Y.H.; Klug, M.T.; Johnston, M.B.; Herz, L.M.; Snaith, H.J. High irradiance performance of metal halide perovskites for concentrator photovoltaics. Nat. Energy 2018, 3, 855–861. [Google Scholar] [CrossRef]
  32. Hou, B.; Kim, B.; Lee, H.K.H.; Cho, Y.; Giraud, P.; Liu, M.; Zhang, J.; Davies, M.L.; Durrant, J.R.; Tsoi, W.C.; et al. Multiphoton absorption stimulated metal chalcogenide quantum dot solar cells under ambient and concentrated irradiance. Adv. Funct. Mater. 2020, 30, 2004563. [Google Scholar] [CrossRef]
  33. Neo, D.C.J.; Goh, W.P.; Lau, H.H.; Shanmugam, J.; Chen, Y.F. CuInS2 quantum dots with thick ZnSexS1-xShells for a luminescent solar concentrator. ACS Appl. Nano Mater. 2020, 3, 6489–6496. [Google Scholar] [CrossRef]
  34. Meinardi, F.; Ehrenberg, S.; Dhamo, L.; Carulli, F.; Mauri, M.; Bruni, F.; Simonutti, R.; Kortshagen, U.; Brovelli, S. Highly efficient luminescent solar concentrators based on earth-abundant indirect-bandgap silicon quantum dots. Nat. Photon. 2017, 11, 177–185. [Google Scholar] [CrossRef]
  35. Ma, J.; Man, K.L.; Ting, T.O.; Zhang, N.; Guan, S.U.; Wong, P.W.H. Approximate single-diode photovoltaic model for efficient I-V characteristics estimation. Sci. World J. 2013, 2013, 230471. [Google Scholar] [CrossRef] [Green Version]
  36. Mahmoud, Y.A.; Xiao, W.; Zeineldin, H.H. A parameterization approach for enhancing PV model accuracy. IEEE Trans. Ind. Electron. 2013, 60, 5708–5716. [Google Scholar] [CrossRef]
  37. Mehta, H.K.; Warke, H.; Kukadiya, K.; Panchal, A.K. Accurate expressions for single-diode-model solar cell parameterization. IEEE J. Photovolt. 2019, 9, 803–810. [Google Scholar] [CrossRef]
  38. Vinod; Kumar, R.; Singh, S.K. Solar photovoltaic modeling and simulation: As a renewable energy solution. Energy Rep. 2018, 4, 701–712. [Google Scholar] [CrossRef]
  39. Bader, S.; Ma, X.; Oelmann, B. One-diode photovoltaic model parameters at indoor illumination levels—A comparison. Sol. Energy 2019, 180, 707–716. [Google Scholar] [CrossRef]
  40. Kaddour, A.; Benyoucef, B. Simulation and modelization of parabolic solar concentrator. J. Earth Sci. Clim. Change 2012, 3, 1000113. [Google Scholar] [CrossRef]
  41. Benrhouma, I.; Victoria, M.; Hernandez, I.A.; Chaouachi, B. Modeling of a concentrating photovoltaic module. In Proceedings of the International Conference on Green Energy and Conversion Systems (GECS 2017), Hammamet, Tunisia, 23–25 March 2017; pp. 1–5. [Google Scholar]
  42. Fernández, E.F.; Almonacid, F.; Rodrigo, P.; Pérez-Higueras, P. Model for the prediction of the maximum power of a high concentrator photovoltaic module. Sol. Energy 2013, 97, 12–18. [Google Scholar] [CrossRef]
  43. Li, W.; Paul, M.C.; Baig, H.; Siviter, J.; Montecucco, A.; Mallick, T.K.; Knox, A.R. A three-point-based electrical model and its application in a photovoltaic thermal hybrid roof-top system with crossed compound parabolic concentrator. Renew. Energy 2019, 130, 400–415. [Google Scholar] [CrossRef]
  44. Ramirez-iniguez, R.; Muhammad-Sukki, F.; McMeekin, S.G.; Stewart, B.G. Optical Element. U.S. Patent 9,910,253, 2018. [Google Scholar]
  45. Muhammad-Sukki, F.; Abu-Bakar, S.H.; Ramirez-Iniguez, R.; McMeekin, S.G.; Stewart, B.G.; Sarmah, N.; Mallick, T.K.; Munir, A.B.; Mohd Yasin, S.H.; Abdul Rahim, R. Mirror symmetrical dielectric totally internally reflecting concentrator for building integrated photovoltaic systems. Appl. Energy 2014, 113, 32–40. [Google Scholar] [CrossRef]
  46. Abu-Bakar, S.H.; Muhammad-Sukki, F.; Freier, D.; Ramirez-Iniguez, R.; Mallick, T.K.; Munir, A.B.; Mohd Yasin, S.H.; Abubakar Mas’ud, A.; Md Yunus, N. Optimisation of the performance of a novel rotationally asymmetrical optical concentrator design for building integrated photovoltaic system. Energy 2015, 90, 1033–1045. [Google Scholar] [CrossRef]
  47. Abu-Bakar, S.H.; Muhammad-Sukki, F.; Freier, D.; Ramirez-Iniguez, R.; Mallick, T.K.; Munir, A.B.; Mohd Yasin, S.H.; Abubakar Mas’ud, A.; Bani, N.A. Performance analysis of a solar window incorporating a novel rotationally asymmetrical concentrator. Energy 2016, 99, 181–192. [Google Scholar] [CrossRef]
  48. Freier, D.; Muhammad-Sukki, F.; Abu-Bakar, S.; Ramirez-Iniguez, R.; Munir, A.B.; Mohd Yasin, S.H.; Bani, N.A.; Abubakar Mas’ud, A.; Ardila-Rey, J.A.; Karim, M.E. Annual prediction output of an RADTIRC-PV module. Energies 2018, 11, 544. [Google Scholar] [CrossRef] [Green Version]
  49. Sarmah, N.; Richards, B.S.; Mallick, T.K. Evaluation and optimization of the optical performance of low-concentrating dielectric compound parabolic concentrator using ray-tracing methods. Appl. Opt. 2011, 50, 3303–3310. [Google Scholar] [CrossRef]
  50. Mallick, T.K.; Eames, P.C. Design and fabrication of low concentrating second generation PRIDE concentrator. Sol. Energy Mater. Sol. Cells 2007, 91, 597–608. [Google Scholar] [CrossRef]
  51. Muhammad-Sukki, F.; Abu-Bakar, S.H.; Ramirez-Iniguez, R.; McMeekin, S.G.; Stewart, B.G.; Munir, A.B.; Mohd Yasin, S.H.; Abdul Rahim, R. Performance analysis of a mirror symmetrical dielectric totally internally reflecting concentrator for building integrated photovoltaic systems. Appl. Energy 2013, 111, 288–299. [Google Scholar] [CrossRef]
  52. Sellami, N.; Mallick, T.K. Optical efficiency study of PV crossed compound parabolic concentrator. Appl. Energy 2013, 102, 868–876. [Google Scholar] [CrossRef]
  53. Chaves, J. Introduction to Nonimaging Optics, 2nd ed.; CRC Press: Boca Raton, FL, USA, 2015; ISBN 978-1420054293. [Google Scholar]
  54. Freier, D. Novel Nonimaging Concentrator Design for Portable Solar Photovoltaic Systems for Developing Countries; Glasgow Caledonian University: Glagow, UK, 2018. [Google Scholar]
  55. O’Gallagher, J.J. Nonimaging optics in solar energy. Synth. Lect. Energy Environ. Technol. Sci. Soc. 2008, 2, 1–120. [Google Scholar] [CrossRef]
  56. Ishaque, K.; Salam, Z.; Taheri, H. Simple, fast and accurate two-diode model for photovoltaic modules. Sol. Energy Mater. Sol. Cells 2011, 95, 586–594. [Google Scholar] [CrossRef]
  57. Nishioka, K.; Sakitani, N.; Uraoka, Y.; Fuyuki, T. Analysis of multicrystalline silicon solar cells by modified 3-diode equivalent circuit model taking leakage current through periphery into consideration. Sol. Energy Mater. Sol. Cells 2007, 91, 1222–1227. [Google Scholar] [CrossRef]
  58. Kassis, A.; Saad, M. Analysis of multi-crystalline silicon solar cells at low illumination levels using a modified two-diode model. Sol. Energy Mater. Sol. Cells 2010, 94, 2108–2112. [Google Scholar] [CrossRef]
  59. Gow, J.A.; Manning, C.D. Development of a photovoltaic array model for use in power-electronics simulation studies. IEE Proc. Electr. Power Appl. 1999, 146, 193. [Google Scholar] [CrossRef]
  60. Ishaque, K.; Salam, Z. An improved modeling method to determine the model parameters of photovoltaic (PV) modules using differential evolution (DE). Sol. Energy 2011, 85, 2349–2359. [Google Scholar] [CrossRef]
  61. Bonkoungou, D.; Koalaga, Z.; Njomo, D. Modelling and simulation of photovoltaic module considering single-diode equivalent circuit model in MATLAB. Int. J. Emerg. Technol. Adv. Eng. 2013, 3, 493–502. [Google Scholar]
  62. Mayer, M.J.; Gróf, G. Extensive comparison of physical models for photovoltaic power forecasting. Appl. Energy 2020, 283, 116239. [Google Scholar] [CrossRef]
  63. Villalva, M.G.; Gazoli, J.R.; Filho, E.R. Comprehensive approach to modeling and simulation of photovoltaic arrays. IEEE Trans. Power Electron. 2009, 24, 1198–1208. [Google Scholar] [CrossRef]
  64. Dhass, A.D.; Prakash, Y.; Ramya, K.C. Effect of temperature on internal parameters of solar cell. Mater. Today Proc. 2020, 33, 732–735. [Google Scholar] [CrossRef]
  65. Baig, H.; Heasman, K.C.; Mallick, T.K. Non-uniform illumination in concentrating solar cells. Renew. Sustain. Energy Rev. 2012, 16, 5890–5909. [Google Scholar] [CrossRef]
  66. Abu-Bakar, S.H.; Muhammad-Sukki, F.; Freier, D.; Ramirez-Iniguez, R.; Mallick, T.K.; Munir, A.B.; Mohd Yasin, S.H.; Abubakar Mas’ud, A.; Md Yunus, N. Performance analysis of a novel rotationally asymmetrical compound parabolic concentrator. Appl. Energy 2015, 154, 221–231. [Google Scholar] [CrossRef]
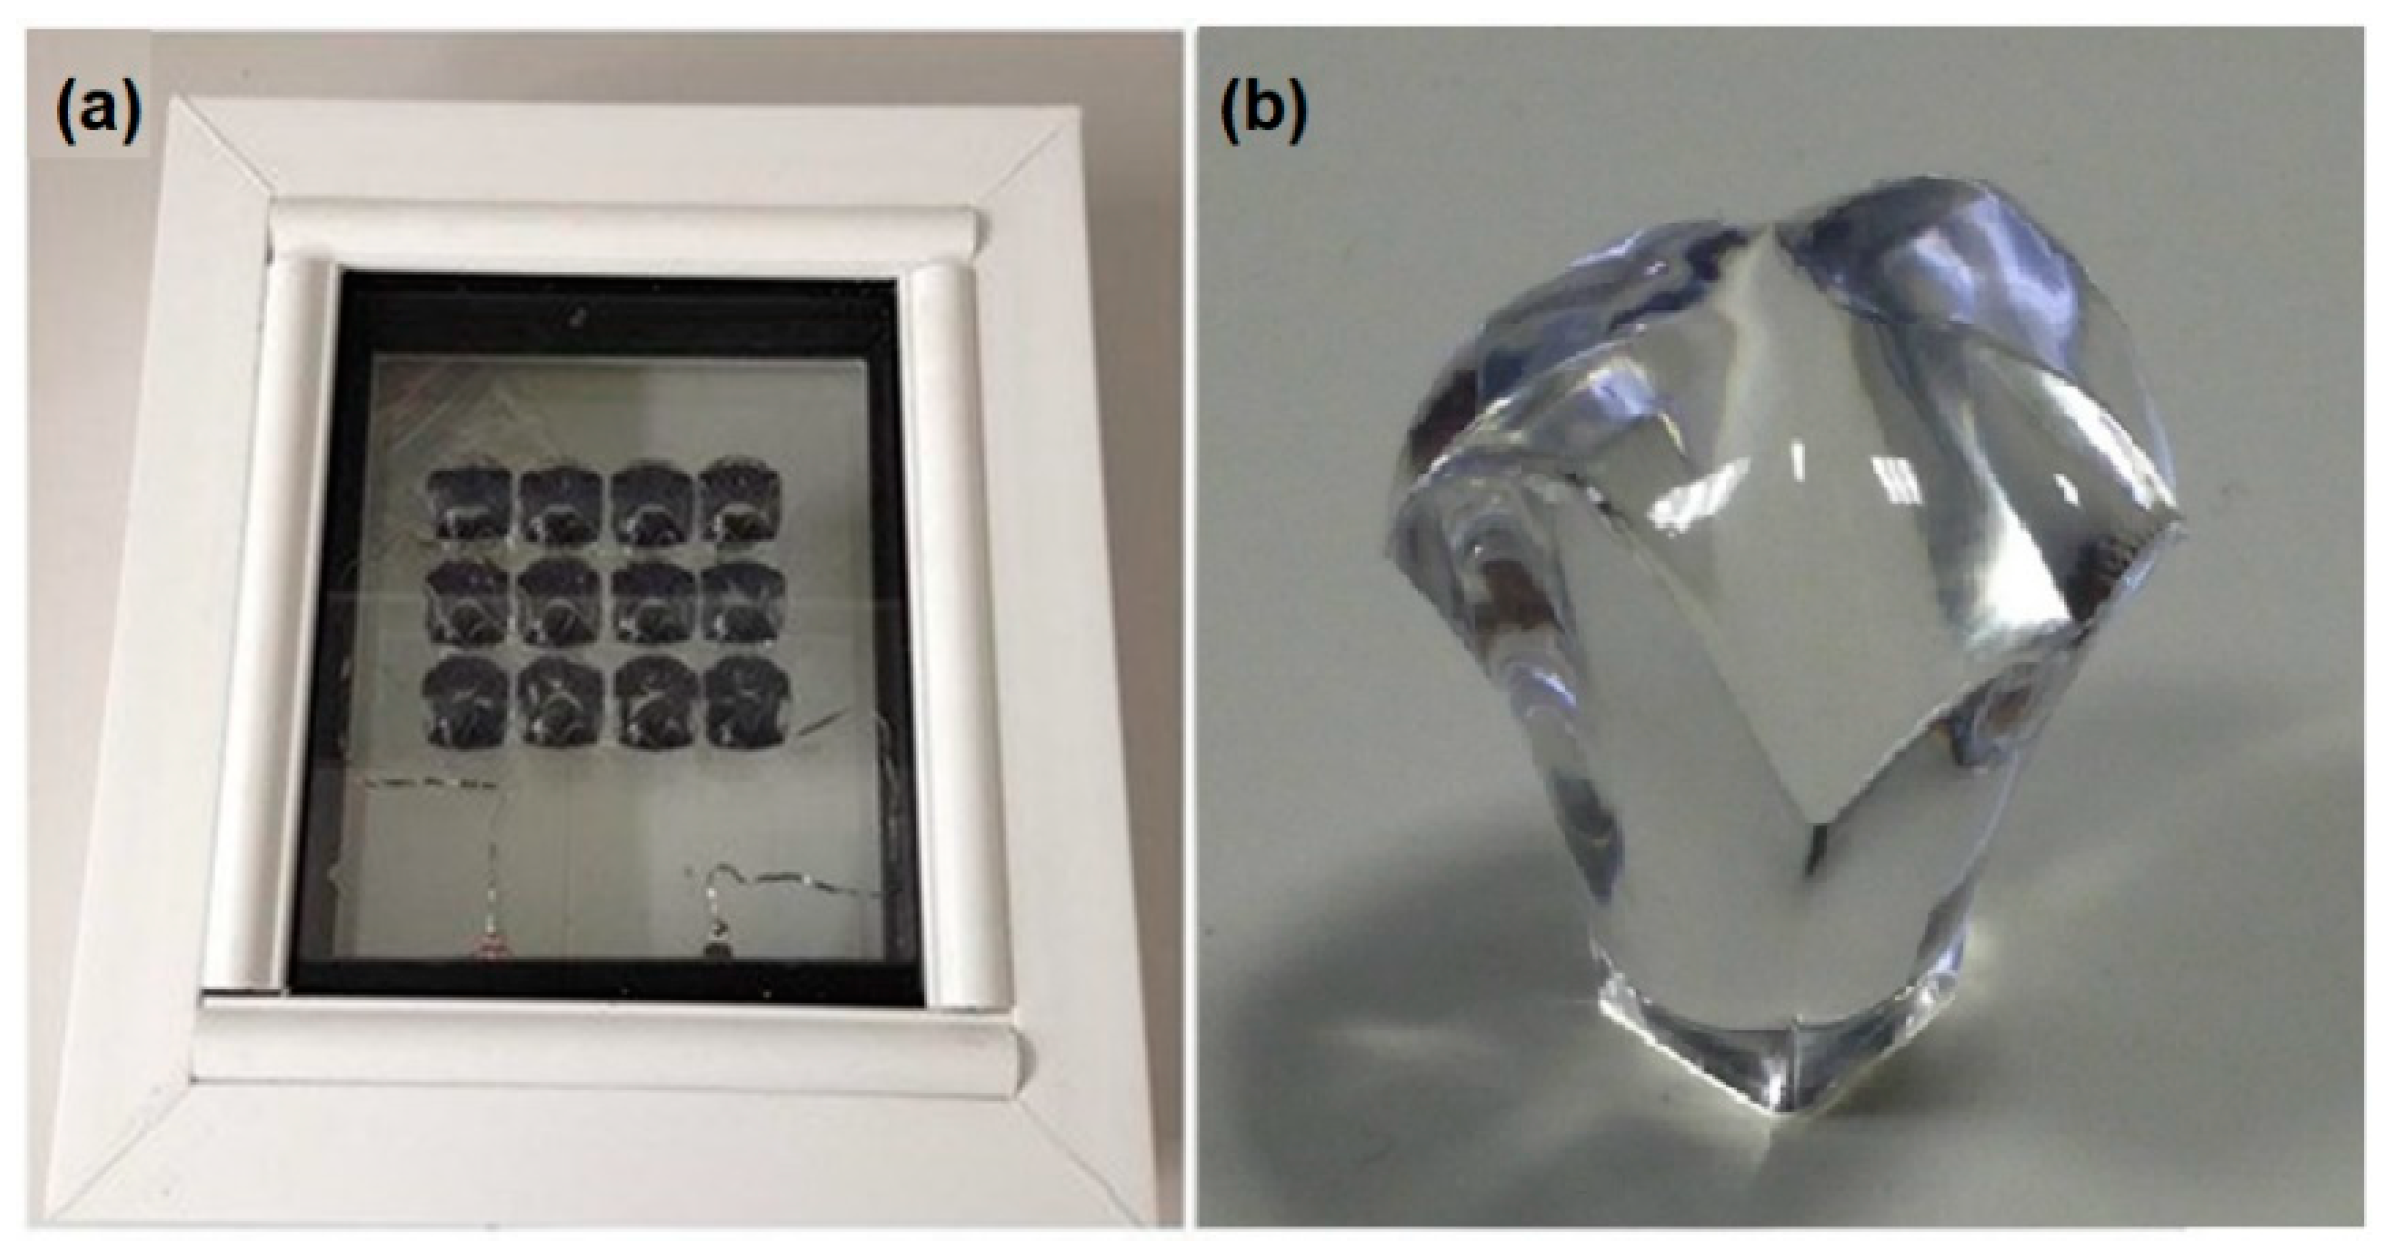
Figure 1. (a) A small concentrating solar PV window integrating the rotationally asymmetrical dielectric totally internally reflecting concentrators (RADTIRCs); and (b) a single RADTIRC that has an acceptance angle of ±40°.
Applsci 11 03894 g001
Figure 2. Indoor experimental setup to evaluate the I-V and P-V characteristics of the RADTIRC-PV structure and the bare PV cell.
Applsci 11 03894 g002
Figure 3. A single-diode equivalent circuit. Adapted from [61].
Applsci 11 03894 g003
Figure 4. The steps carried out at each angle of incidence to determine the angular response of the RADTIRC from −50° to 50° with an increment 5°. A 0° incident angle means that the sun rays are perpendicular to the RADTIRC.
Applsci 11 03894 g004
Figure 5. Simulated I-V and P-V characteristics of the RADTIRC-PV structure and the bare PV cell at normal incidence.
Applsci 11 03894 g005
Figure 6. Comparison of the short circuit currents obtained from simulations and experiments for the RADTIRC-PV structure and a bare PV cell at STCs.
Applsci 11 03894 g006
Figure 7. Comparison of the open-circuit voltages obtained from simulations and experiments for the RADTIRC-PV structure at STCs.
Applsci 11 03894 g007
Figure 8. Comparison of the open-circuit voltage obtained from simulations and experiments for the bare PV cells at STCs.
Applsci 11 03894 g008
Figure 9. Comparison of the maximum powers obtained from simulations and experiments for the RADTIRC-PV structure and a bare PV cell at STCs.
Applsci 11 03894 g009
Figure 10. Comparison of the fill factor obtained from simulations and experiments for the RADTIRC-PV structure at STCs.
Applsci 11 03894 g010
Figure 11. Comparison of the fill factor obtained from simulations and experiments for the bare PV cells at STCs.
Applsci 11 03894 g011
Figure 12. Comparison of the opto-electronic gains obtained from simulations and experiments for the RADTIRC-PV structure and a bare PV cell at STCs.
Applsci 11 03894 g012
Table 1. Opto-electronic gain of the RADTIRC at different angle of incidences.
Angle of Incidence (°)Opto-Electronic Gain, Copto-e
04.17143
±54.00000
±103.89205
±153.60465
±203.37313
±253.14642
±302.78105
±351.84722
±401.21561
±450.95142
±500.69643
Table 2. Parametric values of the solar cell.
ComponentValue
Solar radiation intensity, Gref1000 W/m2
Reference Temperature, Tref25 °C
Square solar cell area, A1 cm2
Short circuit current, Isc (at 0°)0.0350 A
Open-circuit voltage, Voc (at 0°)0.586 V
Ideality factor, n1.109
Energy bandgap, Eg1.12
Charge of an electron, q1.6 × 10−19 C
Boltzman constant, k1.38 × 10−23 m2 kg s−2 K−1
Series resistance, Rs0.047994 Ω
Shunt resistance, Rsh2148.53 Ω
Short circuit current temperature coefficient, α0.00024 A/°C
Publisher’s Note: MDPI stays neutral with regard to jurisdictional claims in published maps and institutional affiliations.