Article

Spatial-Temporal Changes in Removal of Fecal Indicators and Diversity of Bacterial Communities in a Constructed Wetland with Ornamental Plants

by
Cristina S. C. Calheiros
1,2,*,
Sofia I. A. Pereira
2,
Albina R. Franco
2 and
Paula M. L. Castro
2
1
Interdisciplinary Centre of Marine and Environmental Research (CIIMAR/CIMAR), University of Porto, Novo Edifício do Terminal de Cruzeiros do Porto de Leixões, Avenida General Norton de Matos, S/N, 4450-208 Matosinhos, Portugal
2
CBQF—Centro de Biotecnologia e Química Fina—Laboratório Associado, Escola Superior de Biotecnologia, Universidade Católica Portuguesa, Rua Diogo Botelho 1327, 4169-005 Porto, Portugal
*
Author to whom correspondence should be addressed.
Appl. Sci. 2021, 11(9), 3875; https://doi.org/10.3390/app11093875
Submission received: 24 March 2021 / Revised: 20 April 2021 / Accepted: 22 April 2021 / Published: 25 April 2021
(This article belongs to the Special Issue Wastewater Bioremediation)

Abstract

:
The present study was undertaken in a constructed wetland (CW), setup in a tourism house, for domestic wastewater treatment. The influence of season variations on the abundance of fecal indicator organisms (total coliforms and Escherichia coli) in the wastewater and in the substrate and the roots of plants inhabiting the inlet and outlet zones of the CW was evaluated along three consecutive years. The structure and diversity of bacterial communities associated to the CW’s substrate of inlet and outlet zones was also analyzed overtime. Wastewater was characterized for physicochemical and microbiological parameters and the bacterial communities colonizing the substrate surface, were analyzed by Denaturing Gradient Gel Electrophoresis (DGGE). The CW was effective in removing COD, BOD5, TSS, PO43−, NH4+, NO3, and NO2. It was also effective in removing fecal indicators, with a generalized decrease of total coliforms and E. coli in the substrate and in the wastewater from inlet to outlet of up to 2–3 log. The structure and composition of bacterial communities associated with the substrate was mainly influenced by the year rather than by the season or the CW zone.

Graphical Abstract

1. Introduction

Constructed wetlands (CWs) have been widely used in the last decades as an ecological technology for treating different types of wastewater [1,2,3]. These biological systems constitute an environmentally friendly and sustainable alternative to conventional treatments while providing a plethora of ecosystem services with huge impacts on nature and human wellbeing [4,5]. Additionally, CWs are considered natural biodiversity hotspots favoring the establishment of plants, microorganisms, and animals [6,7,8].
Macrophytes are among the most-commonly used plants in CWs since they can adapt to harsh edaphoclimatic conditions, or several stresses derived from the wastewater composition, such as high levels of salinity, loadings of organics, nutrients, and pollutants [9,10]. The use of polycultures has been reported as an attractive strategy that provides additional benefits like improving the landscape aesthetic and biodiversity, especially if they include ornamental plants [1,4,11]. One of the most important functions of vegetation is the oxygenation of the CWs bed, as oxygen influences redox potential and microbial activity [12].
The efficiency of CWs for wastewater treatment relies on microbial-mediated processes, like the transformation and mineralization of organic matter and/or the degradation of pollutants [11,13,14], that occur in the biofilm formed around plant’s roots and/or attached to the surface of bed substrate. Deeping the knowledge on the diversity and composition of microbial communities dwelling CWs and on the potential impact of environmental factors on their activity, is pivotal to understand the functioning of these biological systems [15]. Several authors have reported the influence of vegetation, the composition of wastewater, as well as the type of filter bed substrates on microbial populations abundance, structure, and diversity using culture-independent methods [16,17,18,19,20,21,22]. For instance, Zhang et al. [23] reported higher bacterial diversity and richness in a CW mesocosm (for hexachlorobenzene removal) colonized by Typha angustifolia than in the mesocosm colonized by Phragmites australis. Guan et al. [20] concluded that the type of substrate greatly influences the structure and diversity of bacterial communities in a CW system for surface water treatment. The bed substrate of a CW is thus, of utmost importance due to its role on plant support, microbial biofilms establishment, also influencing the hydraulic processes [14].
The ultimate goal of CWs is the efficient treatment of wastewater, with a view to its potential reuse, including the use of treated water for irrigation purposes [24,25]. However, depending on the origin of the wastewater it is important to evaluate the prevalence of some bacterial pathogens, including total and fecal coliforms, and Escherichia coli found on the water, substrate, and plant tissues [25,26,27,28].
The present work aimed (i) to assess the influence of season variations across three consecutive years on the abundance of fecal indicator organisms (total coliforms and E. coli) in wastewater and associated with the substrate, and roots of plants inhabiting the inlet and outlet zones of a CW for domestic wastewater treatment, and (ii) to evaluate the influence of season variations and CW zones on structure and diversity of bacterial communities associated to the bed substrate.

2. Materials and Methods

2.1. Constructed Wetland

A horizontal subsurface flow CW (area: 40.5 m2) was set-up after a septic tank for wastewater treatment coming from a tourism house, in North of Portugal. Briefly, the system had randomly planted species of Zantedeschia aethiopica, Agapanthus africanus, Canna flaccida, Canna indica, and Watsonia borbonica in an expanded clay—Leca®M substrate (Supplier: Saint-Gobain Weber Portugal, S.A., Portugal). Experimental operational conditions included a hydraulic loading rate of 9 cm/d, hydraulic retention time of 4 days and a flow of 4 m3/d. Although, these values may change according to the guest house occupancy. A detailed description of the CW implementation and operation can be found in Calheiros et al. [1].
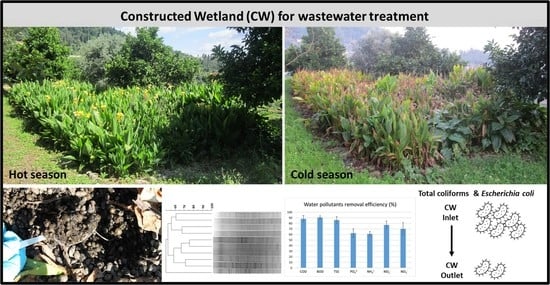
The present study was carried out during the cold (autumn/winter—C) and hot seasons (spring/summer—H), in three consecutive years (1, 2, 3); in parallel with the assessment of diverse arbuscular mycorrhizal fungi communities, colonizing the roots of plants that inhabit this CW, undertaken by Calheiros et al. [18]. By the time of the first sampling the CW was in operation for 6 years. Figure 1 shows the CW in both seasons (H, C) in the third year of monitoring.

2.2. Physicochemical and Microbiological Analysis of Wastewater

The efficiency of wastewater treatment of the CW has been previously assessed [1,25,28], however in order to compare to past campaigns and to relate to changes on microbial communities overtime, wastewater samples (n = 4 per season) were collected from the inlet and outlet zones of the CW during the cold (autumn/winter—C) and hot seasons (spring/summer—H), in three consecutive years (1, 2, 3). Physicochemical parameters for the wastewater samples were determined based on Standard Methods [29]: chemical oxygen demand (COD), biochemical oxygen demand (BOD5), total suspended solids (TSS), ammonia nitrogen (NH3–N), phosphates (PO43−), nitrate (NO3); nitrite (NO2); pH, electric conductivity (EC), and temperature. The air temperature and relative humidity was recorded with a logger (OH503 logger—Greutor, Barcelona, Spain), at each sampling time.
Simultaneously with physicochemical analysis, the enumeration of fecal indicators, namely total coliforms and E. coli, present in wastewater was also determined by plate counting using the selective media DIFCOTM mFC Agar and ChromoCult® Coliform Agar (Merck, Darmstadt, Germany), respectively, as followed in Calheiros et al. [1].

2.3. Enumeration of Total Coliforms, E. coli, and Heterotrophic Bacteria Associated to Substrate and Plant Roots

Eight subsamples of substrate (from a depth between 10 and 15 cm) and of roots of plants colonizing the inlet and outlet zones were pooled to form a composite sample (10 g). A sampling area of 6 m2 was considered at the inlet and outlet zones. This analysis was performed only once at the end of cold (autumn/winter—C) and hot seasons (spring/summer—H), of each year (1, 2, 3), to assess the effect of the season on microbiological parameters.
Each composite sample was placed separately in sterile tubes with 10 mL of saline solution (0.85% NaCl) and shaken on a vortex mixer for 1 min at room temperature, based on a previous approach [16]. Serial dilutions were made in duplicate, and 0.1 mL of each dilution was spread onto ChromoCult, mFC, and nutrient agar media for E. coli, total coliforms, and heterotrophic bacteria enumeration, respectively. Plates were incubated at 25 °C (heterotrophic bacteria) and 37 °C (total coliforms and E. coli) for 4 days after which colony forming units (CFU) were counted.

2.4. Analysis of Bacterial Communities Colonizing the Substrate Surface

For the analysis of the bacterial communities, eight subsamples of substrate from the inlet and outlet zones were pooled to form a composite sample. This analysis was performed only once at the end of cold (autumn/winter—C) and hot seasons (spring/summer—H) of each year (1, 2, 3), to assess the effect of the season on bacterial communities. Samples were taken at the same time as the substrate samples for enumeration of total coliforms, E. coli, and heterotrophic bacteria (Section 2.3).

2.4.1. DNA Extraction and PCR Amplification

Total DNA from the composite samples of substrate was extracted using the Power Soil DNA isolation kit (MoBio Laboratories, Inc., Carlsbad, CA, USA), following the manufacturer’s recommendations. A nested-PCR technique was applied in order to increase the sensitivity of Denaturing Gradient Gel Electrophoresis (DGGE). In the first round, the 16S rRNA gene fragments were amplified with the universal primers 27F (5′-GAGTTTGATCCTGGCTCAG-3′) and 1492R (5′-ACCTTGTTACGACTT-3′) as described in Pereira and Castro [30]. In the second PCR round, the obtained fragments were re-amplified by using the primers 338F (5′-GACTCCTACGGGAGGCAGCAG3′) and 518R (5′-ATTACCGCGGCTGCTGG-3′) with a GC clamp attached to the forward primer [31] in a 50 µL reaction mix containing: 1× PCR buffer (Promega, Madison, WI, USA), 2.5 mM MgCl2, 0.2 mM of each dNTP (Bioron, Römerberg, Germany), 0.6 mM of each primer, 0.05 U Taq polymerase (Go Taq-Promega, Madison, WI, USA) and 1 µL PCR product. PCR was performed in a Bio-Rad MJ Mini PTC-1148 Thermal Cycler, using the following conditions initial denaturation step at 94 °C for 5 min followed by 30 cycles as follows: 30 s at 92 °C, 30 s at 55 °C and 30 s at 72 °C. A final extension step at 72 °C was performed for 30 min. PCR products were verified on a 1.5% agarose gel in Tris-acetate-EDTA buffer stained with SYBR® Safe (Invitrogen, Waltham, MA, USA), for 45 min at 100 V.

2.4.2. DGGE

A DCodeTM Universal Mutation Detection System (Bio-Rad Laboratories, Hercules, CA, USA) was used for DGGE analysis. Samples containing approximately 800 ng of nested-PCR amplicons were loaded onto 8% (w/v) polyacrylamide gels (37.5:1, acrylamide/bis-acrylamide) in 1× TAE buffer using a denaturing gradient ranging from 35 to 60% (100% denaturant solution contained 7 M urea and 40% (v/v) formamide). Electrophoresis was performed at 60 °C in 1× TAE buffer, initially at 20 V (15 min) and then at 75 V (960 min). Every gel contained a commercial standard marker (Hyperladder IV, Bioline, London, UK) for internal and external normalization of the gel. Gels were staining using 5× GelGreen in 0.1 M NaCl solution (Biotium, Fremont, CA, USA). DGGE images were acquired using a Safe ImagerTM Blue-Light Transilluminator (Invitrogen, Waltham, MA, USA) and a Micro DOCTM gel documentation system (Cleaver Scientific Ltd., Warwickshire, UK).
DGGE profiles, concerning the presence and intensity of the bands, were analyzed using Bionumerics software (Applied Maths, St-Martens-Laten, Belgium). Sample profiles were compared using Jaccard similarity coefficient (1% band matching position tolerance) and clustered according to unweight pair group mean average (UPGMA) method. Species richness (S) was calculated based on the total number of distinct bands in a lane, while the Shannon–Wiener index (H’) was determined by using the intensity of the DGGE bands given by peak heights in the densitometric curve, as follows (1):
H = ( ni N ) log ( ni N )
where ni is the height of the peak and N is the sum of all peak heights of the densitometric curve for all bands in each sample. The influence of sampling zones (inlet/outlet), season (cold/hot) and year (1, 2, 3) on the composition of bacterial communities was evaluated through permutational multivariate analysis of variance (PERMANOVA) with 999 permutations. PERMANOVA and Principal Coordinate Analysis (PCO) plot were performed based on Bray–Curtis distances matrixes constructed from the DGGE dataset using the PRIMER 6 and PERMANOVA+ software (PRIMER-E Ltd., Plymouth Marine Laboratory, Plymouth, UK).

2.5. Data Analysis

Statistical analyses were performed using the SPSS software (IBM Corp. IBM SPSS Statistics for Windows, Version 27.0. Armonk, NY, USA: IBM Corp.). Wastewater characterization data (physicochemical and microbiological) was analyzed using one-way analysis of variance (ANOVA) to compare the differences between seasons. To detect the statistical significance of differences (p < 0.05) the post-hoc Tukey’s test was performed. Student’s t-test was applied in the pH and conductivity analyses.

3. Results and Discussion

3.1. Physicochemical Data

Wastewater samples were taken during the cold (C) and hot (H) seasons across three consecutive years (1, 2, 3). Air temperature and humidity in cold seasons varied between 10.0–25.0 °C and 41–71%, respectively, while in hot seasons ranged between 17.9–30.0 °C and 28–85%, respectively. Concerning inlet and outlet wastewater temperature, in cold seasons varied respectively between 10.5–17.2 °C and 10.0–15.0 °C. Concerning hot seasons, inlet and outlet wastewater temperature varied between 16.4–23.9 °C and 14.0–20.8 °C, respectively (Table S1Supplementary Materials). The wastewater’s physicochemical analysis, at the inlet and outlet of the CW, is detailed in Table 1.
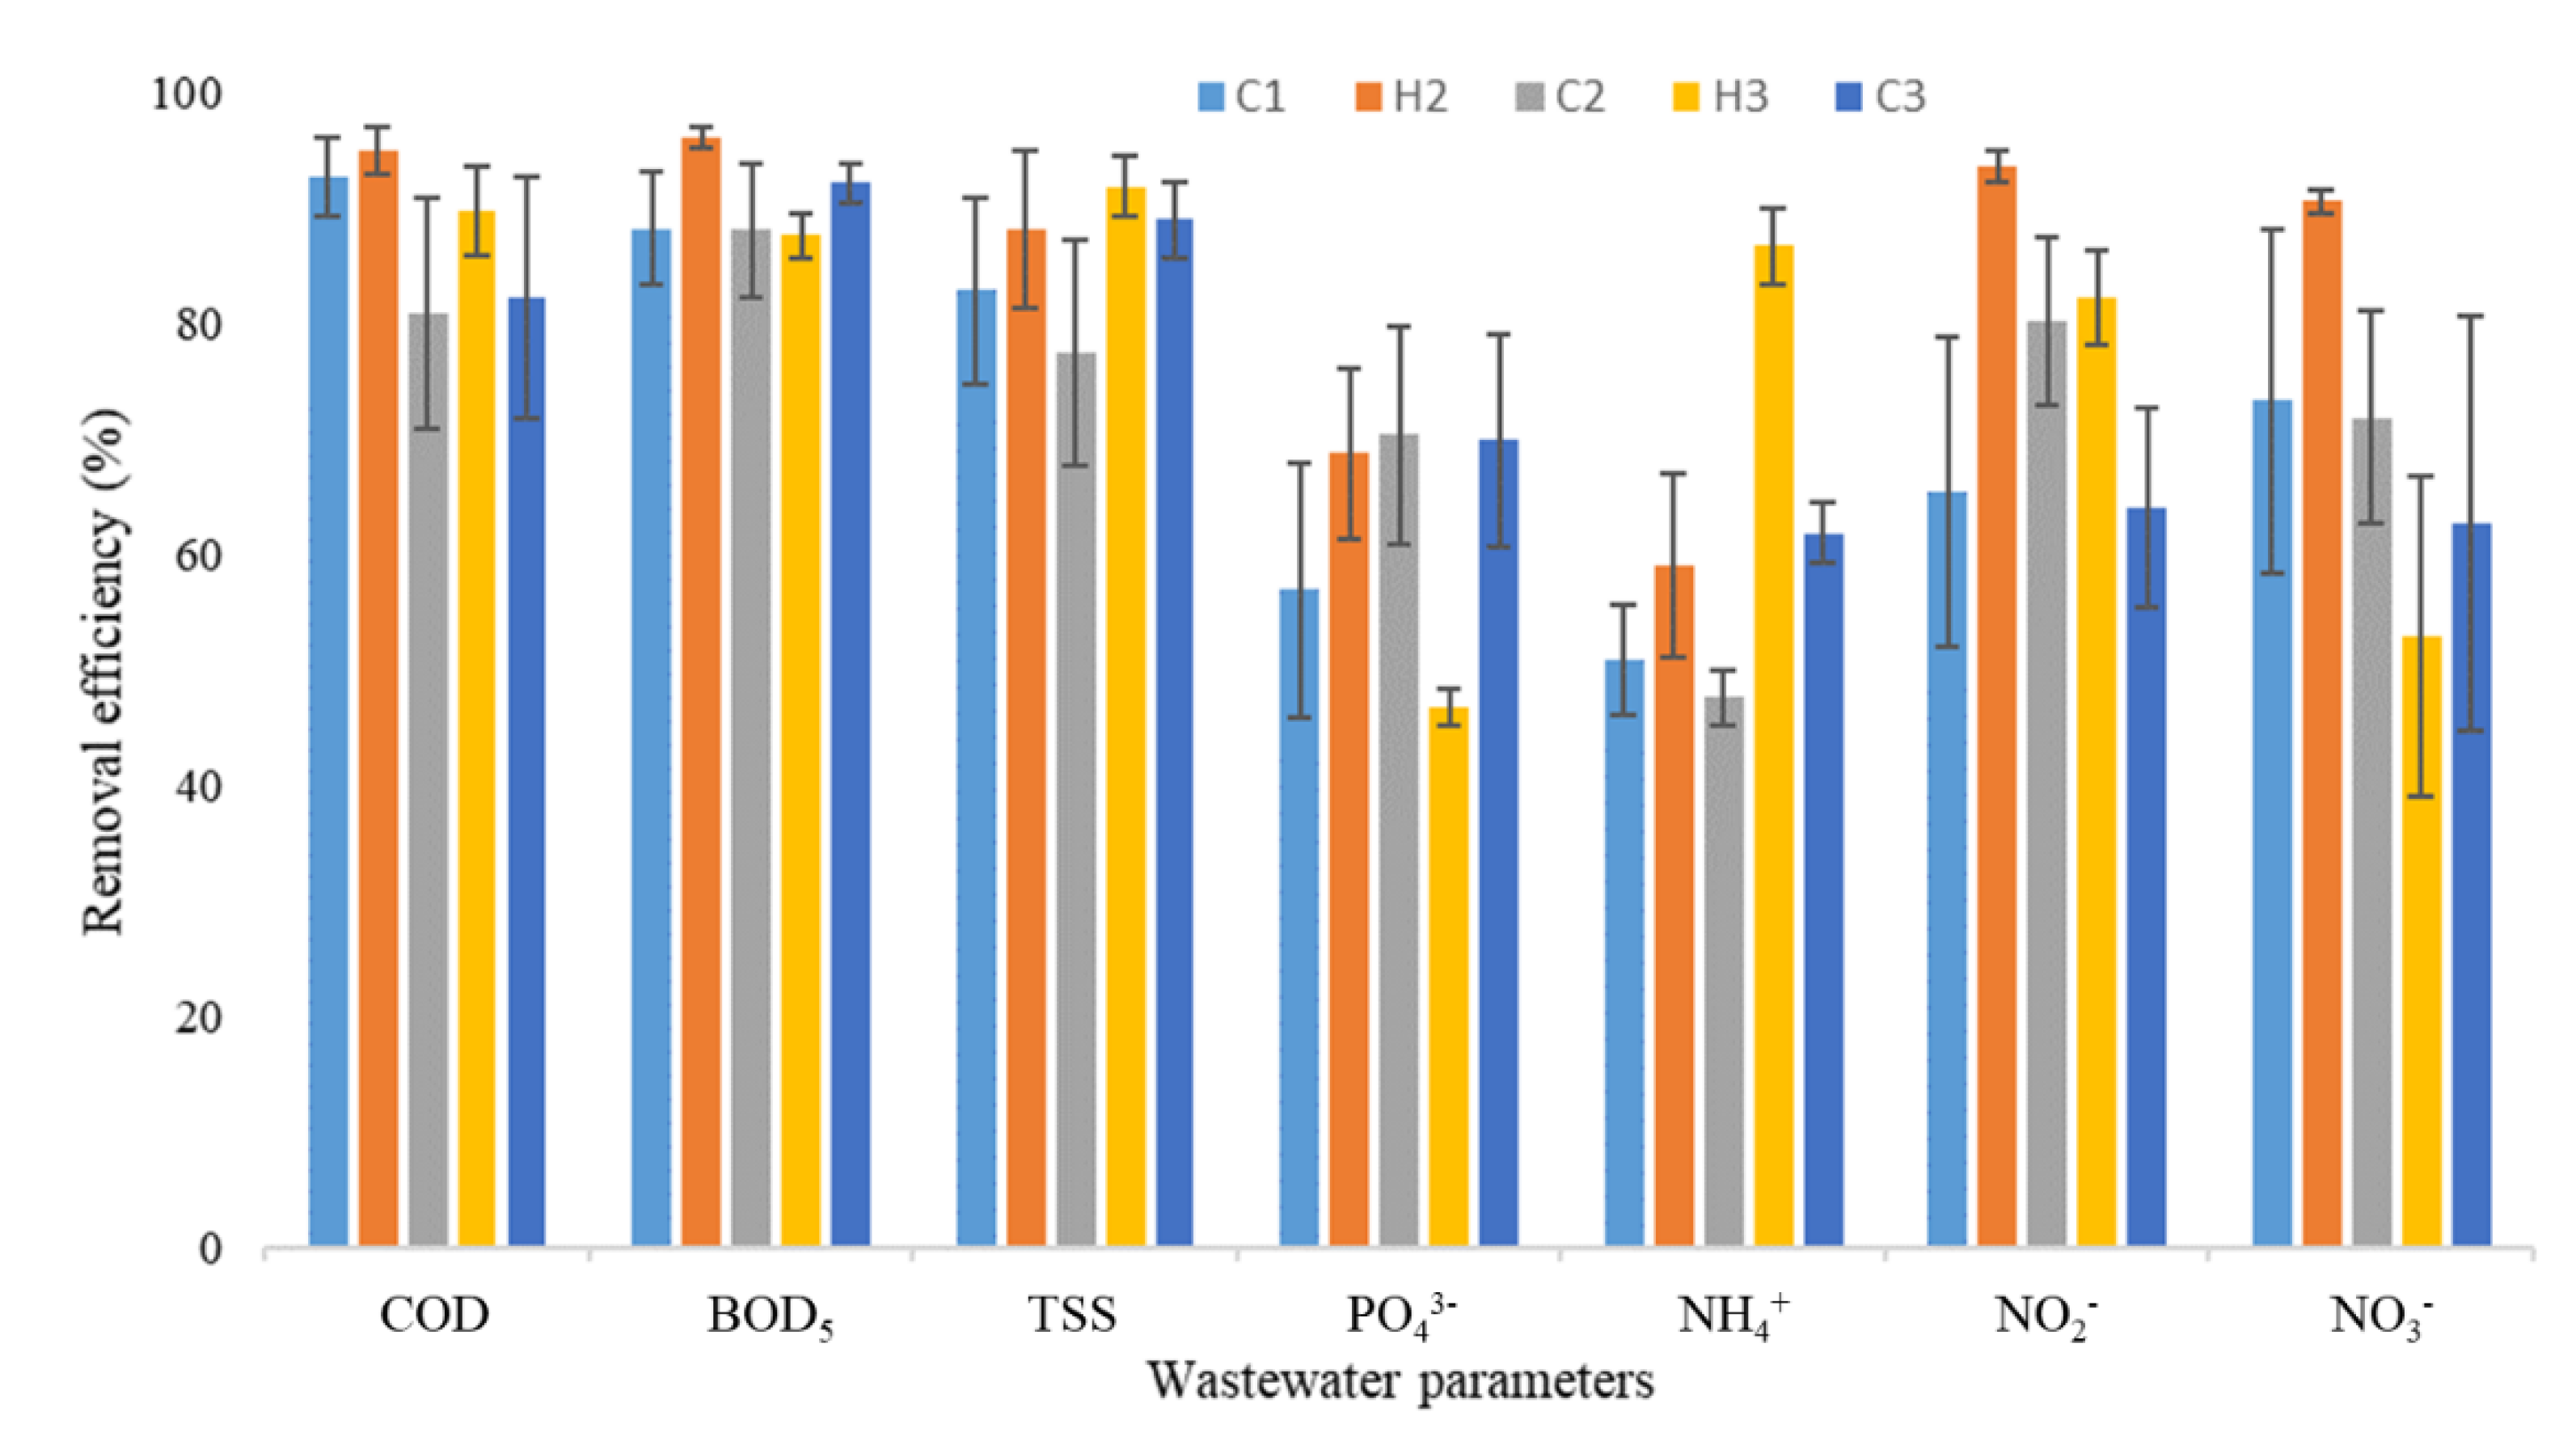
There were no significant differences (p > 0.05) between inlet and outlet in what concerns the values of pH and conductivity. pH values from inlet and outlet ranged from 6.18–7.61 and 6.50–8.02, respectively, whereas conductivity varied from 158–2120 to 100–1050 µS/cm, respectively. These values are within the range of previous assessments on this CW system [1,28]. The variation in terms of removal efficiencies along the seasons is shown in Figure 2. According to Calheiros et al. [1], it is expected that the composition of the wastewater at the CW inlet and outlet varies throughout the year, along seasons, being directly related with overnight guest stays. This type of wastewater is thus typically characterized by flow oscillations and high variability in its composition.
The ratio of BOD/COD showed a mean value of 0.4 ± 0.1, considered within the range of typical values for untreated municipal wastewater [32]. For an inlet COD of 518 ± 188 mg/L the average removal efficiency attained was 88 ± 7%, reaching 99%. For an inlet BOD5 of 213 ± 73 mg/L the average removal efficiency attained was 91 ± 4%, reaching 97%. In relation to the other parameters (TSS, PO43−, NO2, NO3, NH4+), the removal efficiency varied on average between 61% and 86%. There were no significant (p > 0.05) differences between seasons regarding the removal efficiencies for all the analyzed parameters (COD, BOD5, TSS, PO43−, NO2, NO3). However, the percentage of removal of NH4+ was significantly (p < 0.05) higher in H3 if compared to the other sampling campaigns. The removal efficiency of this CW was in general considered high and within what was expected when taken in consideration past trails in the same CW [1].

3.2. Microbiological Data

The ability of CW to remove pathogens from wastewater has been reported by several authors [24,27,33]. In the present study, the numbers of total coliforms and E. coli in wastewater collected from the inlet and outlet zones of the CW during the cold and hot seasons of three consecutive years are shown in Table 2.
The CFU per ml of total coliforms in wastewater collected from inlet and outlet ranged between mean values of log10 4.3 (C3) and log10 5.1 (C1 and H3) and between log10 2.7 (C3) and log10 3.5 (H2), respectively; while E. coli counts varied between mean values of log10 2.7 (C1) and log10 3.5 (H2) and between no viable counts (C1, C2, C3) and log10 2.5, in inlet and outlet zones, respectively. Despite the variation in the loads at the inlet, possibly due to the number of overnight guests, in general, no significant (p > 0.05) differences were found for both indicator organisms over the different sampling campaigns. A similar trend was observed for total coliforms since no significant differences (p > 0.05) were seen along the seasons. The mean outflow counts of indicator organisms are within values found in other reports in the literature [34]. In relation to E. coli counts, in all cold seasons no viable cells were detected at the outflow. This could be attributed to the much lower occupation of the house verified in cold seasons, but also to the effective depuration of the CW. Seasonal variations and the associated edaphic parameters (e.g., temperature) have been identified as important factors in the removal of pathogens in CW [33]. It has been conveyed that as the reduction of the number of bacteria of anthropogenic origin is a complex process, comprising physical, chemical and biological factors [35], that can be influenced to different extents by operational parameters such as hydraulic regime and retention time, vegetation, seasonal fluctuation, and water composition [27]. There are though reported inconclusive results regarding the effect of season on pathogens removal efficiency, since several studies showed greatest removal of pathogens in warmer seasons [36,37] while in others season variations did not induce any effect [38], as occurred in the present study. Nevertheless, a reduction of up to 3 log units for total coliforms and up to 2 log units for E. coli was observed in the wastewater from the inlet to the outlet. Similar results were obtained in previous studies in the same CW for Enterobacteriaceae, E. coli and total coliforms [1,25]. Vymazal [34] referred in a review that removal of total and fecal coliforms in CW is usually very high, (95–99%), a trend that was also verified in this study. Bacterial pathogens present in wastewater may be trapped both on the surface of substrate and roots, but they can also be internalized in plant tissues [25]. Several removal mechanisms have been reported and may comprise natural die-off due to starvation or predation, sedimentation and filtration, and adsorption [27].
In the present study, the prevalence of the indicator organisms, as well as of heterotrophic culturable bacteria was evaluated both associated to the substrate’s surface and associated to plant roots over time (Table 3).
Substrate- and root-associated total coliforms (CFU/g) in the inlet zone ranged between log10 4.5 (C1) and log10 6.6 (H2, H3) and between log10 5.1 (C1) and log10 6.8 (C2), respectively, while in the outlet zone counts varied from no viable cells in C2 to log10 5.7 in H3 both for substrate and roots. A similar trend was observed for E. coli counts, which varied between log10 2.9 (C3) and log10 3.8 (C1) and between log10 3.5 (C2) and log10 4.9 (C1) in substrate and roots of inlet zone, respectively. In the outlet zone, E. coli was only detected in samples corresponding to the hot season in the last two years (H2, H3). Contrary to what was observed in wastewater, season variations seemed to influence total coliforms and E. coli prevalence in the substrate, as counts tended to be lower in cold seasons (C1, C2, C3) than in hot seasons (H2, H3). Of relevance, it has been noted that in relation to E. coli, no viable counts were attained for substrate and root in the three cold seasons. A generalized decrease of both bacterial groups from inlet to outlet of up to 2–3 log was observed, corroborating the results obtained for wastewater, suggesting the effectiveness of CW in removing bacterial pathogens. Moreover, the number of total coliforms and E. coli associated with roots tended to be higher than in the substrate, in particular in the inlet zone, for all sampling campaigns, suggesting the active role of plants in the depuration mechanism of bacterial pathogens in the CW. Indeed, Calheiros et al. [28] showed that 49% of the bacterial endophytes recovered from tissues of C. flaccida plants growing in inlet and outlet zones of the same CW belonged to Enterobacteriaceae. Yet, a significant decline was observed in the number of enteric bacteria from the inlet (62%) to the outlet zone (38%). This is in line with the reduction of the number of total coliforms and E. coli recorded in the outlet zone in this study. As expected, HB counts were higher than those found for total coliforms and E. coli in inlet and outlet zones (Table 3), both for substrate and roots. The enumeration of HB followed the same trend as the indicator organisms, with regard to the reduction in counts for the inlet to the outlet and also to the lower prevalence both in substrate and roots during the colder seasons, in particular in the last two years. Nonetheless, the range assessed was within references in literature [39].
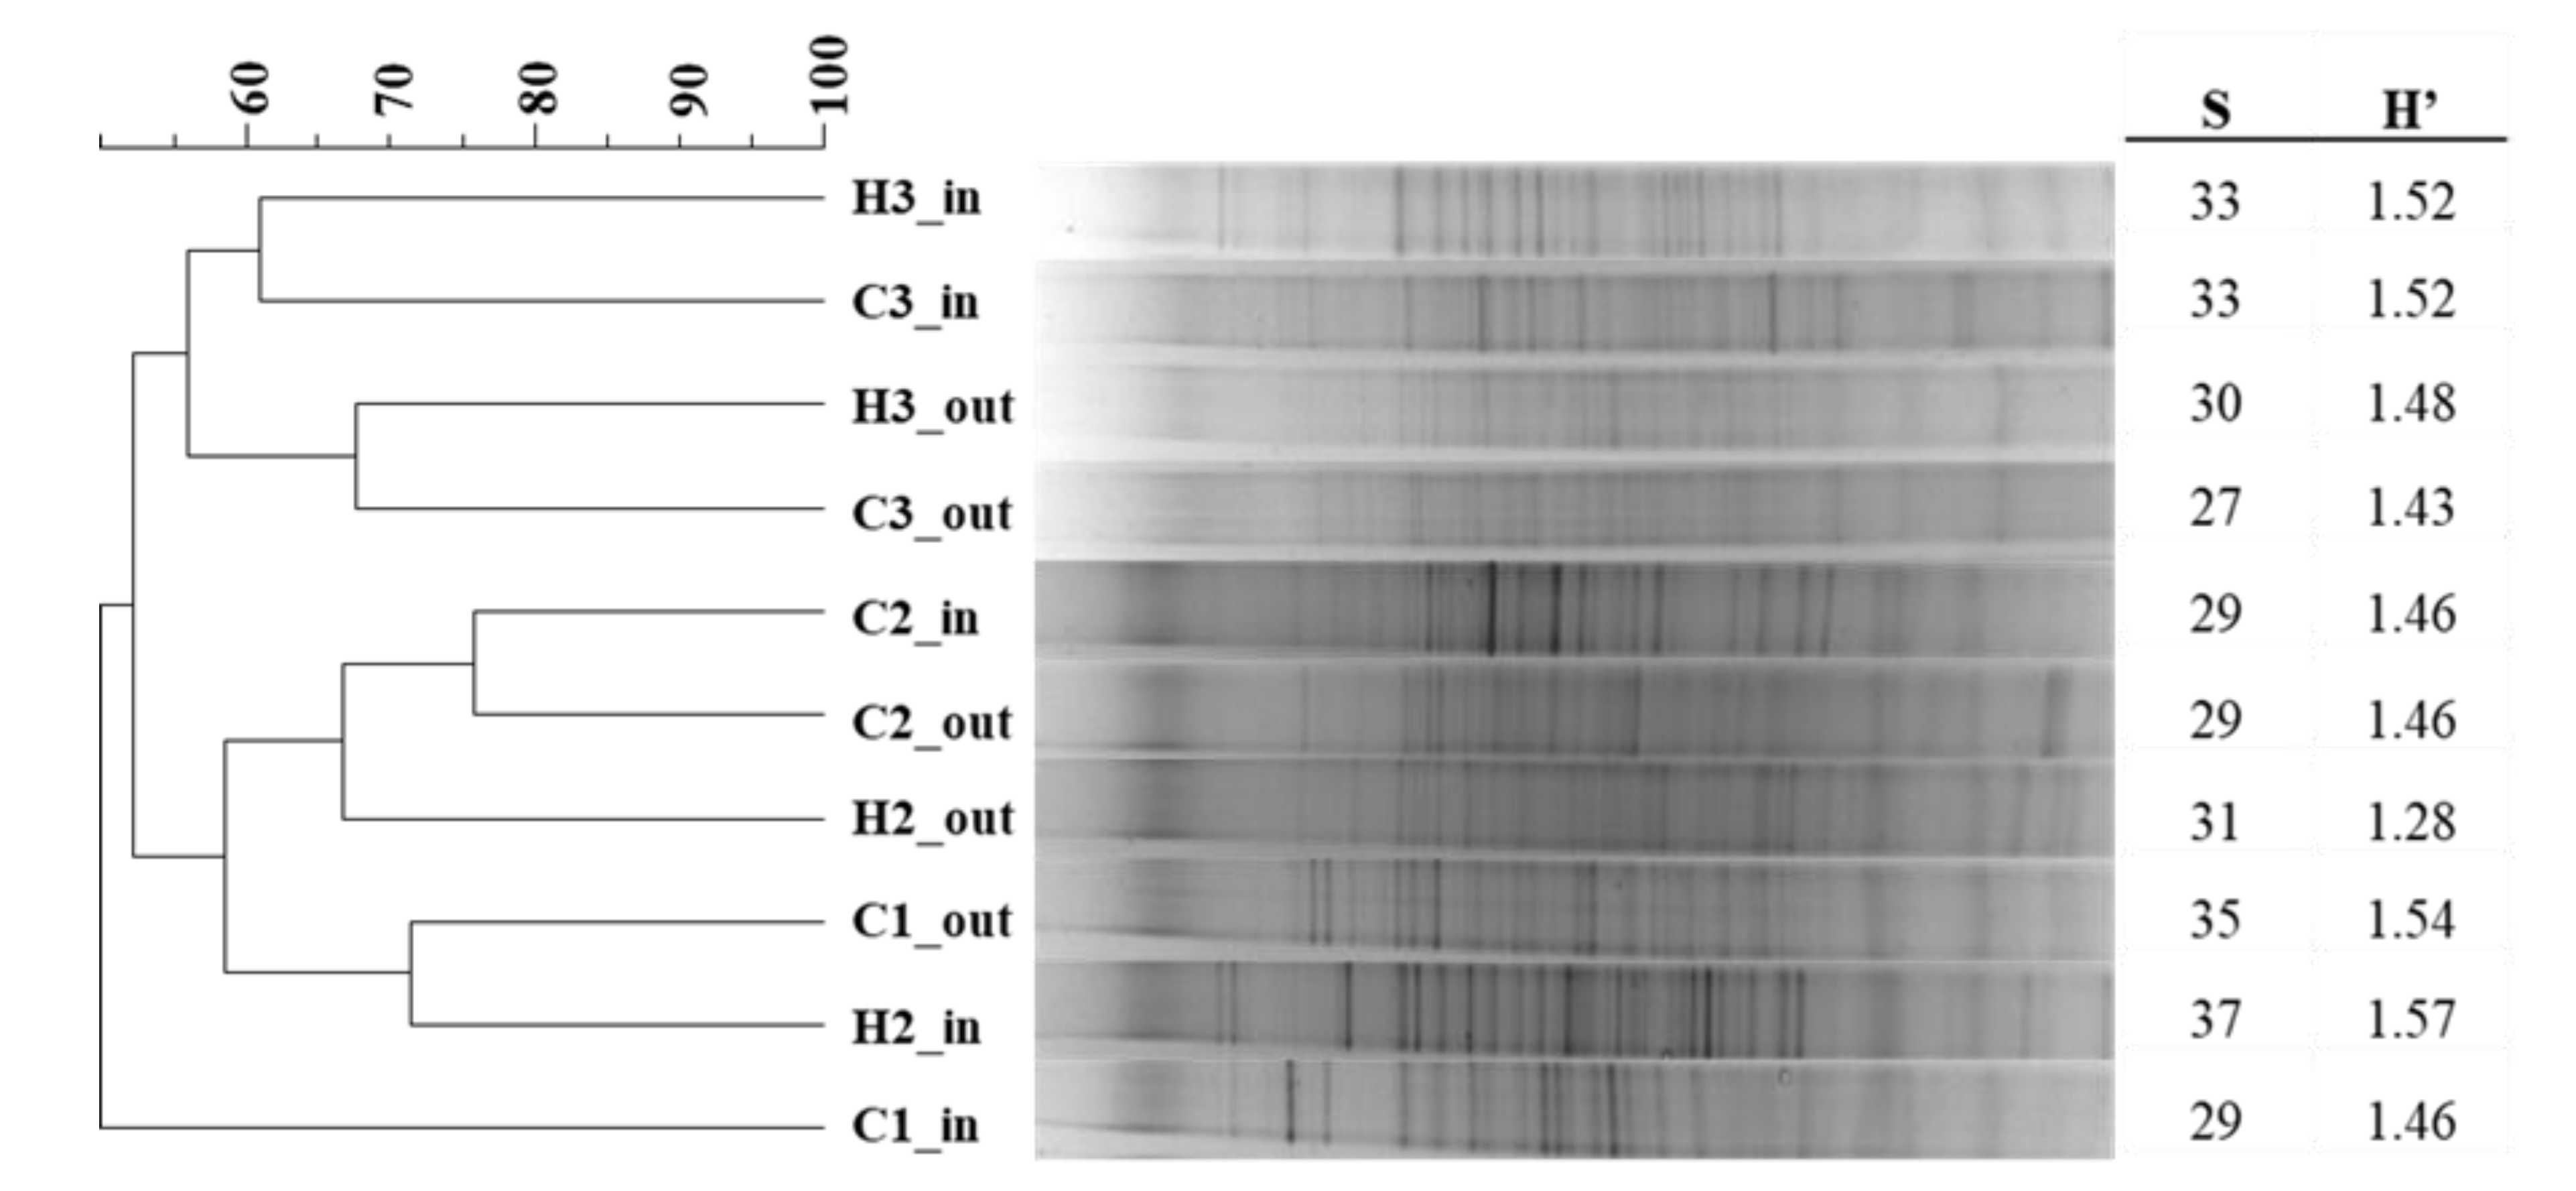
Substrate-associated bacterial communities from the inlet and outlet zones of the CW were evaluated by DGGE fingerprinting during five seasons (Figure 3). DGGE patterns showed that species richness varied among samples, without a trend, with the higher number of bands (37) found in the substrate collected from the inlet zone during the hot season of the second year (H2_in), and the lower (27) recorded in the C3_out.
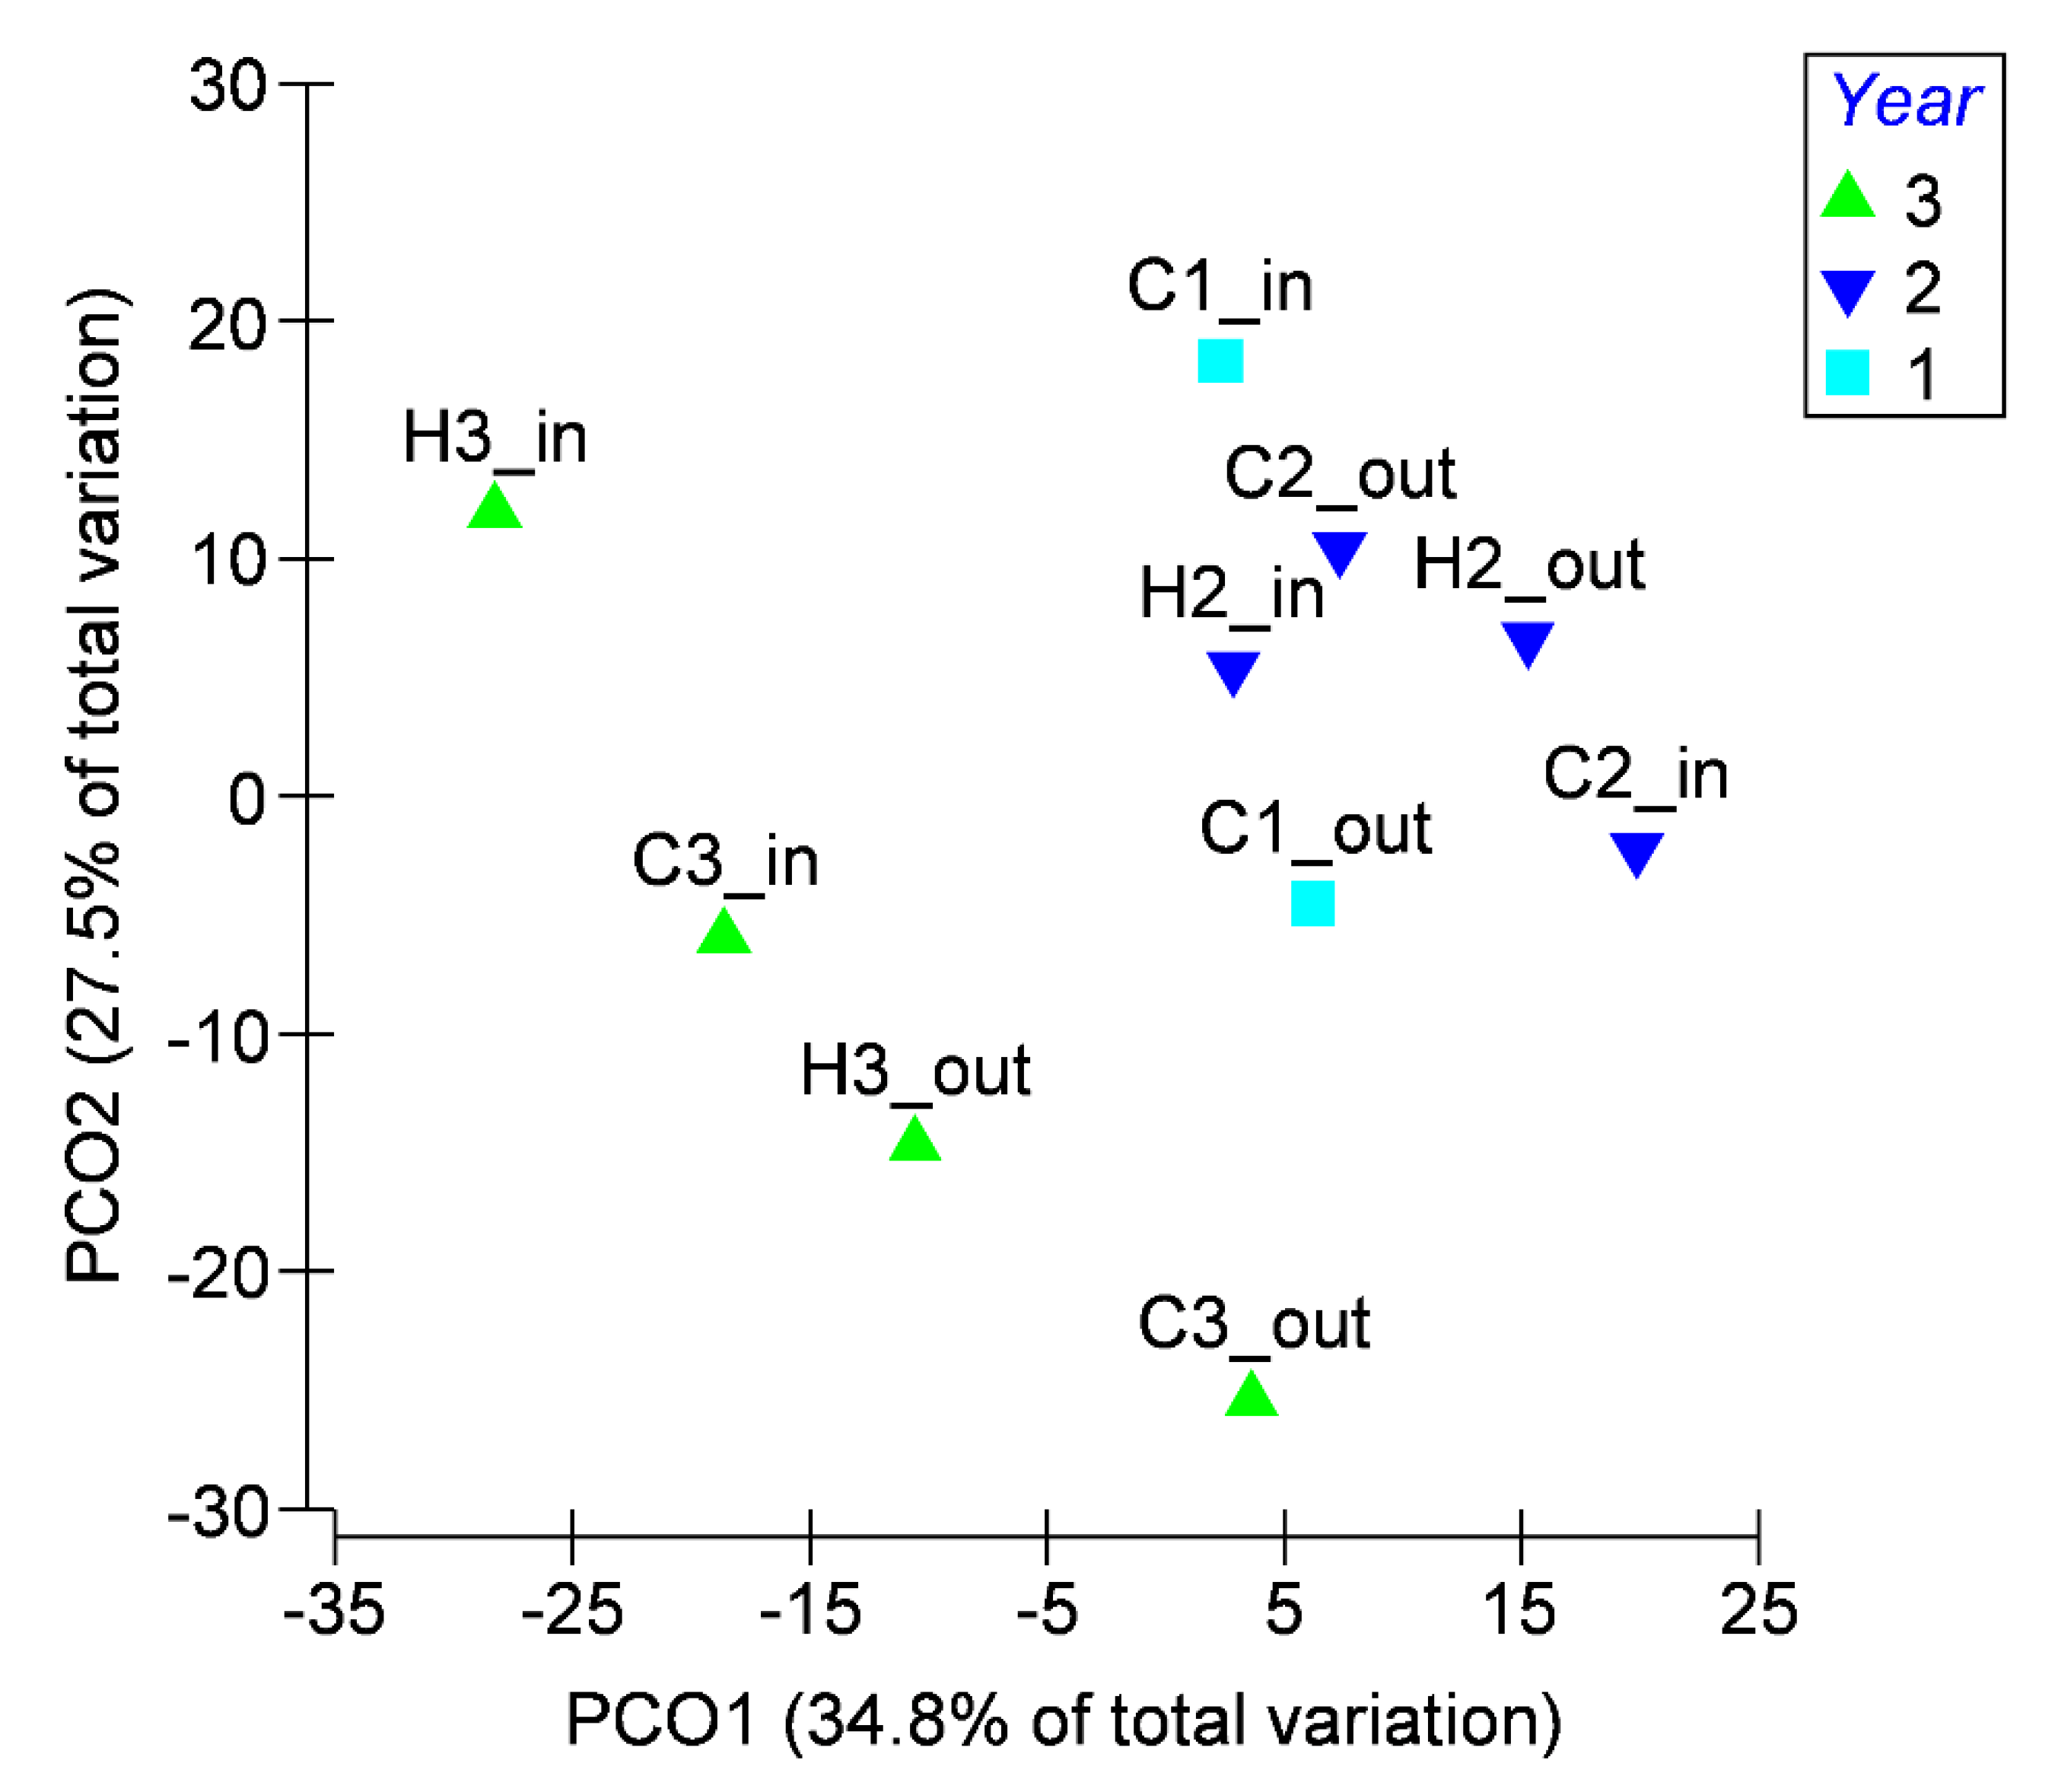
Besides the band number, some differences were also observed in band intensity and position, indicating the existence of different substrate-associated bacterial communities, and corroborated by the Shannon–Wiener index. The dendrogram and PCO constructed based on DGGE data showed differences in the structure and composition of substrate bacterial communities (Figure 3 and Figure 4). PCO explained 60.3% of the total variance between samples on the two first components. Bacterial communities were split into two main groups between samples collected in the cold and hot seasons of first/second year and third year (with a similarity of about 50%), and the samples collected from the inlet zone in the C season of the first year (C1_in).
The first group includes all samples from the third year, while the second group aggregates samples collected in the second year and the sample C1_out. These results indicate that the structure and composition of bacterial communities were mainly influenced by the year, rather than the season or the CW zone. The statistical analysis (PERMANOVA) also showed that the composition of substrate-associated bacterial communities was significantly (p < 0.05) influenced by year. Calheiros et al. [16] analyzed the effect of different types of bed materials used in a horizontal subsurface flow CW for tannery wastewater treatment had on the dynamics of the substrate-associated bacterial communities. Results showed that the temporal factor had less influence on bacterial communities than the place of collection (substrate or root) and the type of substrate. Truu et al. [39] also studied the microbial community structure in a horizontal subsurface flow CW planted with sand filter, treating domestic wastewater. Calheiros et al. [40] found diverse and distinct bacterial communities associated with different CW systems. In this study, the most relevant spatial pattern found in microbial community structure was related to the depth gradient, followed by differences between the CW inlet and outlet.

4. Conclusions

The CW was effective in removing COD, BOD5, TSS, PO43−, NH4+, NO3, and NO2, showing no significant differences between the analyzed seasons. Concerning the microbiological parameters, the present study showed that season variations did not influence the inflow of total coliforms and E. coli across three consecutive years in wastewater. Moreover, the removal efficiency of total coliforms from wastewater did not significantly vary along the seasons. However, in relation to E. coli counts, significant differences were found between hot and cold seasons. The system was efficient on the depuration of E. coli in all C seasons, since no viable counts were recorded at the CW outlet, even though there was always associated inlet load. Counts of both indicator microorganisms in substrate and roots tended to be lower in cold seasons (C1, C2, C3) than in hot seasons (H2, H3) and, in general, the bacteria concentration found associated with roots and substrate from the outlet zone was 2 logs lower than in inlet zone. Our results indicate that the structure and composition of bacterial communities are mainly influenced by the year rather than the season or the CW zone. Nevertheless, research is still needed to unveil the identification of the wastewater bacterial load regarding its taxonomy composition, and biodegradation capacities to further advance the current knowledge of using phytoremediation to treat domestic wastewaters.

Supplementary Materials

The following are available online at https://www.mdpi.com/article/10.3390/app11093875/s1.

Author Contributions

Conceptualization, C.S.C.C. and P.M.L.C.; investigation, A.R.F. and C.S.C.C.; data curation, S.I.A.P. and C.S.C.C.; writing—original draft preparation, C.S.C.C. and S.I.A.P.; writing—review and editing, C.S.C.C., S.I.A.P. and P.M.L.C.; funding acquisition, P.M.L.C. All authors have read and agreed to the published version of the manuscript.

Funding

This research was supported by National Funds from FCT—Fundação para Ciência e Tecnologia within the scope of projects UIDB/04423/2020, UIDP/04423/2020, and UIDB/50016/2020 projects.

Institutional Review Board Statement

Not applicable.

Informed Consent Statement

Not applicable.

Data Availability Statement

Data is contained within the article.

Conflicts of Interest

The authors declare no conflict of interest. The funders had no role in the design of the study; in the collection, analyses, or interpretation of data; in the writing of the manuscript, or in the decision to publish the results.

References

  1. Calheiros, C.S.C.; Bessa, V.S.; Mesquita, R.B.R.; Brix, H.; Rangel, A.O.S.S.; Castro, P.M.L. Constructed wetland with a polyculture of ornamental plants for wastewater treatment at a rural tourism facility. Ecol. Eng. 2015, 79, 1–7. [Google Scholar] [CrossRef]
  2. Calheiros, C.S.C.; Pereira, S.I.A.; Castro, P.M.L. Constructed wetlands as nature-based solutions. In An Introduction to Constructed Wetlands; Jespersen, A.N., Ed.; Nova Science Publishers, Inc.: Hauppauge, NY, USA, 2020; pp. 47–75. ISBN 9781631172557. [Google Scholar]
  3. Stefanakis, A.I. Constructed wetlands: Description and benefits of an eco-tech water treatment system. In Impact of Water Pollution on Human Health and Environmental Sustainability; McKeown, E., Bugyi, G., Eds.; IGI Global: Hershey, PA, USA, 2016; pp. 281–303. ISBN 9781466695603. [Google Scholar]
  4. Calheiros, C.S.C.; Pereira, S.I.A.; Castro, P.M.L. Culturable bacteria associated to the rhizosphere and tissues of Iris pseudacorus plants growing in a treatment wetland for winery wastewater discharge. Ecol. Eng. 2018, 115, 67–74. [Google Scholar] [CrossRef]
  5. Masi, F.; Rizzo, A.; Regelsberger, M. The role of constructed wetlands in a new circular economy, resource oriented, and ecosystem services paradigm. J. Environ. Manag. 2018, 216, 275–284. [Google Scholar] [CrossRef]
  6. Hsu, C.-B.; Hsieh, H.L.; Yang, L.; Wu, S.H.; Chang, J.S.; Hsiao, S.C.; Su, H.C.; Yeh, C.H.; Ho, Y.S.; Lin, H.J. Biodiversity of constructed wetlands for wastewater treatment. Ecol. Eng. 2011, 37, 1533–1545. [Google Scholar] [CrossRef]
  7. Semeraro, T.; Giannuzzi, C.; Beccarisi, L.; Aretano, R.; de Marco, A.; Pasimeni, M.R.; Zurlini, G.; Petrosillo, I. A constructed treatment wetland as an opportunity to enhance biodiversity and ecosystem services. Ecol. Eng. 2015, 82, 517–526. [Google Scholar] [CrossRef]
  8. Moore, T.L.C.; Hunt, W.F. Ecosystem service provision by stormwater wetlands and ponds—A means for evaluation? Water Res. 2012, 46, 6811–6823. [Google Scholar] [CrossRef] [PubMed]
  9. Brix, H. Do macrophytes play a role in constructed treatment wetlands? Water Sci. Technol. 1997, 35, 11–17. [Google Scholar] [CrossRef]
  10. Vymazal, J. Plants used in constructed wetlands with horizontal subsurface flow: A review. Hydrobiologia 2011, 674, 133–156. [Google Scholar] [CrossRef]
  11. Kadlec, R.H.; Wallace, S. Treatment Wetlands, 2nd ed.; CRC Press: Boca Raton, FL, USA, 2009; ISBN 9781566705264. [Google Scholar]
  12. Rehman, F.; Pervez, A.; Khattak, B.N.; Ahmad, R. Constructed Wetlands: Perspectives of the Oxygen Released in the Rhizosphere of Macrophytes. Clean Soil Air Water 2017, 45, 1–9. [Google Scholar] [CrossRef]
  13. Faulwetter, J.L.; Gagnon, V.; Sundberg, C.; Chazarenc, F.; Burr, M.D.; Brisson, J.; Camper, A.K.; Stein, O.R. Microbial processes influencing performance of treatment wetlands: A review. Ecol. Eng. 2009, 35, 987–1004. [Google Scholar] [CrossRef]
  14. Stottmeister, U.; Wießner, A.; Kuschk, P.; Kappelmeyer, U.; Kästner, M.; Bederski, O.; Müller, R.A.; Moormann, H. Effects of plants and microorganisms in constructed wetlands for wastewater treatment. Biotechnol. Adv. 2003, 22, 93–117. [Google Scholar] [CrossRef] [PubMed]
  15. Sánchez, O. Constructed Wetlands Revisited: Microbial Diversity in the—Omics Era. Microb. Ecol. 2017, 73, 722–733. [Google Scholar] [CrossRef] [PubMed]
  16. Calheiros, C.S.C.; Duque, A.F.; Moura, A.; Henriques, I.S.; Correia, A.; Rangel, A.O.S.S.; Castro, P.M.L. Substrate effect on bacterial communities from constructed wetlands planted with Typha latifolia treating industrial wastewater. Ecol. Eng. 2009, 35, 744–753. [Google Scholar] [CrossRef]
  17. Calheiros, C.S.C.; Teixeira, A.; Pires, C.; Franco, A.R.; Duque, A.F.; Crispim, L.F.C.; Moura, S.C.; Castro, P.M.L. Bacterial community dynamics in horizontal flow constructed wetlands with different plants for high salinity industrial wastewater polishing. Water Res. 2010, 44, 5032–5038. [Google Scholar] [CrossRef] [PubMed] [Green Version]
  18. Calheiros, C.S.C.; Pereira, S.I.A.; Franco, A.R.; Castro, P.M.L. Diverse arbuscular mycorrhizal fungi (AMF) communities colonize plants inhabiting a constructedwetland for wastewater treatment. Water 2019, 11, 1535. [Google Scholar] [CrossRef] [Green Version]
  19. Arroyo, P.; Ansola, G.; de Miera, L.E.S. Effects of substrate, vegetation and flow on arsenic and zinc removal efficiency and microbial diversity in constructed wetlands. Ecol. Eng. 2013, 51, 95–103. [Google Scholar] [CrossRef]
  20. Guan, W.; Yin, M.; He, T.; Xie, S. Influence of substrate type on microbial community structure in vertical-flow constructed wetland treating polluted river water. Environ. Sci. Pollut. Res. 2015, 22, 16202–16209. [Google Scholar] [CrossRef]
  21. Long, Y.; Zhang, Z.; Pan, X.; Li, B.; Xie, S.; Guo, Q. Substrate influences on archaeal and bacterial assemblages in constructed wetland microcosms. Ecol. Eng. 2016, 94, 437–442. [Google Scholar] [CrossRef]
  22. Sánchez-Castro, I.; Ferrol, N.; Cornejo, P.; Barea, J.M. Temporal dynamics of arbuscular mycorrhizal fungi colonizing roots of representative shrub species in a semi-arid Mediterranean ecosystem. Mycorrhiza 2011, 22, 449–460. [Google Scholar] [CrossRef]
  23. Zhang, C.; Wang, B.; Dai, X.; Li, S.; Lu, G.; Zhou, Y. Structure and function of the bacterial communities during rhizoremediation of hexachlorobenzene in constructed wetlands. Environ. Sci. Pollut. Res. 2017, 24, 11483–11492. [Google Scholar] [CrossRef]
  24. Stefanakis, A.I.; Akratos, C.S. Removal of Pathogenic Bacteria in Constructed Wetlands: Mechanisms and Efficiency. In Phytoremediation; Ansari, A., Gill, S., Gill, R., Lanza, G., Newman, L., Eds.; Springer International Publishing: Cham, Switzerland, 2016; pp. 327–346. [Google Scholar]
  25. Calheiros, C.S.C.; Ferreira, V.; Magalhães, R.; Teixeira, P.; Lima Castro, P.M. Presence of microbial pathogens and genetic diversity of Listeria monocytogenes in a constructed wetland system. Ecol. Eng. 2017, 102, 344–351. [Google Scholar] [CrossRef]
  26. Grover, M.; Ali, S.Z.; Sandhya, V.; Rasul, A.; Venkateswarlu, B. Role of microorganisms in adaptation of agriculture crops to abiotic stresses. World J. Microbiol. Biotechnol. 2011, 27, 1231–1240. [Google Scholar] [CrossRef]
  27. Wu, S.; Carvalho, P.N.; Müller, J.A.; Manoj, V.R.; Dong, R. Sanitation in constructed wetlands: A review on the removal of human pathogens and fecal indicators. Sci. Total Environ. 2016, 541, 8–22. [Google Scholar] [CrossRef] [PubMed]
  28. Calheiros, C.S.C.; Pereira, S.I.A.; Brix, H.; Rangel, A.O.S.S.; Castro, P.M.L. Assessment of culturable bacterial endophytic communities colonizing Canna flaccida inhabiting a wastewater treatment constructed wetland. Ecol. Eng. 2017, 98, 418–426. [Google Scholar] [CrossRef]
  29. APHA. Standard Methods for the Examination of Water and Wastewater; Clesceri, L., Greenberg, A., Eaton, A., Eds.; American Public Health Association: Washington, DC, USA, 2005. [Google Scholar]
  30. Pereira, S.I.A.; Castro, P.M.L. Phosphate-solubilizing rhizobacteria enhance Zea mays growth in agricultural P-deficient soils. Ecol. Eng. 2014, 73, 526–535. [Google Scholar] [CrossRef]
  31. Muyzer, G.; de Waal, E.C.; Uitterlinden, A.G. Profiling of complex microbial populations by denaturing gradient gel electrophoresis analysis of polymerase chain reaction-amplified genes coding for 16S rRNA. Appl. Environ. Microbiol. 1993, 59, 695–700. [Google Scholar] [CrossRef] [Green Version]
  32. Eddy, M. Wastewater Engineering: Treatment and Reuse; Tchobanoglous, G., Burton, F.L., Eds.; McGraw-Hill Publishing: New York, NY, USA, 2003; ISBN 0070418780. [Google Scholar]
  33. Shingare, R.P.; Thawale, P.R.; Raghunathan, K.; Mishra, A.; Kumar, S. Constructed wetland for wastewater reuse: Role and efficiency in removing enteric pathogens. J. Environ. Manag. 2019, 246, 444–461. [Google Scholar] [CrossRef] [PubMed]
  34. Vymazal, J. Removal of enteric bacteria in constructed treatment wetlands with emergent macrophytes: A review. J. Environ. Sci. Health 2005, 40, 1355–1367. [Google Scholar] [CrossRef]
  35. Vymazal, J.; Kröpfelová, L. Wastewater treatment in constructed wetlands with horizontal sub-surface flow. In Environmental Pollution; Alloway, B.J., Trevors, J.T., Eds.; Springer: Berlin/Heidelberg, Germany, 2008. [Google Scholar]
  36. Hazra, M.; Avishek, K.; Pathak, G. Developing an Artificial Wetland System for Wastewater Treatment: A Designing Perspective. Int. J. Environ. Prot. 2011, 1, 8–18. [Google Scholar]
  37. Elfanssi, S.; Ouazzani, N.; Latrach, L.; Hejjaj, A.; Mandi, L. Phytoremediation of domestic wastewater using a hybrid constructed wetland in mountainous rural area. Int. J. Phytoremediat. 2018, 20, 75–87. [Google Scholar] [CrossRef] [PubMed]
  38. Zurita, F.; Carreón-Álvarez, A. Performance of three pilot-scale hybrid constructed wetlands for total coliforms and Escherichia coli removal from primary effluent—A 2-year study in a subtropical climate. J. Water Health 2015, 13, 446–458. [Google Scholar] [CrossRef] [PubMed] [Green Version]
  39. Truu, J.; Nurk, K.; Juhanson, J.; Mander, Ü. Variation of miorobiologioal parameters within planted soil filter for domestic wastewater treatment. J. Environ. Sci. Health 2005, 40, 1191–1200. [Google Scholar] [CrossRef] [PubMed]
  40. Calheiros, C.S.C.; Duque, A.F.; Moura, A.; Henriques, I.S.; Correia, A.; Rangel, A.O.S.S.; Castro, P.M.L. Changes in the bacterial community structure in two-stage constructed wetlands with different plants for industrial wastewater treatment. Bioresour. Technol. 2009, 100, 3228–3235. [Google Scholar] [CrossRef] [PubMed]
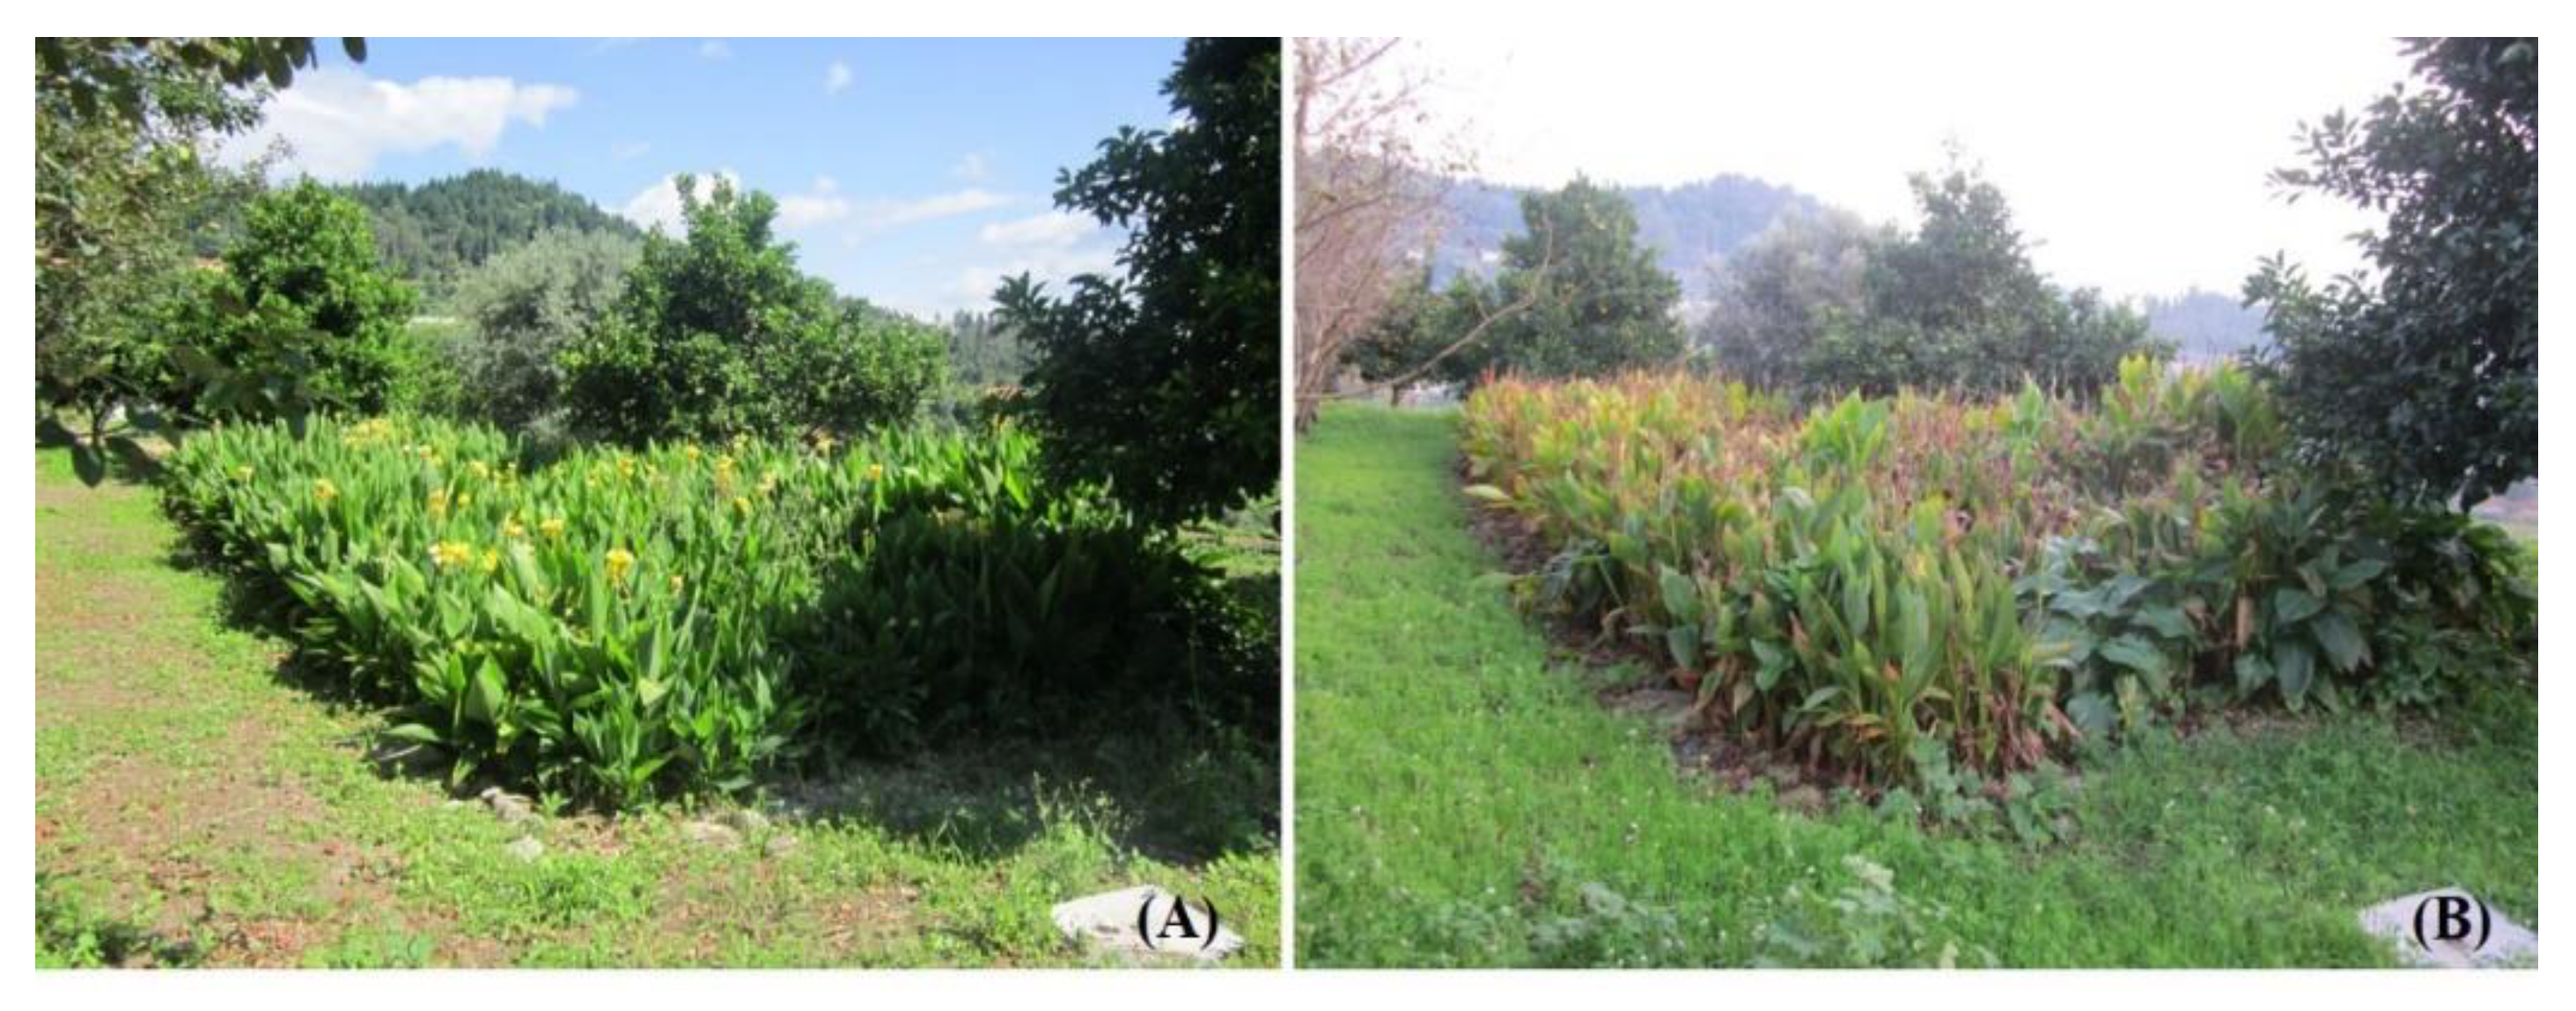
Figure 1. Constructed wetland for wastewater treatment at a tourism house: (A) hot season (spring/summer) and (B) cold season (autumn/winter).
Applsci 11 03875 g001
Figure 2. Removal efficiency of the CW wastewater parameters for each sampling trial, during cold (C) and hot (H) seasons across three consecutive years (1, 2, 3).
Applsci 11 03875 g002
Figure 3. Cluster analysis generated by the 16S rRNA DGGE patterns of bacterial communities associated to the substrate in the inlet (in) and outlet (out) zone of the CW, in cold (C) and hot (H) seasons across three consecutive years (1, 2, 3). The dendrogram was created using the UPGMA clustering method based on Jaccard coefficient. The species richness (S) and the Shannon–Wiener index (H’) is presented.
Applsci 11 03875 g003
Figure 4. Principal coordinate analysis (PCO) of the substrate associated bacterial communities based on Bray–Curtis similarity matrix showing samples colored by year.
Applsci 11 03875 g004
Table 1. Inlet and outlet composition of the wastewater from the constructed wetland during cold (C) and hot (H) seasons across three consecutive years (1, 2, 3). Values are mean ± standard error (n = 4 for each season).
Season/YearpHECCODBODTSS
(µS/cm)(mg/L)(mg/L)(mg/L)
InletOutletInletOutletInletOutletInletOutletInletOutlet
C16.70 ± 0.237.69 ± 0.09365 ± 176251 ± 86563 ± 33711 ± 4165 ± 1097 ± 3101 ± 448 ± 3
H26.75 ± 0.177.38 ± 0.181047 ± 414706 ± 104691 ± 20326 ± 5281 ± 4710 ± 1287 ± 11514 ± 3
C27.41 ± 0.127.33 ± 0.031002 ± 151648 ± 135443 ± 175136 ± 110184 ± 9438 ± 3266 ± 2012 ± 4
H37.33 ± 0.077.07 ± 0.33816 ± 100559 ± 53385 ± 2537 ± 11186 ± 3424 ± 7113 ± 257 ± 1
C37.34 ± 0.126.81 ± 0.04818 ± 138643 ± 185508 ± 13738 ± 6247 ± 8023 ± 872 ± 286 ± 1
Season/YearPO43−NH4+NO2NO3
(mg/L)(mg/L)(mg/L)(mg/L)
InletOutletInletOutletInletOutletInletOutlet
C126.15 ± 24.023.47 ± 2.3119.16 ± 11.747.91 ± 3.922.10 ± 1.770.13 ± 0.079.85 ± 5.540.95 ± 0.43
H226.64 ± 6.917.13 ± 1.4160.22 ± 29.6927.07 ± 14.102.18 ± 0.280.13 ± 0.0321.26 ± 2.671.92 ± 0.06
C218.57 ± 4.235.15 ± 2.1127.26 ± 24.7014.24 ± 12.841.83 ± 1.270.14 ± 0.0215.08 ± 5.753.07 ± 1.19
H315.75 ± 1.988.39 ± 1.1244.65 ± 15.117.37 ± 4.370.63 ± 0.160.12 ± 0.063.42 ± 2.120.76 ± 0.12
C325.85 ± 5.586.38 ± 0.7951.77 ± 17.0620.87 ± 7.400.31 ± 0.070.10 ± 0.029.16 ± 3.405.00 ± 2.93
Note: EC: electric conductivity; COD: chemical oxygen demand; BOD: biological oxygen demand; TSS: total suspended solids.
Table 2. Total Coliforms and Escherichia coli counts (log10 CFU/mL) in CW inlet and outlet wastewater during the cold (C) and hot (H) seasons across three consecutive years (1, 2, 3). Values are presented as CFU Log10 mean ± standard error (n = 3–4 for each season).
SeasonTotal Coliforms (log10 CFU/mL)Escherichiacoli (log10 CFU/mL)
InletOutletInletOutlet
C15.1 ± 0.53.4 ± 0.52.7 ± 0.6NC
H24.8 ± 0.33.5 ± 0.23.5 ± 0.32.5 ± 0.3
C24.6 ± 0.12.8 ± 0.23.0 ± 0.3NC
H35.1 ± 0.62.8 ± 0.62.9 ± 0.32.3 ± 0.5
C34.3 ± 0.32.7 ± 0.13.1 ± 0.3NC
NC: no viable counts.
Table 3. Enumeration of total coliforms, Escherichia coli, and total heterotrophic bacterial (HB) associated to plant roots (log10 CFU/g fresh weight) and in the substrate (log10 CFU/g wet soil) from the CW inlet and outlet zones, in cold (C) and hot (H) seasons across three consecutive years (1, 2, 3).
Total Coliforms (log10 CFU/g)Escherichia coli (log10 CFU/g)HB (log10 CFU/g)
CW Inlet ZoneCW Outlet ZoneCW Inlet ZoneCW Outlet ZoneCW Inlet ZoneCW Outlet Zone
SubstrateRootSubstrateRootSubstrateRootSubstrateRootSubstrateRootSubstrateRoot
C14.55.14.03.73.84.9NCNC7.67.65.77.3
H26.66.74.75.63.64.62.53.67.66.75.56.0
C24.86.8NCNC3.73.5NCNC5.54.73.75.0
H36.66.55.75.74.34.73.42.17.47.35.56.5
C33.65.83.54.12.93.8NCNC3.84.73.43.3
NC: no viable counts.
Publisher’s Note: MDPI stays neutral with regard to jurisdictional claims in published maps and institutional affiliations.