Abstract
This study aims to predict the compressive strength of concrete using a machine-learning algorithm with linear regression analysis and to evaluate its accuracy. The open-source software library TensorFlow was used to develop the machine-learning algorithm. In the machine-earning algorithm, a total of seven variables were set: water, cement, fly ash, blast furnace slag, sand, coarse aggregate, and coarse aggregate size. A total of 4297 concrete mixtures with measured compressive strengths were employed to train and testing the machine-learning algorithm. Of these, 70% were used for training, and 30% were utilized for verification. For verification, the research was conducted by classifying the mixtures into three cases: the case where the machine-learning algorithm was trained using all the data (Case-1), the case where the machine-learning algorithm was trained while maintaining the same number of training dataset for each strength range (Case-2), and the case where the machine-learning algorithm was trained after making the subcase of each strength range (Case-3). The results indicated that the error percentages of Case-1 and Case-2 did not differ significantly. The error percentage of Case-3 was far smaller than those of Case-1 and Case-2. Therefore, it was concluded that the range of training dataset of the concrete compressive strength is as important as the amount of training dataset for accurately predicting the concrete compressive strength using the machine-learning algorithm.
1. Introduction
Concrete is an artificial composite material of various materials, including water, cement, sand, and coarse aggregates, and its mechanical properties depend on the amounts of the materials. Among the various mechanical properties of concrete, the most important is its compressive strength, and numerous studies have been conducted to investigate the relationship between the mixing amounts of materials and the compressive strength. However, accurate prediction of the compressive strength remains difficult, and in recent years, various chemical admixtures and admixtures have been proposed for improving the performance of the concrete. The properties of the materials mixed into the concrete differ depending on the production area and production method, affecting the final compressive strength of concrete. In addition to the mixed ingredients, the amount of moisture of the aggregate, along with the curing conditions, affects the concrete compressive strength. Therefore, it is difficult to accurately predict the compressive strength of concrete, and the concrete mixture is designed according to experience.
In many cases, the compressive design strength resulting from the mixture design of concrete based on experience exhibits a high error relative to the measured concrete compressive strength. Therefore, in recent years, researchers have attempted to predict the compressive strength according to the mixture using a machine-learning algorithm (hereafter, MLA).
Ahmad et al. [1] utilized a machine-learning technique called the individuals and ensemble algorithm to predict the compressive strength of concrete containing fly ash. Among the ensemble algorithms, the begging method was used. An accurate prediction was achieved using the begging method with 20 submodels and a decision tree. Chopra et al. [2] predicted the concrete compressive strength at 28, 56, and 91 days. An artificial neural network (ANN) model based on a small amount of data, i.e., a total of 76 data points, was developed, and through Levenberg–Marquardt training, the concrete compressive strength was predicted. Feng et al. [3] used a weak learner learning method, which has a low prediction error, along with the boosting method, a machine-learning technique that accelerates the learning to perform a strong learner with a good prediction for predicting the compressive strength of concrete. The machine learning was conducted with 1030 data points, and the algorithm was verified with 103 data points.
Nguyen et al. [4] predicted the compressive strength of high-strength concrete using four prediction algorithms: support vector regression (SVR), multilayer perceptron (MLP), gradient boosting regressor (GBR), and gradient boosting (XGBoost). A total of 1133 data points for the concrete compressive strength were used for the machine learning, and the hyperparameter tuning process was conducted to increase the accuracy of the algorithm. DeRousseau et al. [5] predicted the compressive strength through various machine-learning techniques, including a support vector machine (SVM), a decision tree-based model, linear regression, multivariate polynomial regression, Kernelized regression methods, and a regression tree based on 1681 fields and laboratory concrete data, and performed a comparative study on the techniques based on the predicted values.
Kandiri et al. [6] established the ANN model using the multiobjective slap swarm algorithm (MOSSA) and M5P model tree algorithm based on 624 data points and predicted the compressive strength of concrete containing blast furnace slag. This model exhibited a small error percentage, with mean absolute percentage errors (MAPEs) of 12.5% and 7.25%. Mohammed et al. [7] established five machine-learning models using linear regression, nonlinear regression, multi-logistic regression (MLR), and M5P tree, and an ANN based on 450 data points for predicting the compressive strength of concrete containing a high volume of fly ash (HVFA) and performed a comparative study on the techniques based on the predicted values. Golafshani et al. [8] established an artificial intelligence (AI) model that grafted gray wolf optimizer (GWO) and classical optimization algorithms (COAs) onto an ANN and an adaptive neuro-fuzzy inference system (ANFIS). To predict the compressive strength of the normal concrete and high-strength concrete, 2817 data points were utilized. Ahma-Nedushan et al. [9] predicted the compressive strength of high-strength concrete using the k-nearest neighbor algorithm trained with 104 data points. This model was compared with the results of regression neural network, stepwise regression, and modular neural network models. Behnood et al. [10] predicted the compressive strength of normal concrete and high-strength concrete using the M5P model tree algorithm trained with 1912 data points. This algorithm was compared with the results of other machine-learning techniques, such as ANN, classification and regression trees, and ANFISs.
Mohammad et al. [11] studied the important factors for strength, stiffness, and the drift ratio of steel plate shear walls, as well as reinforced concrete shear walls utilizing meta-models developed with ANN, trained under 4300 data points. Roshani et al. [12] predicted two-phase flows independent of the oil pipeline’s scale layer thickness based on 162 cases. Regiment identification was performed using the support vector machine (SVM), and the void fraction was predicted through the use of the multilayer perceptron with the Levenberg–Marquardt algorithm (MLP-LM). Roshani et al. [13] looked into determining the type and amount of four different petroleum by-products using gamma attenuation technique combined with ANN. Fuqua et al. [14] predicted control chart pattern recognition (CCPR) employing a convolutional neural network (CSCNN) trained with 7194 data points. Roshni et al. [15] predicted gas–dol–water volume fractions of a three-phase flow using the group method of data handling (GMDH), a neural network trained with 108 data points. Anyaoha et al. [16] predicted the compressive strength of concrete using boosting smooth transition regression trees (BooST) based on 2456 data points. In addition, compared to other technologies (multilayer perceptron, support vector machine, etc.), BooST exhibited good in complex model analysis. Al-Shamiri et al. [17] predicted the compressive strength of high-strength concrete using an extreme learning machine (ELM), a new method for an artificial neural network (ANN), trained with 324 data points. Ganguly et al. [18] introduced a convolutional neural network (CNN) topology using wavelet kernels to detect and identify single or multiple partial discharges (PD).
This study aims to predict the compressive strength of low-to-high-strength concrete using an MLA based on linear regression and to evaluate the accuracy of MLA when it was trained with a different range and/or amount of data. The open-source library TensorFlow, a representative machine-learning algorithm, was used to develop an algorithm for predicting the compressive strength of concrete. For testing MLA, 4279 data points were prepared. This is more data than previous studies. Among them, A total of 2991 training data were employed for the model training, and a total of 1288 data points were used to test the algorithm, and the measured compressive strength in data ranged from 7 to 100 MPa. First, the errors of the predicted values obtained from the MLA trained with all the data (2991 ea.) were examined (Case-1). Second, it is investigated how the predicted values were affected in the case where the number of training data points (1080 = 180 × 6 ranges) in each compressive strength’s range was the same (Case-2). Finally, 2991 data points were divided into six subcases according to the compressive strength of concrete, and then the predicted results of MLA trained with each subcase were investigated (Case-3).
2. Machine Learning Algorithm
2.1. Open-Source Ai Development Framework Tensorflow
There are representative open-source AI frameworks, including PyTorch, Theano, TensorFlow, and Keras. Among them, TensorFlow is widely used in the AI field owing to its various advantages. One advantage of TensorFlow is that it uses not only the CPU with sequential data processing but also the GPU with the parallel processing method, which processes orders simultaneously; hence, its algorithm processing speed is high. Moreover, TensorFlow is a Python-based library and can be used with other modules such as Numpy, Scipy, and Requests, which are other Python libraries, allowing easy data extraction and arrangement. Furthermore, because TensorFlow provides various functions, including tf.matmul, tf.split, and tf.tile, there is no need to pay attention to details such as the process of reentering the output of a node in the algorithm implementation. Therefore, the machine-learning model in this study was developed using TensorFlow owing to these advantages.
2.2. Model Composition
Machine learning is an AI technique that learns based on the related training dataset to obtain the desired results. In this study, among the various learning methods of machine learning, the method of predicting a specific result when entering random variables by identifying the association or regularity between variables of training dataset and results of training dataset was selected.
Linear regression is the most basic theory to determine a result. Linear regression involves approaching the most reasonable straight line by reducing the error of a hypothetical straight line of numerous variables. It is performed to find the optimal straight line, and in this process, the gradient descent method algorithm is generally used (Figure 1). The gradient descent method is that a hypothetical line moves in the direction toward where the absolute value of the slope of a specific value is smaller. It involves performing repetitive calculations to get closer to 0 by calculating the slope of the corresponding value and moving to the left if the value is positive and to the right, if the value is negative. The most representative modules among the linear regression models using the gradient descent method are TensorFlow, Numpy, and Pandas. TensorFlow is selected for this study. The linear regression models built using TensorFlow are outlined in Equations (1)–(4). The linear regression model is a linear equation, where y is the dependent variable, a represents the weight, x is the independent variable, and b represents the bias. Equation (2) describes the process of identifying the difference between the y value obtained from Equation (1) and the measured value and is used to decide whether to conduct re-learning of the linear regression model. As the value of Equation (2) converges toward 0, the accuracy increases. When it is decided to re-perform the learning given by Equation (2), the w and b values must be reset up. These values are determined by Equations (3) and (4), respectively. Therefore, Equations (1)–(4) are subjected to learning again until the value of Equation (2) converges to 0. During this process, users can specify the number of repetitions rather than setting the converged value.
where y is the dependent variable, a is the weight, b is the bias, and x and w are the independent variables and actual value.
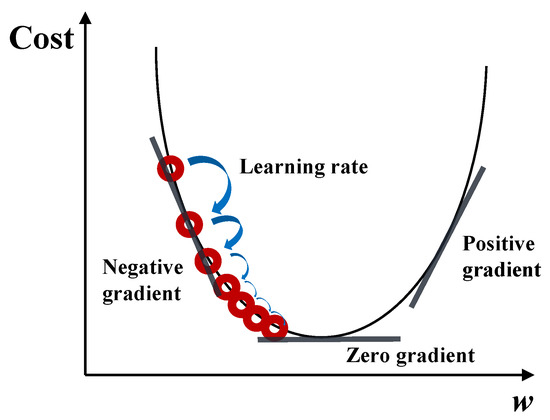
Figure 1.
Gradient descent.
2.3. Application
A database related to concrete’s mixtures and measured compressive strength of concrete (f′c,meas) was constructed, which corresponds to the input stage of Figure 2. Concrete mixtures are normally designed with many variables. Subsequently, it passed the feature-extraction stage, in which the data is classified by each variable such as water, cement, sand, coarse aggregate, size of coarse aggregate, fly ash, and blast furnace slag (GGBS). And then, xi was designated to be a total of 7 variables in Equation (1): x1 represents water, x2 represents cement, x3 represents sand, x4 represents coarse aggregate, x5 represents the size of the coarse aggregate, x6 represents fly ash and x7 represents GGBS. Moreover, the w value of Equation (2) is f′c,meas. Next, to conduct the learning stage, i.e., to construct the linear regression model to predict the compressive strength. Finally, repetitive machine learning with a linear algorithm was conducted to obtain the optimal result through the gradient descent method.
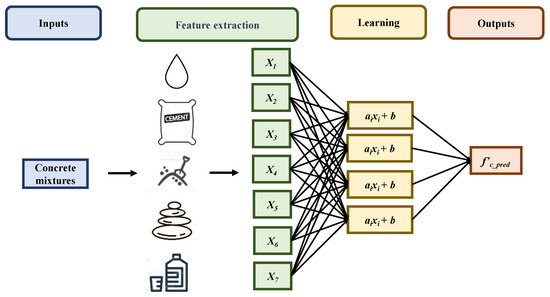
Figure 2.
Interpretation of machine learning with concrete mixtures.
2.4. Database of Concrete Mixtures
For training and testing the MLA, concrete mixtures and experimental data for the concrete compressive strength were needed. In this study, 4279 data points suitable for the learning and testing of the algorithm among the data presented by Yang et al. [19] were utilized. The f′c,meas of data ranges from 7 MPa to 100 MPa and were classified into the following ranges: 7–20 MPa, 20–30 MPa, 30–40 MPa, 40–60 MPa, 60–80 MPa, and 80–100 MPa. Furthermore, they were classified according to the mixing form: ordinary Portland cement (OPC), OPC + FA (fly ash), OPC+ blast furnace slag (GGBS), and OPC + FA + GGBS. The type of binder, compressive strength ranges and maximum and minimum values of each ingredient are presented in Table 1. 70% of the classified data were used as a training dataset, and the other 30% were utilized for the accuracy verification of the MLA.

Table 1.
Concrete mixtures and measured compressive strength.
3. Results
3.1. Evaluation Method
To evaluate the agreement between the predicted value obtained through MLA and the measured value, along with the MLA error, the coefficient of variation (CV), root-mean-square error (RMSE), mean absolute error (MAE) and mean absolute percent error (MAPE) was used. The CV was obtained by dividing the standard deviation by the average and comparing datasets with different units of measure. The RMSE is an objective error index used to study the difference between the model-predicted value and the measured value. The MAE, i.e., the absolute value of the difference between the predicted value and the measured value, indicates the accuracy (reliability) of the model. The MAPE supplements the disadvantages of the MAE and indicates how much relative error has occurred.
where σ is the standard deviation, m is the mean, f′c,meas and f′c,pred are measured and predicted compressive strength of concrete.
3.2. Test of MLA Trained with All Training Dataset (Case-1)
After training the MLA using the 2991 training dataset, the algorithm was tested with a 1288 testing dataset (Case-1). The verification results were summarized using the analysis method introduced in Section 3.1 and are presented in Table 2. Figure 3 shows the relationship between the ratios of the measured value to the predicted value (ratio of f′c,meas to f′c,pred, hereinafter γ) and the measured value. The mean (m) and CV of the data were found to be 1.00 and 0.28. However, as shown in the graph, there was a linear relationship where γ increased with f′c,meas. To analyze this tendency in detail, it was classified into different compressive-strength ranges, and the m, CV, RMSE, MAPE, and MAE of each range are presented in Table 2. The m and CV of γ and RMSE, MAPE, and MAE in the range of 7–20 MPa are 0.7, 0.22, 10.23 MPa, 8.76 MPa, and 51.0%, respectively. m increases as the f′c,meas range value increases, and the m of γ at 30–40 MPa was 0.96, which was the closest to 1, followed by the m of γ in the 40–60 MPa range (m = 1.09). The RMSE, MAPE, and MAE of the 30–40 MPa range were 8.86 MPa, 7.58 MPa, and 20.96%, respectively. Among the different strength ranges, this range had the smallest RMSE and MAPE. The RMSE, MAPE, and MAE of the 40–60 MPa range were 9.54 MPa, 7.99 MPa, and 16.52%, respectively; this range had the best MAE index among the different f′c,meas ranges. These ranges had the highest accuracy because 51% of the training dataset were included in them. Based on only the analysis result from Case-1, the results indicate that the algorithm estimates wi values with priority given to the range having the largest number of training datasets in the regression analysis.

Table 2.
Analysis accuracy of ML trained with f′c,meas in all ranges.
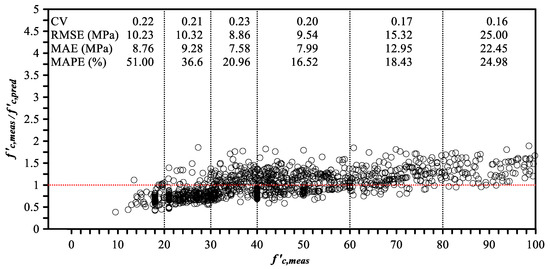
Figure 3.
Relationship between γ obtained from Case-1 and f′c,meas.
Figure 4 presents the normal distribution γ based on the mean m and σ calculated based on all the training datasets (Case-1). As shown, the frequency increased as γ approached 1, indicating that there were many cases in which the error between the measured and predicted values was small. The γ-value of the 95% confidence interval was 0.45–1.55. This suggests that if the MLA is trained using all the training datasets, the predicted values with an error rate of approximately 55% will be included in 95% of the result values. The γ-value of the 90% confidence interval was 0.53–1.47. The error rate was approximately 47%. The γ-value of the 80% confidence interval was 0.63–1.37, and the error rate was approximately 37%. Therefore, if the MLA is trained using a wide range of training datasets, the accuracy and reliability of the prediction can be reduced.
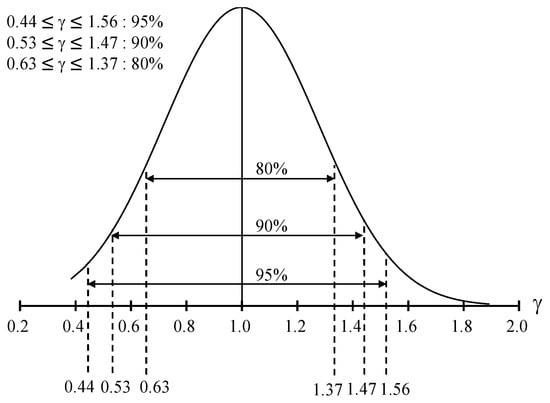
Figure 4.
The normal distribution curve of γ.
3.3. Test of MLA Trained with the Same Number of Data in Each f’c,meas Range (Case-2)
When all the training datasets were used, the data of the 30–60 MPa range accounted for 51% of the total and were considerably concentrated. The research was performed to determine whether having a large amount of training dataset in a specific compressive-strength range affected the accuracy of the MLA. To compare with Case-1, the compressive-strength range affected the MLA. The error rate of the MLA was investigated when the number of training datasets for each f′cmeas range was the same (Case-2). For this, 230 data points were randomly selected for each range of f′c,meas; a total of 1380 (=230 × 6) data were selected. Among them, 1080 (=180 × 6) data were used for training, and 300 (=50 × 6) data were used for validating accuracy. The verification results of Case-2 exhibit in Table 3 and Figure 5. The CV, RMSE, MAE, and MAPE of Case-2 were 0.34, 14.41 MPa, 11.42 MPa, and 26.85%, respectively, and the error indices were slightly increased compared with Case-1. Regarding the results for each f′c,meas range, the CV of Case-2 was larger than that of Case-1 for all the ranges; i.e., the error was larger. The other indices of different f′cmeas ranges were also larger compared with Case-1 in most cases. The γ-value of the 95% confidence interval was 0.35–1.80, and the error rate was approximately 72%. The γ-value of the 90% confidence interval was 0.41–1.59. The error rate was approximately 59%. The γ-value of the 80% confidence interval was 0.52–1.48, and the error rate was approximately 48%. Although the range of the concrete compressive strength data was wide, the number of data was relatively small; hence, it is assumed that the error rate of Case-2 was higher than that of Case-1.

Table 3.
Analysis accuracy of ML trained with 1080 data points.
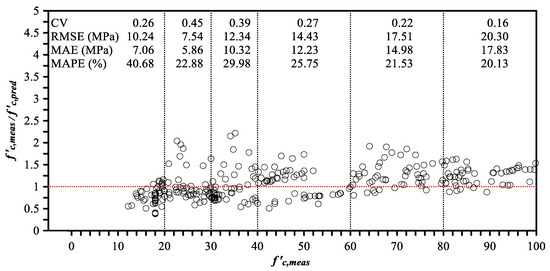
Figure 5.
Relationship between γ obtained from Case-2 and f′c,meas.
3.4. Test of MLA Trained with Each Range of f’c,meas (Case-3)
Because it is speculated that a wide range of f′c,meas databases affected the MLA, the MLA case for each f′c,meas range was generated (total of six subcases), and the operation and verification were conducted independently for each case (Case-3). Table 4 presents the evaluation indices obtained using the evaluation method proposed in Section 3.1, and Figure 6 presents the relationship between γ and f′c,meas in each subcase. The m of all the ranges was 0.99–1.04, and the σ appeared to be 0.08–0.14. The average values of CV, RMSE, MAE, and MAPE of subcases were found to be 0.11, 4.56 MPa, 3.73 MPa, and 8.42%, respectively, which were superior to those for Case-1. The maximum range of γ values included in the 90% confidence interval was 0.76–1.24 in Case-3-2 (20–30 MPa), and the minimum range was 0.87–1.13 in Case-3–6 (80–100 MPa). This suggests that if the MLA is learned after using a training dataset divided by strength ranges, the predicted values with a maximum error rate of 24% and a minimum error rate of 13% will be included in >90% of all the result values. Therefore, if the MLA is trained using a training dataset with specific f′c,meas ranges related to the desired result, the prediction accuracy and reliability can be enhanced.

Table 4.
Analysis accuracy of ML trained with data in each range.
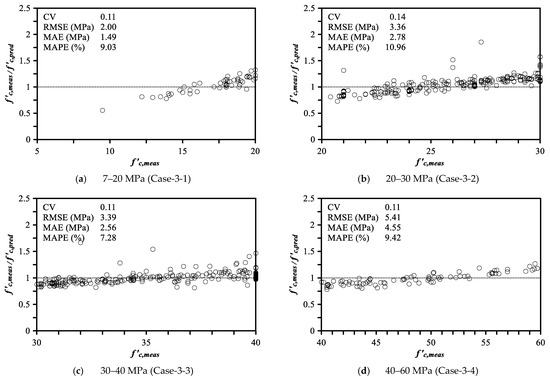
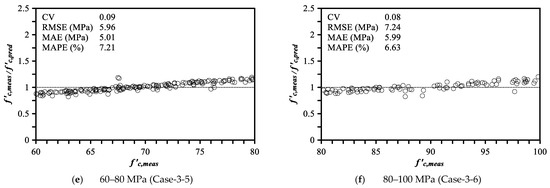
Figure 6.
Relationship between γ obtained from each subcase and f′c,meas.
4. Conclusions
The concrete compressive strength was predicted through an MLA based on a linear regression model constructed using the open-source library TensorFlow. The influence of f′c,meas range of dataset to the accuracy of MLA was analyzed. Of 4279 data points, 70% were used as training dataset, and 30% were utilized as testing data, and the MLA was subjected to learning with seven mixing materials as variables (water, cement, coarse aggregate, sand, fly ash, blast furnace slag, and aggregate size). The results of verifying the model through the verification data were as follows:
- When comparing Case-1 and Case-3, both the m-values of Case-1 and Case-3 were close to 1. However, there were differences in the CV, RMSE, MAE, and MAPE, which indicated the error between the measured and predicted values. For the range of 30–40 MPa in Case-1, the CV, RMSE, MAE, and MAPE of Case-1 were 0.23, 8.86 MPa, 7.58 MPa, and 20.96% respectively. In contrast, them of Case-3-2 (30–40 MPa) were 0.11, 3.39 MPa, 2.56 MPa, and 7.28%, respectively, and a similar trend was observed in all the strength ranges. These results indicated that the reliability and accuracy of the MLA increase when MLA is learned with a training dataset in a specific f′c meas range related to a desired result.
- The linear regression evaluation indices (RMSE, MAE, and MAPE) were large in Case-1 and Case-2, and the m-value of each f′c meas range exhibited a tendency to be far from 1. The CV, RMSE, MAE, and MAPE of Case-1 had maximum values of 0.23, 25 MPa, 22.45 MPa, and 51%, respectively, and those of Case-2 had maximum values of 0.45, 20.3 MPa, 17.83 MPa, and 40.68%, respectively. Related to the normal distribution, and the 90% confidence intervals of Case-1 and Case-2 were 0.53–1.47 and 0.41–1.59, respectively. The accuracy of Case-1 had better than that of Case-2. This means that the training dataset with a wide range did not affect the accuracy of MLA and the number of training dataset affected to;
- For Case-1, Case-2, and Case-3, the correlation graph of γ and f′c,meas tended to exhibit a linear increase regardless of the cases. The reason for this linear shape is that the linear regression technique is a method for finding a mean value; hence, the weight and bias of the linear regression equation are highly correlated with the mean value and predicted values of the testing dataset far from the mean were overestimated or underestimated.
Author Contributions
Conceptualization, J.-R.P. and S.K.; formal analysis, J.-K.K. and S.K.; funding acquisition, K.-H.Y.; investigation, S.K.; methodology, J.-R.P.; project administration, S.K.; supervision, S.K.; validation, S.K.; writing—original draft, H.-J.L. and S.K.; writing—review and editing, J.-K.K. and K.-H.Y. All authors have read and agreed to the published version of the manuscript.
Funding
This work was supported by the GRRC program of Gyeonggi province (GRRC KGU 2020-B01, Research on Intelligent Industrial Data Analytics).
Institutional Review Board Statement
Not applicable.
Informed Consent Statement
Not applicable.
Data Availability Statement
Not applicable.
Conflicts of Interest
The authors declare no conflict of interest.
References
- Ahmad, A.; Farooq, F.; Niewiadomski, P.; Ostrowski, K.; Akbar, A.; Aslam, F.; Alyousef, R. Predicting of Compressive Strength of Fly Ash Based Concrete Using Indivial and Ensemble Algorithm. Materials 2021, 14, 794. [Google Scholar] [CrossRef] [PubMed]
- Chopra, P.; Sharma, R.K.; Kumar, M. Prection of Compressive Strength of Concrete Using Artificial Neural Network and Genetic Programming. Adv. Mater. Sci. Eng. 2016, 2016, 7648467. [Google Scholar] [CrossRef]
- Feng, D.C.; Liu, Z.T.; Wang, X.D.; Chen, Y.; Chang, J.Q.; Wei, D.F.; Jiang, Z.M. Machine Learning-Based Compressive Strength Prediction for Concrete: An Adaptive Boosting Approach. Constr. Build. Mater. 2020, 230, 117000. [Google Scholar] [CrossRef]
- Nguyen, H.; Vu, T.; Vo, T.; Thai, H.T. Efficient Machine Learning Models for Prediction of Concrete Strengths. Constr. Build. Mater. 2021, 266, 120950. [Google Scholar] [CrossRef]
- DeRousseau, M.A.; Laftchiev, E.; Kasprzyk, J.R.; Rajagopalan, B.; Srubar, W.V., III. A Comparison of Machine Learning Methods for Predicting the Compressive Strength of Field-Placed Concrete. Constr. Build. Mater. 2019, 228, 116661. [Google Scholar] [CrossRef]
- Kandiri, A.; Golafshani, E.M.; Behnood, A. Estimation of the Compressive Strength of Concrete Containing Groud Granulated Blast Furnace Slag Using hybridized multi-objective ANN and Salp Swarm Algorithm. Constr. Build. Mater. 2020, 248, 118676. [Google Scholar] [CrossRef]
- Mohammed, A.; Rafiq, S.; Sihag, P.; Kurda, R.; Mahmood, W. Soft Computing Techniques: Systematic Multiscale Models to Predict the Compressive Strength of HVFA Concrete Based on Mix Proportions and Curing Times. J. Build. Eng. 2021, 33, 101851. [Google Scholar] [CrossRef]
- Golafshani, E.M.; Behnood, A.; Arashpour, M. Predicting the Compressive Strength of Normal and High-Performance Concrete Using ANN and ANFIS Hybridized with Grey Wolf Optimizer. Constr. Build. Mater. 2020, 232, 117266. [Google Scholar] [CrossRef]
- Ahmadi-Nedushan, B. An Optimized Instance Based-Learning Algorithm for Estimation of Compressive Strength of Concrete. Eng. Appl. Artif. Intell. 2012, 25, 1073–1081. [Google Scholar] [CrossRef]
- Behnood, A.; Behnood, V.; Gharehveran, M.M.; Alyamac, K.E. Prediction of the Compressive Strength of normal and High-Performance Concretes Using M5P Model Tree Algorithm. Constr. Build. Mater. 2017, 142, 199–207. [Google Scholar] [CrossRef]
- Mohammad, J.M.; Mohammad, A.H.A. Developing a Library of Shear Walls Database and the Neural Network Based Predictive Meta-Model. Appl. Sci. 2019, 9, 2562. [Google Scholar]
- Roshani, M.; Phan, G.T.T.; Ali, P.J.M.; Roshani, G.H.; Hanus, R.; Duong, T.; Corniani, E.; Nazemi, E.; Kalmoun, E.M. Evaluation of Flow Pattern Recognition and Void Fraction Measurement in Two Phase Flow Independent of Oil Pipeline’s Scale Layer Thickness. Alex. Eng. J. 2021, 60, 1955–1966. [Google Scholar] [CrossRef]
- Roshani, M.; Phan, G.; Faraj, R.H.; Phan, N.H.; Roshani, G.H.; Zazemi, B.; Corniani, E.; Nazemi, E. Proposing a Gamma Radiation Based Intelligent System for Simultaneous Analyzing and Detecting Type and Amount of Petroleum By-Products. Nucl. Eng. Technol. 2021, 53, 1277–1283. [Google Scholar] [CrossRef]
- Fuqua, D.; Razzaghi, T. A Cost-Sensitive Convolution neural network learning for Control Chart Pattern Recognition. Expert Syst. Appl. 2020, 150, 113275. [Google Scholar] [CrossRef]
- Roshani, M.; Phan, G.; Roshani, G.H.; Hanus, R.; Nazemi, B.; Corniani, E.; Nazemi, E. Combination of X-ray Tube and GMDH neural network as a Nondestructive and Potential Technique for Measuring Characteristics of Gas-Oil-Water Three Phase Flows. Measurement 2021, 168, 108427. [Google Scholar] [CrossRef]
- Anyaoha, U.; Zaji, A.; Liu, Z. Soft Computing in Estimating the Compressive Strength for High-Performance Concrete Via Concrete Composition Appraisal. Constr. Build. Mater. 2020, 257, 119472. [Google Scholar] [CrossRef]
- Al-Shamiri, A.K.; Kim, J.H.; Yuan, T.F.; Yoon, Y.S. Modeling the Compressive Strength of High-Strength Concrete: An Extreme Learning Approach. Constr. Build. Mater. 2019, 208, 204–219. [Google Scholar] [CrossRef]
- Ganguly, B.; Chaudhuri, S.; Biswas, S.; Dey, D.; Munshi, S.; Chatterjee, B.; Dalai, S.; Chakravorti, S. Wavelet Kernel-Based Convolutional Neurla Network for Localization of Partial Discharge Sources within a Power Apparatus. IEEE Trans. Ind. Inform. 2021, 17, 1831–1841. [Google Scholar]
- Yang, K.H.; Tae, S.H.; Choi, D.U. Mixture Proportioning Approach for Low-CO2 Concrete Using Supplementary Cementitious Materials. ACI Mater. J. 2016, 113, 533–542. [Google Scholar]
Publisher’s Note: MDPI stays neutral with regard to jurisdictional claims in published maps and institutional affiliations. |
© 2021 by the authors. Licensee MDPI, Basel, Switzerland. This article is an open access article distributed under the terms and conditions of the Creative Commons Attribution (CC BY) license (https://creativecommons.org/licenses/by/4.0/).