Article

Development of Highly Sensitive Temperature Microsensors for Localized Measurements

1
Department of Industrial Electronics, Microelectromechanical Systems Research Unit (CMEMS-UMinho), Campus de Azurém, University of Minho, 4800-058 Guimarães, Portugal
2
Integrated Micro and Nanotechnologies, INL International Iberian Nanotechnology Laboratory, 4715-330 Braga, Portugal
*
Authors to whom correspondence should be addressed.
Appl. Sci. 2021, 11(9), 3864; https://doi.org/10.3390/app11093864
Submission received: 22 February 2021 / Revised: 26 March 2021 / Accepted: 22 April 2021 / Published: 24 April 2021
(This article belongs to the Special Issue Novel Technology and Applications of Micro/Nano Devices and System)

Abstract

:

Featured Application

The developed temperature microsensors have high potential to be integrated in or-gans-on-a-chip platforms. Their small size and good resolution will allow precise and re-al-time monitoring of the transient and long-term response about the cellular microenviron-ment inside the organ-on-a-chip, which will add essential information for the screening of new drugs.

Abstract

This paper presents the design, fabrication and characterization of temperature microsensors based on Resistance Temperature Detectors (RTDs) with a meander-shaped geometry. Numerical simulations were performed for studying the sensitivity of the RTDs according to their windings numbers as well as for optimizing their layout. These RTDs were fabricated using well-established microfabrication and photolithographic techniques. The fabricated sensors feature high sensitivity (0.3542 mV/°C), linearity and reproducibility in a temperature range of 35 to 45 °C. Additionally, each sensor has a small size with a strong potential for their integration in microfluidic devices, as organ-on-a-chip, allowing the possibility for in-situ monitoring the physiochemical properties of the cellular microenvironment.

1. Introduction

The recent advances in tissue-culture techniques, in biomaterials and in lab-on-a-chip (LOC) technologies have promoted the development of organs-on-a-chip (OoC). They emerged as promising platforms, mimicking the structures and functions of living organs, allowing the possibility of better preclinical testing [1,2,3,4]. Although a wide variety of human OoC models have been created [4,5,6,7,8], there is a lack of miniaturized multisensory systems integrated in the OoC [9]. These integrated systems are essential to real-time monitoring of the physicochemical properties and keep a well-controlled microenvironment to provide optimal conditions for cultured cells and/or organ models, mimicking the human body. Furthermore, they allow evaluation of the toxicological effect of drugs and nanomaterials developed for biomedical applications, by delivering those drugs to the organ model, as well as to assess the dynamic responses of the OoC to pharmaceutical compounds for long-term studies, providing an accurate prediction of human organs reactions [7]. Important parameters to monitor in OoC are O2, CO2, pH, temperature, among others, which are usually regulated by incubators. To obtain the optimal growth and maximum productivity of the cell culture, these parameters should be kept constant to avoid stress in the cells [10]. Especially, the temperature in the cell culture could be affected by the difference between in the set point defined in the incubator and the in situ temperature in the cell culture. Furthermore, the frequency and duration of the incubator’s door opening could induce temperature variations which can affect the cell culture. To overcome these limitations, temperature measurements within OoC are essential for ensuring that the most biological and chemical processes occur as ideally as possible [11]. This measurement must be effective and accurate, however, when the samples are of micro- or even of nano- order, as in OoC, this task becomes quite difficult [12]. Several approaches for cell culture temperature sensing have been explored in previous works such as commercial T-type thermocouples [13], NTC (negative temperature coefficient) thermistors [14], commercial PT-100 RTDs (resistance temperature detectors) [15], fluorescent polymeric thermometers [16] and optoacoustic methods [17]. However, conventional sensing devices for controlling the cellular microenvironment are not very compact for OoC applications and use expensive and bulky instrumentation equipment [11,18]. Furthermore, optical temperature sensing has poor resolution (~1 °C) and its integration is complex [11]. The recent innovations in microtechnologies allow the development of miniaturized sensors and actuators with potential to be integrated within OoC. The small size of temperature sensors based on RTDs as well as their easy integration make them excellent candidates for applications in microfluidic-based devices, such as OoC. RTDs, as pointed out by their name, explore the electrical resistance variation, caused by temperature change. Furthermore, this sensor type provides a highly linear and sensitive response, covering large temperature ranges between −200 and 850 °C [19].
This work presents the development of temperature microsensors based on RTDs, which are designed to be integrated in an advanced OoC, allowing real-time and in-situ monitoring with a resolution of 0.1 °C in the range of physiological (35 °C) to hyperthermia (45 °C) temperatures [20]. Numerical simulations were performed to optimize the layout that better fits in the required application and to evaluate the sensor response according to different RTD dimensions. The results show that the platinum-based microsensor with a meander-shaped geometry (24 windings) offered the best sensitivity to temperature changes. Platinum is the best material for RTD, when compared with gold, copper, silver and aluminum, due to its highly linear response of its electrical resistance according to the temperature changes, high chemical resistance, high mechanical hardness, high temperature stability with a high melting point (1771.85 °C) and highly biocompatible [21,22]. Using clean room microfabrication technologies, several sensors were fabricated, with different numbers of windings in a meander-shaped geometry, in order to assess the optimal number of windings that enabled the best performance of the sensor. Experimental results were compared with those obtained from numerical simulations. In addition, the electronic system for the sensor supply and data acquisition was developed. The temperature microsensors were designed to be integrated in a circular culture chamber of the OoC with a diameter of 15 mm, as showed in Figure 1. In doing so, the precise and local temperature of the organ models can be assessed. This information is of utmost importance in nanomedicine trials in OoC, especially when thermal stimuli-responsive controlled drug delivery nanocarriers are used to respond to temperature triggers, such as by hyperthermia.

2. Materials and Methods

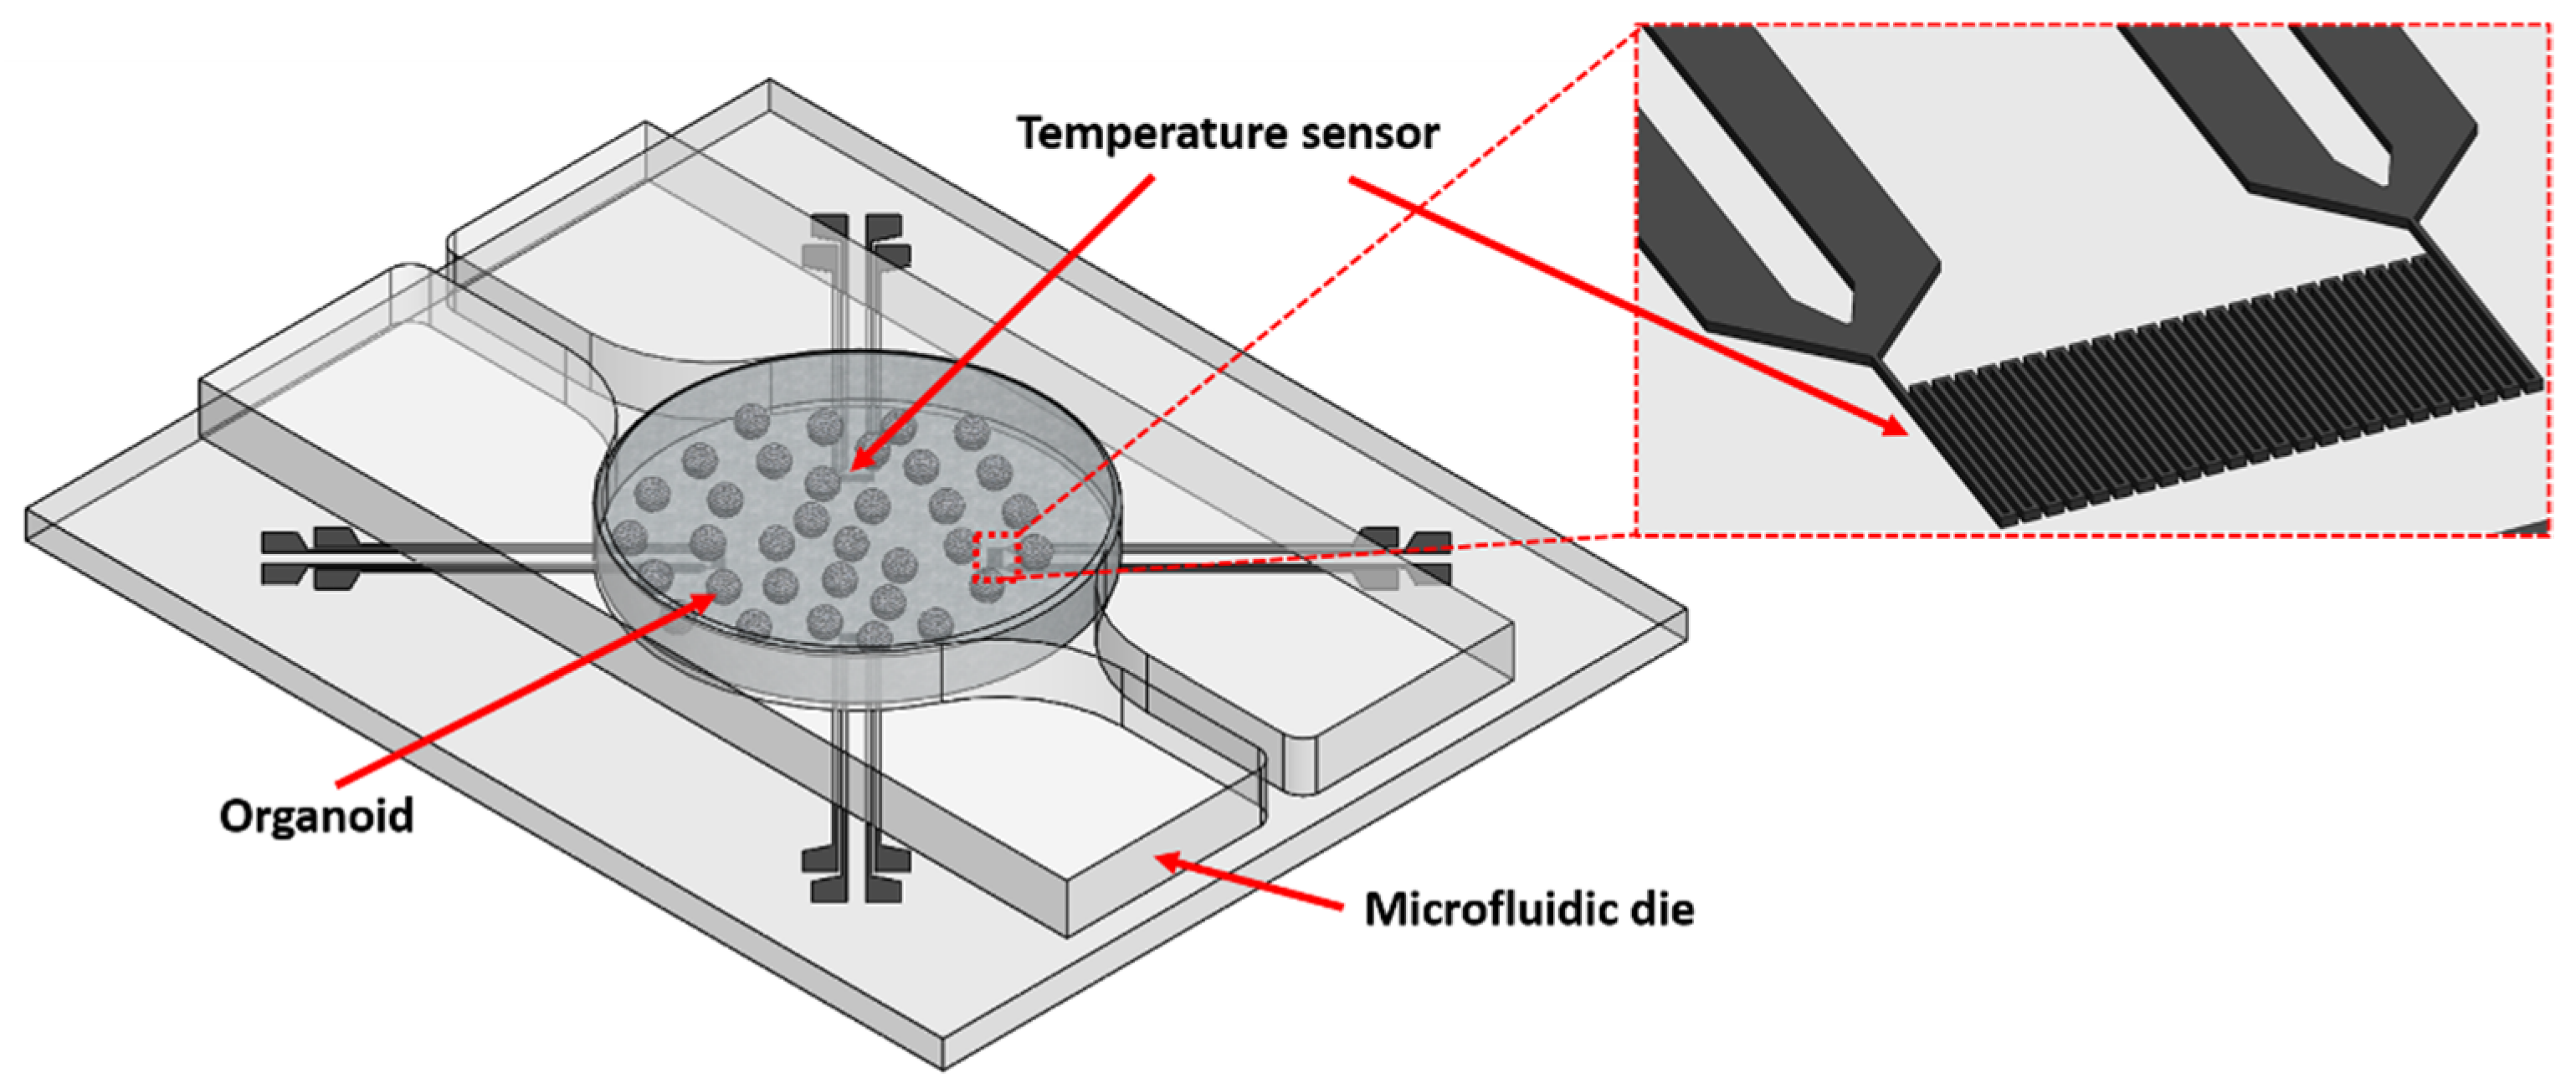
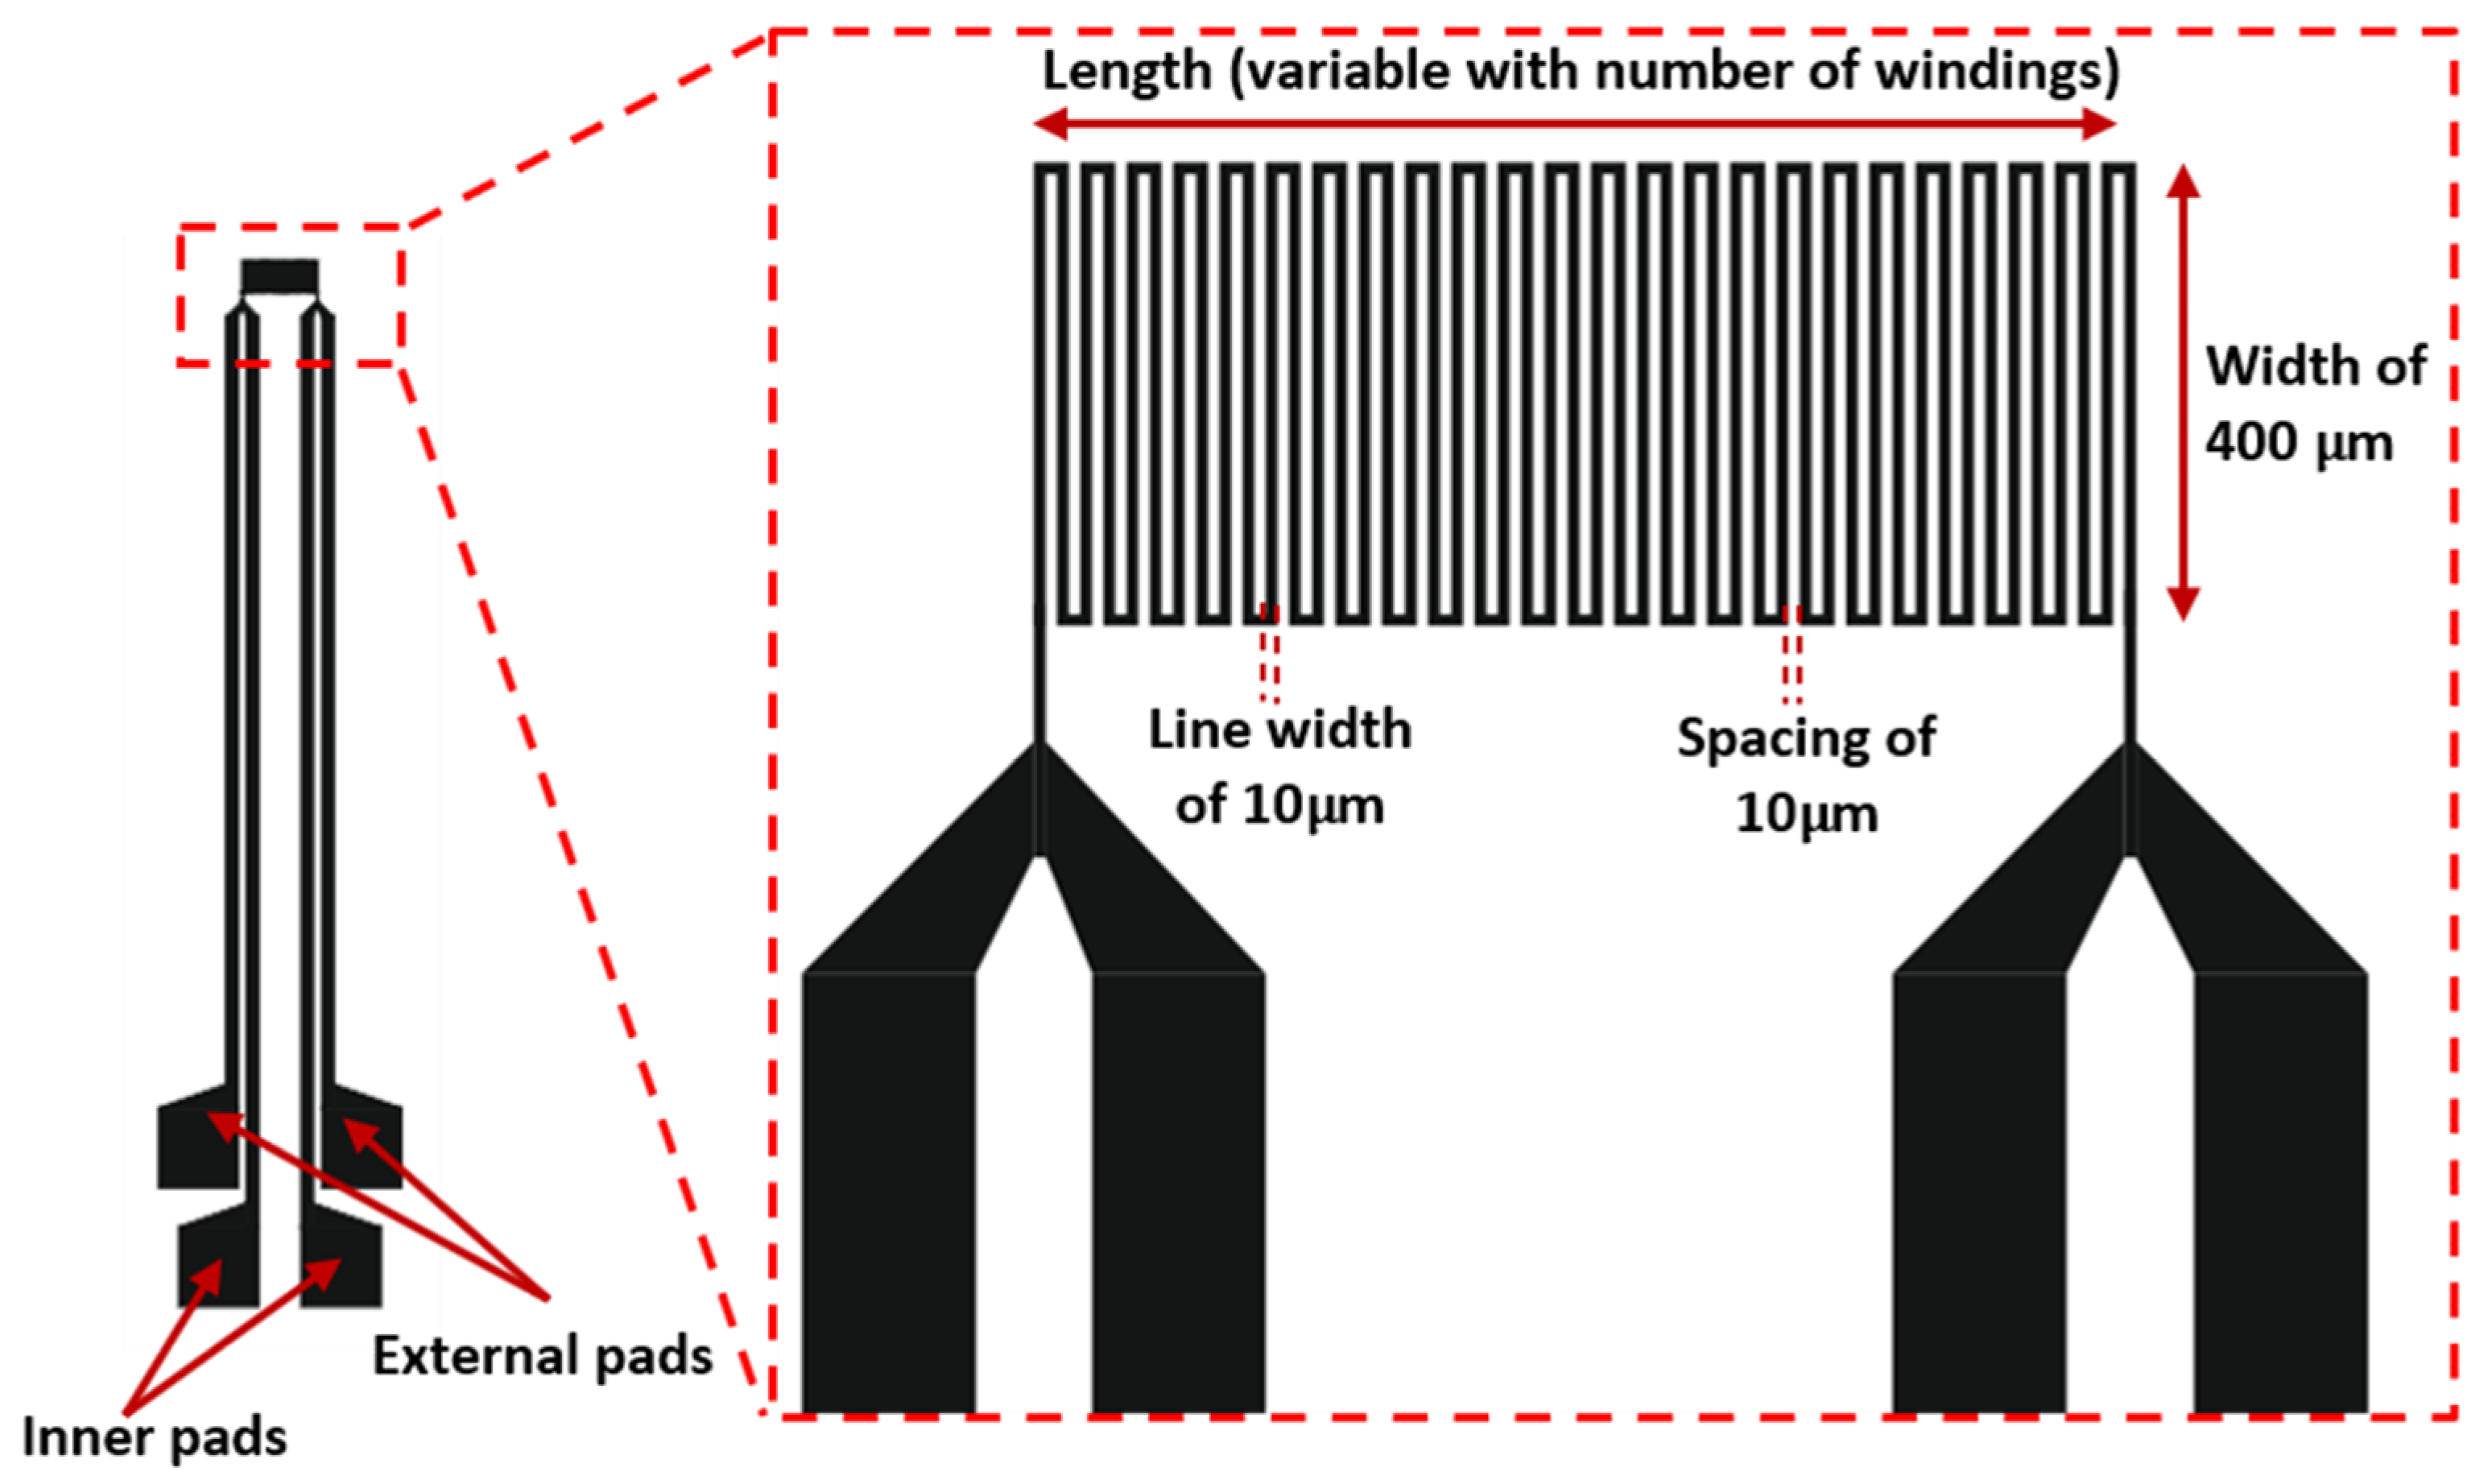
2.1. Design and Sensing Principle of the Temperature Microsensor

The temperature microsensor is a RTD with a meander shape. Its sensing principle is based on a metal resistor with a positive temperature coefficient (PTC) in which the electrical resistance increases with the increase of the temperature [23,24].
The geometry of the RTD studied consist of meander-shaped windings (5–24) of a 200 nm platinum thin film with a line width and spacing of 10 µm. The width was fixed to 400 µm and the length is variable as a function of the windings number. Table 1 shows the dimensions of the several temperature microsensors studied and Figure 2 schematically depicts their meander structure. These microsensors were designed in a four-wire configuration, in which the excitation is driven through the external pads and the electrical potential is measured in the inner pads. This configuration allows reading the electrical potential with high accuracy without interference from the lead wires used for the sensor excitation [25].

2.2. Numerical Simulations

In order to study the performance of the several temperature microsensors with different number of windings (5, 8, 12, 16, 20, 24), numerical simulations using the finite elements method (FEM) in COMSOL Multiphysics 5.3 were performed. The model consists of a platinum-based microsensor with a meander-shaped geometry in a silica glass substrate. The numerical simulations started with the study of the self-heating using several excitation currents. This effect, which depends on the current value that pass through the microsensor, introduces drift errors in the measurement and reduces the system accuracy. For this study, a fixed ambient temperature was set to the model and the electric potential and the self-heating generated by the sensor, when excited by an electric current, was outputted. To achieve this, the physic models “Heat Transfer in Solids” and the “Electric Currents, Shell” were used alongside the multiphysics module “Electromagnetic Heating’’ to address the joule heating effect, responsible for the sensors self-heating. The heat transfer in solids is governed by the main Equations (1) and (2):
ρ C p T t + ρ C p u ·   · q = Q
q = k T
where   ρ (SI unit: kg/m3) is the solid density, Cp (SI unit: J/(kg·K)) is the solid heat capacity at constant pressure, k (SI unit: W/(m·K)) is the solid thermal conductivity, u (SI unit: m/s) represents the velocity field, T (SI unit: K) is the absolute temperature, q is the heat flux by conduction (SI unit: W/m2) and Q (SI unit: W/m3) is the heat source (or sink). A fixed temperature of interest was attributed to the bottom of the substrate and a resistive thin layer with 200 nm of thickness was assigned to the platinum geometry domain. For the electric currents interface, the main governing Equations (3)–(5) are:
· J = Q j  
J = σ E + J e
E = V
where σ is the electrical conductivity (SI unit: S/m), and Je is an externally generated current density (SI unit: A/m2). E is the electric field (SI unit: V/m) and Q is the electric charge (SI unit: C). This physics interface was only applied at the platinum domain since the electric conduction at the substrate was neglectable, and for simplification purposes was not considered. The thickness of the shell was defined at 200 nm. To model the resistivity variation of the platinum thin film with the temperature, the electric conductivity is governed by the following Equation (6):
σ = 1 ρ 0 ( 1 + α ( T T 0 ) )
where ρ 0 is the resistivity (SI unit: Ω⋅m) at the reference temperature T0 (SI unit: K), and α is the temperature coefficient of resistance (SI unit: 1/K), which describes how the resistivity varies with temperature. A resistivity ( ρ 0 ) of 1.2447 × 10⁻⁷ Ω⋅m was assigned to the platinum for a reference temperature (T0) of 20 °C, as measured by experimental results, and a temperature coefficient of resistance (α) of 0.00385 was chosen, because of its worldwide adoption and availability in both platinum wire-wound and thin films [26]. An excitation current and a ground condition were defined at the external pads. The simulation uses a 3D mesh composed mostly of tetrahedral and triangular elements. The elements size was defined as extremely fine through a physics-controlled mesh. A stationary study was used to compute the numerical simulation. The direct solver MUMPS was used for the electric currents and the iterative solver GMRES (Multigrid) was used for the heat transfer. For the convergence criteria, the COMSOL predefined relative tolerance of 0.001 was adopted. To study the sensor self-heating, only the geometry with 24 windings was considered, as this effect is more evident due to its higher resistance in comparison with others. A parametric study for several excitation currents ranging from 50 µA to 1 mA was selected for a fixed temperature of 35 °C, and the maximum output temperature from the solved model was compared to the initial input temperature. Figure 3 shows the expected self-heating in temperature for a microsensor of 24 windings as a function of excitation currents. Figure S1 in the Supplementary Information shows the self-heating temperature distribution and electric potential of the simulated 24 windings sensor, with and excitation electric current of 100 µA and an ambient temperature of 45 °C. An exponential increase of the self-heating is showed until 1 mA and thus, small currents (~100 µA) are preferred to minimize the joule heating of the sensor. Therefore, to study the sensors’ sensitivity, a parametric study with the temperature ranging from 35 °C to 45 °C was selected, for a fixed excitation current of 100 µA performing a self-heating of 0.008 °C. Figure S2 in the Supplementary Information presents the sensors electric potential generated for a temperature ranging from 35 °C to 45 °C and respective sensitivity. The sensors show a high linearity and an increase of the sensitivity with the increase of windings number (Figure 4). The microsensor with 24 windings present the best sensitivity, however it has larger dimensions (400 × 950 µm). Despite this, its size is still appropriate to be integrated into the OoC. More than 24 windings will perform better sensitivity, but the bigger size will hamper the integration of the microsensors into the OoC. Additionally, the reduction of the individual width, spacing and thickness will also increase the sensitivity, but the first two, will increase the complexity of the fabrication process and the last one will compromise the electric current that can pass through the RTD and self-heating.

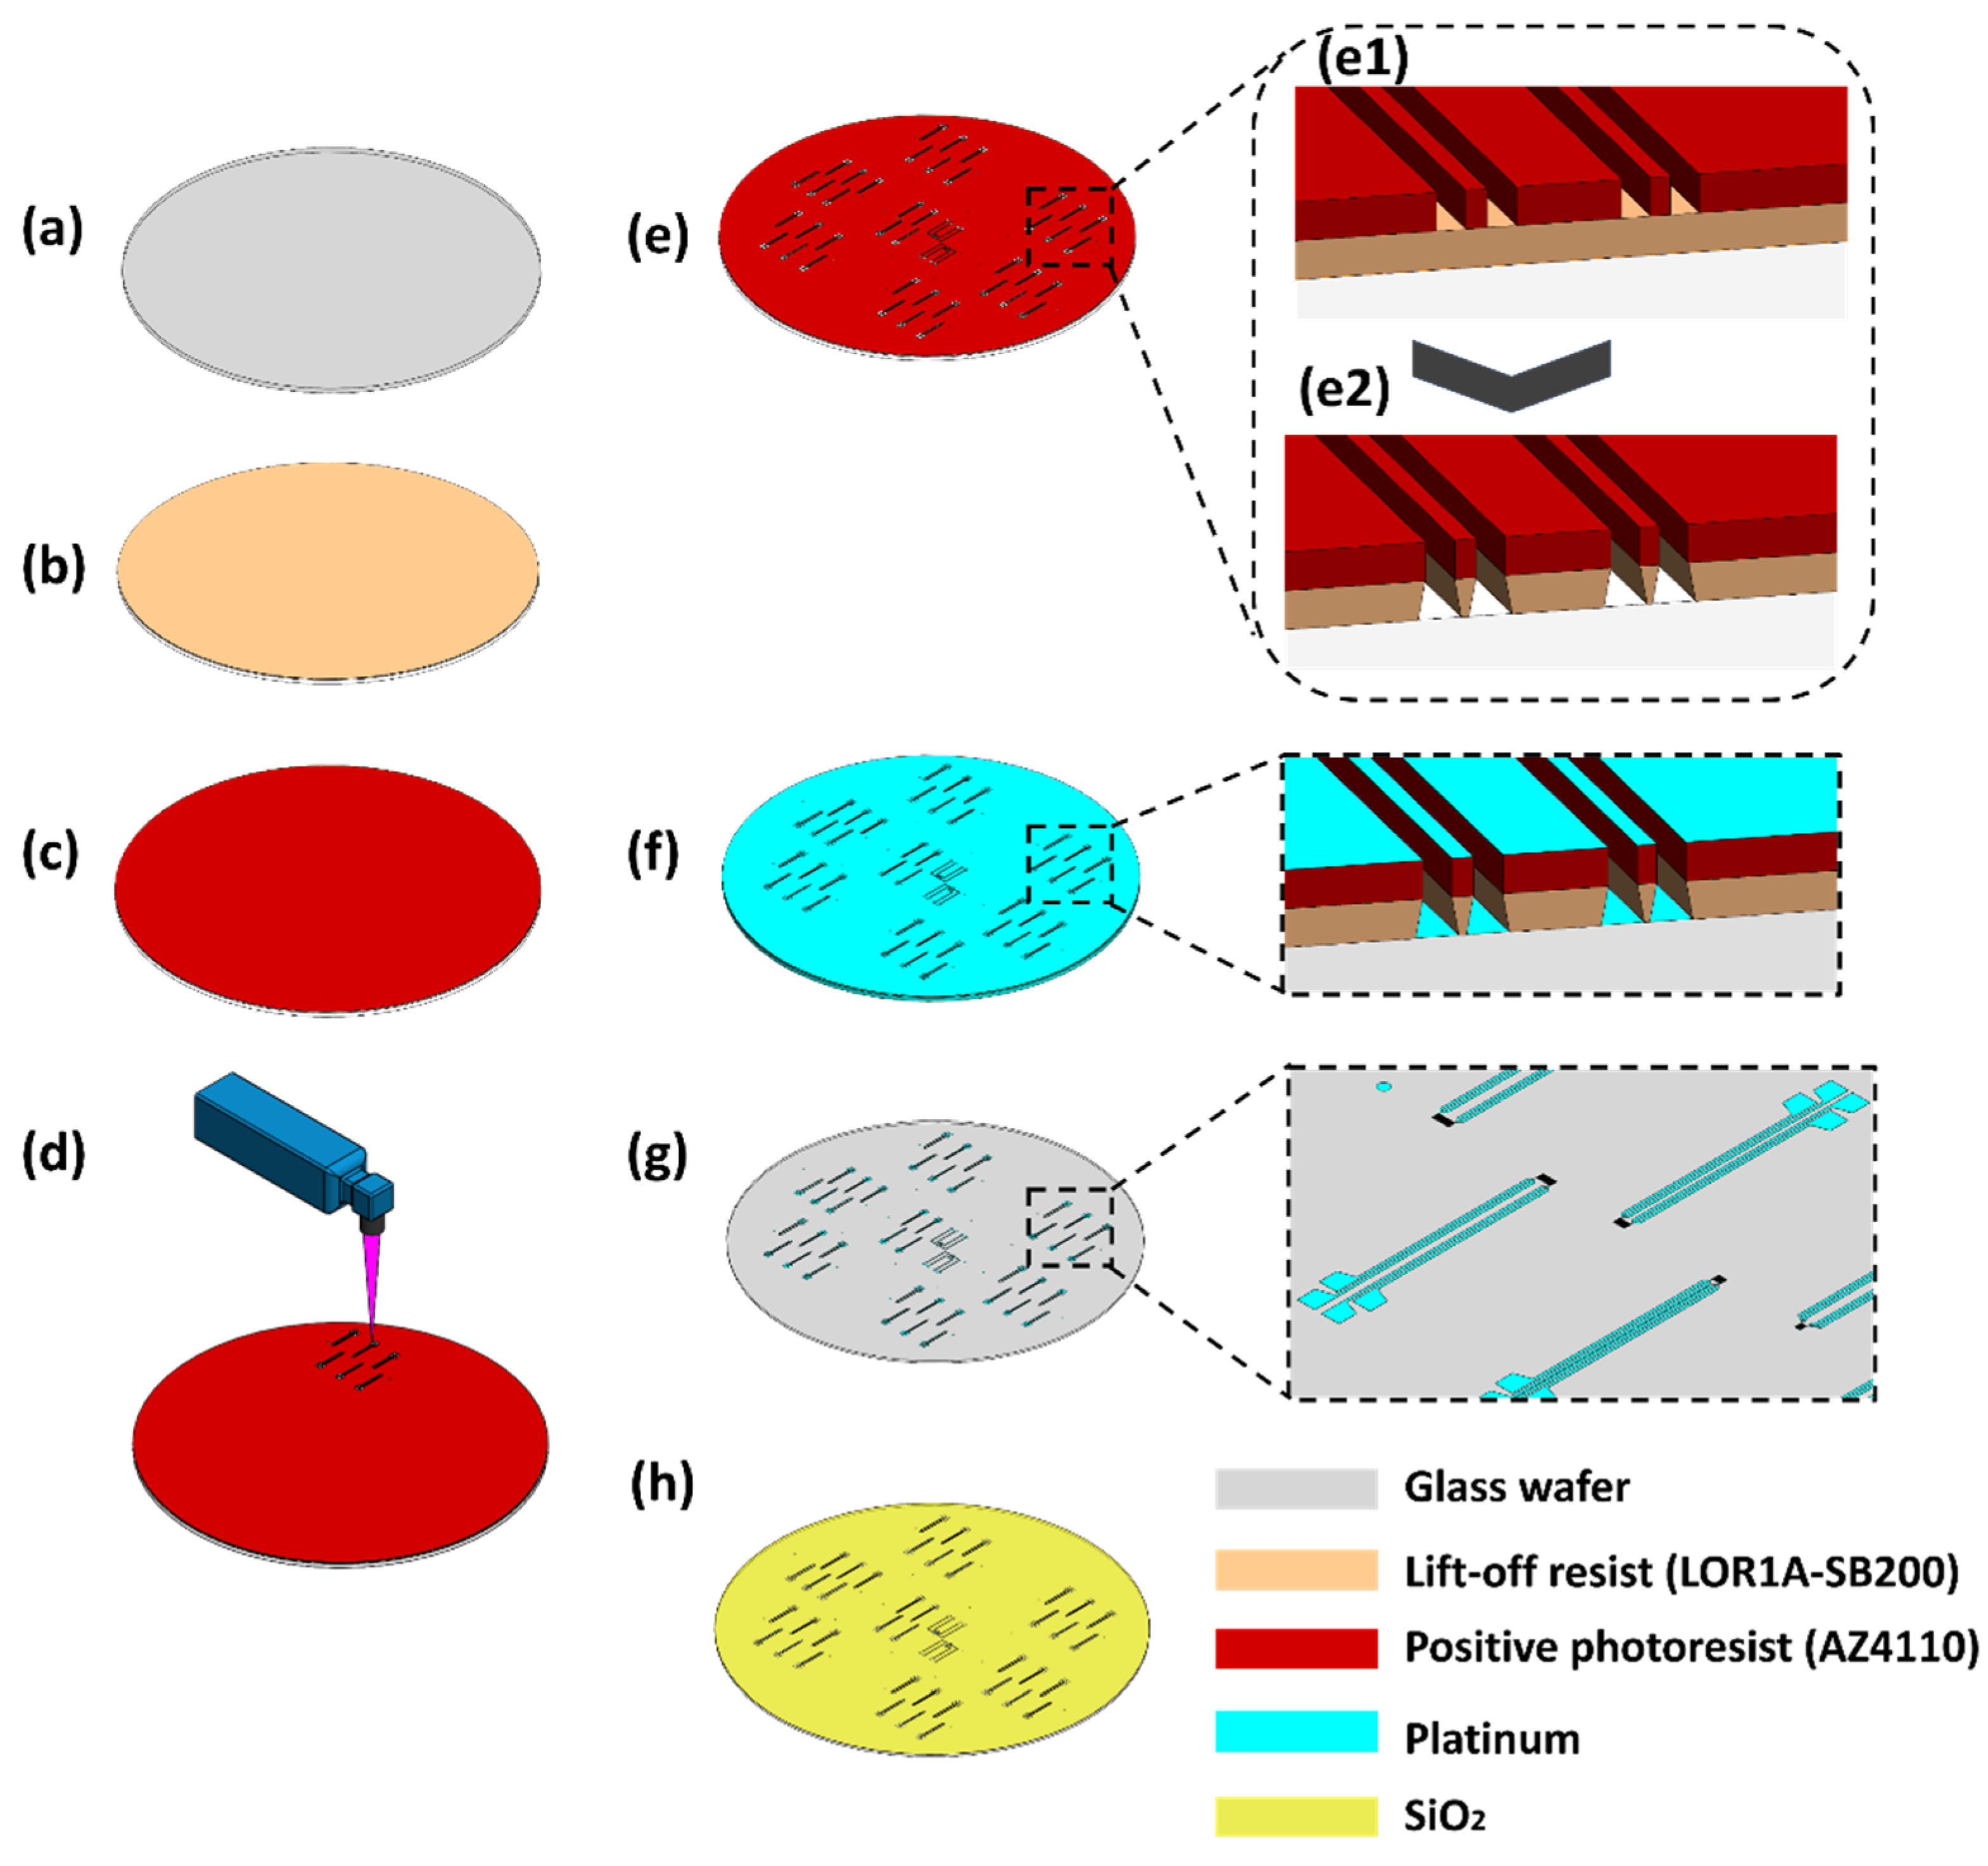
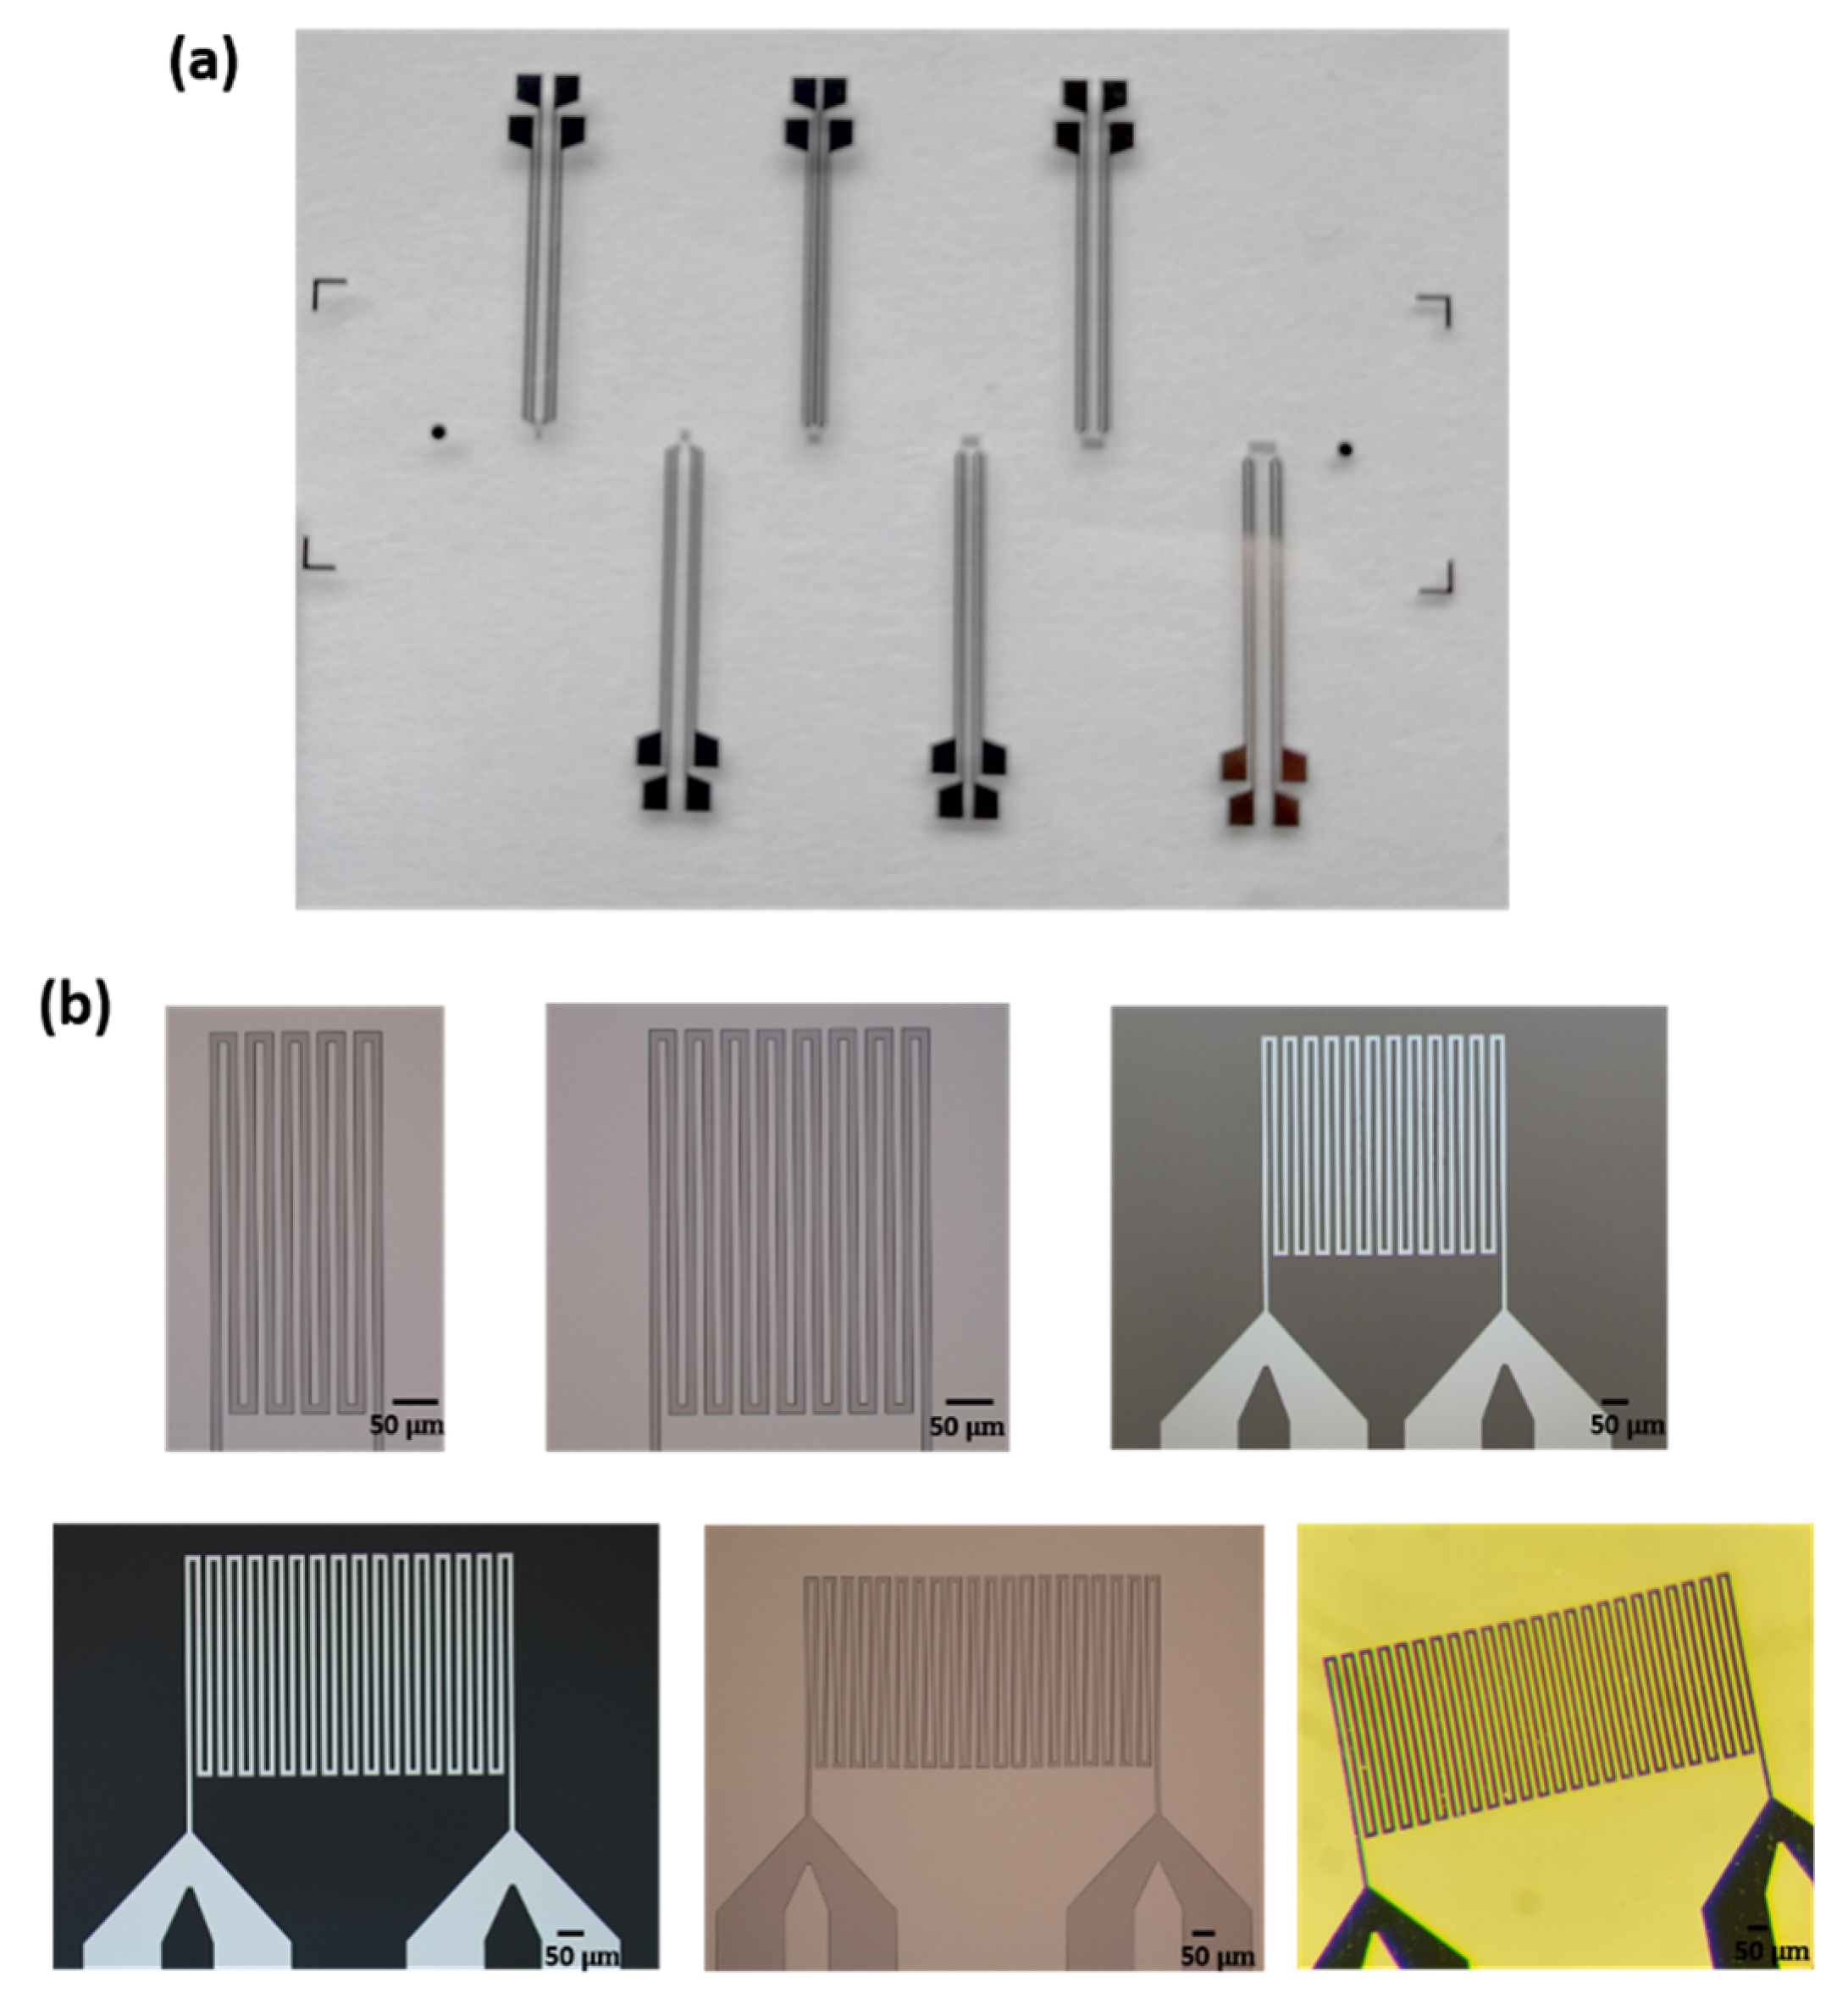
2.3. Fabrication Process

Considering the results obtained from the numerical simulations, the temperature microsensors were fabricated with the dimensions described in Table 1 and the simulated and experimental performances were compared. The fabrication process of these microsensors is based on physical vapor deposition (PVD) technologies for thin metallic films, and their standardization is carried out by photolithography techniques and lift-off process (Figure 5). The fabrication process started with the cleaning of a glass wafer using the PVA Tepla GIGAbatch 360M equipment comprising a microwave plasma, created from a mixture of O2 and CF4, operating at 2.45 GHz. Then, a double layer lift-off process was performed using standard photolithography and wet etching, using MicroChemicals AZ-family photoresist, developer, and solvents. For that purpose, lift-off resist (LOR1A-SB200) and positive photoresist AZ4110 are sequentially deposited in the substrate (Figure 5b,c, respectively) by spin coating and cured. A 405 nm high-resolution laser is used to expose the photoresist for substrate patterning (Figure 5d) by a direct writer laser process (DWL2000, Heidelberg Instruments, Heidelberg, Germany) and a development step using AZ400K solvent is performed (Figure 5e). After this stage, PVD was used for performing two sputtering processes. For this purpose, a Kenosistec ultra-high vacuum magnetron sputtering system consisting in a confocal geometry, was employed to deposit an adhesion layer of tantalum with a thickness of 5 nm and a layer of platinum with a thickness of 200 nm (Figure 5f). Once the above steps have been successfully carried out, the lift-off resist is removed using a 60 °C pre-heated solution of mr-REM500 (microresist technology GmbH, Berlin, Germany) in an ultrasonic bath to improve the etching rate (Figure 5g). Finally, photoresist residues in the wafer with the patterned sensors are removed by a high temperature plasma ashing process. An electrical insulator with high thermal conductivity is further deposited on top of the temperature microsensors for electrically isolation of the sensors from the fluidic medium (Figure 5h), increased chemical and mechanical resistance and to provide a rapid response to changes in temperature. For achieving this electrical insulation layer, a conformal layer of Si02, is deposited by chemical vapor deposition or atomic layer deposition, respectively. Then, a high-resolution mask aligner (MA6BA6 Suss Microtec, Garching, Germany) is used to transfer a mask to the wafer. For that, photoresist AZ4110 is spin-coated on the wafer, which is then exposed at a wavelength of 365 nm and developed using AZ400K solvent. A dry etching of the SiO2 using a reactive ion etching advanced plasma system (APTS SPTS Technologies, Newport, U.K.) or a wet etching process using aluminum etchant 16:1:2 W/AES (Fujifilm, Electronic Materials, Tokyo, Japan) is further performed in order to remove the deposited material merely in the regions where electrical contacts are made. At the end, a plasma ashing step is performed for removing the remaining photoresist. In Figure 6 the fabricated temperature microsensors is shown.

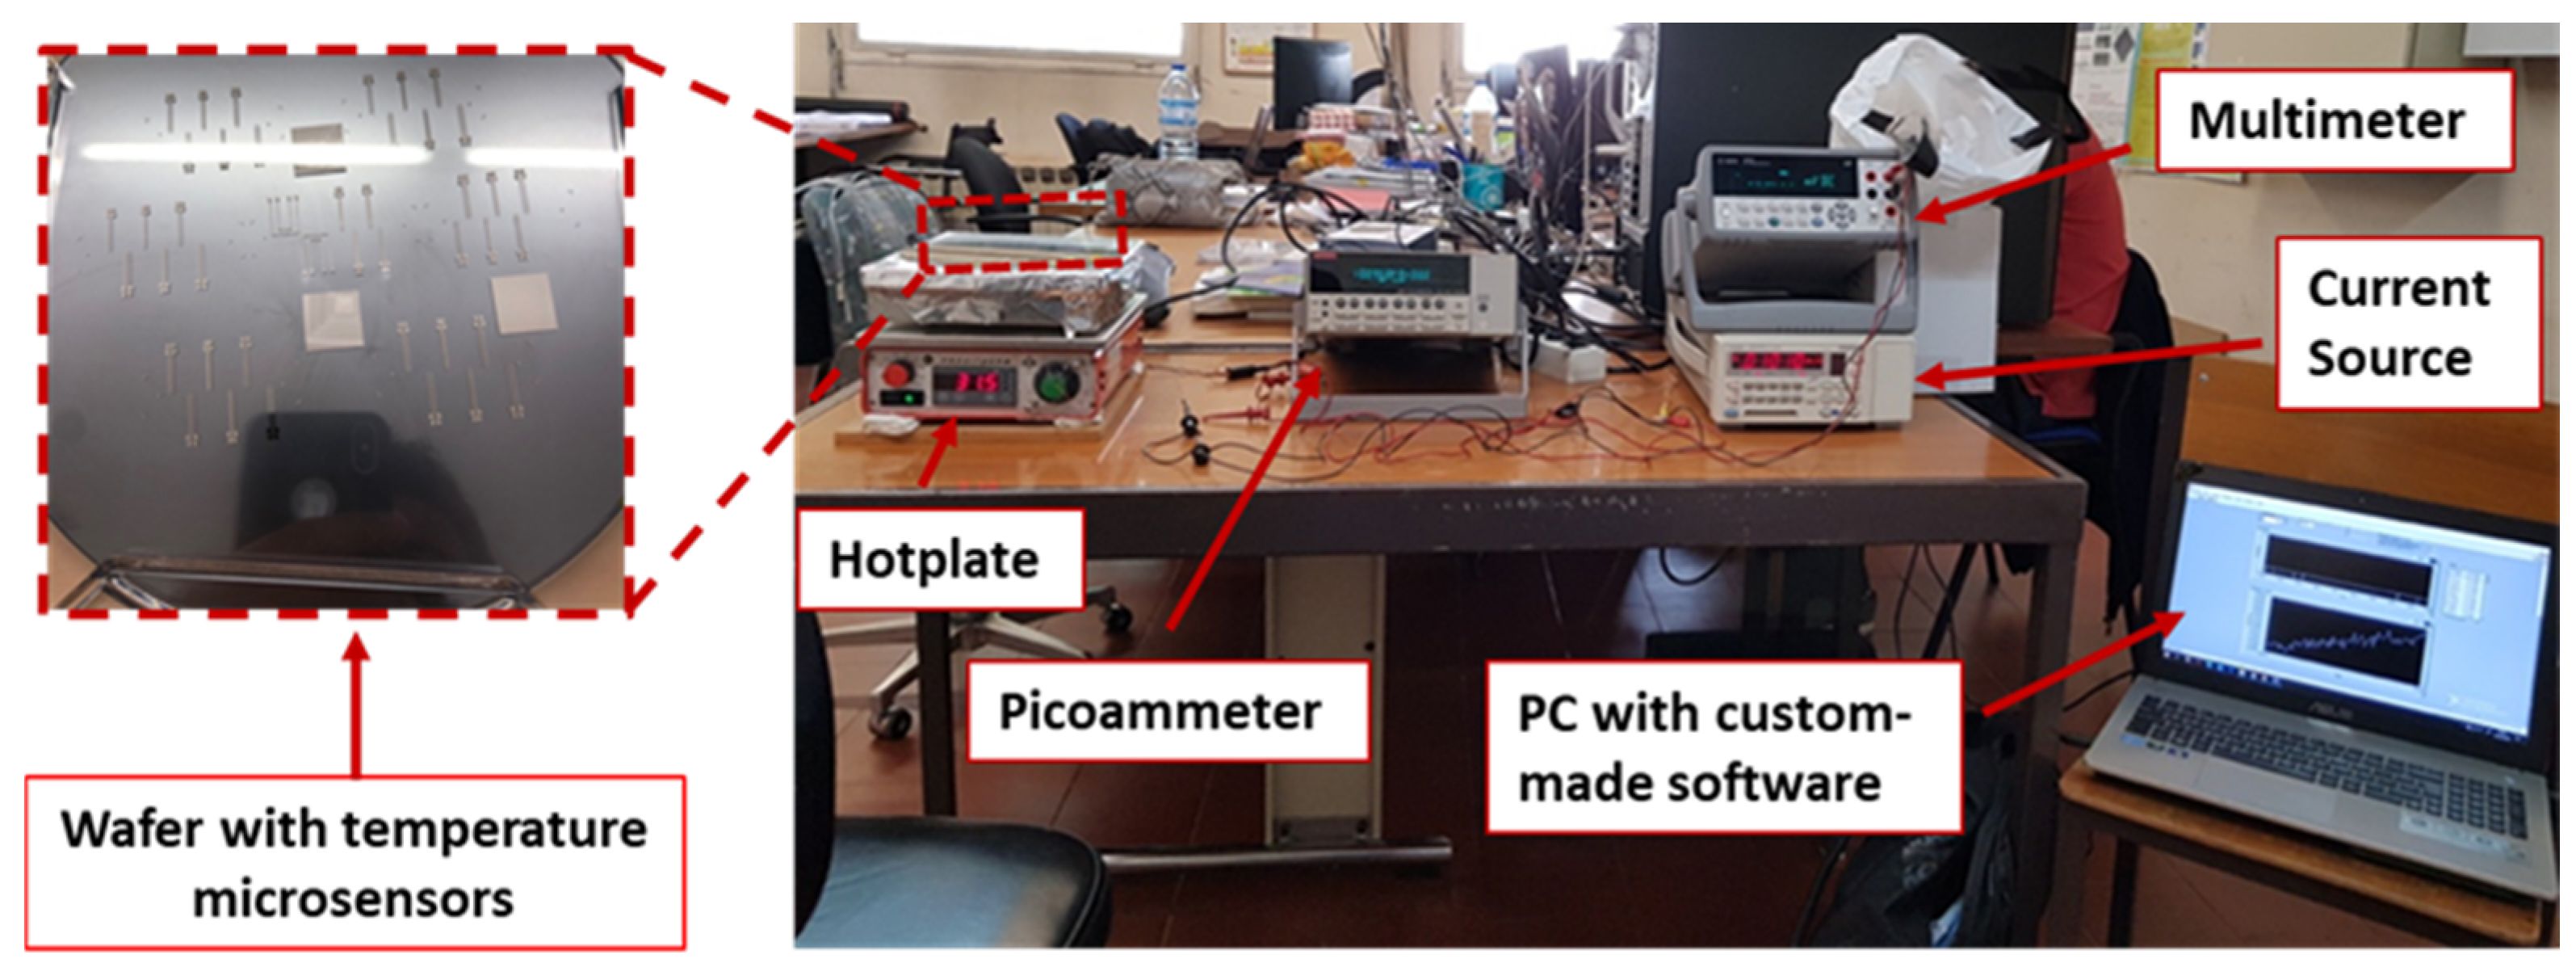
2.4. Eletrical Characterization Setup

After successful fabrication, temperature measurements with the fabricated sensors were performed. The apparatus used comprised a programable current DC source (Yokogawa 7651) for supplying the sensors (excitation) when characterizing their single performance, a hotplate (Präzitherm type PZ28-2, 1100 W) and a peltier module as heating sources to control the temperature in the sensors, a digital multimeter (Agilent 34410A 61/2) connected to a computer, a custom-made software to continuously read the electric signals from the sensors and a picoammeter (Keithley 6487) for reading, with precision, the current flowing by the sensor (Figure 7).

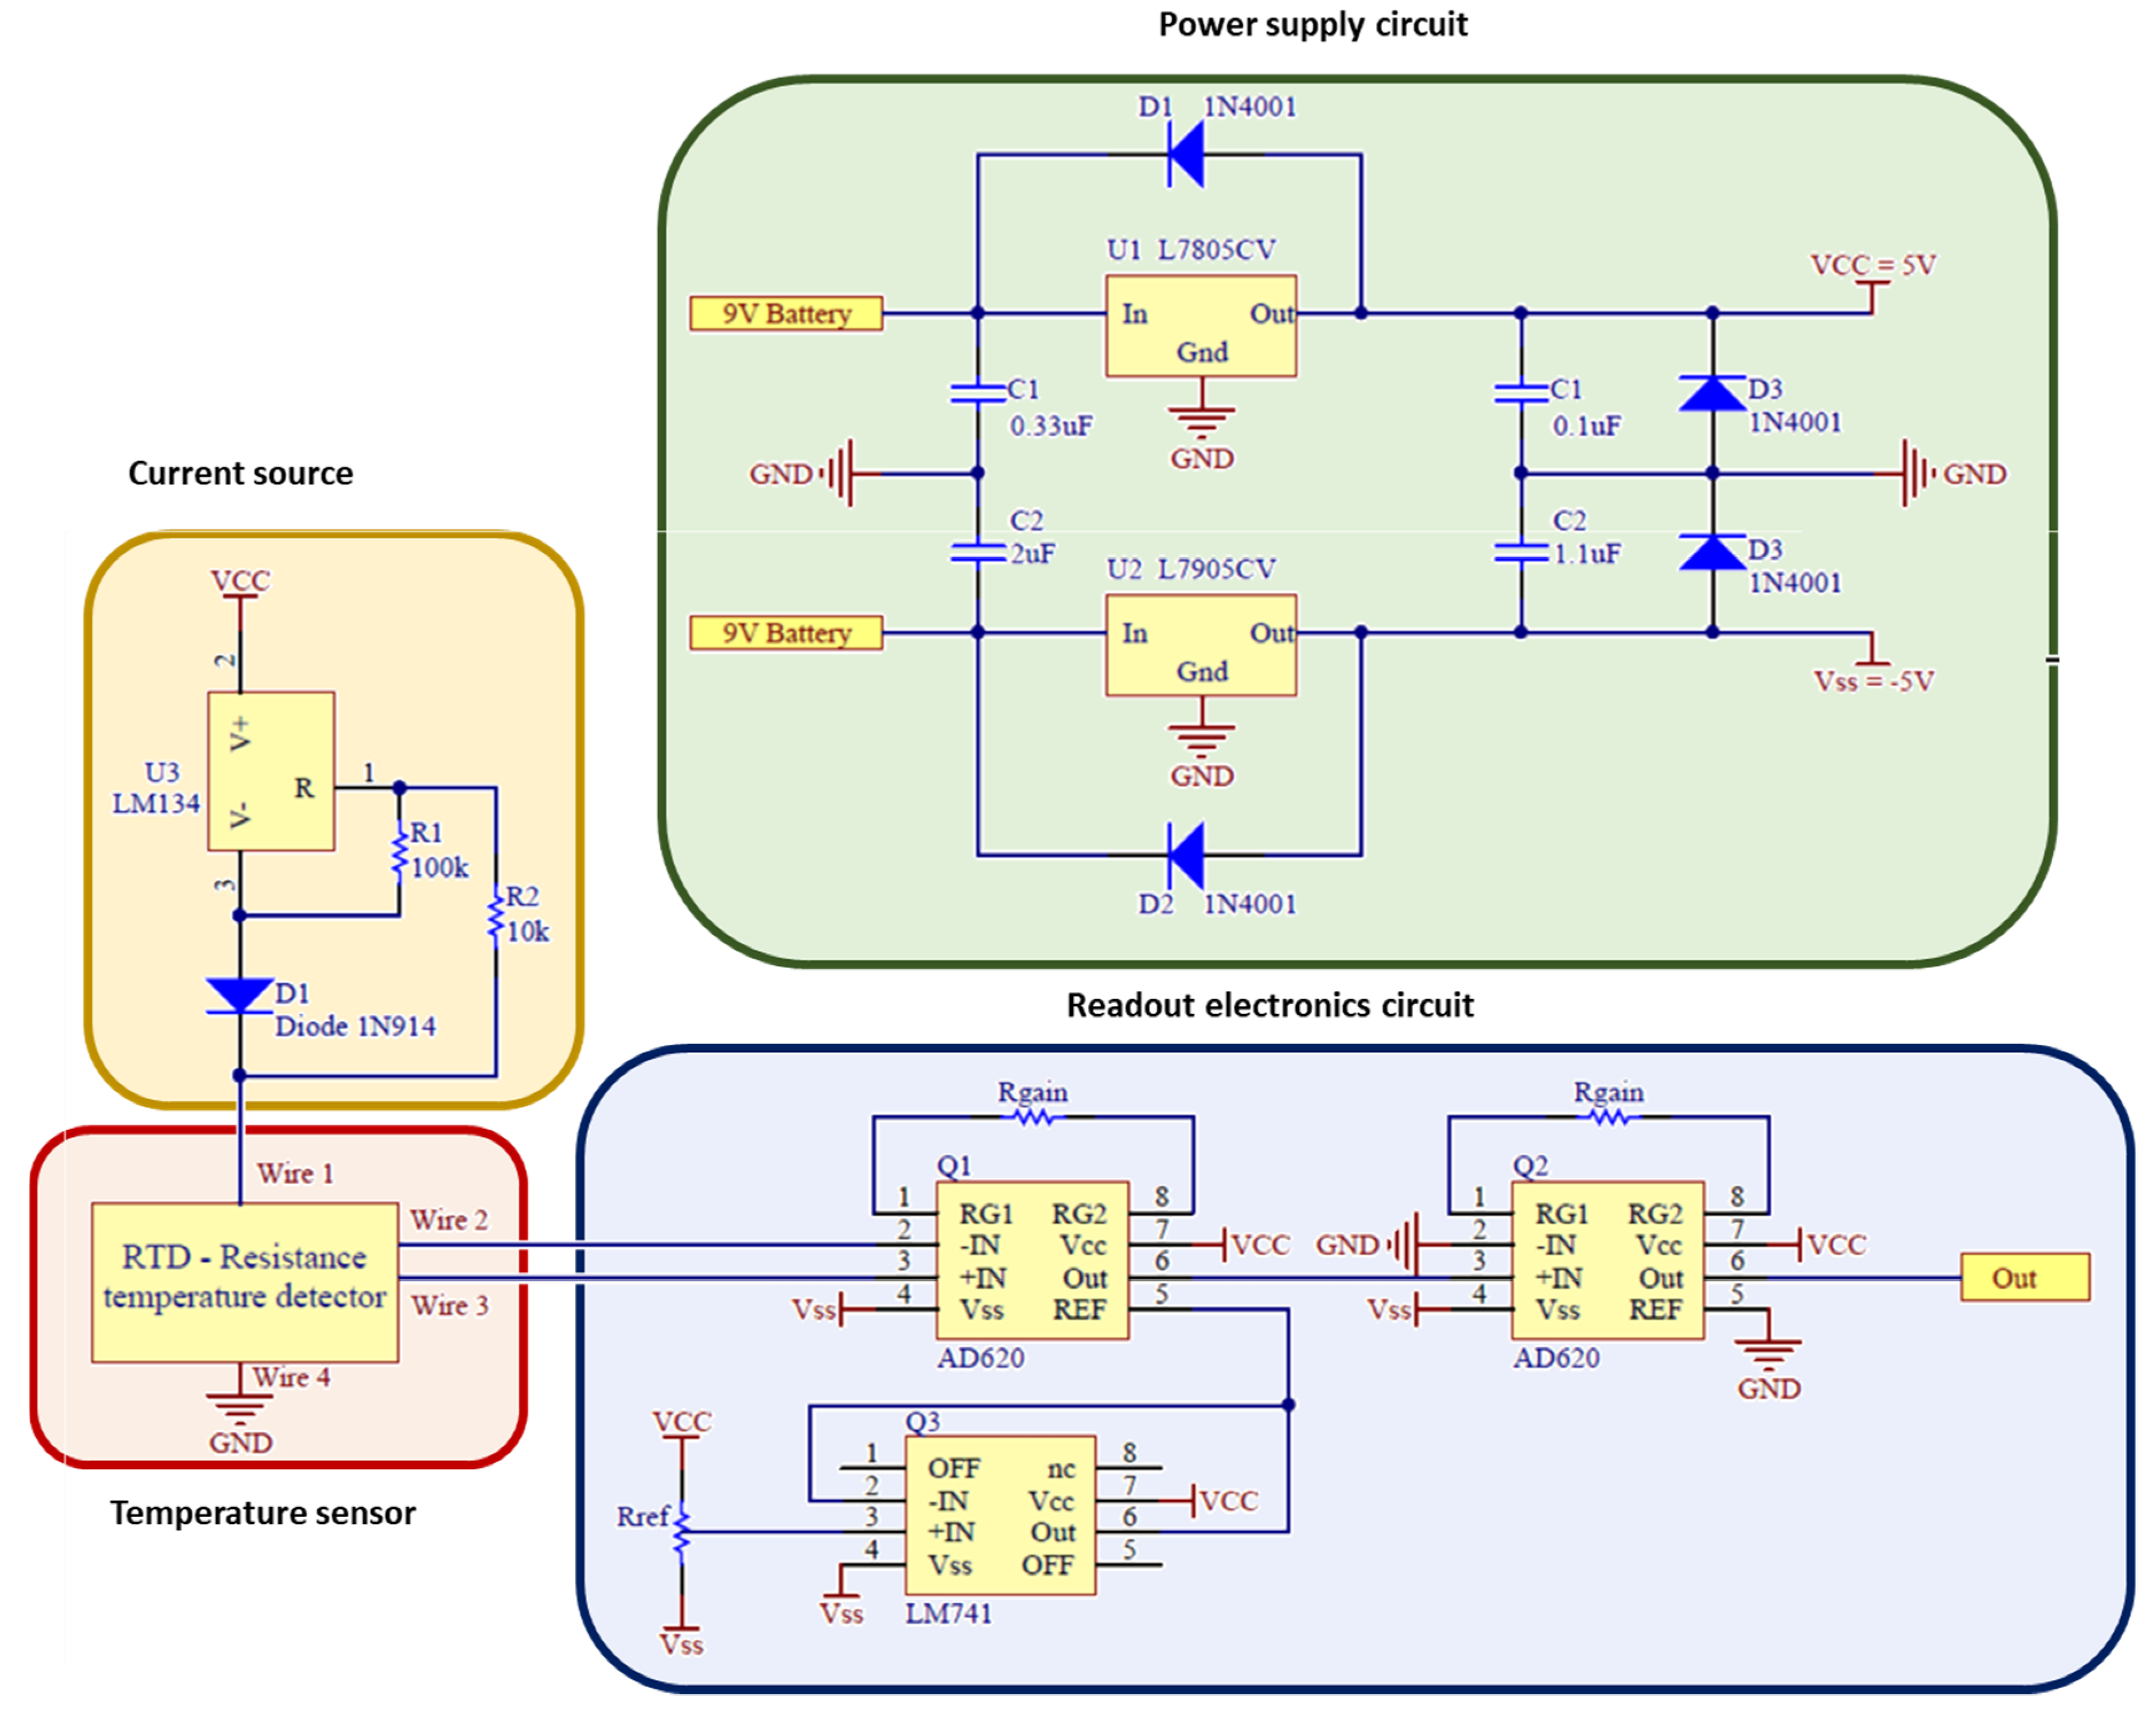
2.5. Microsensors Readout Electronics

Figure 8 shows the control and readout electronics for the microsensors temperature measurements. The microsensors readout electronics require a precision power source for excitation, especially when a high resolution is required. Any fluctuation of the excitation current will originate a change in the electrical potential of the sensors, and consequently, will provide inaccurate temperature values. So, an adjustable current source (LM134 from Texas Instruments, Dallas, TX, USA) was used to provide a stable current of 100 µA. This device was chosen because it allows a current adjustment from 1 µA to 10 mA, with high accuracy and low noise. The supply of the circuit was performed by batteries for assuring independence of the power supply and portability.
The high-sensitivity and noise-free RTDs readout circuit usually relies in a Wheatstone bridge or a four-wire configuration analog circuit for sensor output [25]. In this particular case, a four-wire configuration was used, which features high accuracy and an output voltage directly proportional to the RTD resistance only (Figure 8). The analog signals of the RTDs circuit were amplified using the AD620 from Analog Devices and converted into a usable voltage level for the microcontroller’s Analog Digital Converter (ADC), and for further stored in a SD card or presented in a display.

3. Results and Discussion

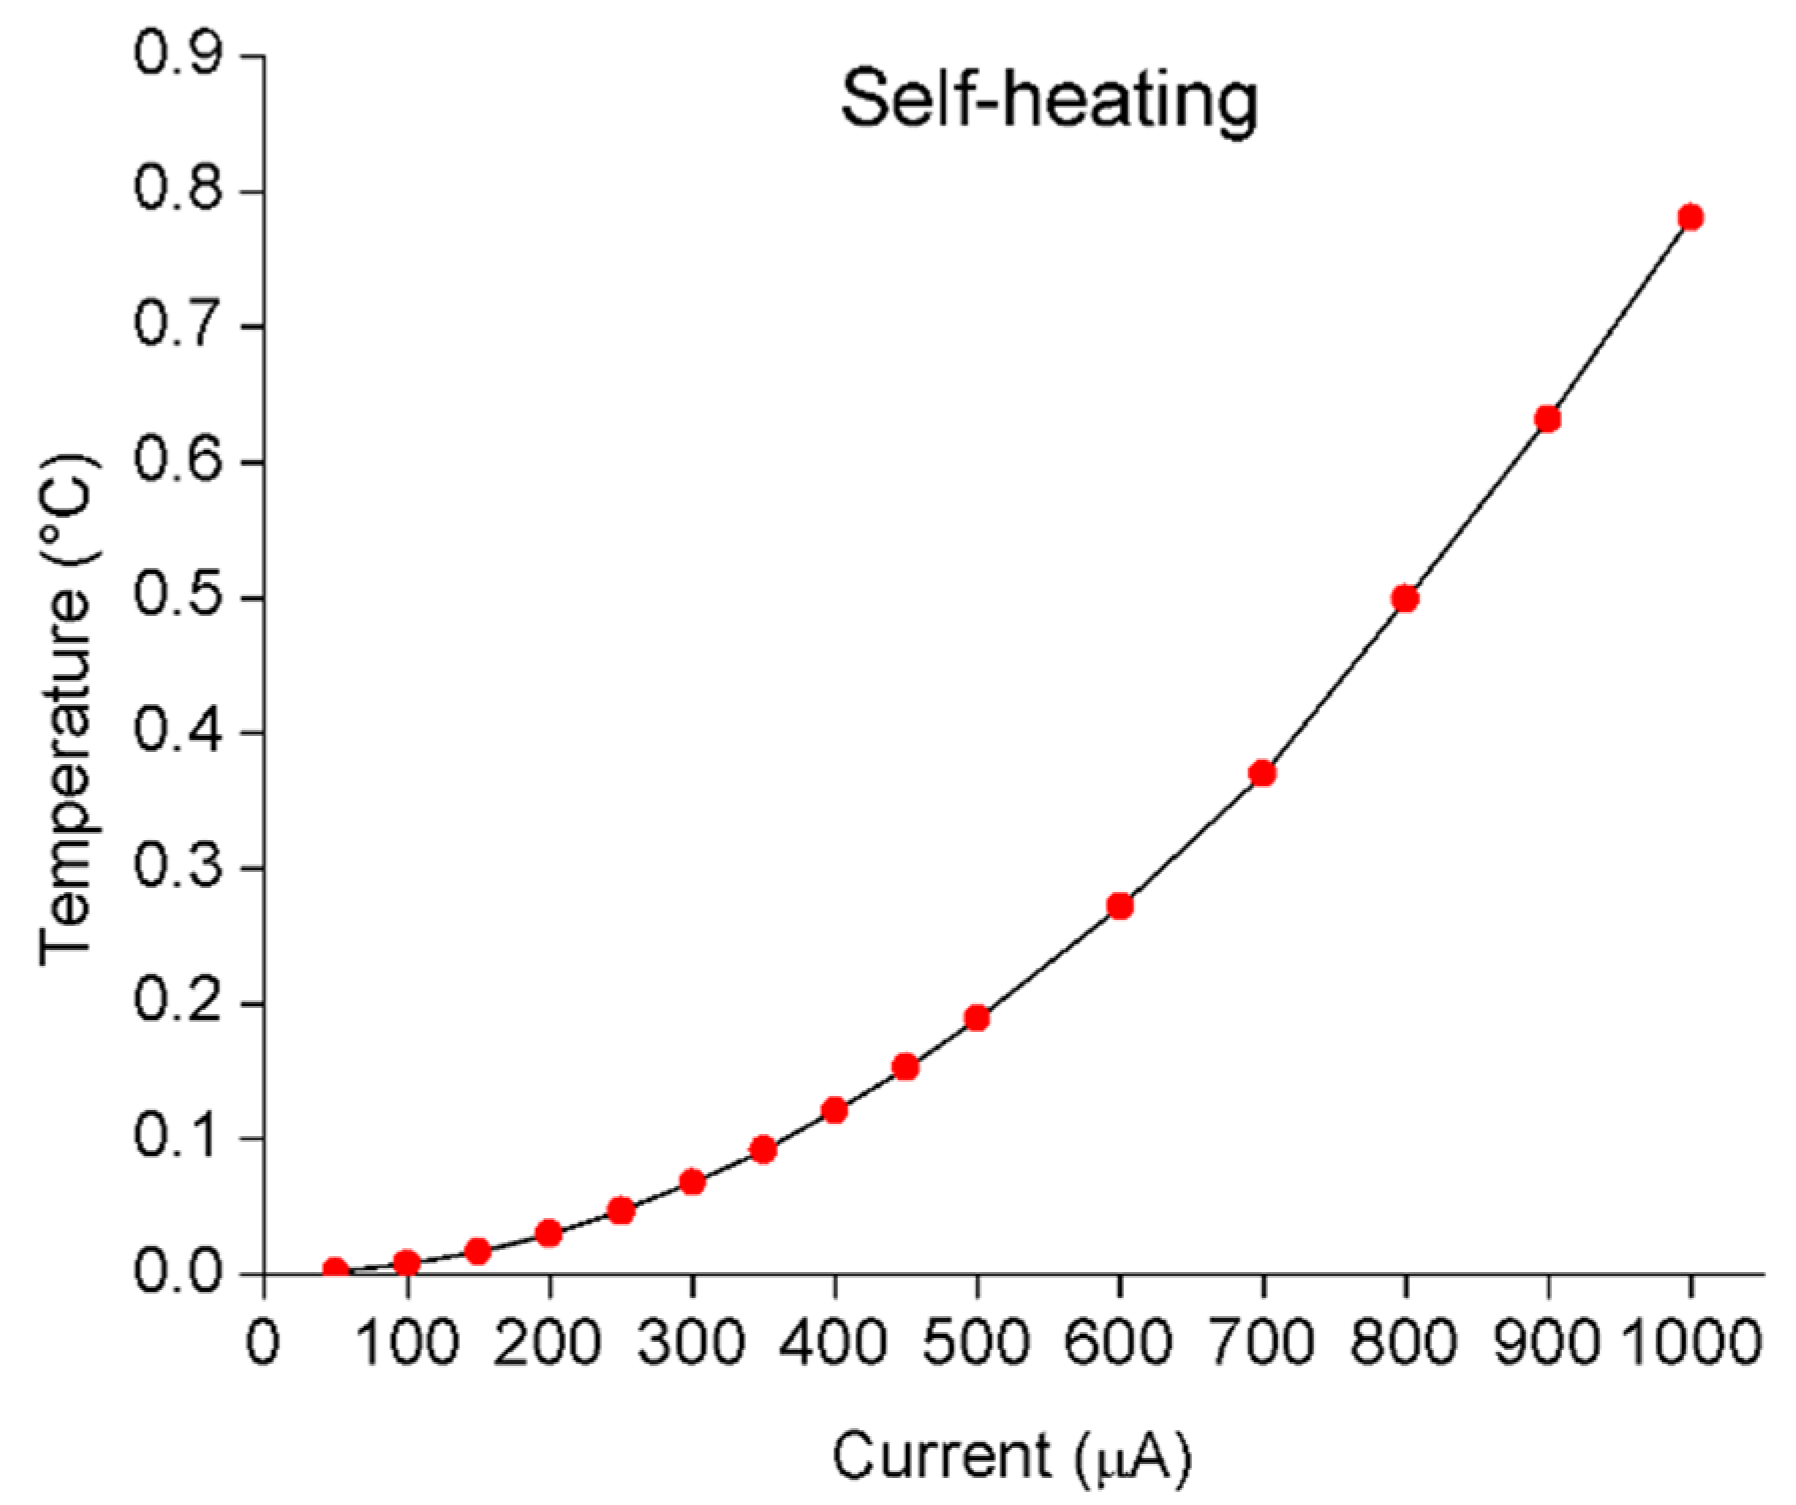
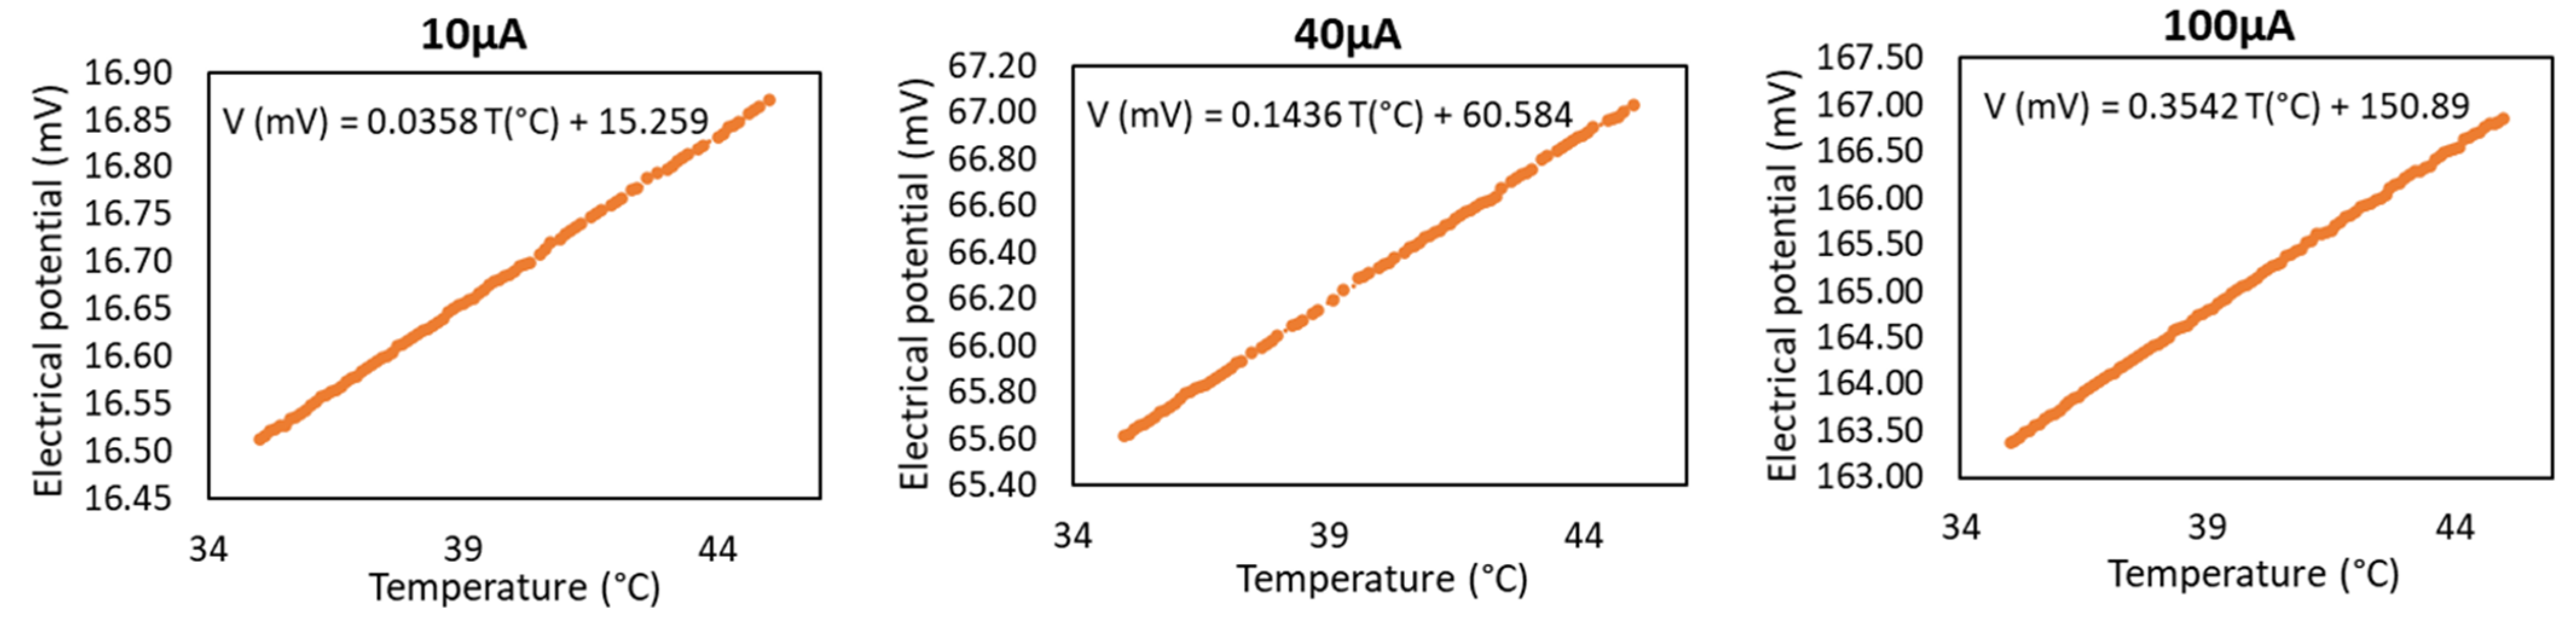
3.1. Excitation Current

According to the previous numerical simulations, the current for excitation the RTD sensor must be small to avoid self-heating. For the required resolution, a current of 100 µA provides a negligible self-heating. Lower currents (10 and 40 µA) were also experimentally studied to understand their influence on the 24 windings RTD sensitivity as lower currents give an even lower self-heating and lower power consumption allowing long-term monitoring. However, as expected, a considerable reduction on the sensitivity was achieved (Figure 9) and thus, the choice focused on 100 µA for the following tests.

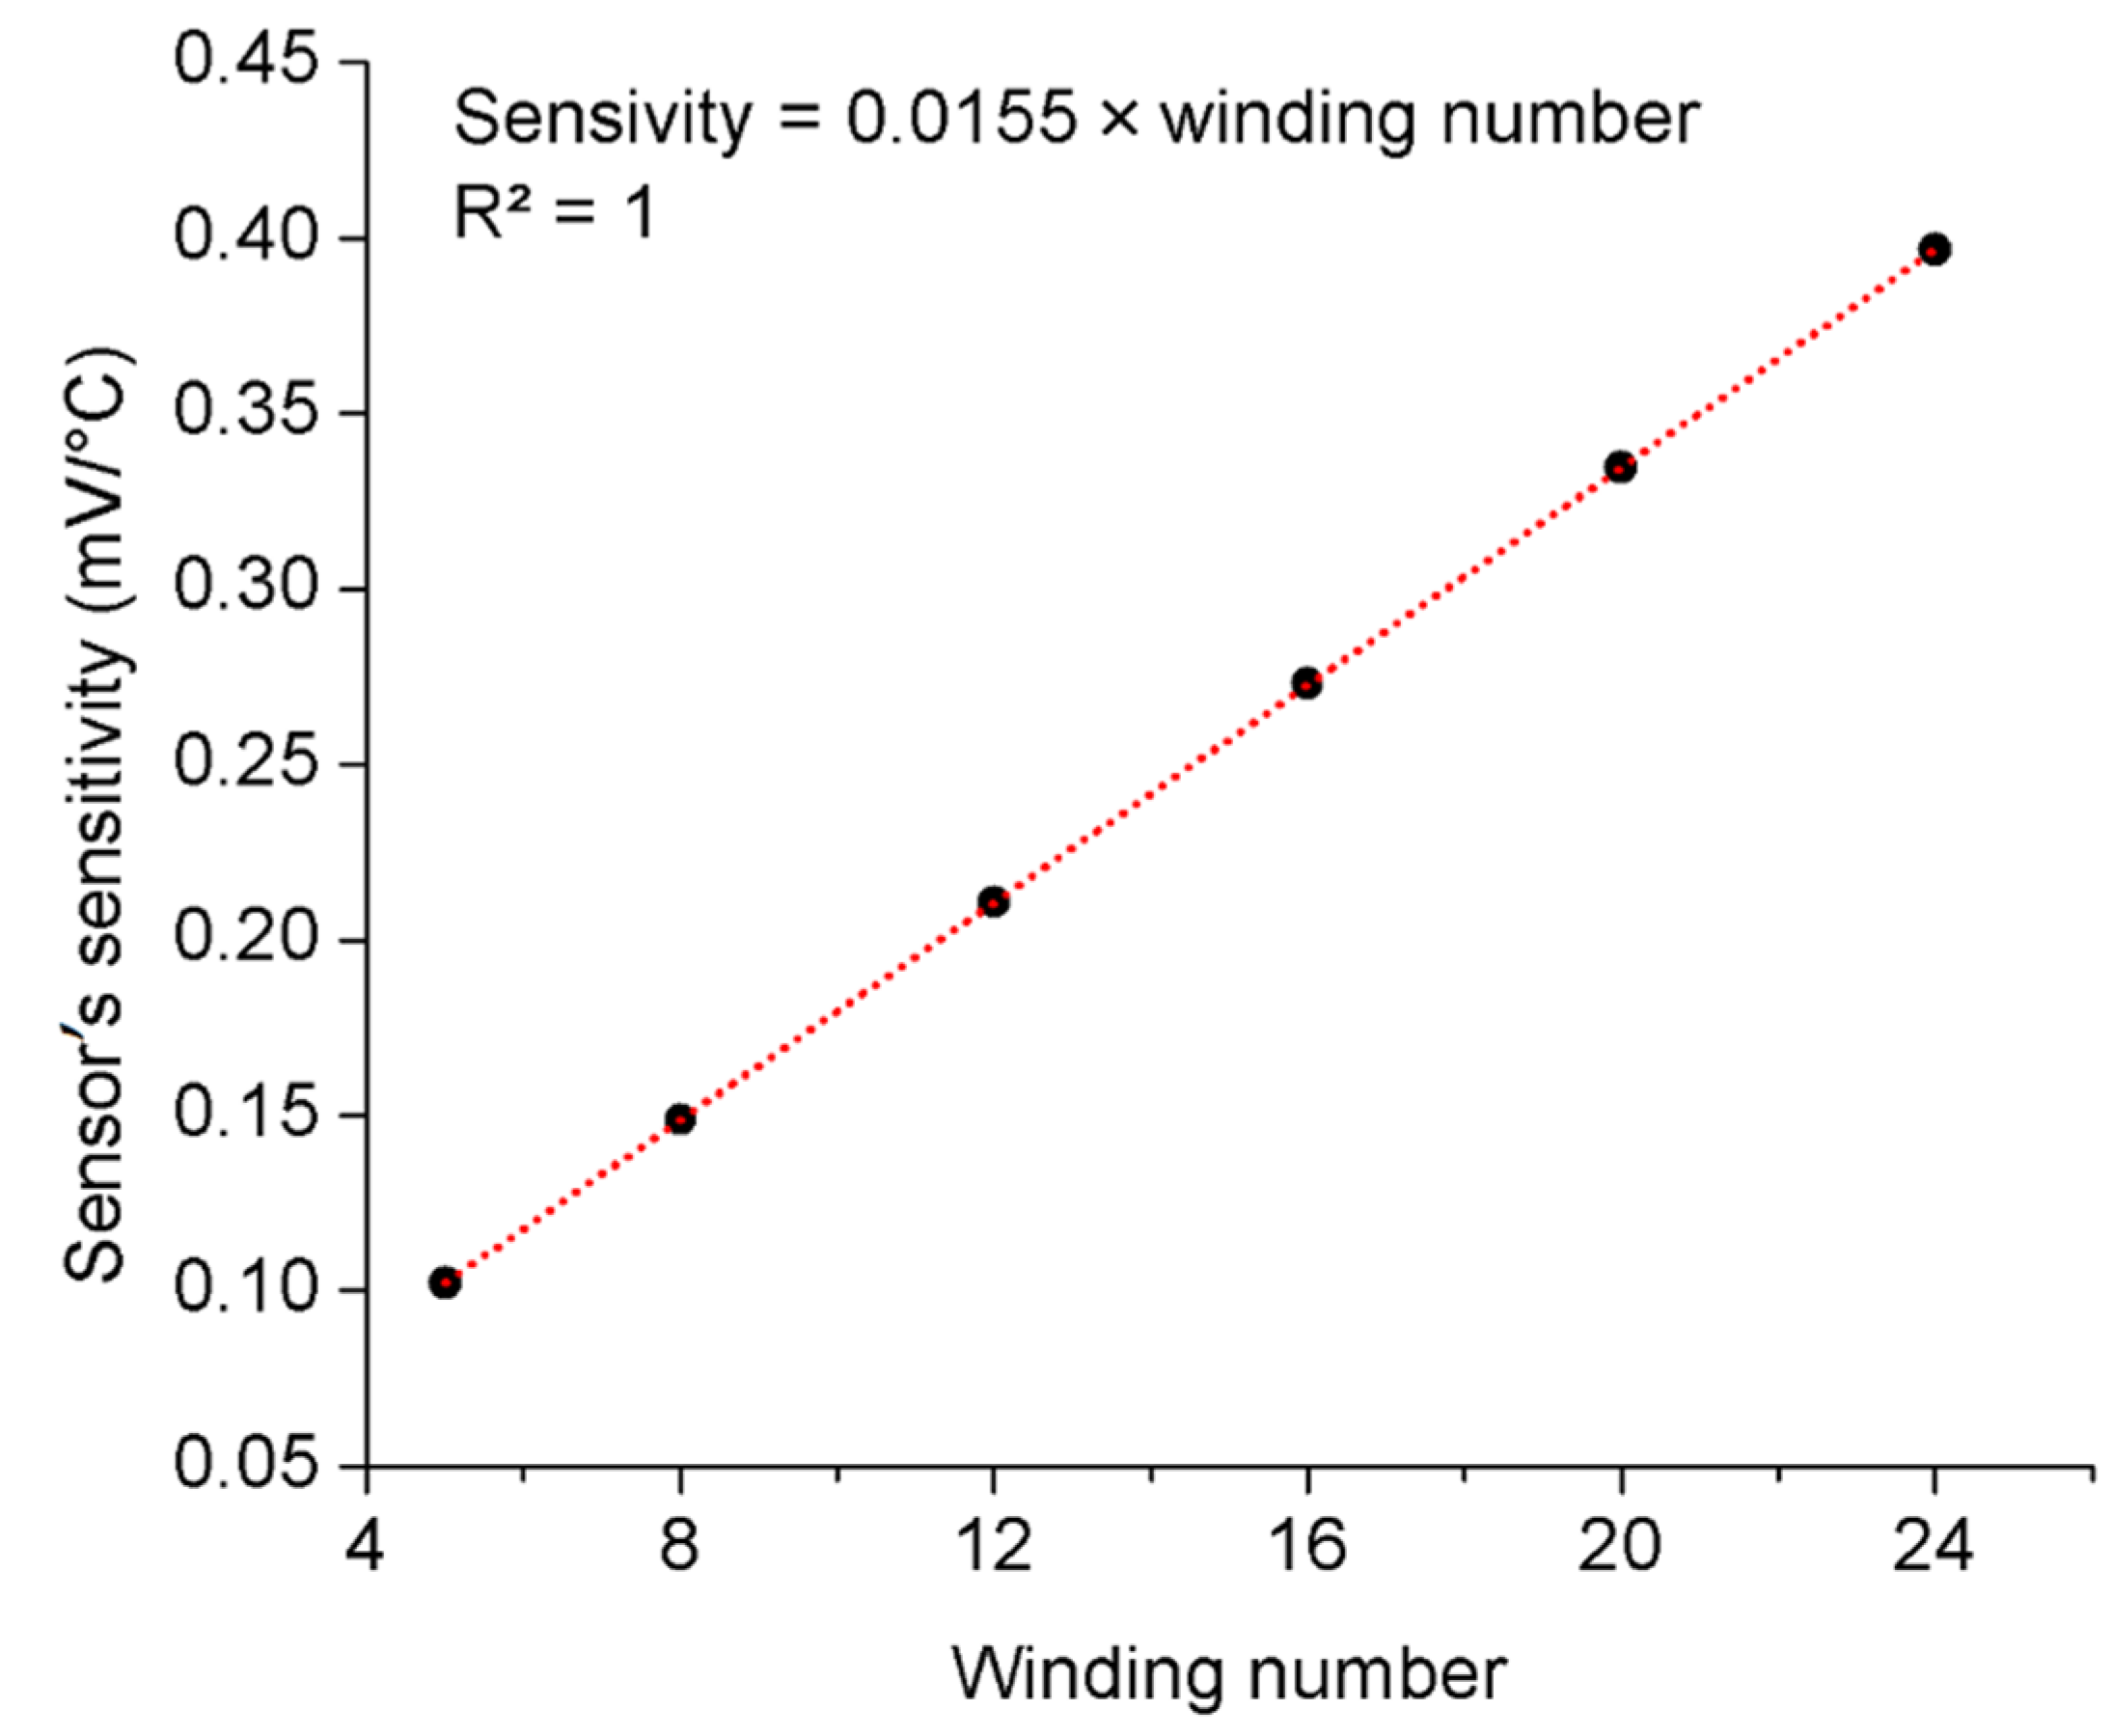
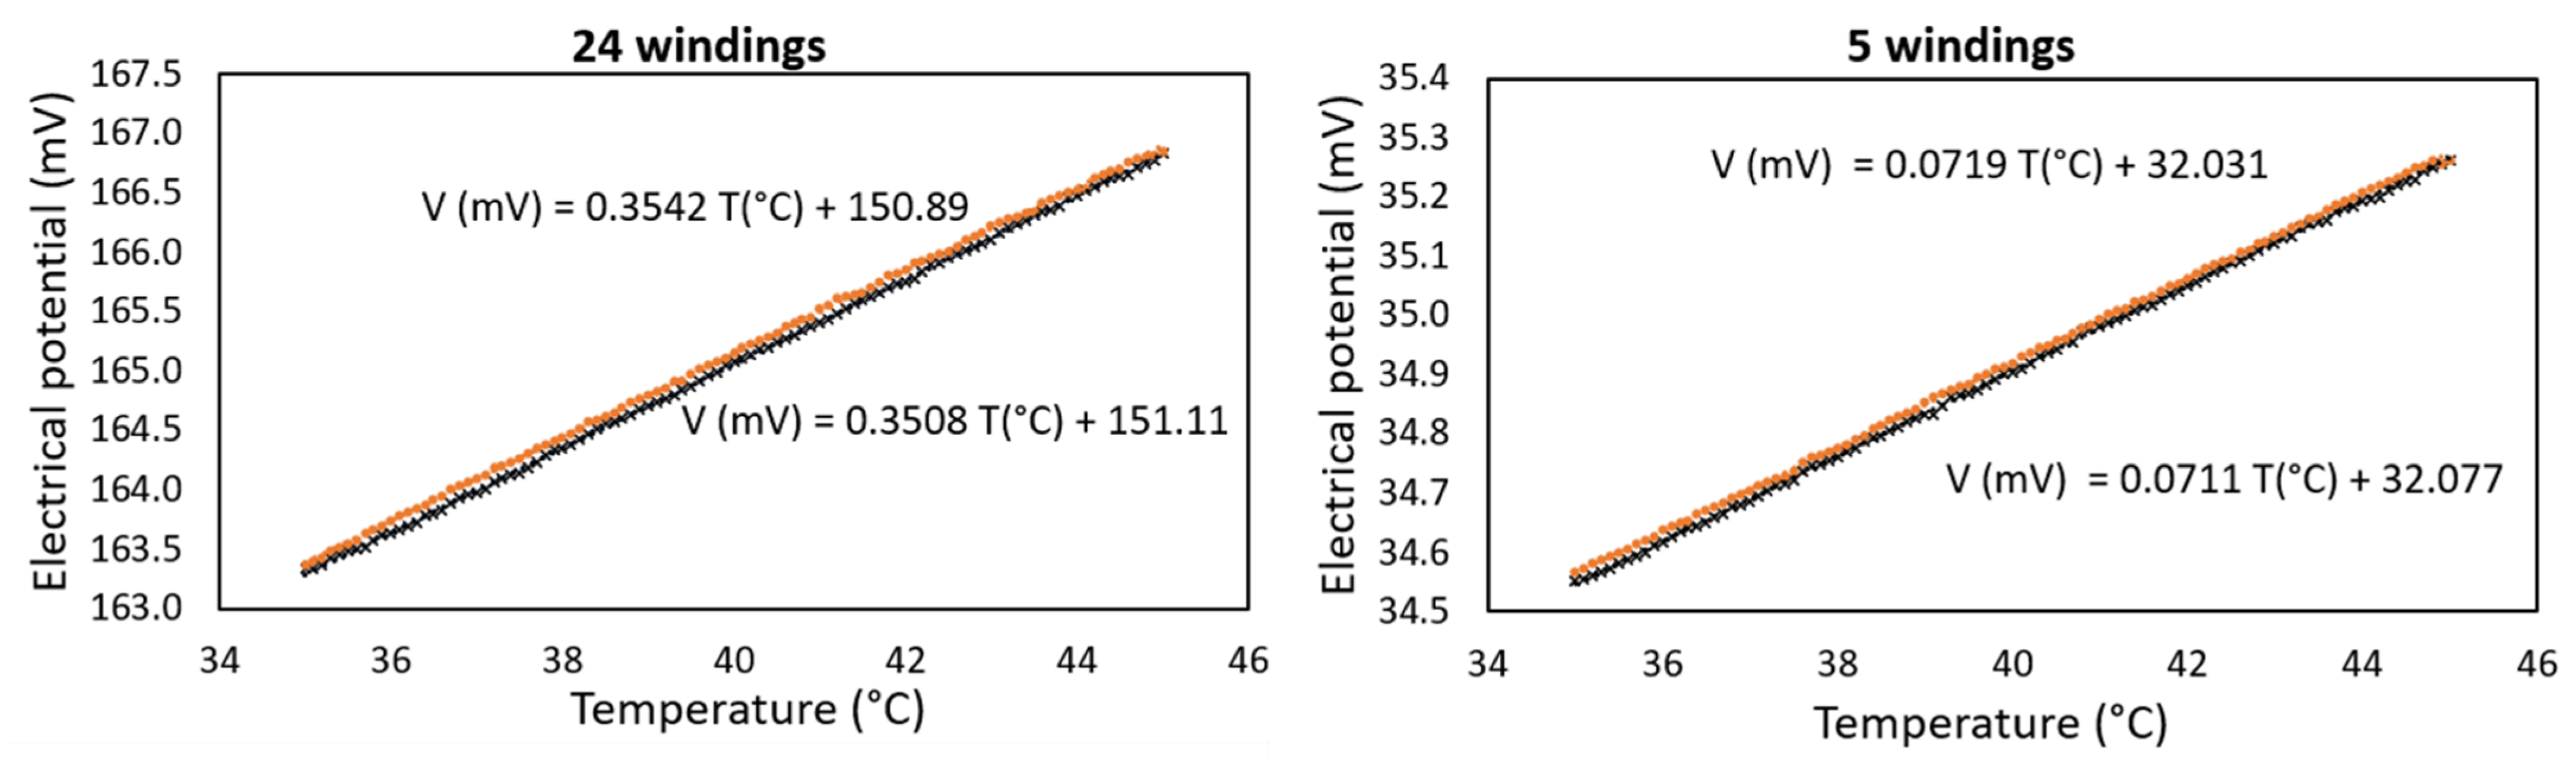
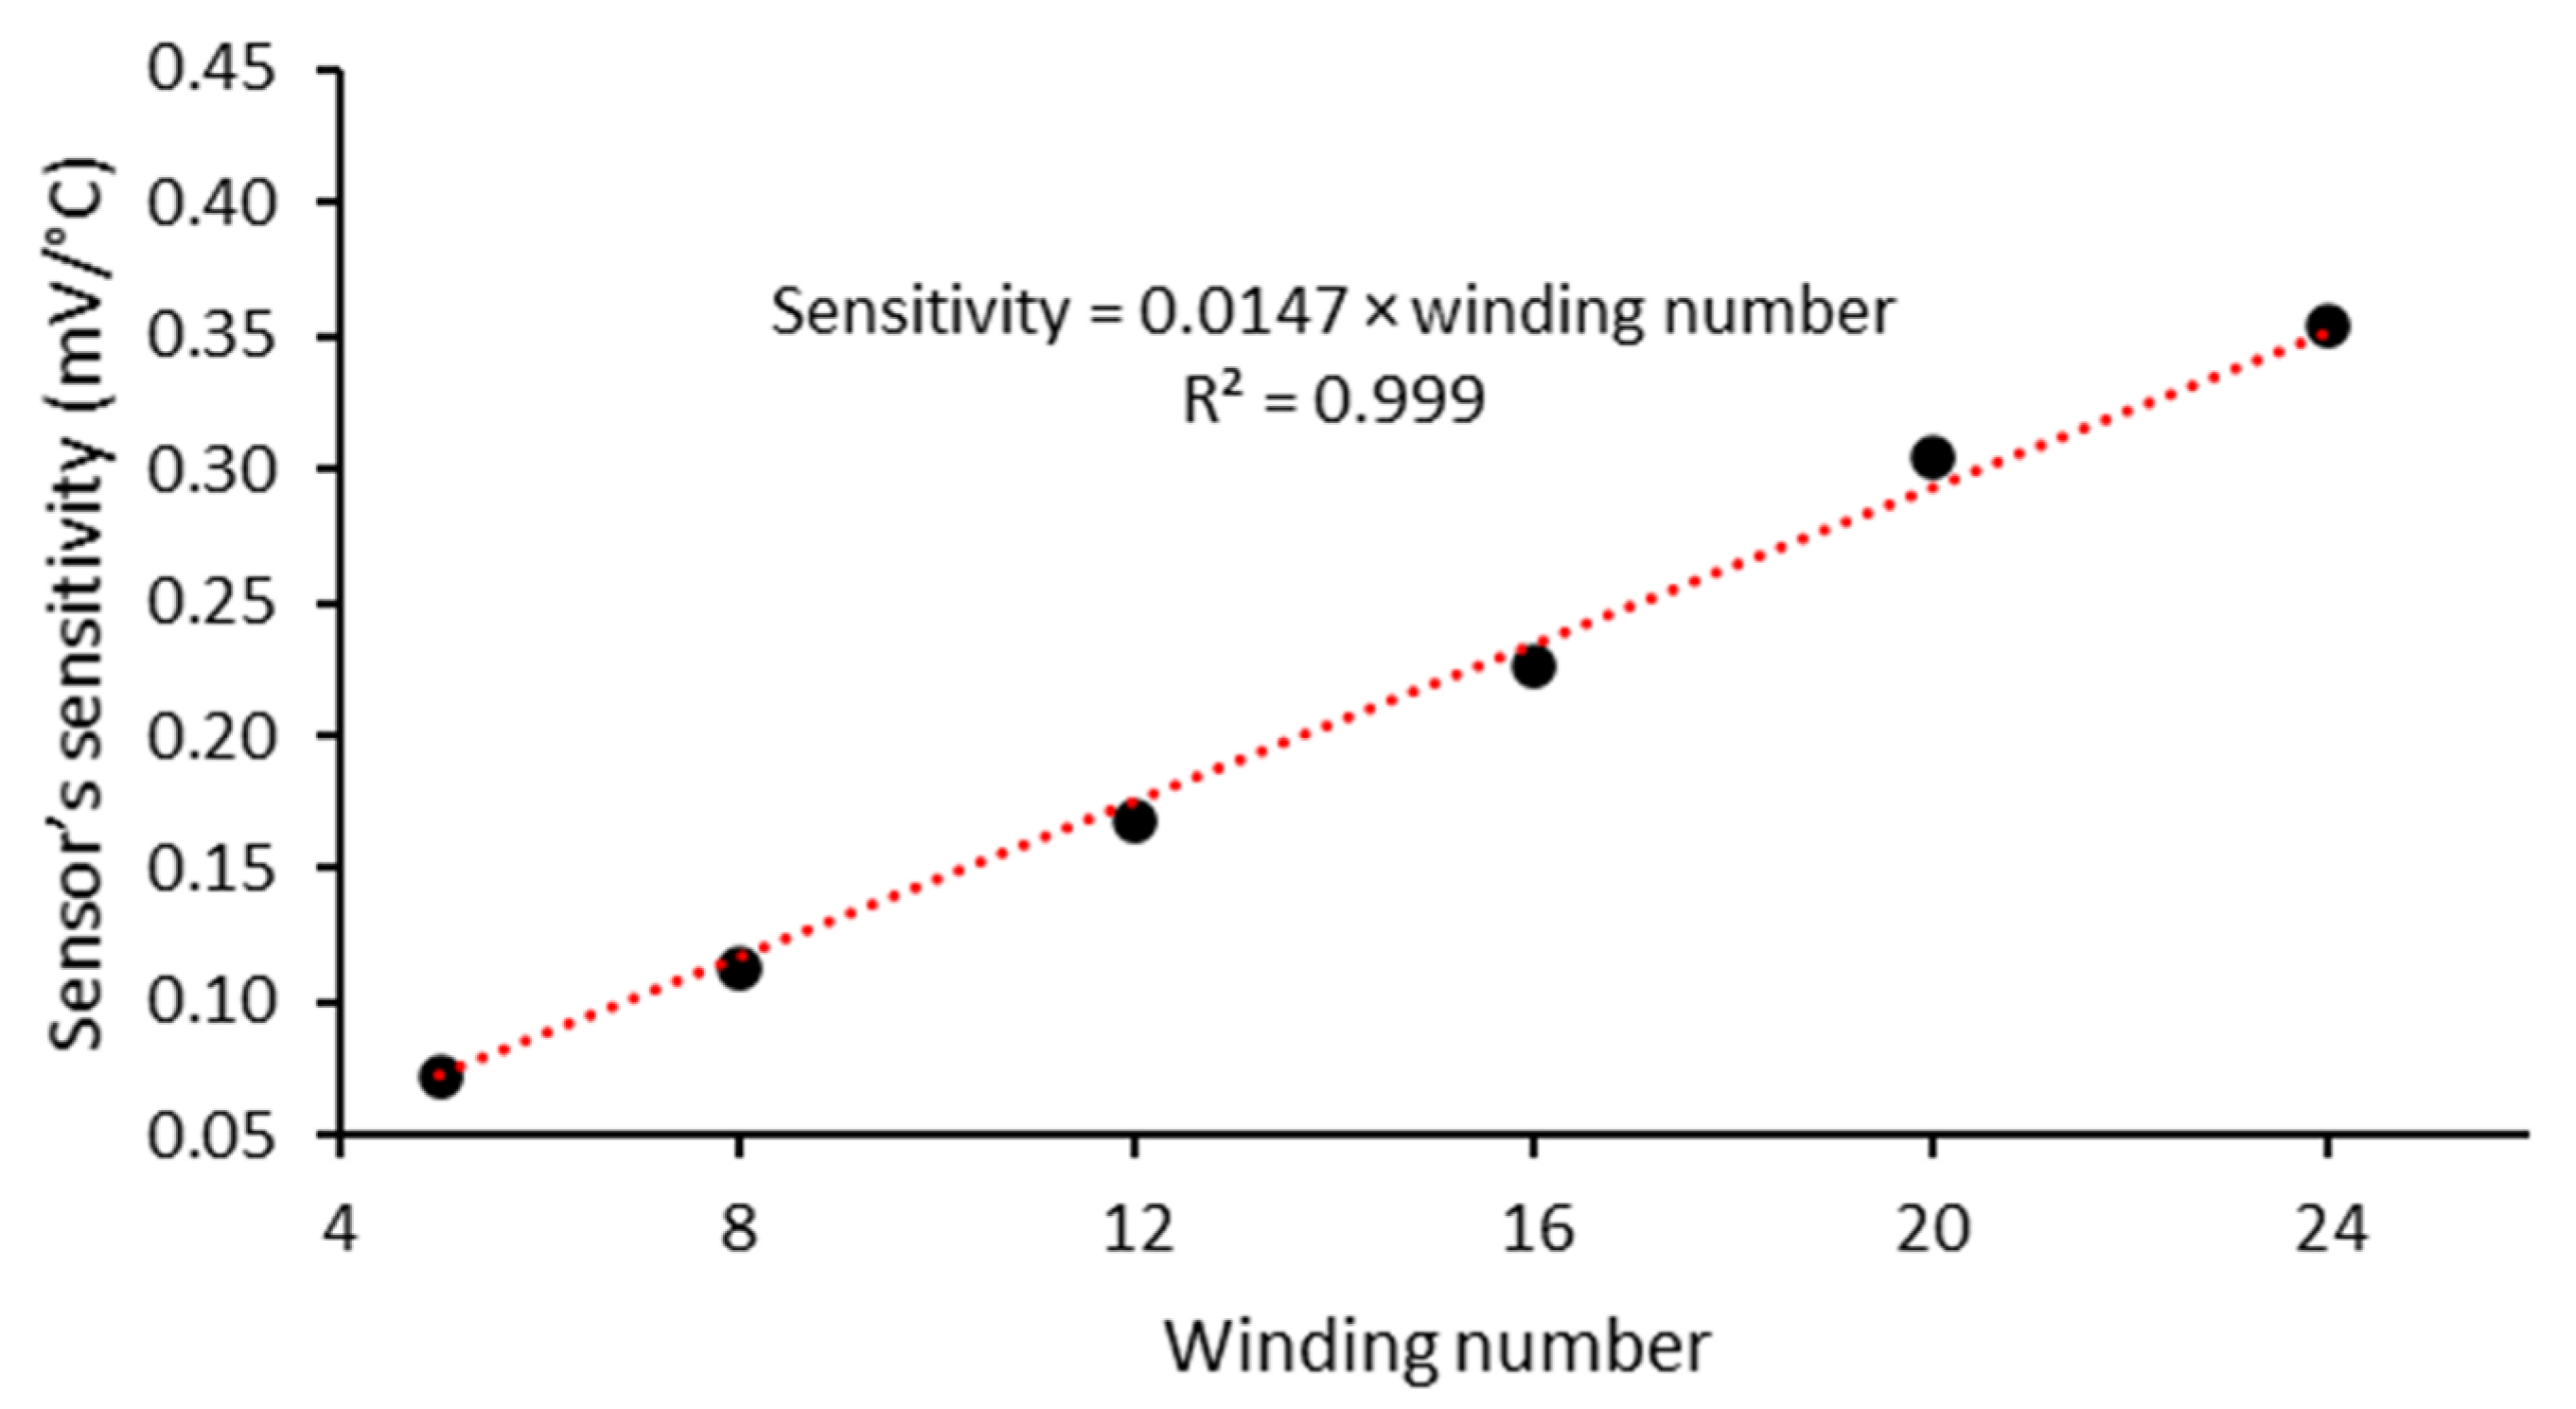
3.2. Calibration of Temperature Microsensors

To evaluate the sensitivity and linearity of the sensors with 5, 8, 12, 16, 20 and 24 windings to monitor the temperature of the surrounding environment, preliminary tests were performed (using the experimental setup described in Section 2.4), measuring the electrical potential of those RTDs with the constant excitation current of 100 µA. The RTDs were placed in a temperature-controlled hotplate, for calibration. The temperature was increased from 35 to 45 °C with increments of 0.1 °C. Figure 10 and Figure S3 in the Supplementary Information shows the RTDs response. As expected, it is evident there is a high linearity between temperature and electrical potential. Furthermore, when the number of windings is increased, the sensitivity also increases linearly (cf. Figure 11). The experimental sensitivity ranges of the sensors from 0.0719 to 0.3542 mV/°C for 5 to 24 windings, respectively, which are close to the simulated values (0.1022 to 0.3966 mV/°C), are shown in Table 2. However, the experimentally measured electric potential was slightly higher than those obtained in the simulations, which can be explained by the increase of the electrical resistance of lead wires used in the electronic circuit connections. However, the RTDs performance is in agreement with the simulated results. Since the higher sensitivity was obtained for the 24 windings sensor, ~35 µV for a step of 0.1 °C, this geometry was chosen for being integrated in the organ-on-a-chip. The calibration equation for the sensors with 24 windings is expressed as follows:
V (mV) = 0.3542 T (°C) + 150.89

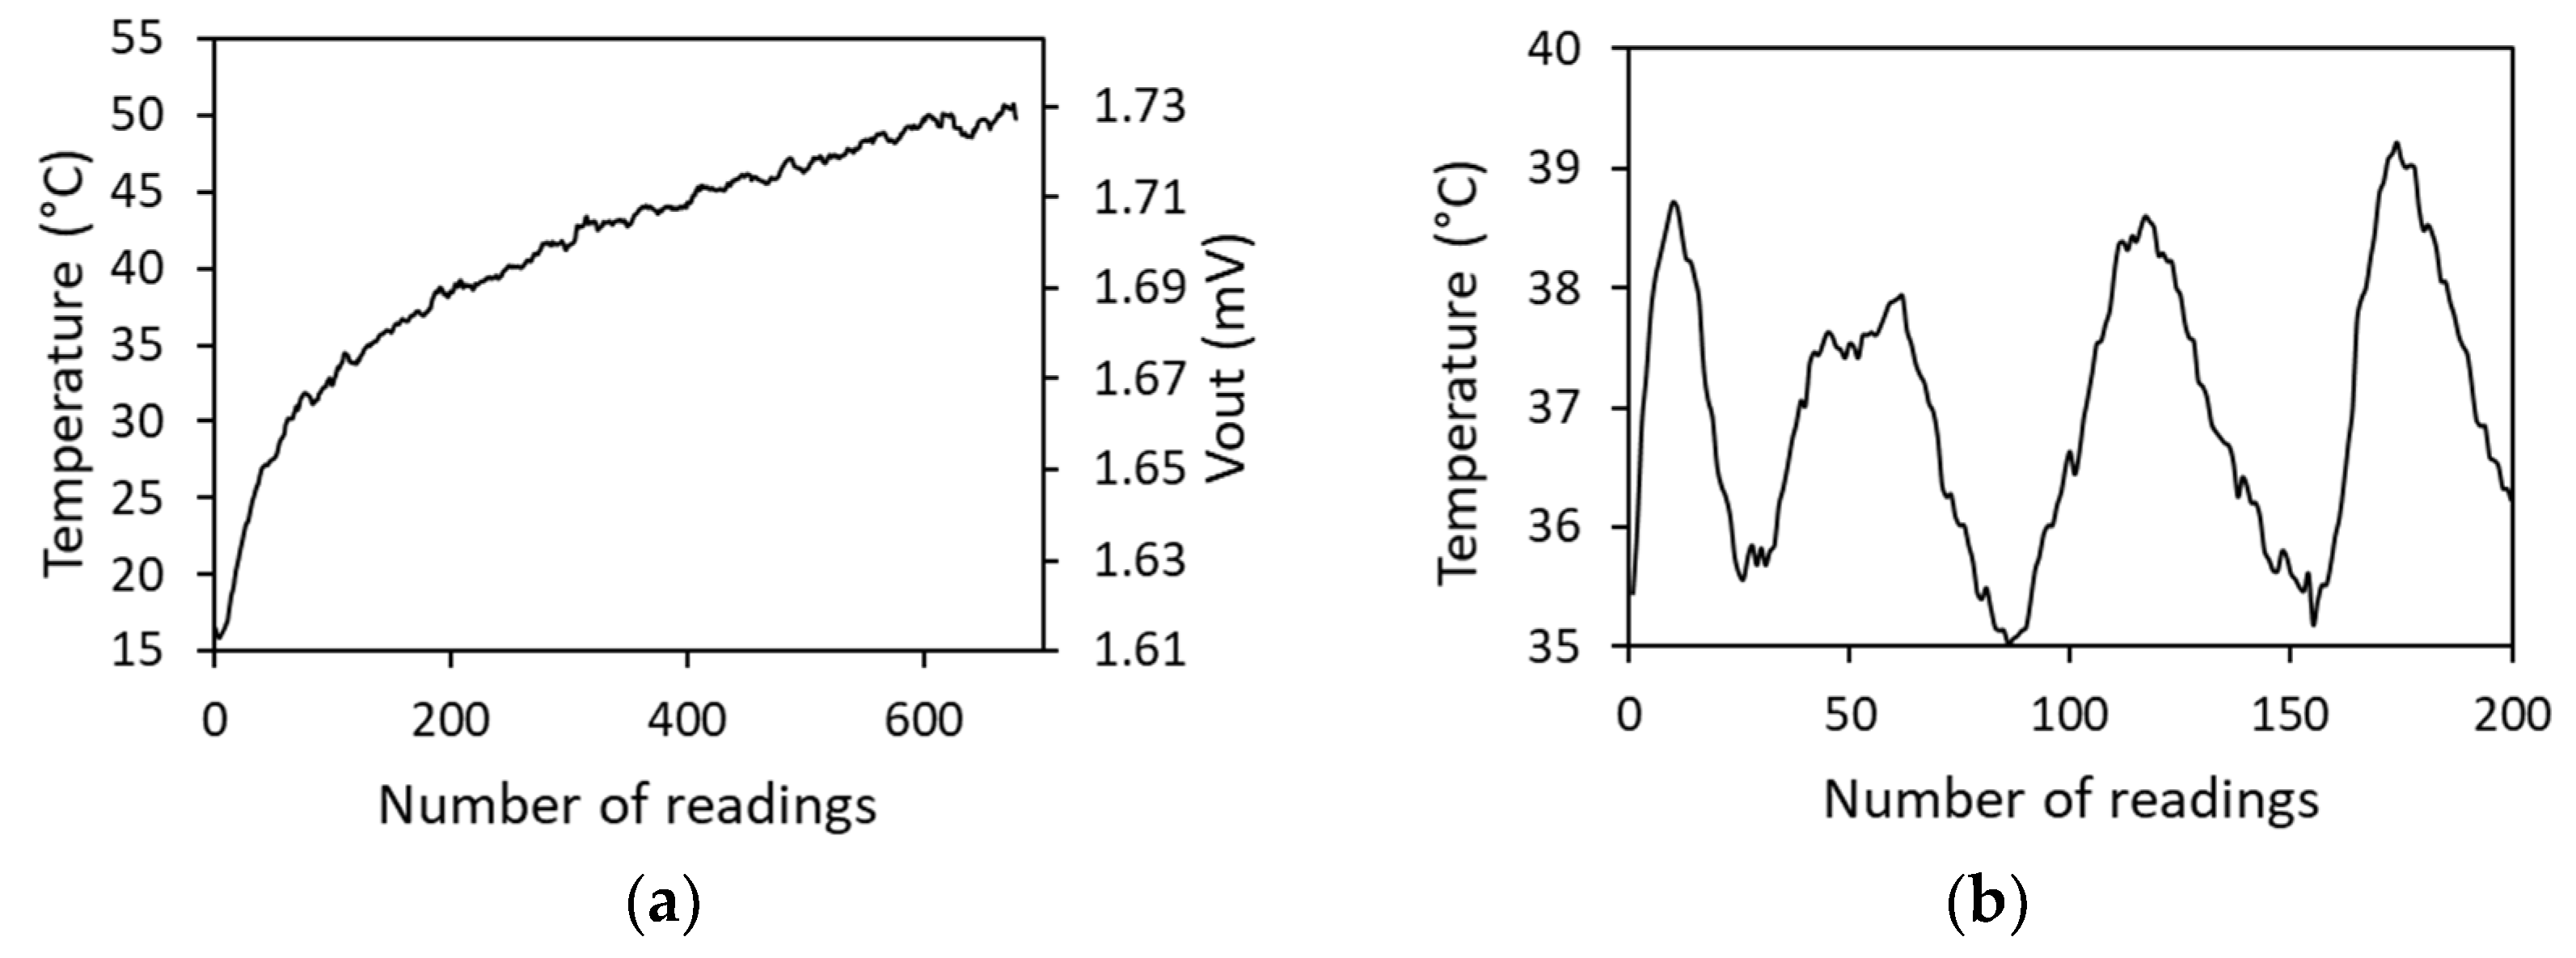
3.3. RTDs Readout System Measurements

The validation of the 24 windings RTDs readout electronics was performed using a Peltier module as heating source and a reference temperature sensor (commercial PT-100) to monitor the temperature in the sensor area. The Peltier module was used due to their quickly and easier temperature change and control. The sensing area of the RTD (only the meander area) was placed over the Peltier module in order to eliminate the influence of the heating in the leading wires. An increase of temperature between 15 to 50 °C was applied and the output signal, after amplification, was read by a microcontroller (STM32). Figure 12a shows the different values of output voltage (measured in the output node, Out of Figure 8) and the corresponding temperature when the Peltier module is powered with a constant voltage. A dynamic test was also performed powering the Peltier module with a voltage square wave (on/off pulses) for seeking the transient RTD electronic system response (Figure 12b). The results of Figure 12 show the proper operation of the developed system. In future, a graphical user-friendly interface will be developed to automatically display the temperature data of multiple sensors, as well as for enabling the sensor selection and providing warnings if a temperature exceeds a pre-defined value.

4. Conclusions

This manuscript describes the development, fabrication and characterization of temperature microsensors to be integrated in a OoC. The simulations and experimental results show that the best geometry for the required application was a platinum meander-shaped RTD with 24 windings, featuring 200 nm platinum film thickness, 10 µm of line width and spacing and a RTD area of 0.38 mm2. Moreover, the performance of the microsensor results in high sensitivity to temperature changes, ~0.3542 mV/°C. The small size of each sensor will allow one to integrate multiple sensors in a microfluidic chamber for real-time temperature measurements with high precision. In the future, these measurements will allow evaluation of the temperature of the microenvironment, which will add essential information for assessing the efficiency of drug nanocarriers triggered by mild temperature within the OoC.

Supplementary Materials

The following are available online at https://www.mdpi.com/article/10.3390/app11093864/s1, Figure S1: Simulated temperature and electric potential distribution for a sensor with 24 windings, with an excitation current of 100 µA and temperature of 45 ℃, Figure S2: Simulated temperature and electric potential distribution for a sensor with 24 windings, with an excitation current of 100 µA and temperature of 45 ℃, Figure S3: Experimental sensitivity of the sensors for the different fabricated RTDs according to the windings number. Orange line represents an increase temperature from 35 to 45 °C, and black line a decrease temperature from 45 to 35 °C.

Author Contributions

Conceptualization, P.J.S., V.C.P., R.O.R. and G.M.; funding acquisition, G.M.; methodology, P.J.S., V.C.P., V.H.M. and G.M.; supervision, P.C.S. and G.M.; writing—original draft, P.J.S., V.H.M. and V.C.P.; writing—review and editing, P.C.S., R.O.R. and G.M. All authors have read and agreed to the published version of the manuscript.

Funding

This work is the result of the project NORTE-01-0145-FEDER-029394, RTChip4Theranostics, and was supported by Programa Operacional Regional do Norte–Norte Portugal Regional Operational Programme (NORTE 2020), under the PORTUGAL 2020 Partnership Agreement through the European Regional Development Fund (FEDER) and by Fundação para a Ciência e Tecnologia (FCT), IP, project reference PTDC/EMD-EMD/29394/2017. The authors also acknowledge the partial financial support by the projects UIDB/04436/2020 and UIDP/04436/2020.

Institutional Review Board Statement

Not applicable.

Informed Consent Statement

Not applicable.

Data Availability Statement

Not applicable.

Acknowledgments

V.H. Magalhães thanks the FCT for the PD/BD/150581/2020 grant.

Conflicts of Interest

The authors declare no conflict of interest.

References

  1. van den Berg, A.; Mummery, C.L.; Passier, R.; Van Der Meer, A.D. Personalised organs-on-chips: Functional testing for precision medicine. Lab Chip 2018, 19, 198–205. [Google Scholar] [CrossRef] [Green Version]
  2. Haderspeck, J.C.; Chuchuy, J.; Kustermann, S.; Liebau, S.; Loskill, P. Organ-on-a-chip technologies that can transform ophthalmic drug discovery and disease modeling. Expert Opin. Drug Discov. 2019, 14, 47–57. [Google Scholar] [CrossRef]
  3. Bovard, D.; Iskandar, A.; Luettich, K.; Hoeng, J.; Peitsch, M.C. Organs-on-a-chip: A new paradigm for toxicological assessment and preclinical drug development. Toxicol. Res. Appl. 2017, 1, 2397847317726351. [Google Scholar] [CrossRef]
  4. Rodrigues, R.O.; Sousa, P.C.; Gaspar, J.; Bañobre-López, M.; Lima, R.; Minas, G.J.S. Organ-on-a-Chip: A Preclinical Microfluidic Platform for the Progress of Nanomedicine. Small 2020, 16, 2003517. [Google Scholar] [CrossRef] [PubMed]
  5. Sun, W.; Luo, Z.; Lee, J.; Kim, H.J.; Lee, K.; Tebon, P.; Feng, Y.; Dokmeci, M.R.; Sengupta, S.; Khademhosseini, A.J.A.h.m. Organ-on-a-Chip for Cancer and Immune Organs Modeling. Adv. Healthcare Mater. 2019, 8, 1801363. [Google Scholar] [CrossRef]
  6. Zhang, J.; Zhao, X.; Liang, L.; Li, J.; Demirci, U.; Wang, S. A decade of progress in liver regenerative medicine. Biomaterials 2018, 157, 161–176. [Google Scholar] [CrossRef]
  7. Devarasetty, M.; Mazzocchi, A.R.; Skardal, A. Applications of Bioengineered 3D Tissue and Tumor Organoids in Drug Development and Precision Medicine: Current and Future. BioDrugs 2018, 32, 53–68. [Google Scholar] [CrossRef] [PubMed]
  8. Ronaldson-Bouchard, K.; Vunjak-Novakovic, G. Organs-on-a-chip: A fast track for engineered human tissues in drug development. Cell Stem Cell 2018, 22, 310–324. [Google Scholar] [CrossRef] [PubMed] [Green Version]
  9. Zhang, Y.S.; Aleman, J.; Shin, S.R.; Kilic, T.; Kim, D.; Shaegh, S.A.M.; Massa, S.; Riahi, R.; Chae, S.; Hu, N.; et al. Multisensor-integrated organs-on-chips platform for automated and continual in situ monitoring of organoid behaviors. Proc. Natl. Acad. Sci. USA 2017, 114, E2293–E2302. [Google Scholar] [CrossRef] [Green Version]
  10. Kilic, T.; Navaee, F.; Stradolini, F.; Renaud, P.; Carrara, S. Organs-on-chip monitoring: Sensors and other strategies. Microphysiol. Syst. 2018, 1, 1. [Google Scholar] [CrossRef]
  11. Da Ponte, R.M.; Gaio, N.; Van Zeijl, H.; Vollebregt, S.; Dijkstra, P.; Dekker, R.; Serdijn, W.A.; Giagka, V. Monolithic integration of a smart temperature sensor on a modular silicon-based organ-on-a-chip device. Sens. Actuators A Phys. 2021, 317, 112439. [Google Scholar] [CrossRef]
  12. McKenzie, B.A.; Grover, W.H. A microfluidic thermometer: Precise temperature measurements in microliter-and nanoliter-scale volumes. PLoS ONE 2017, 12, e0189430. [Google Scholar] [CrossRef] [Green Version]
  13. Shellman, Y.G.; Ribble, D.; Yi, M.; Pacheco, T.; Hensley, M.; Finch, D.; Kreith, F.; Mahajan, R.L.; Norris, D.A. Fast response temperature measurement and highly reproducible heating methods for 96-well plates. Biotechniques 2004, 36, 968–976. [Google Scholar] [CrossRef]
  14. Reichen, M.; Veraitch, F.S.; Szita, N. Development of a Multiplexed Microfluidic Platform for the Automated Cultivation of Embryonic Stem Cells. J. Lab. Autom. 2013, 18, 519–529. [Google Scholar] [CrossRef] [Green Version]
  15. Li, C.; Sun, J.; Wang, Q.; Zhang, W.; Gu, N. Wireless Thermometry for Real-Time Temperature Recording on Thousand-Cell Level. IEEE Trans. Biomed. Eng. 2019, 66, 23–29. [Google Scholar] [CrossRef]
  16. Qiao, J.; Mu, X.; Qi, L. Construction of fluorescent polymeric nano-thermometers for intracellular temperature imaging: A review. Biosens. Bioelectron. 2016, 85, 403–413. [Google Scholar] [CrossRef]
  17. Larina, I.V.; Larin, K.V.; Esenaliev, R.O. Real-time optoacoustic monitoring of temperature in tissues. J. Phys. D Appl. Phys. 2005, 38, 2633–2639. [Google Scholar] [CrossRef]
  18. Lee, S.; Kang, S.H. Integrated optical molecular imaging system for four-dimensional real-time detection in living single cells. Biosens. Bioelectron. 2012, 31, 393–398. [Google Scholar] [CrossRef] [PubMed]
  19. Kim, J.; Kim, J.; Shin, Y.; Yoon, Y. A study on the fabrication of an RTD (resistance temperature detector) by using Pt thin film. Korean J. Chem. Eng. 2001, 18, 61–66. [Google Scholar] [CrossRef]
  20. Rodrigues, R.O.; Baldi, G.; Doumett, S.; Garcia-Hervia, L.; Gallo, J.; Bañobre-López, M.; Dražić, G.; Calhelha, R.C.; Ferreira, I.C.; Lima, R.; et al. Multifunctional graphene-based magnetic nanocarriers for combined hyperthermia and dual stimuli-responsive drug delivery. Mater. Sci. Eng. C 2018, 93, 206–217. [Google Scholar] [CrossRef] [PubMed] [Green Version]
  21. Button, V. Principles of Measurement and Transduction of Biomedical Variables; Academic Press: New York, NY, USA, 2015. [Google Scholar]
  22. Geninatti, T.; Bruno, G.; Barile, B.; Hood, R.L.; Farina, M.; Schmulen, J.; Canavese, G.; Grattoni, A. Impedance characterization, degradation, and in vitro biocompatibility for platinum electrodes on BioMEMS. Biomed. Microdevices 2015, 17, 1–11. [Google Scholar] [CrossRef] [Green Version]
  23. Lee, C.; Shen, C.; Cheng, Y.; Chang, Y. Flexible Pressure, Temperature, and Flow Microsensors for Integration in Methanol Microreformer. Sens. Mater. 2013, 25, 411–416. [Google Scholar]
  24. Lee, C.-Y.; Lee, S.-J.; Hung, Y.-M.; Hsieh, C.-T.; Chang, Y.-M.; Huang, Y.-T.; Lin, J.-T.; Physical, A.A. Integrated microsensor for real-time microscopic monitoring of local temperature, voltage and current inside lithium ion battery. Sens. Actuator A Phys. 2017, 253, 59–68. [Google Scholar] [CrossRef]
  25. Sen, S.; Pan, T.; Ghosal, P. An improved lead wire compensation technique for conventional four wire resistance temperature detectors (RTDs). Measurement 2011, 44, 842–846. [Google Scholar] [CrossRef]
  26. Raijmakers, L.; Danilov, D.; Eichel, R.-A.; Notten, P. A review on various temperature-indication methods for Li-ion batteries. Appl. Energy 2019, 240, 918–945. [Google Scholar] [CrossRef]
Figure 1. Schematic representation of the temperature sensors integrated in the organ-on-a-chip.
Applsci 11 03864 g001
Figure 2. Schematic representation of the overall geometry of the temperature microsensors.
Applsci 11 03864 g002
Figure 3. Simulated microsensor (24 windings) self-heating with respect to excitation current.
Applsci 11 03864 g003
Figure 4. Comparative study of the sensor’s sensitivities from the simulations results.
Applsci 11 03864 g004
Figure 5. Schematic diagram of temperature microsensors patterning process: (a) glass wafer; (b) LOR1A-SB200 lift-off resist; (c) AZ4110 positive photoresist; (d) UV exposure; (e1) developed resist and (e2) LOR; (f) platinum deposition; (g) removal of the lift-off resist; and (h) deposition of SiO2.
Applsci 11 03864 g005
Figure 6. (a) Photographs of the fabricated temperature microsensors and (b) detail of the different windings (line width and spacing of 10 µm).
Applsci 11 03864 g006
Figure 7. Experimental setup used for the temperature microsensors characterization.
Applsci 11 03864 g007
Figure 8. Schematic of the readout and control electronics for temperature microsensors.
Applsci 11 03864 g008
Figure 9. Experimental characterization of the microsensor with 24 windings using different excitation currents.
Applsci 11 03864 g009
Figure 10. Experimental sensitivity of the sensors for the different fabricated RTDs according to the windings number. Orange line represents an increase temperature from 35 to 45 °C, and black line a decrease temperature from 45 to 35 °C.
Applsci 11 03864 g010
Figure 11. Comparative study of the sensors sensitivities obtained in the experimental results.
Applsci 11 03864 g011
Figure 12. (a) Microsensor response with implemented electronics to temperature variation from 15 to 50 °C. (b) Dynamic test.
Applsci 11 03864 g012
Table 1. Geometrical dimensions of each fabricated sensor.
Number of Windings in the Meander-Shaped GeometryWidth (µm)Length (µm)Area (µm2)
540019076,000
8400310124,000
12400470470,000
16400630252,000
20400790316,000
24400950380,000
Table 2. Sensor’s sensitivity of each sensor.
Number of Windings in the Meander-Shaped GeometrySimulated Sensor’s Sensitivity (mV/°C)Experimental Sensor’s Sensitivity (mV/°C)
50.10220.0719
80.14860.1126
120.21080.1683
160.27300.2258
200.33450.3052
240.39660.3542
Publisher’s Note: MDPI stays neutral with regard to jurisdictional claims in published maps and institutional affiliations.

