Review

Animal Protein Sources as a Substitute for Fishmeal in Aquaculture Diets: A Systematic Review and Meta-Analysis

by
Rendani Luthada-Raswiswi
1,*,
Samson Mukaratirwa
2,3,* and
Gordon O’Brien
1,4
1
School of Life Sciences, College of Agriculture, Engineering and Science, Pietermaritzburg, University of KwaZulu Natal, Scottsville 3209, South Africa
2
School of Life Sciences, College of Agriculture, Engineering and Science, Westville Campus, University of KwaZulu Natal, Durban 4001, South Africa
3
One Health Center for Zoonoses and Tropical and Veterinary Medicine, School of Veterinary Medicine, Ross University, Basseterre KN0101, St Kitts
4
School of Biology and Environmental Sciences, Mpumalanga University, Mbombela 1200, South Africa
*
Authors to whom correspondence should be addressed.
Appl. Sci. 2021, 11(9), 3854; https://doi.org/10.3390/app11093854
Submission received: 4 November 2020 / Revised: 8 December 2020 / Accepted: 16 December 2020 / Published: 24 April 2021
(This article belongs to the Section Food Science and Technology)

Abstract

:
Fishmeal is the main source of dietary protein for most commercially farmed fish species. However, fishmeal prices have been raised even further because of competition with domestic animals, shortage in world fishmeal supply, and increased demand. Increased fishmeal prices have contributed to the quest for alternatives necessary to replace fishmeal as a global research priority. A literature search was conducted using these terms on Google Scholar and EBSCOhost; fishmeal replacement in fish feeds, fishmeal alternatives in fish feeds, animal protein sources in aquaculture, insects in fish feeds, terrestrial by-products, and fishery by-products. To calculate the variation between experiments, a random effect model was used. Results indicated that different fish species, sizes, and inclusion levels were used in the various studies and showed that the use of insects, terrestrial by-products, and fishery by-products has some limitations. Despite these drawbacks, the use of animal protein sources as a replacement for fishmeal in fish diets has had a positive impact on the feed conversion ratio, variable growth rate, final weight, and survival rate of different types of fish species of different size groups. Findings also showed that some animal by-products had not been assessed as a protein source in aquaculture or animal feeds, and future studies are recommended.

1. Introduction

In terms of species cultured and production systems used, aquaculture is a diverse industry [1]. According to [2], by producing fish with minimal environmental impact and maximum benefit for society, aquaculture is predicted to contribute more effectively to economic development, international food safety, nutritional well-being, and poverty reduction. Regardless of the cultivated systems within which fish are grown and species involved, production, growth, and health of fish depend totally on a supply of adequate nutrients both in quantity and quality [3]. The quality of the protein ingredient used in feed formulation is generally known to have effects on the nutritional value of fish diets produced [4]. According to [5], aquaculture production (66 million tons) exceeded global beef production (63 million tons) for the first time in 2012. Increased aquaculture production means that more than half of the fish being consumed by humans worldwide is produced by aquaculture [6]. The demand for feed resources, particularly for prime quality protein fishmeal, has increased because of the global supply of fish as aquaculture production increases [3].
For both carnivorous and omnivorous species used in aquaculture, fishmeal has been used as an essential protein source, and many aquaculture formulations/feeds have a higher percentage of fishmeal than feeds of other animal species [7]. Fluctuations in supply, price, and quality of fishmeal present considerable risks because fishmeal is dependable solely on an ingredient by people. Therefore, the identification, development, and utilization of alternatives to fishmeal in diets in aquaculture remain a high priority as a risk reduction strategy [8]. Competitive price, full availability, ease of handling, shipping, storage, and use in feed production are features that a candidate ingredient must possess to be a viable alternative feedstuff to fishmeal in aquaculture feeds [9]. Additionally, it should have high protein content, favorable amino acid profile, high nutrient digestibility, low fiber levels, starch, non-soluble carbohydrates, which are nutritional characteristics [9].
The more expensive fishmeal has been replaced by several sources of plant protein, single-cell protein, and animal protein in part or in full [10]. Due to higher protein and lipid content, superior essential amino acids, and excellent palatability, animal protein sources have commonly been considered ideal substitute protein sources to replace fishmeal in formulating fish diets [11,12]. According to [13], animal-derived protein demand is expected to double by 2050 globally. Furthermore, future needs for both food and feed are expected to grow by 70%. According to [14], to provide the mandatory quantities of high-quality protein to fulfill the increasing demand, new initiatives are needed. Several animal protein sources from insects, land by-products and fisheries by-products have been evaluated as possible feed ingredients in fish production [15,16,17,18,19]. However, no documented studies comparing animal protein sources in diet and control diet. The purpose of this study was to conduct a systematic review of published articles on animal protein sources used in aquaculture and assess the results of recommended diets against the control diet.

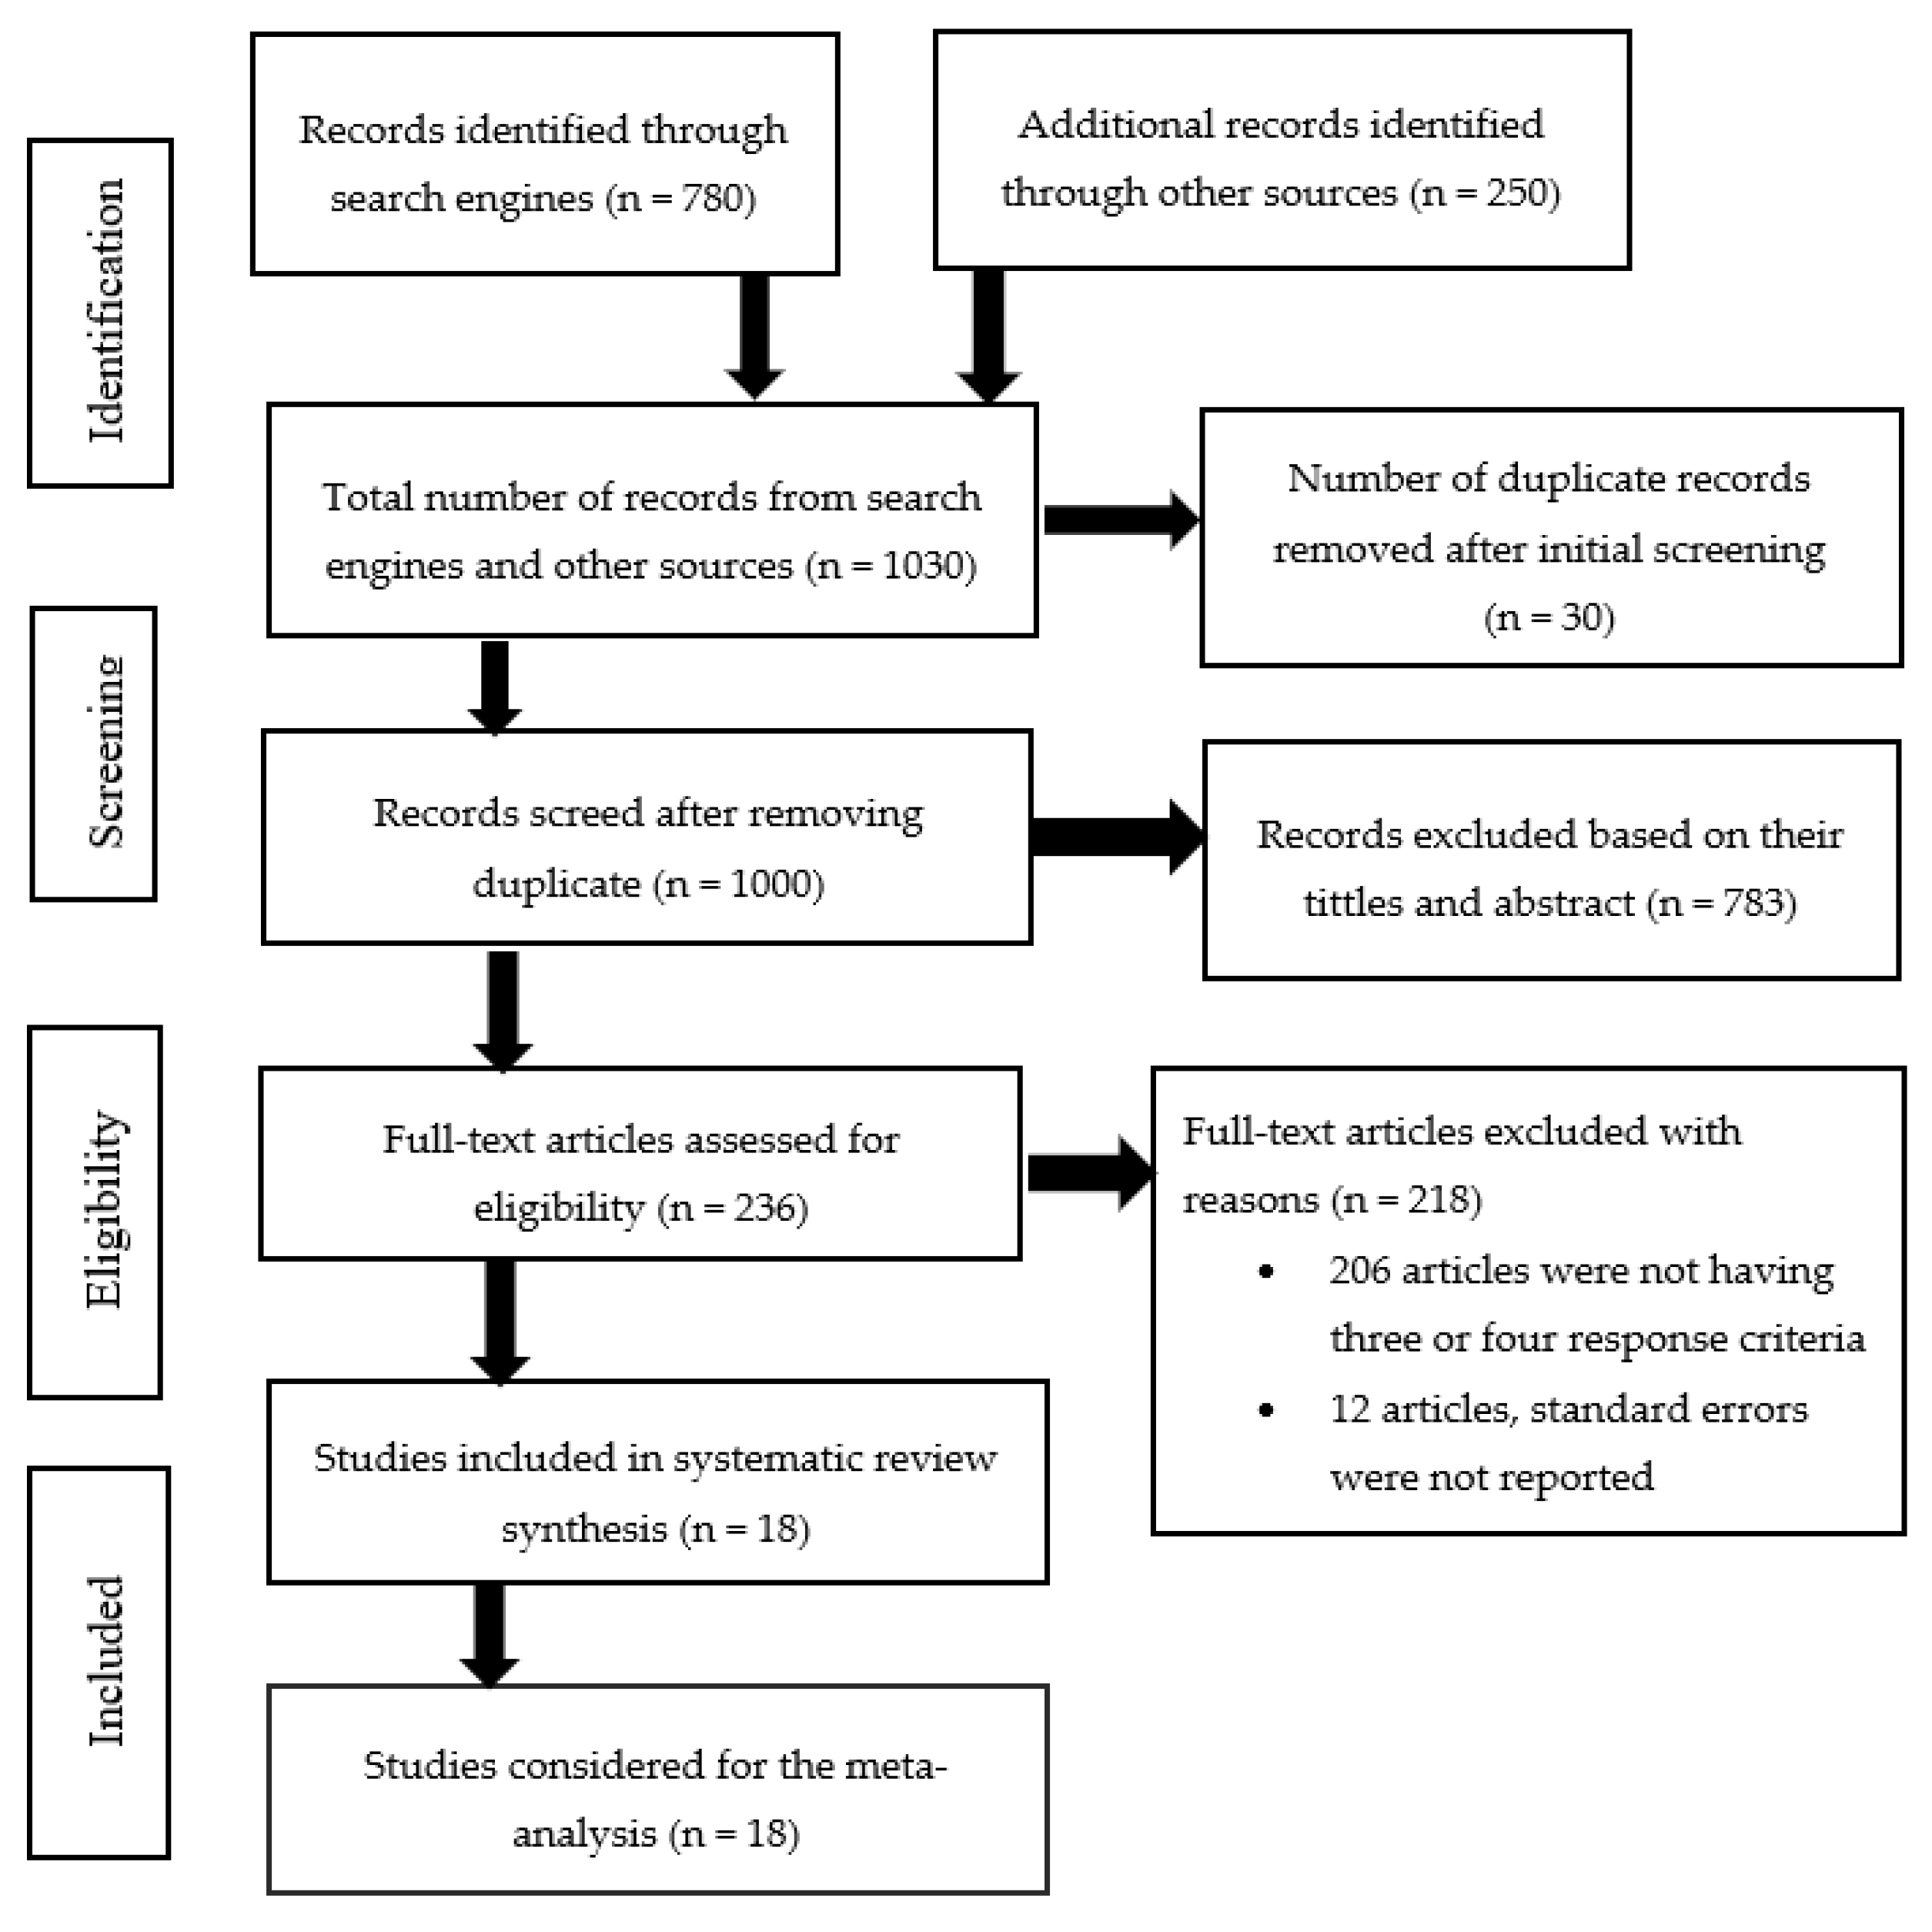
2. Materials and Methods

A systematic search of published literature on Google Scholar and EBSCOhost from 1999 to 2019 was carried out using the following terms or phrases: Fishmeal replacements in fish feeds, fishmeal alternatives in fish diets, animal protein sources in aquaculture, insects in fish feeds, terrestrial by-product, and fishery by-products. By reading through the titles and abstracts, the papers were found and screened. In addition, of the selected articles, the reference and bibliographic lists were screened as potential leads to additional relevant studies for inclusion. In Endnote reference manager version x7.7.1 (Clarivate Analytics, Philadelphia, PA, USA), full-text articles for studies including animal protein sources, were retrieved and managed. An article was included in the review if published between 1999 and 2019 and reported on 3 or all 4 of the following on experimental animals: Specific growth rate, final weight, feed conversion ratio, and survival rate. Studies with less than 4 protein levels tested, and those with no standard error on results were excluded. Furthermore, editorial material, book chapters, and conference papers were excluded. Meta-analysis was conducted for final weight, specific growth rate, feed conversion ratio, and survival rate, separately in a Microsoft Excel Spreadsheet using formulas and procedure described by [20] as follows after entering study Authors and year, events, and sample size for each study included:
  • Calculated the outcome (es) = number of events/the sample size
  • Calculated Standard Error (SE) = Square root of the outcomes/sample size
  • Variance (Var) =SE2
  • Computed the individual study weights (W) = 1/SE2
  • Computed each weighted effect size (W*es) =each effect size multiplied by study weight
  • W*es2 and W2 were calculated.
All values of each variable were added to have the sum.
7.
Calculated Q = ∑(W*ES2)-[∑(W*ES)]2/∑W, Q test to measure heterogeneity among studies.
8.
I2 index = (Q-degree of freedom (df)/Q*100, was calculated to quantify heterogeneity, Degree of freedom (df) was calculated as the total number of studies minus 1. If values of I2 index were 0%, ≤25%, 50%, or 75%, the I2 index was interpreted as no, low, moderate, or high heterogeneity, respectively.
9.
Decided on the effect summary model. Random Effect Model was used because we assumed that the variability in studies was not due to sampling errors only but also in the population of effects. Furthermore, the Random Effect Model was used to measure the variability between studies, considering that other studies, which were not included in the meta-analysis at hand, could be unpublished, ignored in the systematic literature quest, or to be conducted in the future [21]. The weight of each study was adjusted with a constant (V) = Q-df)/∑W-(∑W2/∑W). However, we computed w2 first and then the sum of w2, (∑W2), which was not computed yet.
10.
New weight for each study was calculated using Wv = 1/(SE2 + V).
11.
Weighted effect size (W*es), W*es2, Wv2, Qv, and I2v were computed using the new weight (Wv) as in steps 5–8.
12.
Calculated the effect summary as esv = ∑(Wv*es)/∑Wv and standard error as SEesv = √1/∑Wv
13.
The lower and upper confidence intervals were calculated as esv − (1.96*SEesv) and esv + (1.96*SEesv), respectively.
14.
Figures in results (excluding Figure 1) were drawn using the weights, prevalence, and confidence intervals calculated above.

3. Results

There were 1030 articles obtained from search engines, and additional records were identified through other sources. There were 30 articles removed as duplicates after initial screening. Based on their names and abstracts, 783 publications were omitted because they did not follow the requirements of reporting on three or all four of the following on experimental animals: Specific growth rate, final weight, feed conversion ratio, and survival rate, have four or more protein levels tested, and others have no standard error on results. Eligibility was evaluated for 217 articles, and 18 articles were included in the systematic review and meta-analysis (Figure 1).

3.1. Fish Species Used and Recommended Levels of Animal Protein Sources

Results from the review articles showed that animal protein sources replacing fishmeal ranged from insects (Mopane worms (Imbrasia belina), grasshoppers (Zonocerus variegatus), field crickets (Gryllus bimaculatus), blowfly maggot (Chrysomya megacephala), black soldier fly (Hermetia illucens) and superworm (Zophobas morio), terrestrial animal by-products (fermented feather meal, feather meal, poultry by-products, meat and bone meal, and blood meal), and fishery by-products (fish silage, shrimp head meal and krill meal) (Table 1). Furthermore, a variety of fish species such as Oreochromis mossambicus, Clarias gariepinus, Oreochromis niloticus, Sparus aurata, Dicentrarchus labrax, Scophthamus maeotinus, Lutjanus guttatus, Ophiocephalus argus, Red tilapia (O. mossambicus × O. niloticus × Oreochromis aureus), and Acipenser glueldenstaedtii (which were not selected but reported because it is important to know when reporting for protein sources used) have been used. Animal protein sources inclusion levels in the diets ranged from 0%, 5%, 10%, 20%, 25%, 30%, 40%, 50%, 60%, 75%, to 100%. Recommended levels of animal protein sources in feeds were 20% for feather and shrimp head meal for C. gariepinus, 20% of meat and bone meal for Op. argus, 25% of superworm, poultry by-product and grasshopper meal for L. guttatus and C. gariepinus respectively, 30% of krill meal for A. glueldenstaedtii, 20–50% of fermented feather meal for O. niloticus, 50% of poultry by-products and fish silage for O. niloticus and Red tilapia (O. mossambicus × O. niloticus × O. aureus), respectively, 60% of mopane worm meal for O. mossambicus and 100% of field cricket meal for C. gariepinus.

3.2. Values for Final Weight, Specific Growth Rate, Feed Conversion Ratio, and Survival Ratio
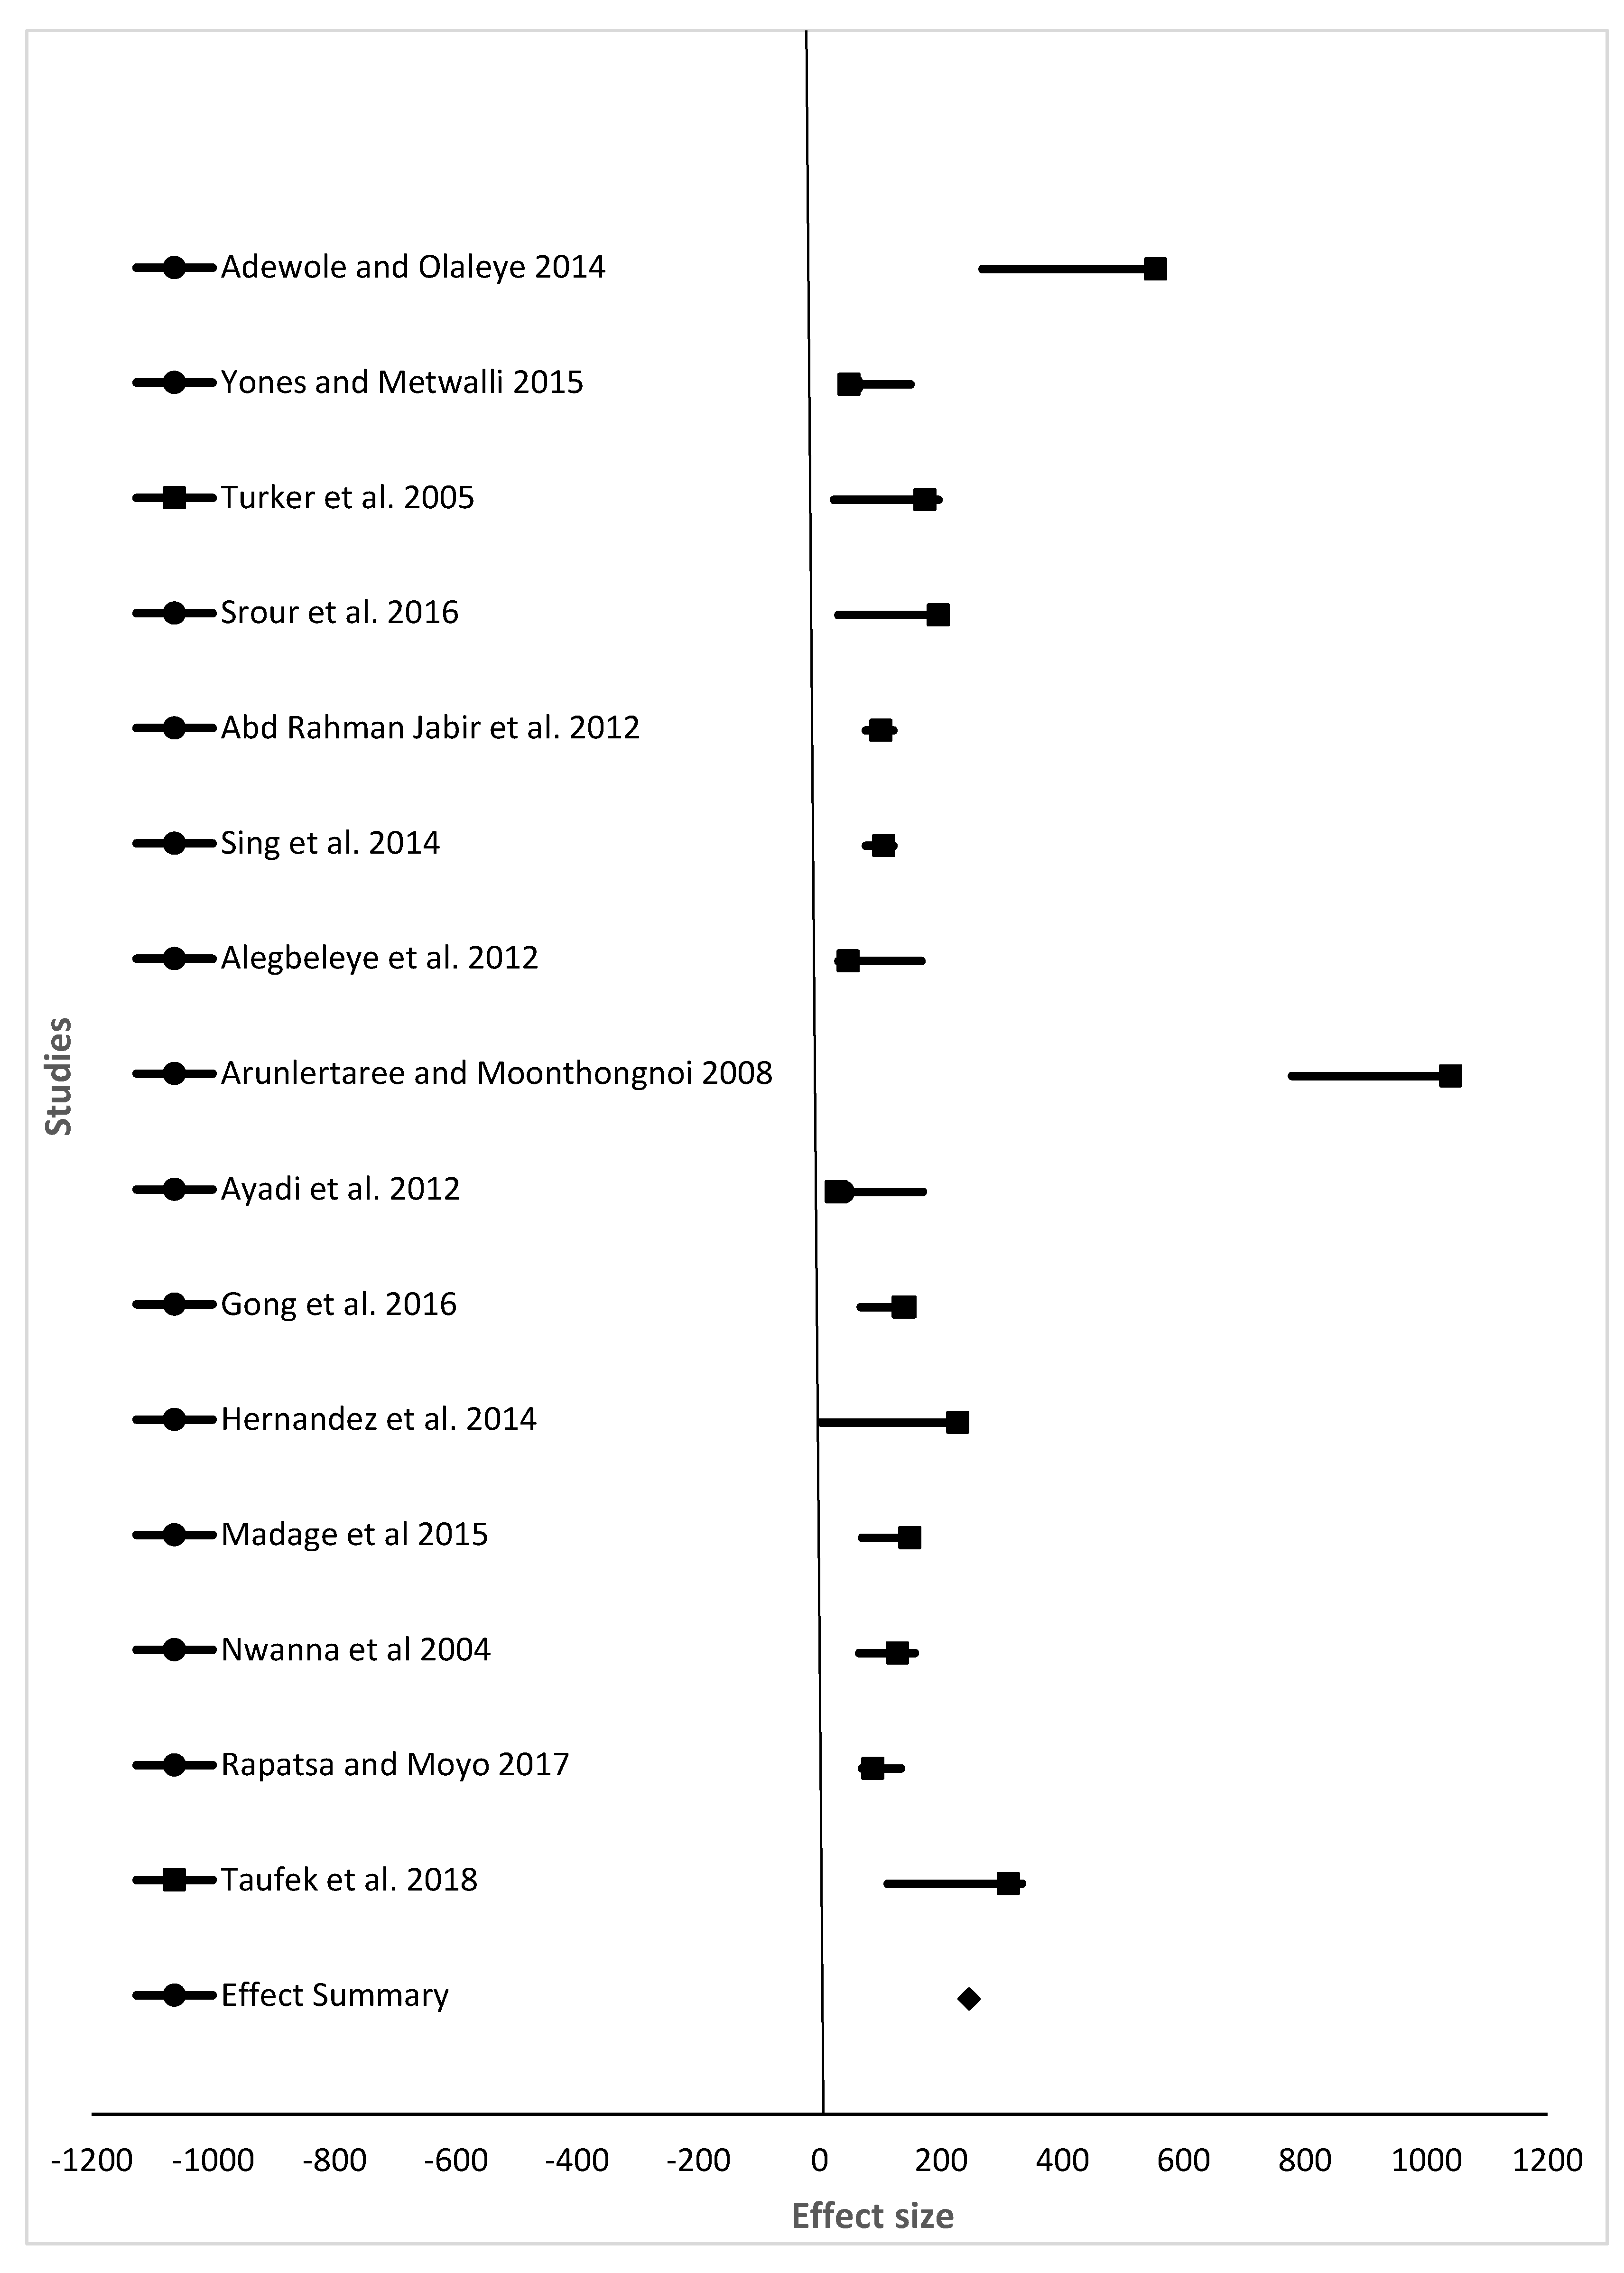
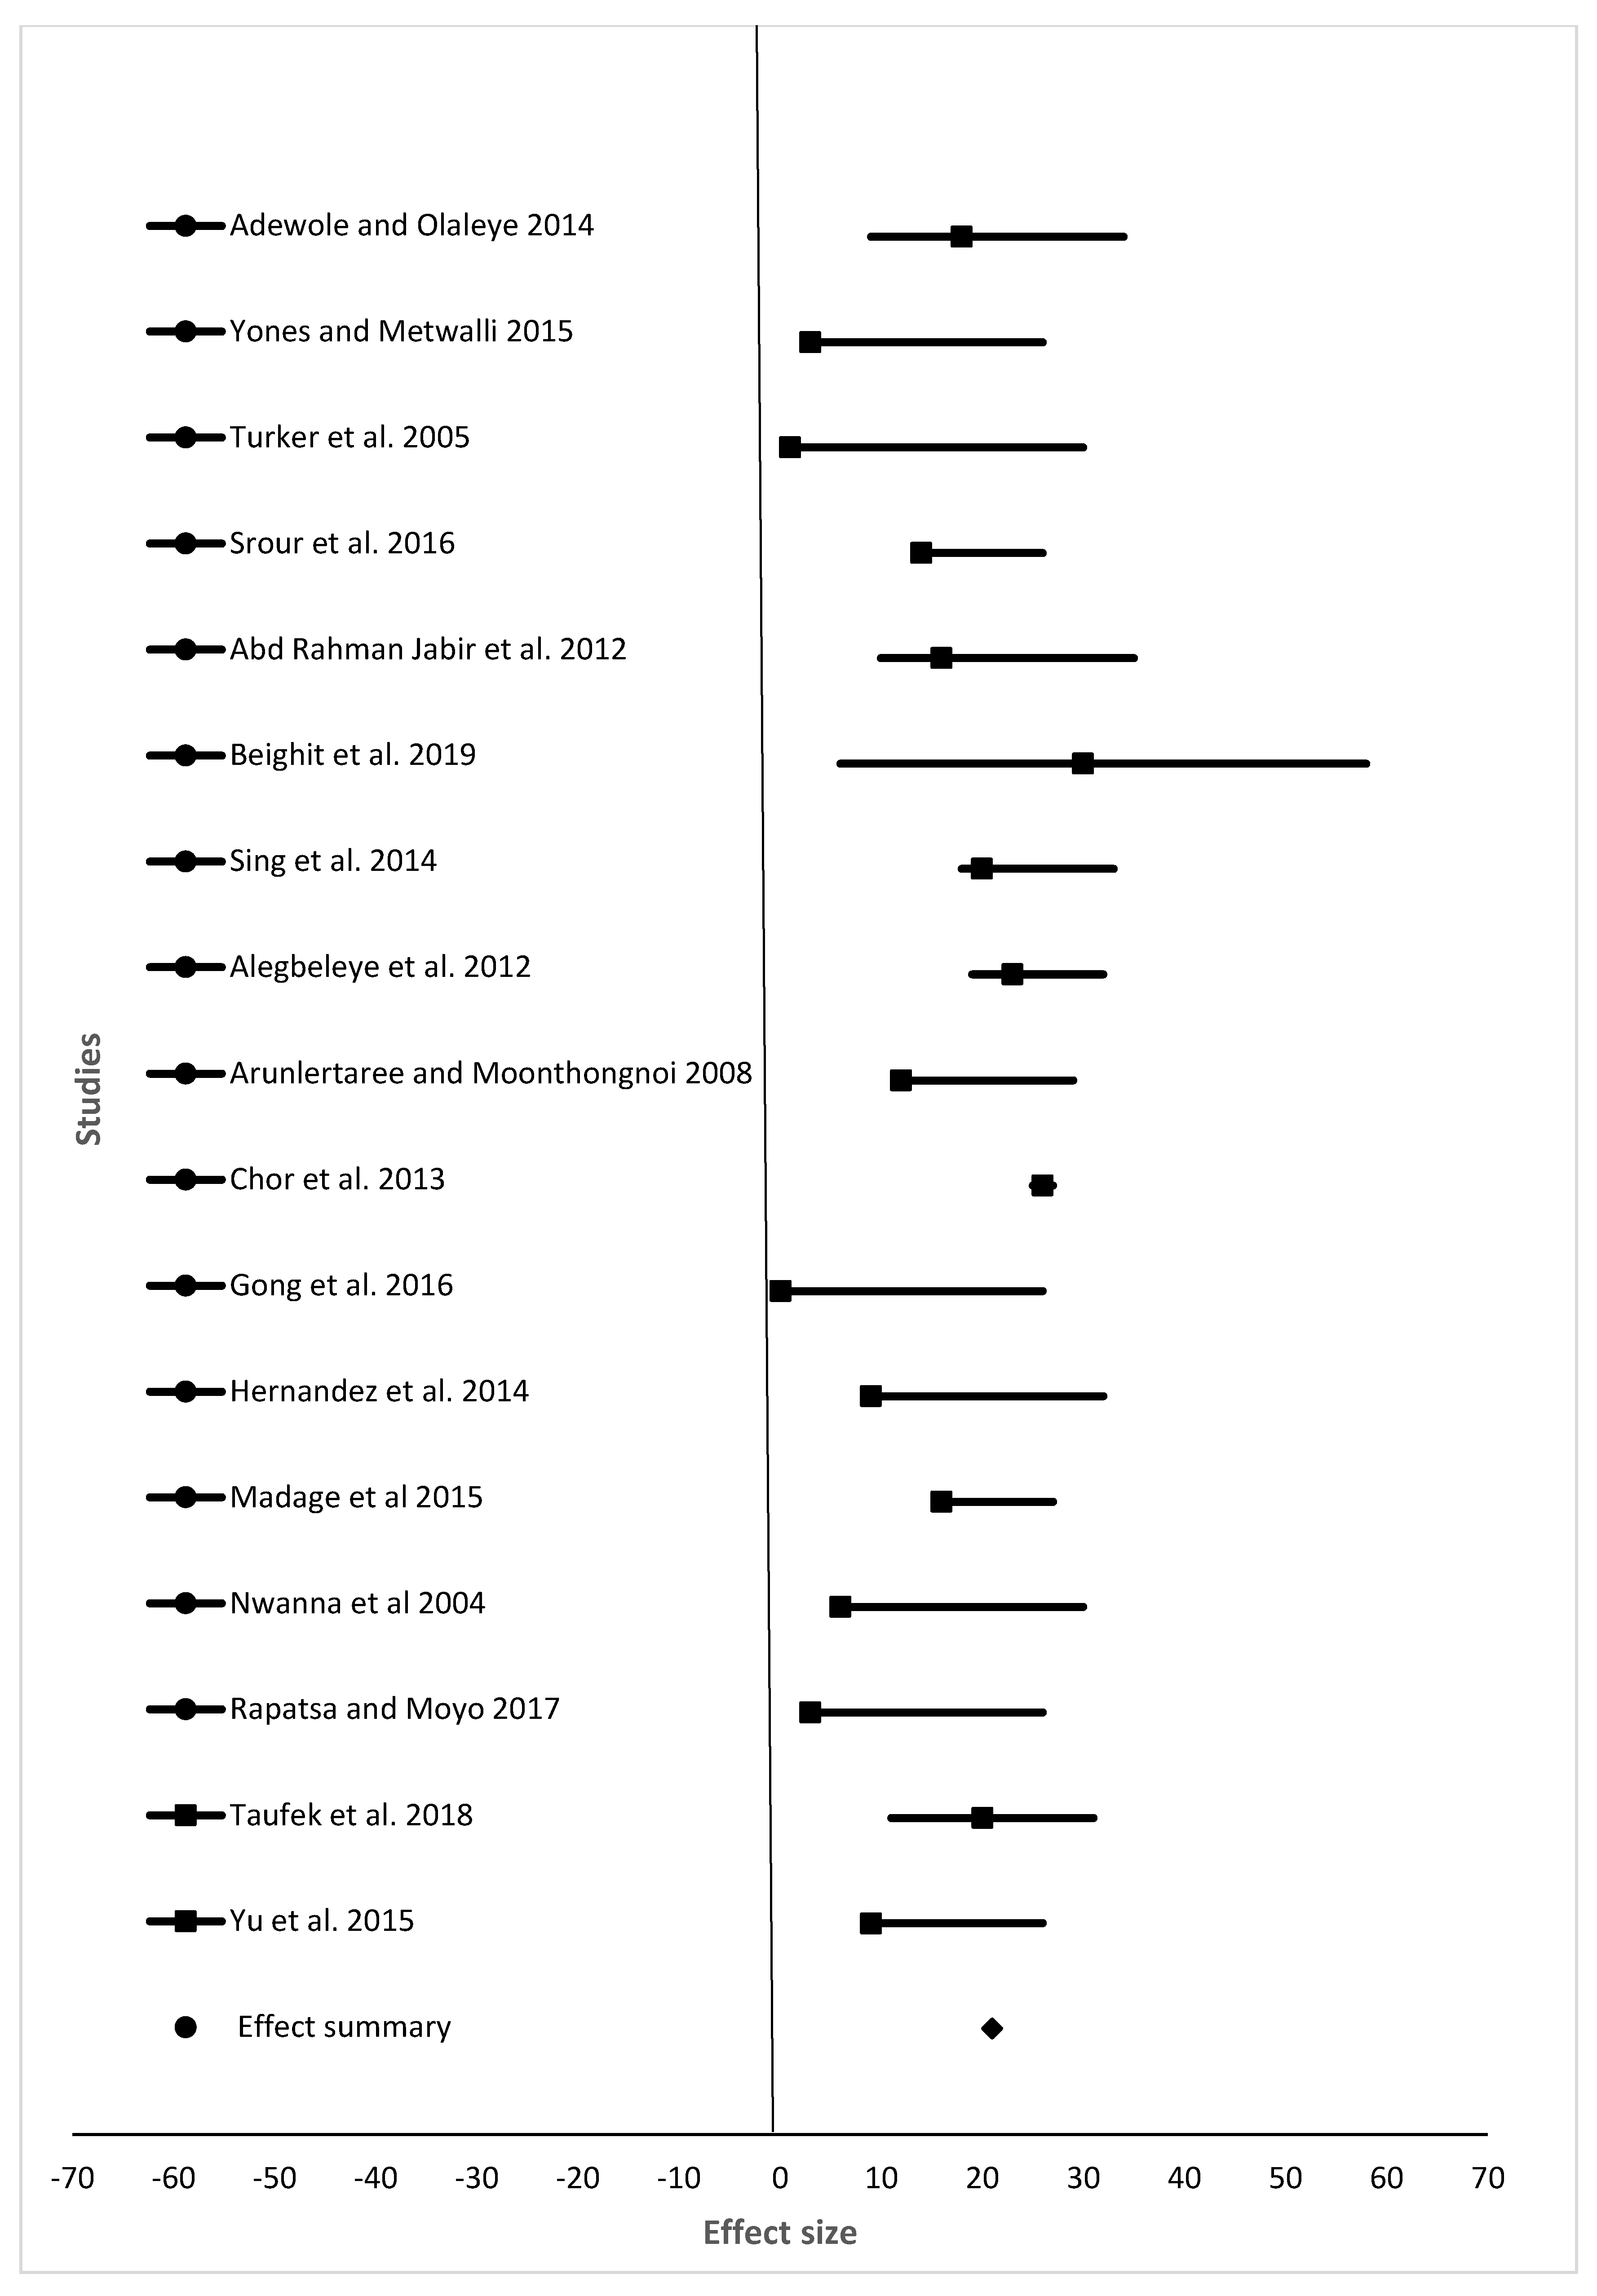
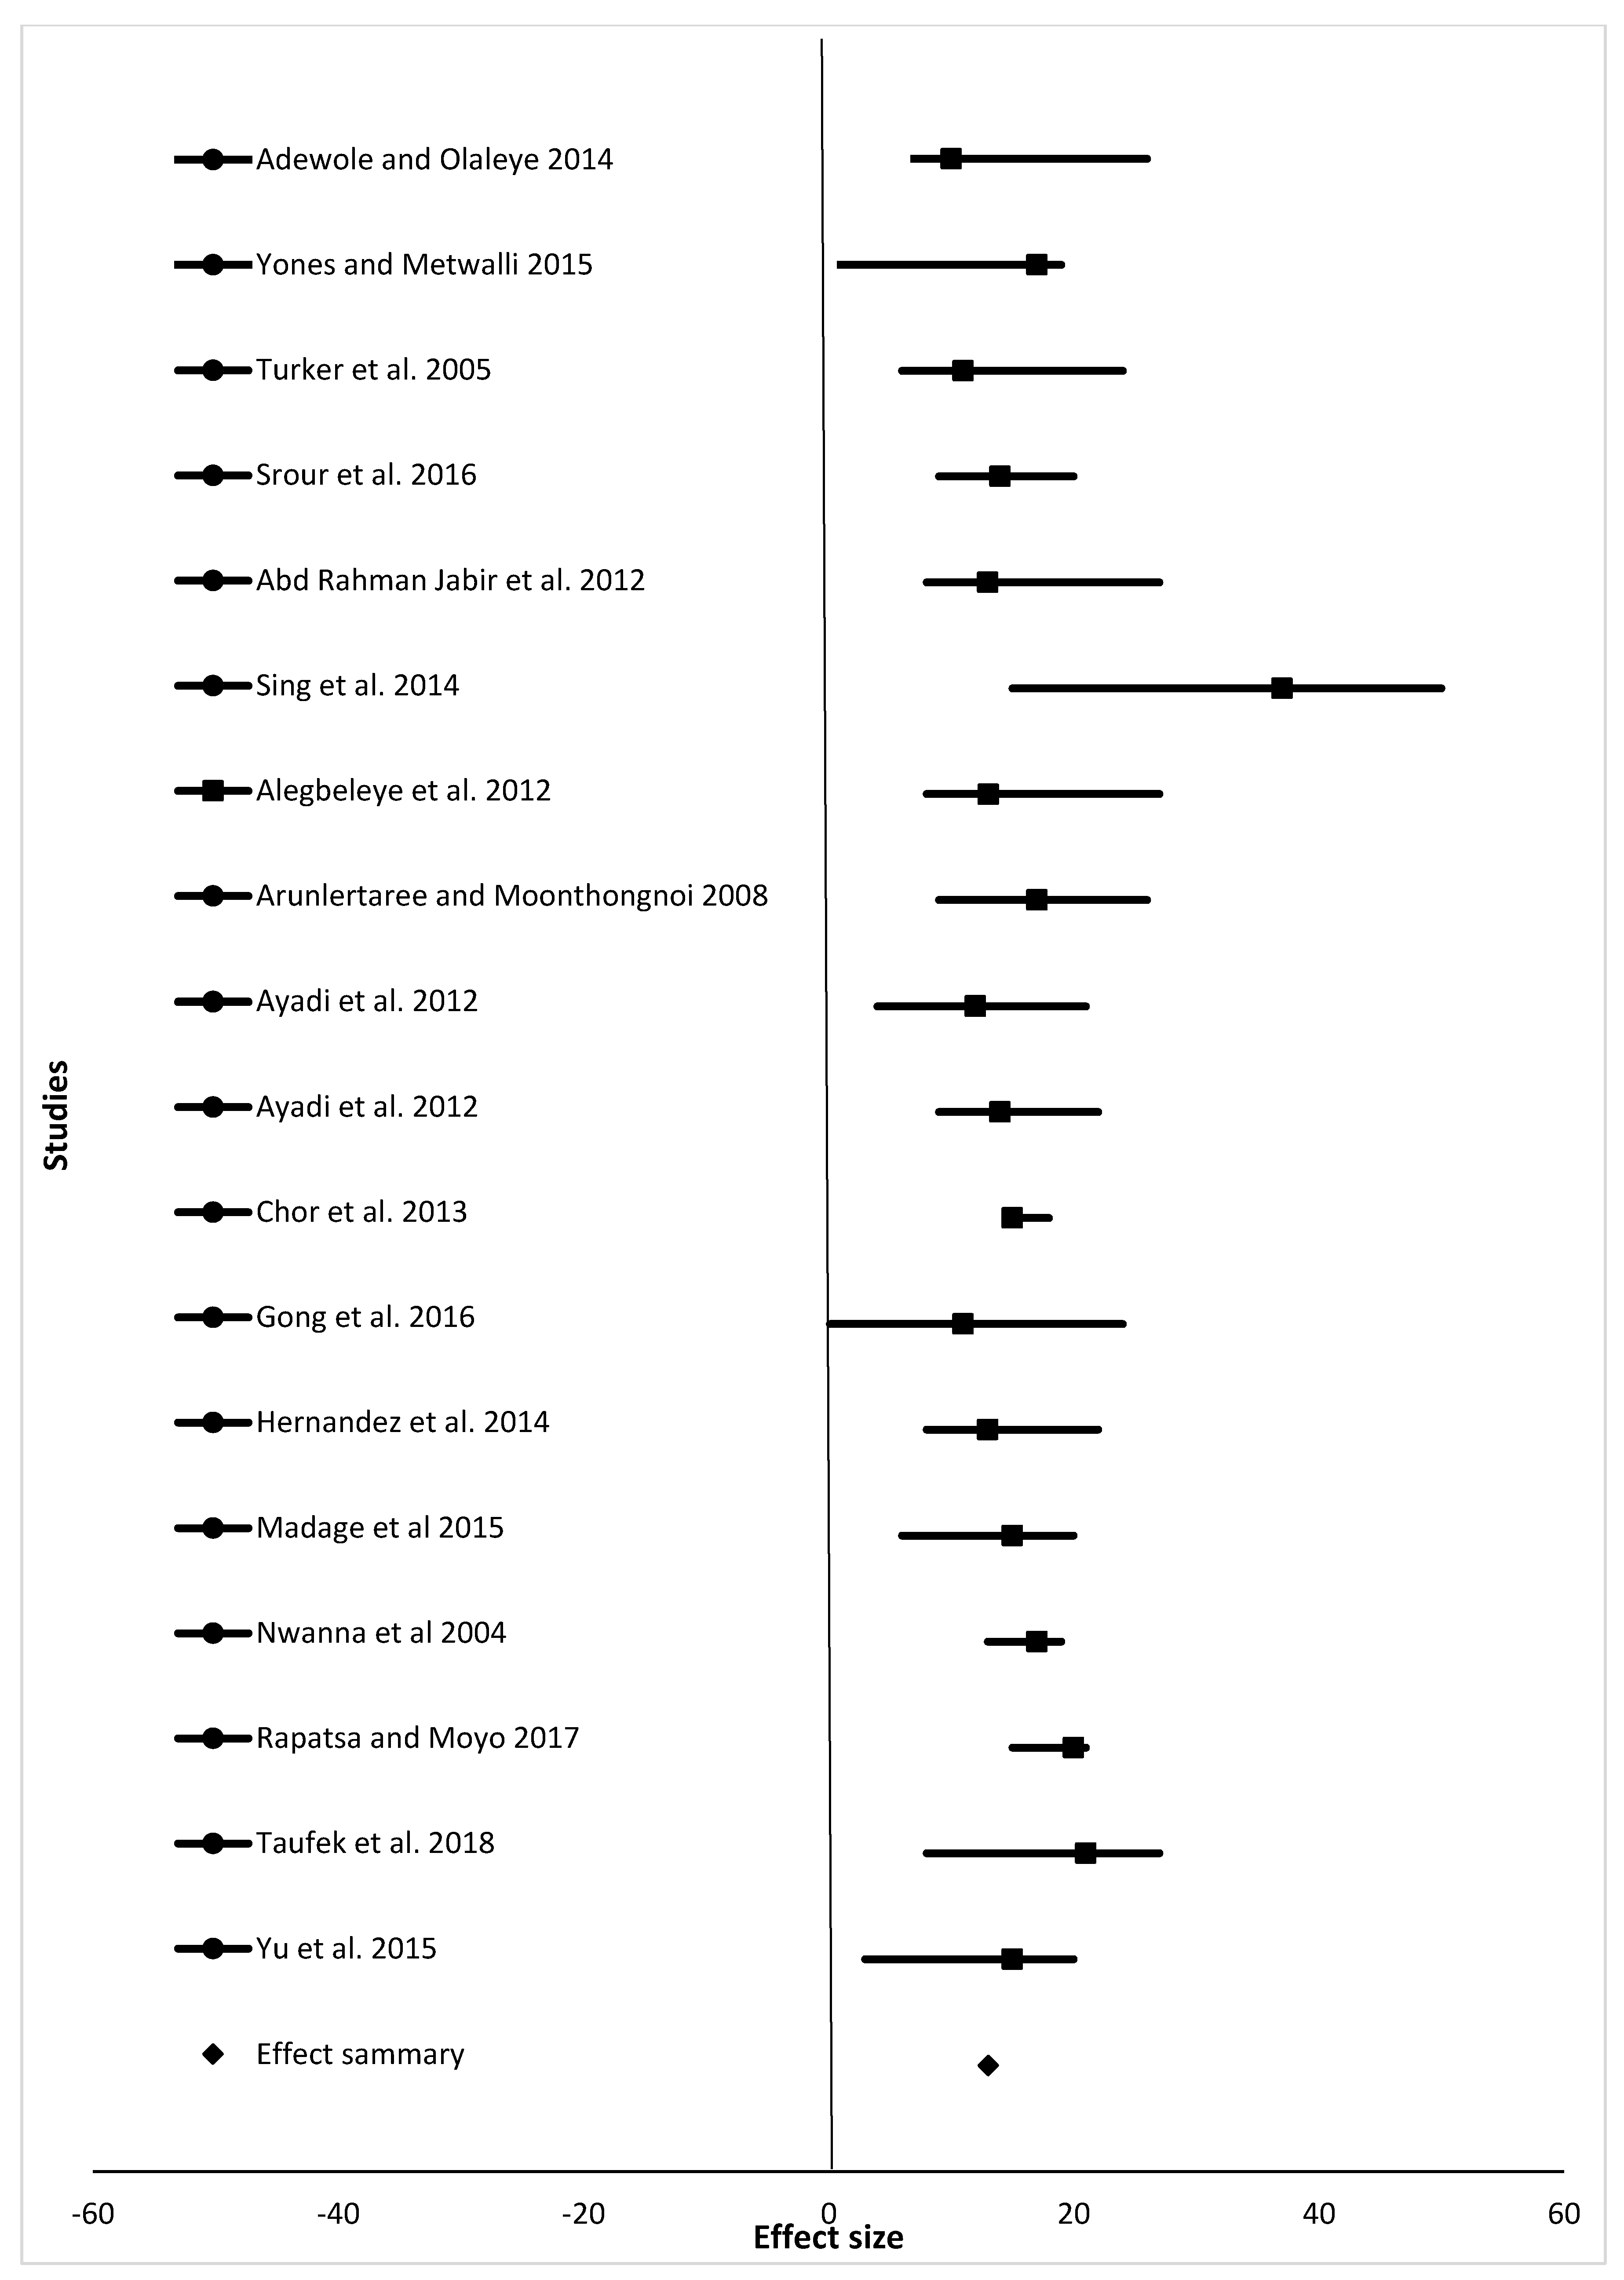
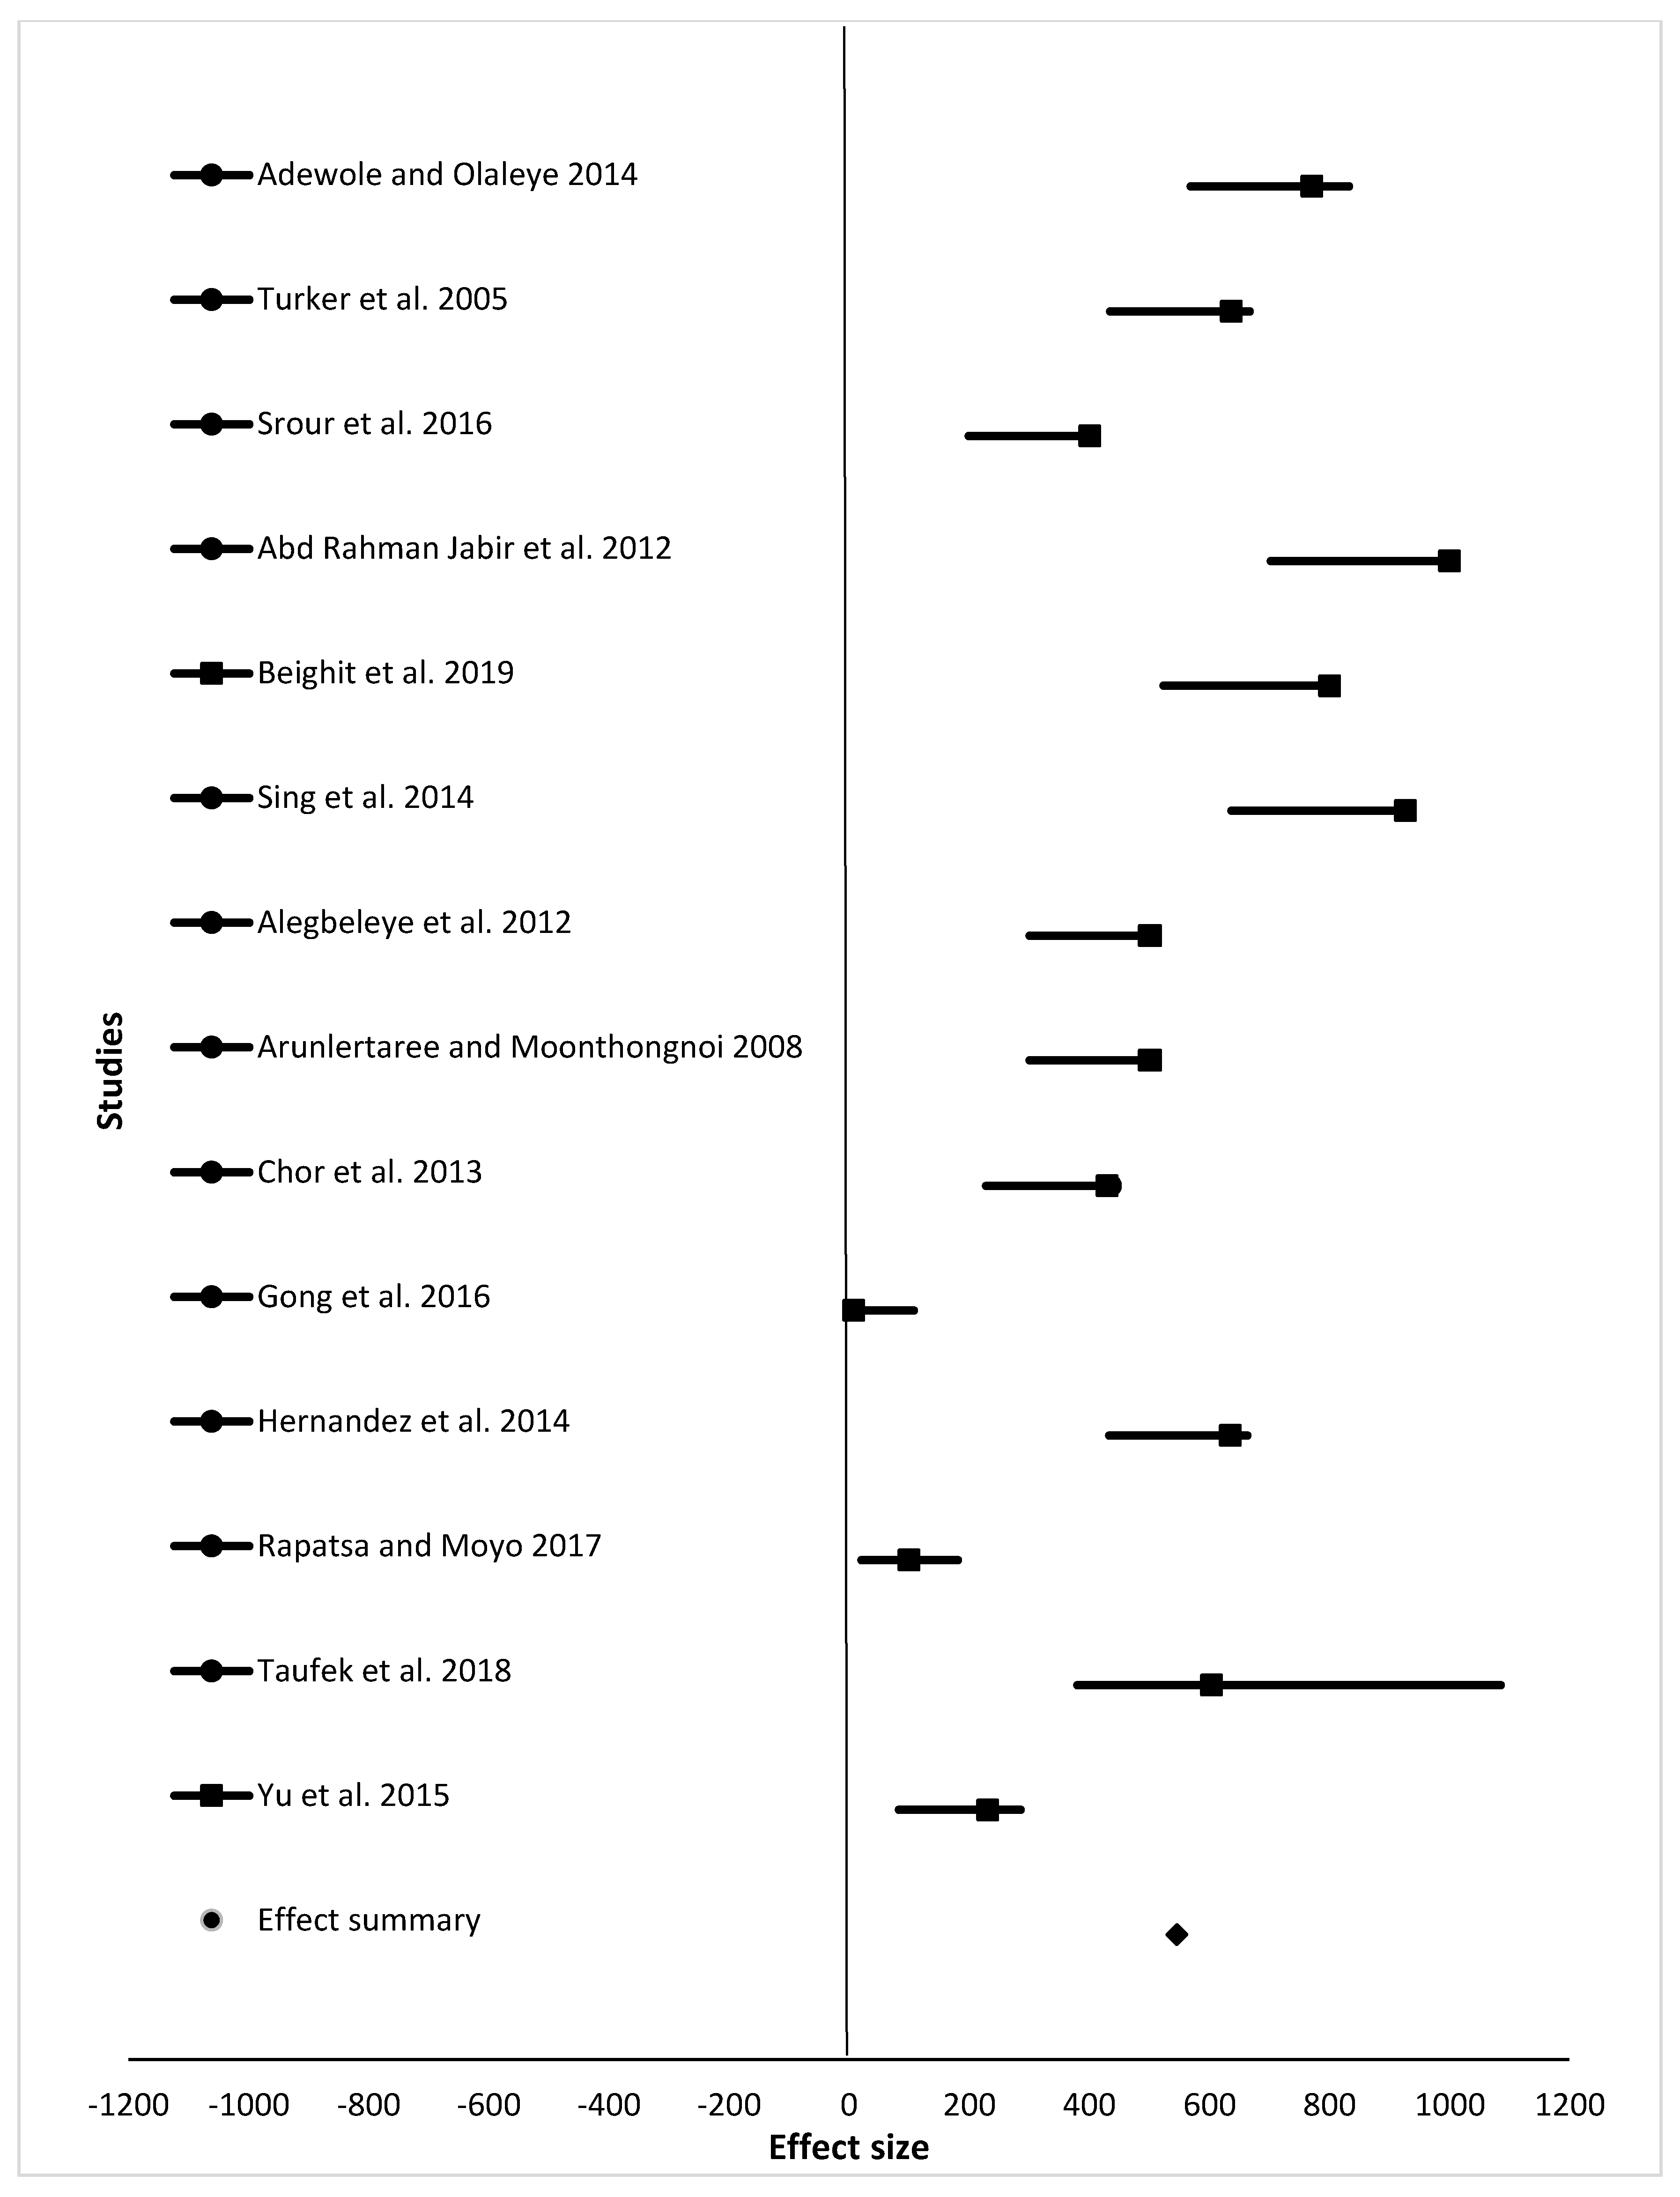
Values for final weight, specific growth rate, feed conversion ratio, and survival ratio for recommended levels of animal protein sources in feeds for different fish species are shown in Table 1. Assessment of the initial and final weights for all recommended levels of animal protein sources fed showed weight gain for all fish species involved in the experiments (Table 1). The specific growth rate ranged from 0.56% to 7.89%. Feed conversion ratios of 1.25, 1.51, and 2.20 were reported for O. mossambicus, C. gariepinus, and C. gariepinus, which were fed insect meal (I. belina, Z. variegatus, and G. bimaculatus), respectively. For terrestrial by-products (fermented feather meal, feather meal, poultry by-products, poultry by-products, and meat and bone meal), feed conversion ratios of 1.73, 1.34, 1.20, 140, and 1.24 were obtained for O. niloticus, C. gariepinus, L. guttatus, O. niloticus, and Op. argus, respectively. Feed conversion ratios of 1.35, 2.50, and 1.10 were obtained in Red tilapia (O. mossambicus × O. niloticus × O. aureus), C. gariepinus, and A. glueldenstaedtii fed fishery-by products (fish silage, shrimp head meal, and krill meal), respectively. Survival rate ranged from 83% to 100%, except for Red tilapia (O. mossambicus × O. niloticus × O. aureus) and C. gariepinus, which were fed fish silage and shrimp head meal, respectively, where the survival rate was not reported.

3.3. Meta-Analysis

For the meta-analysis, data from studies analyzed were grouped into final weight, specific growth rate, feed conversion ratio, and survival rate (Table 2, which summarizes results shown in Figure 2, Figure 3, Figure 4 and Figure 5). Samples analyzed were 1335, 1430, 1450, and 1307 for final weight, specific growth rate, feed conversion ratio, and survival rate, respectively. Results showed the overall effect size of 9015 (95% confidence interval (CI) 6,110,058.3 to 6,110,177.58), 10 (95% CI 32 to 21), 10 (95% CI 24 to 13), and 546 (95% CI 350 to 572) for final weight, specific growth rate, feed conversion ratio, and survival rate, respectively (Figure 2, Figure 3, Figure 4 and Figure 5). Effect summary for all Figure 2, Figure 3, Figure 4 and Figure 5 do not touch or cross the center line, meaning that meta-analysis results indicate a statistically significant difference. The level of heterogeneity observed were I2 = 99.70%, I2 = −17.73%, I2 = −25.79%, and I2 = 101.08% for final weight, specific growth rate, feed conversion ratio, and survival rate, respectively (Table 2).

4. Discussion

From the results of this review, a variety of fish species, sizes, and inclusion levels have been used in aquaculture (Table 1). A variety of fish species, sizes, and inclusion levels may be because aquaculture is an incredibly diverse industry in terms of species cultured and production systems used [1]. Different fish species have different nutrients requirements [37], which affect the level of protein source inclusion in tested diets. According to [38], human health benefits, competitive price, fish safety, efficiency, customer acceptance, minimal contamination, and ecosystem stress are factors in selecting feeds.
Growth performance measured by final weight and specific growth rate showed that excess protein could not be used efficiently for growth because of growth energy used for the deamination and excretion of absorbed excess amino acids. After all, each fish species had a specific protein limit [39]. According to [40,41,42,43], when dietary protein levels increase, the feed conversion ratio decreases. Results from this review indicated that O. mossambicus and C. gariepinus fed insect meal (I. belina, Z. variegatus and G. bimaculatus), respectively, converted their feeds efficiently. Both freshwater and marine fish species utilize insects as part of their natural diet [44]. Insects are rich in amino acids, lipids, vitamins, and minerals [45], and they do not require arable land, water, or energy to reproduce [46]. Besides, insects are more natural to replicate, have a higher growth rate, and very effectively transform low-grade or organic matter into high-value protein quite efficiently [44,47].
Recommended levels reported for insect meal in this review shows that a total fishmeal replacement has not been successful. Results support findings reported by [44], who suggested dietary unbalance or deficiencies as the main reason. According to [48], limitations of using insects include their (i) varying nutritional value, which is dependent on the species, stage of development, and the substrate used to feed the insect, (ii) low concentration of sulfur-containing amino acids, and (iii) absence of eicosapentaenoic and docosahexaenoic.
Oreochromis niloticus, C. gariepinus, L. guttatus, O. niloticus, and Op. argus also efficiently converted terrestrial by-products (fermented feather meal, feather meal, poultry by-products, poultry by-products, and meat and bone meal). Like other animal protein sources, fishery by-products (fish silage, shrimp head meal, and krill meal), fed to Red tilapia (O. mossambicus × O. niloticus × O. aureus), C. gariepinus and A. glueldenstaedtii, respectively resulted in acceptable feed conversion ratios of 1.35, 2.50, and 1.10, respectively. Survival rates ranged from 83% to 100%, except for Red tilapia (O. mossambicus × O. niloticus × O. aureus) and C. gariepinus, which was not reported.
Fermented feather meal, blood meal, poultry by-products, feather meal, meat and bone meal are some of the terrestrial animal by-products used in aquaculture diets [15,16,17,18,19]. Terrestrial by-products have been reported to have great potential as fishmeal replacement because they are readily available, economical sources of protein and have more complete amino acid profiles than vegetable proteins [23]. The use of feather meal in aquaculture feeds is limited by the fact that fish are unable to digest it. Lysine, methionine, and isoleucine have been reported as limiting essential amino acids in poultry by-products, meat and bone meal, and blood meal, respectively [22]. Consumer acceptance is the primary constraint on the use of rendered animal products [23].
Fishery by-products are products generated from fishery industries [41]. Skin and fins, scales, heads and bones, viscera, and muscle trimmings are the main by-products produced in fishery industries with (1–3%), (5%), (9–15%), (12–18%), and (15–20%), respectively [41].
Scanty information is available for these by-products as a fishmeal replacement in fish feeds as they are considered waste [7]. Limiting factors of using fishery by-products include the cost of the collection of fish waste, timely processing, and quality control [49]. Furthermore, fish waste varies highly in its physical nature and proximate composition; and some fish waste such as from seafood is only available during the fishing season [17].
One of the advantages of meta-analysis is to increase the sample size. Samples analyzed in this study were 1335, 1430, 1450, and 1307 for final weight, specific growth rate, feed conversion ratio, and survival rate, respectively. Sample size differs due to the number of studies (15, 17, 18, and 14 for final weight, specific growth rate, feed conversion ratio, and survival rate, respectively) included in the meta-analysis. Results for final weight, specific growth rate, feed conversion ratio, and survival rate (Figure 2, Figure 3, Figure 4 and Figure 5), shows that there is a statistically significant difference among studies (the overall effect size of the overall effect size of 9015 (95% confidence interval (CI) 6110058.3 to 6110177.58), 10 (95% CI 32 to 21), 10 (95% CI 24 to 13), and 546 (95% CI 350 to 572) for final weight, specific growth rate, feed conversion ratio, and survival rate, respectively. The level of heterogeneity (I2 index) was very high for both the final weight and survival rate with values 99.98 and 101.08, respectively. There was no heterogeneity for both specific growth rate and feed conversion ratio, as their values for I2 index were I2 = −25.79% and I2 = −17.73%, respectively. Final weight, specific growth rate, feed conversion ratio and survival rate of fish in experiment or in farming in general are affected by many factors such as age of fish, fish species, stocking density, feeding level and frequency, protein source, and water quality parameters such as water temperature, dissolved oxygen, and pH. As shown in Table 1, variety of fish species, size, inclusion levels, recommended levels of protein found were reported, and these are the reasons our meta-analysis indicated heterogeneity in studies. Despite all the heterogeneity observed, these animal protein sources have shown positive effects on feed conversion ratio, specific growth rate, final weight, and survival of different fish species of different size groups.

5. Conclusions

Despite the limitations in the use of insects, terrestrial by-products, and fishery by-products as replacement of fishmeal, these animal protein sources have shown positive effects on feed conversion ratio, specific growth rate, final weight, and survival of different fish species of different size groups. However, future studies have recommended to (i) identify a fishmeal replacement that has no limitations, (ii) assessing the suitability of readily available animal meat or by-products as fishmeal replacement.

Author Contributions

Conceptualization, R.L.-R.; S.M. and G.O.; methodology, R.L.-R.; data collection, R.L.-R.; data analysis, R.L.-R.; writing—original draft preparation, R.L.-R.; writing—review and editing, S.M., G.O. and R.L.-R.; supervision, S.M. and G.O. All authors have read and agreed to the published version of the manuscript.

Funding

This research was funded by the Agribusiness Development Agency (ADA), Pietermaritzburg, South Africa as part of PhD studies for R.L.R, grant number CLI/03.

Acknowledgments

We would like to thank the Agribusiness Development Agency (ADA), Pietermaritzburg, South Africa for financial support.

Conflicts of Interest

The authors declare no conflict of interest. The funders had no role in the design of the study; in the collection, analyses, or interpretation of data; in the writing of the manuscript, or in the decision to publish the results.

References

  1. Bureau, D.P. Rendered products in fish aquaculture feeds. In Essential Rendering All about Animal by-Products Industry; Meeker, D.L., Ed.; National Renderers Association: Alexandria, VA, USA, 2006; pp. 179–184. ISBN 0-9654660-3-5. [Google Scholar]
  2. Subasinghe, R.; Soto, D.; Jia, J. Global aquaculture and its role in sustainable development. Rev. Aquac. 2009, 1, 2–9. [Google Scholar] [CrossRef]
  3. Tacon, A.G.; Metian, M. Global overview on the use of fish meal and fish oil in industrially compounded aquafeeds: Trends and Future Prospects. Aquaculture 2008, 285, 146–158. [Google Scholar] [CrossRef]
  4. Glencross, B.D.; Booth, M.; Allan, G.L. A feed is only as good as its ingredients–a review of ingredient evaluation strategies for aquaculture feeds. Aquac. Nutr. 2007, 13, 17–34. [Google Scholar] [CrossRef]
  5. Larsen, J.; Roney, J.M. Farmed Fish Production Overtakes Beef; Earth Policy Institute: Washington, DC, USA, 2013; Available online: https://resiliencesystem.org/farmed-fish-production-overtakes-beef (accessed on 8 October 2020).
  6. FAO; IFAD; WFP. The State of Food Insecurity in the World: Meeting the 2015 International Hunger Targets: Taking Stock of Uneven Progress; FAO: Rome, Italy, 2015; ISBN 978-92-5-108785-5. [Google Scholar]
  7. Sammadar, A. A review of fishmeal replacement with fermented biodegradable organic wastes in Aquaculture. Int. J. Fish. Aquat. Stud. 2018, 6, 203–208. Available online: www.fisheriesjournal.com/archives/2018/vol6issue6/partC/6-6-11-136.pdf (accessed on 8 October 2020).
  8. Hardy, R.W. Utilization of plant proteins in fish diets: Effects of global demand and supplies of fishmeal. Aquac. Res. 2010, 41, 770–776. [Google Scholar] [CrossRef]
  9. Gatlin, D.M.; Barrows, F.T.; Brown, P. Expanding the utilization of sustainable plant products in aquafeeds: A review. Aquac. Res. 2007, 38, 551–579. [Google Scholar] [CrossRef]
  10. Yigit, M.; Erdem, M.; Koshio, S.; Ergun, S. Substituting fish meal with poultry by-products meal in diets for black Sea turbot Psetta maeotica. Aquac. Nutr. 2006, 12, 340–347. [Google Scholar] [CrossRef]
  11. Robinson, E.H.; Li, M.H. Comparison of practical diets with and without animal protein at various concentrations of dietary protein on performance of channel catfish Ictalurus punctatus raised in earthen ponds. J. World Aquac. Soc. 1998, 29, 273–280. [Google Scholar] [CrossRef]
  12. Robinson, E.H.; Li, M.H. Evaluation of Practical Diets with Various Levels of Dietary Protein and Animal Protein for Pond-Raised Channel Catfish Ictalurus punctatus. J. World Aquac. Soc. 1999, 30, 147–153. [Google Scholar] [CrossRef]
  13. FAO; IFAD; WFP. The State of Food Insecurity in the World. The Multiple Dimensions of Food Security; FAO: Rome, Italy, 2013; ISBN 978-92-5-107917-1. [Google Scholar]
  14. Boland, M.J.; Rae, A.N.; Vereijkeh, J.M.; Meuwissen, M.P.M.; Fischer, A.R.H.; van Boekel, M.A.J.S.; Rutherfurd, S.M.; Gruppen, H.; Moughan, P.J.; Hendriks, W.H. The future supply of animal-derived protein for human consumption. Trends Food Sci. Technol. 2013, 29, 62–73. [Google Scholar] [CrossRef]
  15. Arunlertaree, C.; Moolthongnoi, C. The use of fermented feather meal for replacement fish meal in the diet of Oreochromis niloticus. Environ. Nat. Resour. J. 2008, 6, 13–24. [Google Scholar] [CrossRef]
  16. Aladetohun, O.N.F.; Sogbesan, O.A. Utilization of blood meal as a protein ingredient from animal waste product in the diet of Oreochromis niloticus. Int. J. Fish. Aquac. 2013, 5, 234–237. [Google Scholar] [CrossRef]
  17. Ayadi, F.Y.; Muthukumarappan, K.; Rosentrater, K.A. Alternative protein sources for Aquaculture feeds. J. Aquac. Feed Sci. Nutr. 2012, 4, 1–26. [Google Scholar] [CrossRef]
  18. Chor, W.-K.; Lim, L.-S.; Shapawi, R. Evaluation of feather meal as a dietary protein source for African Catfish fry, Clarias gariepinus. J. Fish. Aquat. Sci. 2013, 8, 697–705. [Google Scholar] [CrossRef] [Green Version]
  19. Mountinho, S.; Martinez-Llores, S.; Tomas-Vidal, A.; Jover-Cerda, M.; Oliva-Teles, A. Meat and bone meal as partial replacement for fishmeal in diets for gilthead seabream (Sparus aurata) juveniles: Growth, feed utilization, amino acid utilization, and economic efficiency. Aquaculture 2017, 468, 271–277. [Google Scholar] [CrossRef]
  20. Neyeloff, J.L.; Fuchs, S.C.; Moreira, L.B. Meta-analysis and Forest plots using a microsoft excel spreadsheet: Step-by-step guide focusing on descriptive data analysis. BMC Res. Notes 2012, 5, 52. [Google Scholar] [CrossRef] [Green Version]
  21. Borenstein, M.; Hedges, L.V.; Higgins, J.; Rothstein, H.R. Introduction to Meta-Analysis; John Wiley & Sons, Ltd.: Chichester, UK, 2009; ISBN 978-0-470-05724-7. [Google Scholar]
  22. Rapatsa, M.M.; Moyo, N.A. Evaluation of Imbrasia belina meal as a fishmeal substitute in Oreochromis mossambicus diets: Growth performance, histological analysis and enzyme activity. Aquac. Rep. 2017, 5, 18–26. [Google Scholar] [CrossRef]
  23. Alegbeleye, W.O.; Obasa, S.O.; Olude, O.O.; Otubu, K.; Jimoh, W. Preliminary evaluation of the nutritive value of the variegated grasshopper (Zonocerus variegatus L.) for African catfish Clarias gariepinus (Burchell. 1822) fingerlings. Aquac. Res. 2012, 43, 412–420. [Google Scholar] [CrossRef]
  24. Taufek, N.M.; Muin, H.; Raji, A.A.; Yusof, H.M.; Alias, Z.; Razak, S.A. Potential of field crickets meal (Gryllus bimaculatus) in the diet of African catfish (Clarias gariepinus). J. Appl. Anim. Res. 2018, 46, 541–546. [Google Scholar] [CrossRef] [Green Version]
  25. Sing, K.-W.; Kamarudin, M.S.; Wilson, J.J.; Sofian-Azirun, M. Evaluation of Blowfly (Chrysomya megaphala) Maggot Meal as an Effective, Sustainable Replacement for Fishmeal in the Diets of Farmed Juvenile Red Tilapia (Oreochromis sp.). Pak. Vet. J. 2014, 34, 288–292. [Google Scholar]
  26. Belghit, I.; Liland, N.S.; Gjesdal, P.; Biancarosa, I.; Menchetti, E.; Li, Y.; Waagbo, R.; Krogdahl, A. Black soldier fly larvae meal can replace fish meal in diets of Sea-water phase Atlantic salmo (Salmo salar). Aquaculture 2019, 503, 609–619. [Google Scholar] [CrossRef]
  27. Abd Rahman Jabir, M.D.; Razak, S.A.; Vikineswary, S. Nutritive potential and utilization of super worm (Zophobas morio) meal in the diet of Nile tilapia (Oreochromis niloticus) juvenile. Isr. J. Aquac. 2012, 11, 6592–6598. [Google Scholar] [CrossRef] [Green Version]
  28. Hernandez, C.; Osuna-Osuna, L.; Benitez-Hernandez, A.; Sanchez-Gutierrez, Y.; Gonzalez-Rodriquez, B.; Dominguez-Jimenez, P. Replacements of fish meal by poultry by-product meal, food grade, in diets for juvenile spotted rose snapper (Lutjanus guttatus). Lat. Am. J. Aquat. Res. 2014, 42, 111–120. [Google Scholar] [CrossRef]
  29. Srour, T.M.; Essa, M.A.; Abdel-Rahim, M.M.; Mansour, M.A. Replacement of fish meal with poultry by-product meal (PBM) and its effects on the survival, growth, feed utilization, and microbial load of European Seabass, Dicentrarchus labrx fry. Glob. Adv. Res. J. Agric. Sci. 2016, 5, 293–301. [Google Scholar]
  30. Turker, A.; Yigit, M.; Ergun, S.; Karaali, B.; Erteken, A. Potential of poultry by-product meal as a substitute for fishmeal in diets for Black Sea Turbot Scophthalmus maeoticus: Growth and nutrient utilization in winter. Isr. J. Aquac. 2005, 57, 49–61. [Google Scholar]
  31. Yones, A.M.M.; Metwalli, A.A. Effects of fish meal substitution with poultry by-product meal on growth perfomance, nutrients utilization and blood contents of Juvenile Nile Tilapia (Oreochromis niloticus). J. Aquac. Res. Dev. 2015, 6, 389–394. [Google Scholar] [CrossRef]
  32. Adewole, H.A.; Olaleye, V.F. Growth performance in Clarias gariepinus Burchell fingerlings fed blood meal-Bovine Rumen Digesta blend diets. IFE J. Sci. 2014, 16, 495–505. [Google Scholar]
  33. Yu, H.; Zhang, Q.; Cao, H.; Tong, T.; Huang, G.; Li, W. Replacement of fish meal by meat and bone meal in diets for juvenile snakehead (Ophiocephalus argus). Fish. Sci. 2015, 81, 723–729. [Google Scholar] [CrossRef]
  34. Madage, S.; Medis, W.U.D.; Sultanbawa, Y. Fish silage as replacement of fishmeal in red tilapia feeds. J. Appl. Aquac. 2015, 27, 95–106. [Google Scholar] [CrossRef]
  35. Nwanna, L.C.; Balogun, A.M.; Ajenifuja, Y.F.; Enujiugha, V.N. Replacement of fish meal with chemically preserved shrimp head in the diets of African catfish, Clarias gariepinus. J. Food Agric. Environ. 2004, 2, 79–83. [Google Scholar] [CrossRef]
  36. Gong, Y.-Y.; Huang, Y.-Q.; Gao, L.-J.; Lu, J.-X.; Huang, H.-L.; Xia, Y.-T. Substitution of Krill meal for Fish Meal in Feed for Russian Sturgeon, Acipenser gueldenstaedtii. Isr. J. Aquac. 2016, 68, 1319–1325. Available online: http://hdl.handle.net/10524/54968 (accessed on 30 October 2020).
  37. National Research Council (NRC). Nutrient Requirements of Fish; The National Academy Press: Washington, DC, USA, 1993. [Google Scholar] [CrossRef]
  38. Naylor, R.L.; Hardy, R.W.; Bureau, D.P.; Chin, A.; Elliott, M.; Farrell, A.P.; Forster, I.; Gatlin, D.M.; Goldiburg, R.J.; Hua, K.; et al. Feeding aquaculture in an era of finite resources. Proc. Natl. Acad. Sci. USA 2009, 106, 15103–15110. [Google Scholar] [CrossRef] [PubMed] [Green Version]
  39. El-sayed, A.F.M.; Teshma, S. Protein and energy requirements ofNile tilapia (Oreochromis mossambicus) fry. Aquaculture 1992, 103, 55–63. [Google Scholar] [CrossRef]
  40. Jauncey, K. The effect of varying dietary protein levelon the growth, food conversion ratio, protein utilization and body composition of juvenile tilapias (Sarotherodon mossambicus). Aquaculture 1982, 27, 43–54. [Google Scholar] [CrossRef]
  41. Siddiqui, A.Q.; Howlader, M.S.; Adam, A.A. Effect of dietary protein levels on growth, food conversion and protein utilization in fry and young Nile tilepia (Oreochromis niloticus). Aquaculture 1988, 70, 63–73. [Google Scholar] [CrossRef]
  42. Shiau, S.-Y.; Huang, S.-L. Optimal dietary protein level for hybrid tilapia (Oreochromis niloticus x O. aureus) reared in seawater. Aquaculture 1989, 81, 119–127. [Google Scholar] [CrossRef]
  43. Al-Hafedh, Y.S. Effects of dietary protein on growth and body composition of Nile tilapia, Oreochromis niloticus L. Aquac. Res. 1999, 30, 385–393. [Google Scholar] [CrossRef]
  44. Henry, M.; Gasco, C.; Piccolo, G.; Fountoulaki, E. Review on the use of insects in the diet of farmed fish: Past and future. Anim. Feed Sci. Technol. 2015, 203, 1–22. [Google Scholar] [CrossRef]
  45. Pinottie, L.; Giromini, C.; Ottoboni, M.; Tretola, M.; Marchis, D. Review: Insects and former foodstuffs for upgrading food waste biomasses/streams to feed ingredients for farm animals. Animal 2019, 13, 1365–1375. [Google Scholar] [CrossRef] [Green Version]
  46. Oonincx, D.G.A.B.; de Boer, I.J.M. Environmental Impact of the Production of Mealworms as a Protein Source for Humans-A Life Cycle Asseessment. PLoS ONE 2012, 7, e51145. [Google Scholar] [CrossRef] [Green Version]
  47. Sánchez-Muros, M.-J.; Barroso, F.G.; Manzano-Agugliaro, F. Insect meal as renewable source of food for animal feeding: A review. J. Clean. Prod. 2014, 65, 16–27. [Google Scholar] [CrossRef]
  48. Tran, G.; Heuze, V.; Makkar, H.P.S. Insects in fish diets. Anim. Front. 2015, 5, 37–44. [Google Scholar] [CrossRef]
  49. Montoya-Camacho, N.; Marquez-Rios, E.; Castillo-Yanez, F.J.; Lopez, T.J.C.; Lopez-Elias, J.A.; Ruiz-Cruz, S.; Jimenez-Ruiz, E.I.; Rivas-Vega, M.E.; Ocano-Hiquera, V.M. Advances in the use of alternative protein sources for Tilapia feeding. Rev. Aquac. 2019, 11, 515–526. [Google Scholar] [CrossRef]
Figure 1. Flow chart of the study selection process for systematic review and meta-analysis of animal protein sources as a fishmeal replacement in aquaculture diets.
Applsci 11 03854 g001
Figure 2. The effect size of final weight (%) of fish from different studies fed different animal protein sources compared to fishmeal as a protein source.
Applsci 11 03854 g002
Figure 3. The effect size of specific growth rate (%) of fish from different studies fed different animal protein sources compared to fishmeal as a protein source.
Applsci 11 03854 g003
Figure 4. The effect size of feed conversion ratio (%) of fish from different studies fed different animal protein sources compared to fishmeal as a protein source.
Applsci 11 03854 g004
Figure 5. The effect size of survival rate (%) of fish from different studies fed different animal protein sources compared to fishmeal as a protein source.
Applsci 11 03854 g005
Table 1. Summary of studies that assessed animal protein sources as a fishmeal replacement in fish diets in aquaculture. Final weight (FW in grams), specific growth rate (SGR in percentage (%)), feed conversion ratio (FCR), and survival rate (SR in %) were used as the assessment parameters to measure response.
Protein Sources Replacing Fish MealFish SpeciesRecommended Levels of Feed (%)Duration of Experiment (Days)Feeding Frequency (Times/DayInitial Weight IW (g)Outcomes for Recommended LevelsReferences
FW (g)SGR (%)FCRSR (%)
Insects
Mopane worm (Imbrasia belina)Oreochromis mossambicus60512242.401221.103.161.25100[22]
Grasshopper (Zonocerus variegatus)Clarias gariepinus255621.325.752.641.51100[23]
Field Cricket (Gryllus bimaculatus)Clarias gariepinus1005624.8219.502.322.2093.30[24]
Blowfly Maggot (Chrysomya megacephala)Oreochromis sp.1006023.010.632.021.3480.0[25]
Black soldier fly (Hermetia illucens)Salmo salar661122138637210.91.1NR[26]
Superworm (Zophobas morio)Oreochromis niloticus255625.5710.111.021.25100[27]
Terrestrial animal by-products
Fermented feather mealOreochromis. niloticus25–50842122.81222.35NR1.73100[15]
Feather mealClarias gariepinus202822.85NR7.891.3488.89[18]
Poultry by-productsLutjanus guttatus2584311.0 36.171.431.20100[28]
Poultry by-productsOreochromis niloticus5084NR0.8810.192.701.40100[17]
Poultry by-productDicentrarchus labrax607030.738.283.522.2494[29]
Poultry by-productScophthalmus maeoticus256021829.380.180.91100[30]
Poultry by-productOreochromis niloticus10012021.554.32.991.34NR[31]
Blood mealClarias gariepinus5086210.3266.501.030.86100[32]
Meat and bone mealOphiocephalus argus2070312.11138.673.481.2494.2[33]
Fishery by-products
Fish silageRed tilapia (Oreochromis mossambicus × Oreochromis niloticus × Oreochromis aureus)5084NR2.1828.053.041.35NR[34]
Shrimp head mealClarias gariepinus2084NR12.132.81.192.50NR[35]
Krill mealAcipenser glueldenstaedtii30200NR483NR0.561.1083[36]
NR = Not recorded.
Table 2. Weights, prevalence (95 % CI), effect summary, I2 index, and degree of freedom for final weight, specific growth rate, feed conversion rate, and survival rate for different studies included in the meta-analysis.
Final WeightSpecific Growth RateFeed Conversion RatioSurvival Rate
ReferenceWeightPrevalence (95% CI)WeightPrevalence (95% CI)WeightPrevalence (95% CI)WeightPrevalence (95% CI)
[23]2147 (31–168)5023 (32– 19)6017 (26–9)1927 (637–839)
[15]21041 (779–978)--17412 (21–14)4500 (301–503)
[17]5039 (28–170)17012 (29–23)2259 (22–14)4500 (301–503)
[18]--5627 (26–25)10115 (18–18)3435 (228–430)
[36]709141 (61–138)1,851,851.80.054 (26–26)1,021,450.50.1 (24–11)11,869.48 (94–108)
[28]7228 (2–197)1669 (32–20)1808 (22–13)2663 (433–635)
[34]13149 (70–129)12816 (27–24)3276 (20–15)--
[35]13157 (65–129)3546 (30–22)15313 (19–17)--
[22]--32363 (26–25)72991 (20–15)100100 (21–181)
[24]1788 (70–134)13811 (31–20)7321 (27–8)3604 (380–1085)
[33]12334 (112–311)4669 (26–25)12143 (20–15)17231 (83–286)
[25]9.09106 (76–122)49.5920 (33–18)74.6313 (27–8)1.25800 (524–726)
[26]0.002124,030 (85,539,850–85,540,050)10.0130(58–6)8.1437 (50–15)--
[27]0.01101 (76–122)98.0310(35–16)78.1313 (27–8)11000 (702–905)
[29]76.9233 (24–174)178.5714 ((26–25)277.779 (20–14)6.65376 (199–401)
[30]7.72196 (31–168)1275.511 (30–22)243.96 (24–11)2.27667 (435–637)
[31]181.8254(49–150)3448.283 (26–25)7692.31 (19–17)--
[32]2.17554 (269–495)140.859(34–18)169.497 (26–10)1.44833 (569–771)
Effect summary9015 (6,110,058.3–6,110,177.58)9.9 (24–13)10 (32–21)546 (350–572)
Random effect model (I2)99.40−7.73−27.791101.08
Degree of freedom (df)17161713
Publisher’s Note: MDPI stays neutral with regard to jurisdictional claims in published maps and institutional affiliations.

