Article

Diagnosis of Broken Rotor Bars during the Startup of Inverter-Fed Induction Motors Using the Dragon Transform and Functional ANOVA

by
Vanesa Fernandez-Cavero
1,
Luis A. García-Escudero
2,
Joan Pons-Llinares
3,
Miguel A. Fernández-Temprano
2,
Oscar Duque-Perez
4,* and
Daniel Morinigo-Sotelo
4
1
Escuela Politécnica Superior (EPS), Miguel de Cervantes European University, 47012 Valladolid, Spain
2
Department of Statistics and Operational Research, Escuela de Ingenierías Industriales, Universidad de Valladolid, 47011 Valladolid, Spain
3
Instituto Tecnológico de la Energía, Universitat Politècnica de València, 46022 València, Spain
4
Research Group ADIRE, Institute of Advanced Production Technologies (ITAP), Universidad de Valladolid, 47011 Valladolid, Spain
*
Author to whom correspondence should be addressed.
Appl. Sci. 2021, 11(9), 3769; https://doi.org/10.3390/app11093769
Submission received: 15 March 2021 / Revised: 19 April 2021 / Accepted: 19 April 2021 / Published: 22 April 2021
(This article belongs to the Section Electrical, Electronics and Communications Engineering)

Abstract

:
A proper diagnosis of the state of an induction motor is of great interest to industry given the great importance of the extended use of this motor. Presently, the use of this motor driven by a frequency converter is very widespread. However, operation by means of an inverter introduces certain difficulties for a correct diagnosis, which results in a signal with higher harmonic content and noise level, which makes it difficult to perform a correct diagnosis. To solve these problems, this article proposes the use of a time-frequency technique known as Dragon Transform together with the functional ANOVA statistical technique to carry out a proper diagnosis of the state of the motor by working directly with the curves obtained from the application of the transform. A case study is presented showing the good results obtained by applying the methodology in which the state of the rotor bars of an inverter-fed motor is diagnosed considering three failure states and operating at different load levels.

1. Introduction

The induction motor fed by an inverter is presently a common and practically irreplaceable element in most industrial sectors and in electric traction. The inverter allows operation at variable speeds, a functionality required in many applications, and also allows a considerable reduction in the current demanded during startup. However, the presence of the inverter also has some drawbacks [1]. As far as maintenance work is concerned, its influence is mainly in two aspects: changing the failure mechanisms and making diagnosis more difficult [2]. The change in the electrical starting conditions and during continuous operation of the motor changes in turn the failure mechanisms. Focusing on the problems associated with the rotor, the fact that the starting current is much lower decreases stresses on the rotor cage [3]. Still, other problems arise mainly associated with the higher harmonic content, which increases the level of vibrations and the harmonic torques and temperature in the cage [4,5,6]. The fact that inverters allow operation with repetitive cycles also has a negative influence. These stresses will be higher in cases where regenerative braking is used.
From a diagnostic point of view, as already reflected in the literature, inverters make it more difficult to identify characteristic fault frequencies due to a higher noise level and interharmonics and subharmonics around the first component [7,8]. The commutation mechanism of the converter produces harmonics that can be confused with the one characteristic of motor failure and, in addition, usually generates a signal with a higher noise level. In addition, the harmonic content will vary significantly from one inverter to another, or even within the same inverter, depending on the type of control applied and the switching frequency chosen [9]. Detection of faults in inverter-fed induction motors operating at fixed speed has already been studied in [6,10,11,12,13]. However, inverter-fed motors may operate in non-stationary regimes due to the particularities of the industrial application. If this is the case, it is not possible to employ the Fourier transform of the stator current for fault detection, and the use of time-frequency transforms is essential. Furthermore, motor operation tends to be under low slip condition, which in cases such as broken bars, where the characteristic harmonics of failure in operation at high load are very close to the fundamental harmonic, makes it difficult to identify these characteristic failure frequencies [14,15]. These characteristics of the operation of the induction motor with an inverter increase the possibility of false positives. These diagnostic errors can have significant economic consequences in addition to gradually leading to a lack of confidence in the diagnostic tasks.
This paper proposes a two-step methodology to overcome the difficulties in the diagnosis inherent to inverter-fed motors, providing a reliable method to diagnose the condition of the motor. The first step is to apply the Dragon Transform, which has been recently developed by the authors [16]. This transform provides the adequate time and frequency resolution to be able to follow the fault-related harmonics, which, in the case of broken bars, evolve very close to the main harmonic. This feature is obtained by the definition of atoms whose shape adapt to the trajectory of the fault harmonics [16]. It should be noted that just as in the stationary state there are preset fault frequencies that depend exclusively on the operating speed, in the case of diagnosis in transient state during the start of the motor, the path of the fault harmonics is also previously known. Therefore, if an adapted mathematical tool is available to separate the trajectory of the fault harmonics from that of the main harmonic, it will be possible to carry out this monitoring in a suitable way, as has already been demonstrated in [17]. The second step consists of the application of the statistical technique known as Functional ANOVA to the curves obtained with the Dragon Transform for the prediction of the condition of the motor. It should also be noted that by not depending on the value detected at a particular point, as it would be the case of a stationary motor operation, but of a whole curve in the time-frequency plane, the diagnostic reliability increases by reducing possible false positives.
However, practical diagnosis cannot be based exclusively on the visual observation of a curve since this can always introduce subjective elements and, in practice, would require the continuous presence of an expert or adequate training for all maintenance engineers. Therefore, to improve performance and practical functionality, it is necessary to quantify the observed trajectories so statistical techniques can infer the most probable state of the motor.
Thus, this paper’s main contribution is the diagnosis of broken rotor bars in inverter-fed motors employing the analysis of the stator electric current captured during a controlled startup. The use of the Dragon Transform permits the fault severity quantification along the startup transient. This first analysis produces a set of curves that permit the fault diagnosis with the functional ANOVA technique.
The structure of the rest of the paper is as follows: Section 2 explains the proposed methodology based first on the severity quantification with the Dragon Transform and second on the functional ANOVA for the analysis of the curves; Section 3 describes the laboratory setup; Section 4 presents the functional ANOVA results, and Section 5 summarizes the conclusions.

2. Methodology

The proposed methodology for the diagnosis of faults in inverter-fed motors consists of three stages. First, the Dragon Transform is applied to the current signal captured during motor startup. Then, in order to quantify, time curves representing the energy density associated with the fault harmonic trajectories are obtained. Finally, the statistical technique known as functional ANOVA is applied to perform the analysis of the curves and determine the condition of the motor.

2.1. The Dragon Transform and Fault Severity Quantification

The technique used for signal analysis and statistical examination in this paper is the so-called Dragon Transform [16]. This paper uses the harmonics due to rotor bar faults in inductions motors—they are present in the machine’s stator current and describe unique trajectories in the time-frequency plane – for diagnosis purposes. Unfortunately, in inverted-fed machines these harmonics appear too close to the path described by the first harmonic fixed by the power supply. This makes it necessary to use a signal processing technique precise enough to follow the entire trajectory of these harmonics despite the proximity of the high-energy first harmonic. The Dragon Transform technique has this ability because it traces those trajectories as very thin lines in the time-frequency plane. This transform, which is explained in [16], is an atom-based correlation technique whose time and frequency resolutions allow the fault trajectories to be perfectly delineated and distinguished from the first harmonic, however close they may be. The atoms defined in [16] are known as Dragon atoms because their energy in the time-frequency plane follows the path of the harmonic component to be detected, i.e., the atoms’ shape adapts perfectly to the trajectory of the harmonic to be followed. This kind of atoms is based on any modulated window, as the Gabor function (in the next equation, the atom is based on a gaussian window in brackets) [18]:
ϕ t = C σ e t t c 2 2 σ 2 e i 2 π f c t t c ,
where σ is a deviation parameter which characterizes time dispersion; t c and f c are the time and frequency at the center of the atom; and C σ = 1 / π 4 σ is a normalization constant.
The atom adapts to the trajectory of the signal to be detected if the exponential complex angle is defined so that its derivative is equal to the frequency of the component to be detected. In this way, these atoms can precisely follow the evolution of the harmonic over time. Therefore, each of the atoms’ energy dispersion occurs in the direction of the component’s evolution. Once the family of atoms is defined covering the entire time-frequency plane, these atoms are correlated with the signal. This correlation defines the Dragon Transform as follows [16]:
h , ϕ = + h t ϕ * t d t ,
where h ( t ) is the signal to be analyzed. The result of the Dragon Transform application is illustrated in Figure 1 with an actual signal, which is the startup current of an inverter-fed induction motor with a broken rotor bar. Inverters permit programming of the starting characteristics. In this case, the voltage supply’s first harmonic follows a linear ramp up to 50 Hz in ten seconds. Figure 1a shows the stator current during a controlled starting and the operation of the motor in a stationary state after the starting. Figure 1b shows the motor slip s, which is calculated as follows:
s = n 1 n n 1 ,
where n is the motor speed and n 1 is the synchronous speed, calculated as 60 f F C / p ( f F C is the first harmonic frequency and p is machine’s pole pairs). In an inverter-fed motor, the slip s is always very low, even during the startup transient, as it is shown in Figure 1b. Figure 1c shows the expected trajectory of the first component (controlled by the inverter) and the predicted paths of the fault-related harmonics ( f B B H ) whose values are given by:
f B B H = 1 ± 2 s f F C ,
This equation defines a pair of harmonics around the first component separated by 2 s f F C , and known as LSH (lower side harmonic, ( 1 2 s ) f F C ) and USH (upper side harmonic, ( 1 + 2 s ) f F C ) .
The result of the correlation of the signal in Figure 1a with a suitable family of Dragon atoms is shown in Figure 1d, where color is used to represent each frequency component’s energy. The time-frequency decomposition shows the expected trajectory of the first harmonic during the inverter-controlled startup and the subsequent steady-state operation (see Figure 1c). The predicted trajectories of the fault-related harmonics are also observed during the transient and stationary operation. As the motor slip is low during the motor operation (see Figure 1b), these harmonics’ trajectories develop close and parallel to the first harmonic (see predicted trajectories in Figure 1b), which makes impossible their observation and quantification by tools such as the Short Time Fourier Transform or Complex Wavelet Transform [3]. However, the excellent time and frequency resolutions of the Dragon Transform represents them as very thin lines, with no interference from the first component energy.
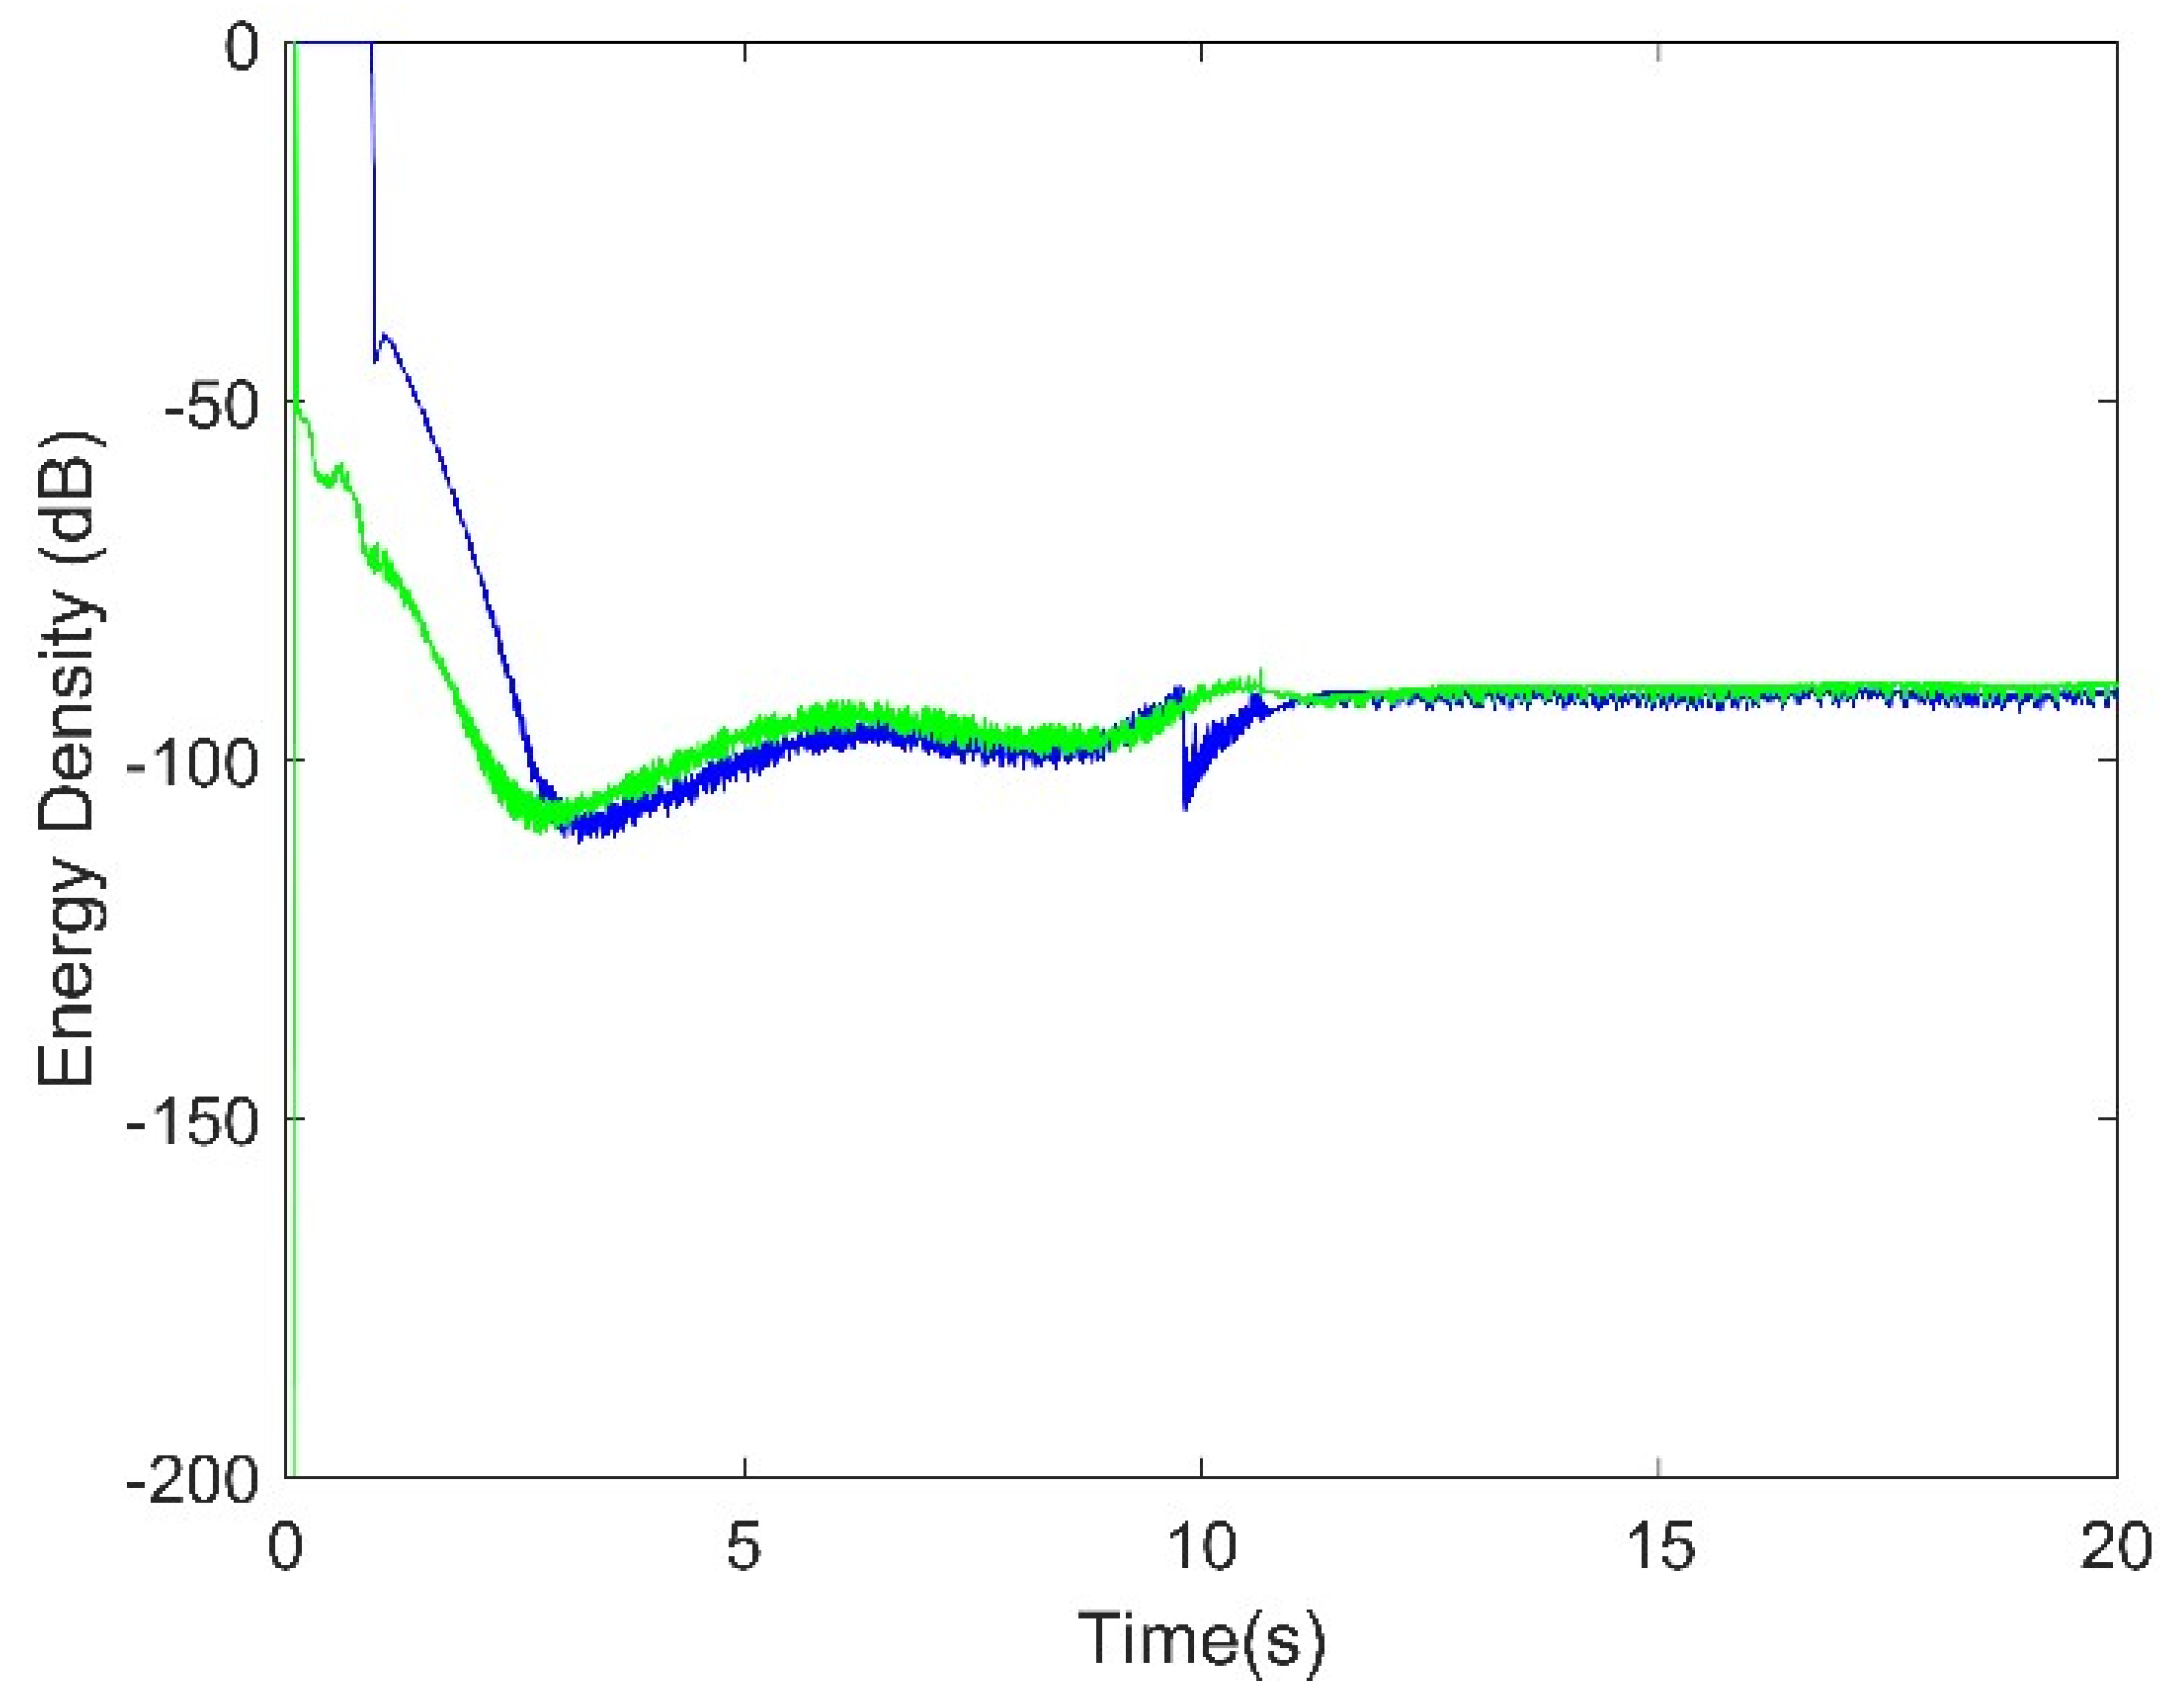
As the trajectories of fault-related harmonics are correctly observed as thin lines in the time-frequency plane, their energy can be captured so fault severity can also be quantified. Figure 2 shows the quantification curves corresponding to the analysis of the signal shown in Figure 1. These time curves represent the energy density along the trajectories of broken bar harmonics shown in Figure 1d. The two curves correspond to the energy of the harmonics on both sides of the first component. Therefore, this quantification technique could be used for fault detection and diagnosis during an inverter-controlled IM startup following any profile in time.

2.2. Functional Data Analysis

The application of the Dragon Transform to the stator current of the induction motor during startup yields a set of time curves. Therefore, Functional Data Analysis tools are the natural choices for analyzing this particular type of data. The application of modern technologies is increasingly allowing us to measure continuous time phenomena as functions. Although the measured curves are often discretized, data sets can be better seen as made of functions rather than finite-dimensional measurements. Functional Data Analysis [19,20] are the set of statistical tools specially developed to deal with this particular type of data. Many standard statistical tools have been adapted to cope with functional data’s specificities, and the classical ANOVA (ANalysis Of VAriance) procedure is one of them. In that spirit, a functional ANOVA test procedure was introduced in [19]. We propose considering this approach to help in the diagnosis of induction motors. This test analyzes whether the mean curves for different conditions can be considered the same or if significant differences among mean curves can be detected. If, as an example, three different conditions (1,2,3) are considered, the functional ANOVA test will have as null hypothesis:
H 0 : m 1 = m 2 = m 3 ,
where m i is the mean curve for the transformation curves obtained in the i-th category. The null hypothesis states that m 1 ( t ) = m 2 ( t ) = m 3 ( t ) for every t in the domain where these functions are simultaneously defined. Then, the functional ANOVA procedure is carried out by applying a kind of asymptotic parametric bootstrap procedure as detailed in [21]. The procedure is implemented by applying the fda.usc package [22] in R [23]. This package is available at the CRAN repository. Other approaches for functional ANOVA can be seen in [24].

3. The Laboratory Setup

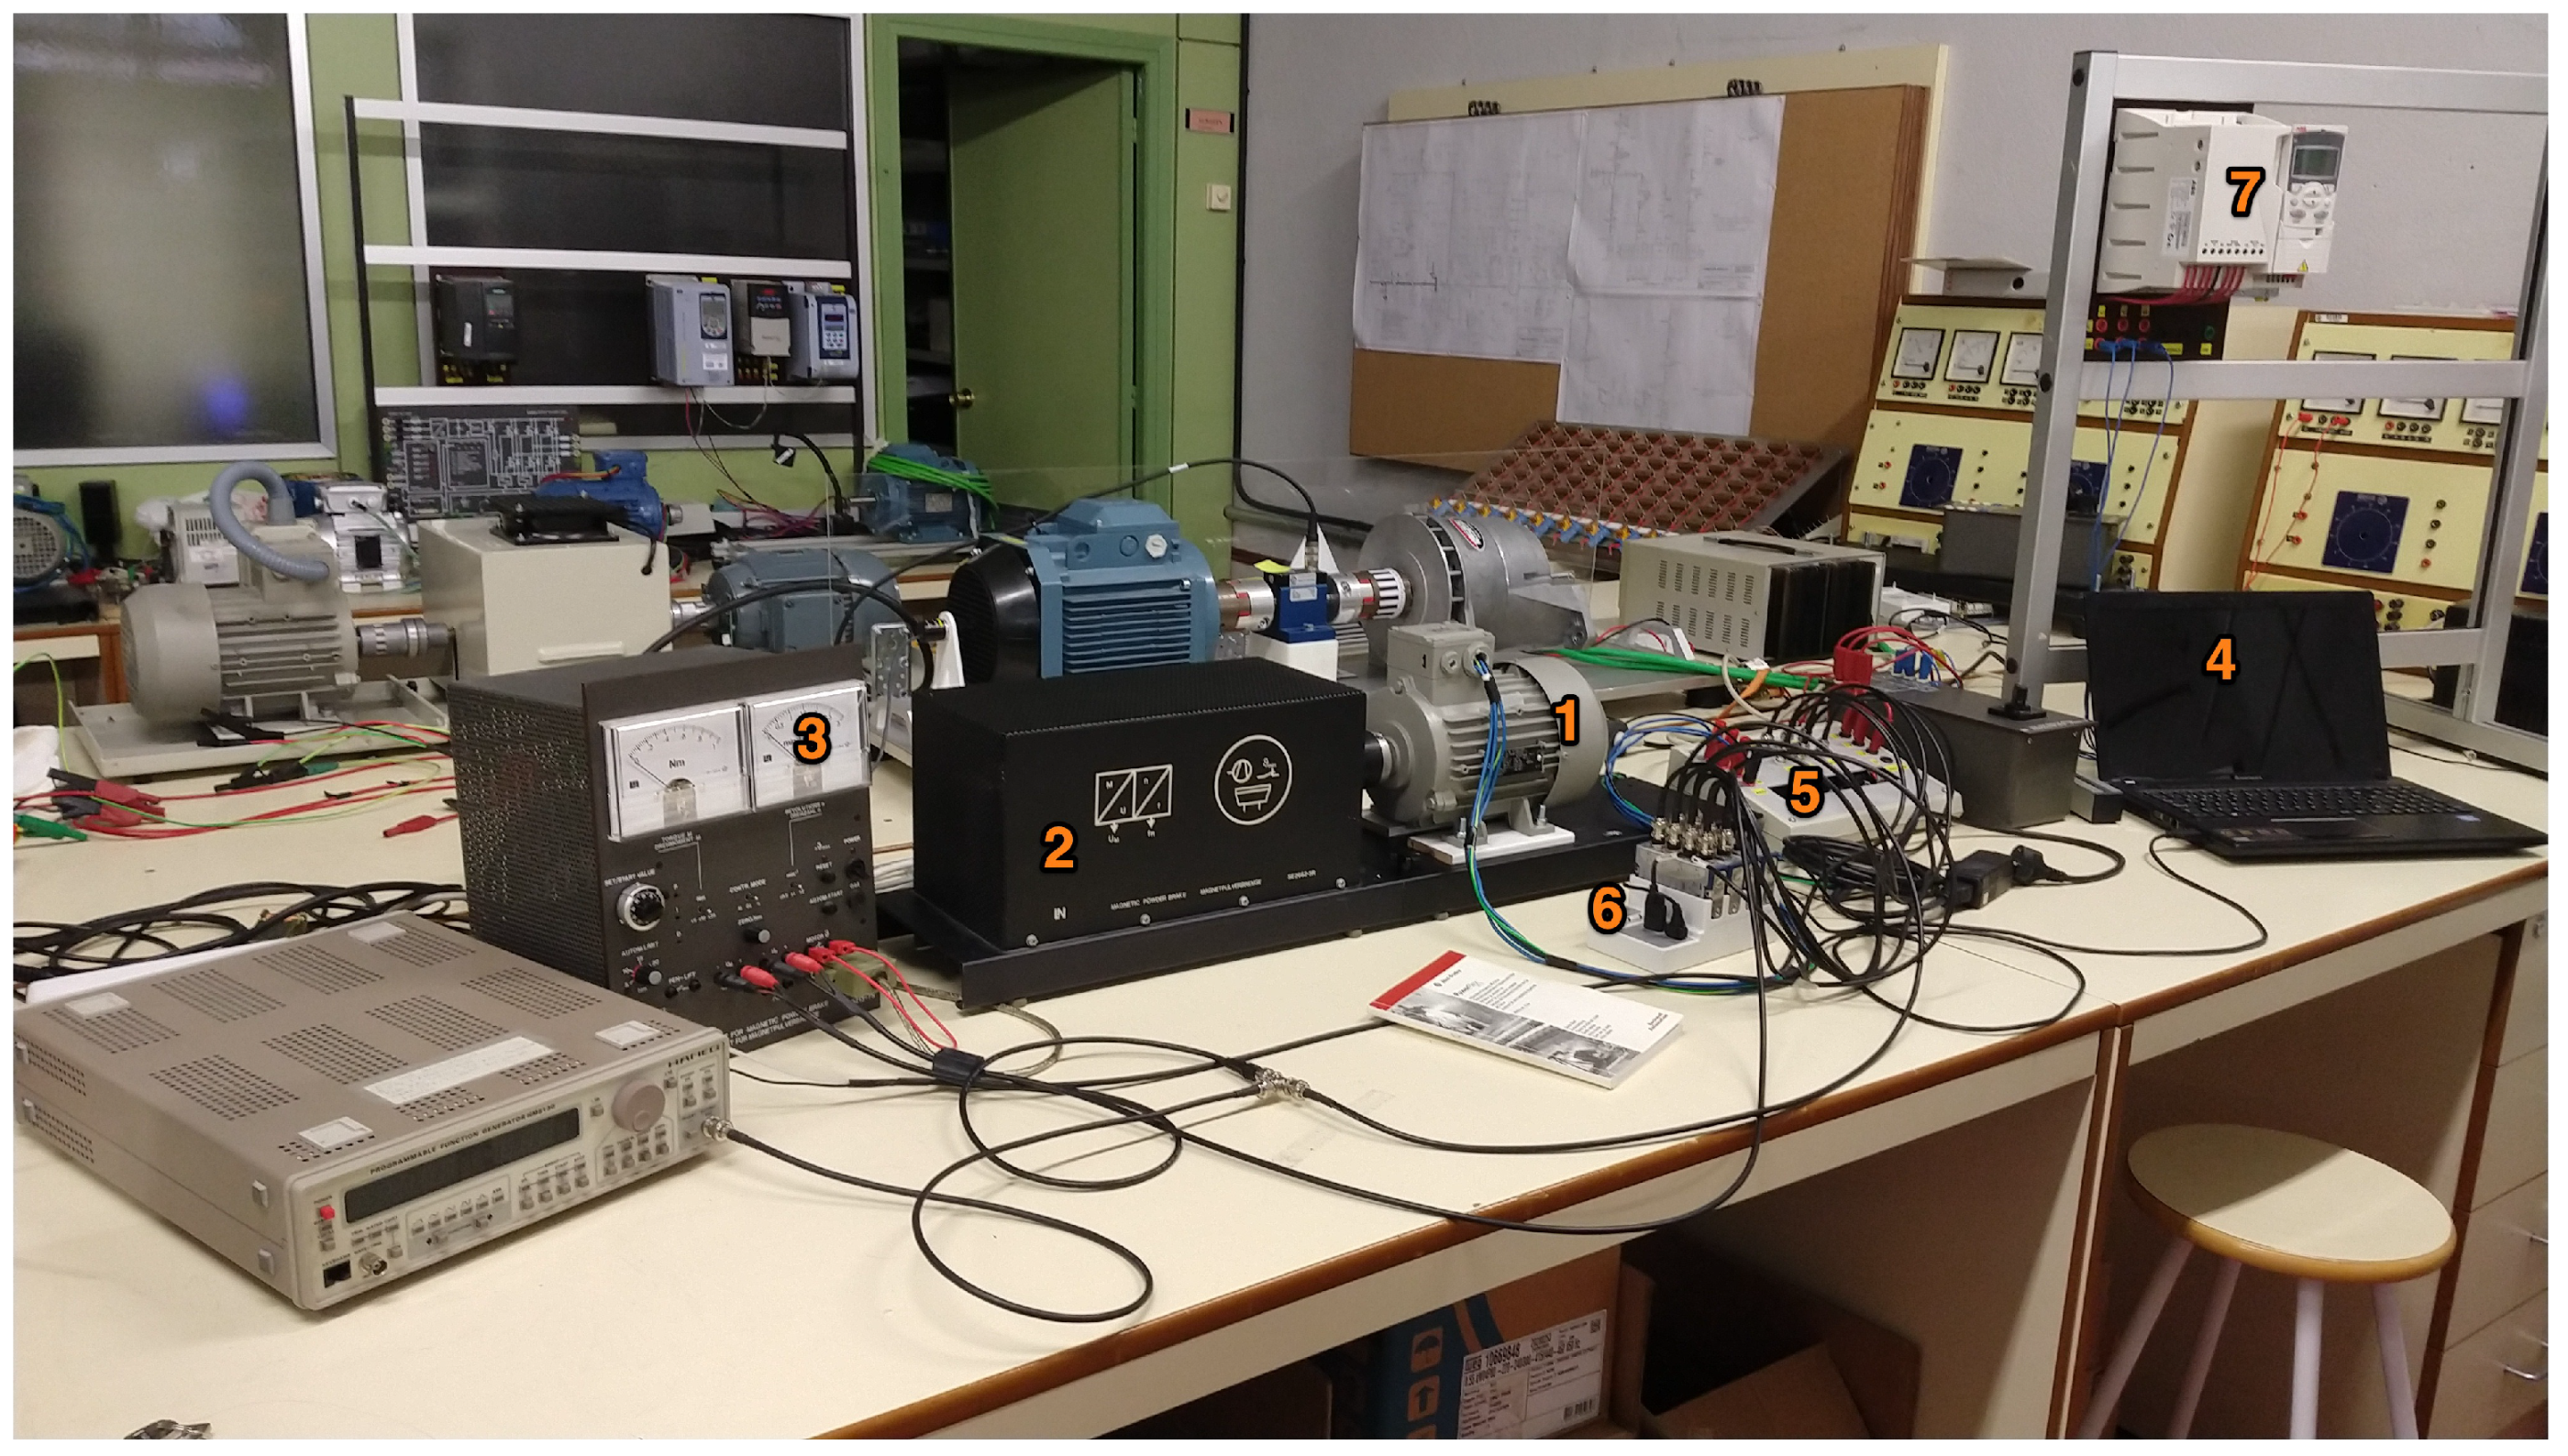
The test bench used in this work (Figure 3) consisted of an induction motor with the following specifications: rated power of 1.1 kW; star connection; 400 V rated voltage; 1410 rpm rated speed, and 2.6 A rated current. The motor load was a Lucas Nülle powder magnetic brake, which also incorporates a torque and speed meter. Data was captured using the cDAQ-9174 by National Instruments with an NI-9215 module. Two Hall effect sensors by LEM were used as current (LA 25-NP) and voltage (LV 25-P) transducers. The sampling frequency used for voltage, stator current and speed acquisition was 50 kHz.
The motor was tested under three different conditions: healthy, with a rotor bar broken at 70%, and with full broken rotor bar. Bar breakage was achieved by drilling a hole at the junction of a bar and the cage end ring. Fault detection also depends on the motor load, being more challenging at low loads. For this reason, the motor was tested also at two motor load levels: low load (35% of rated torque); high load (60% of rated torque).
An ABB inverter, model ACS355, with open loop scalar control was used as motor supply. This inverter allows the user full control of the startup transient following a linear profile. The supply voltage amplitude and its frequency increase from zero to the final cruise values configured by the user, in this case to 50 Hz. In this work, the inverter was configured so the startup transient was 10 s long with a final frequency of 50 Hz. The voltage was captured to calculate the fundamental frequency and the synchronous speed over time, as explained in [16]. The speed was also measured for the calculation of the motor slip. This information permits the computation of the fundamental component and fault-related harmonics trajectories in the time-frequency plane, which are necessary to apply the Dragon Transform to the stator current and compute the spectrogram. Although the startup lasts 10 s, only the central six seconds are analyzed to avoidable edge effects at the beginning and end of the transient that affect the fault severity quantification. A total of 150 tests were carried out: 45 at healthy condition and low load; 45 at healthy condition and high load; 15 at medium fault condition and low load; 15 at medium fault condition and high load; 15 at full broken bar and low load; 15 at full broken bar and high load.

4. Results

4.1. Examples of Time-Frequency Distributions and Fault Severity Quantification

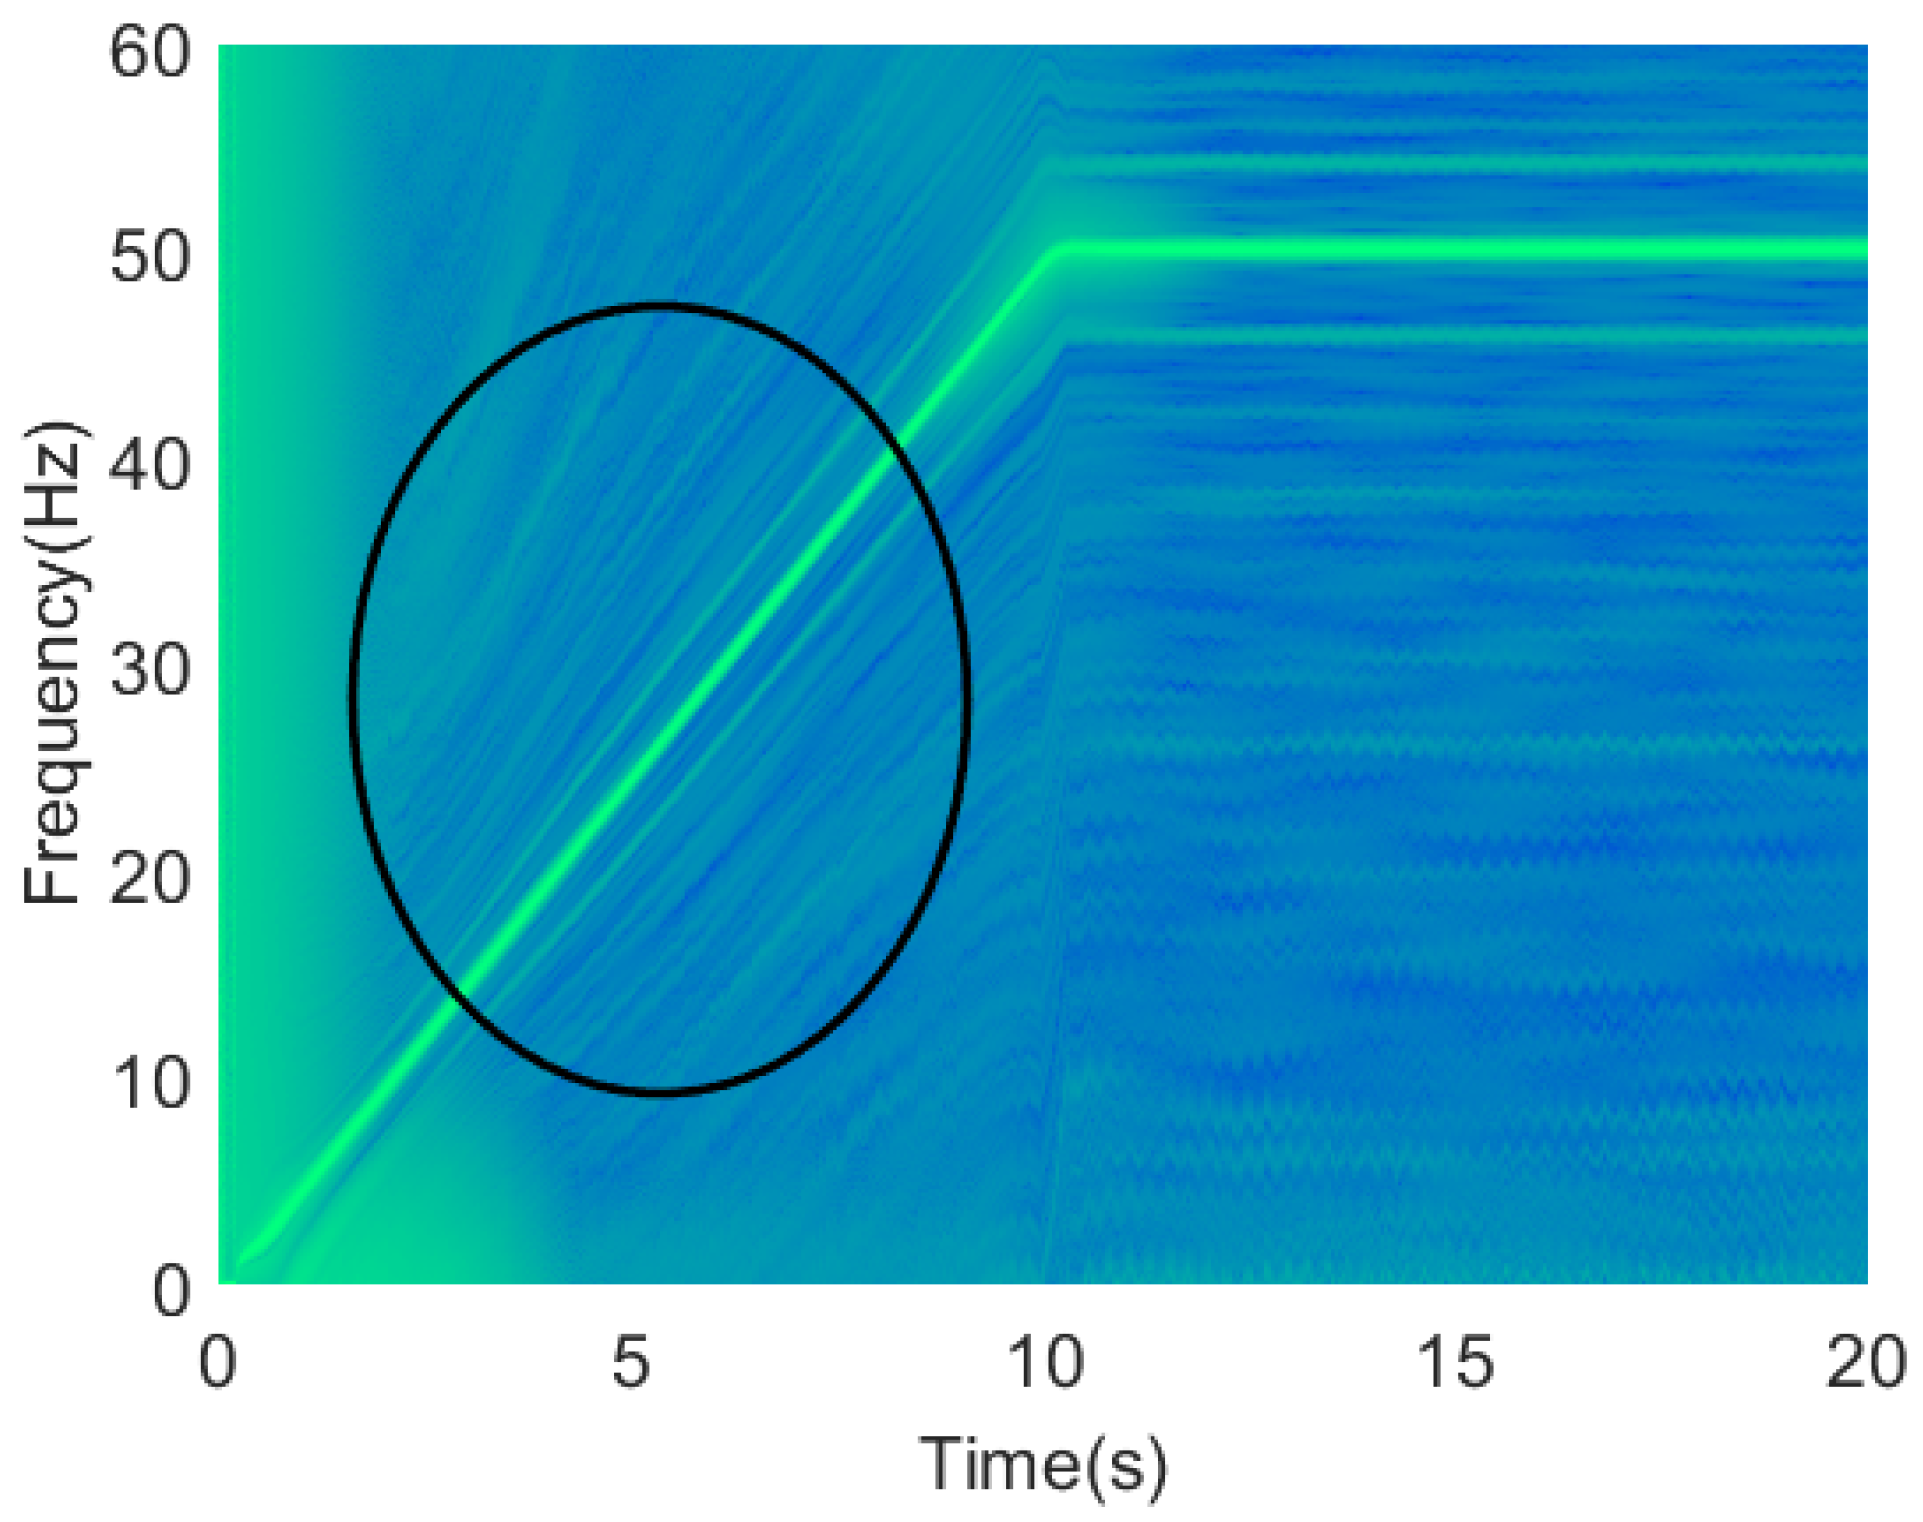
The motor has been tested under two load levels (low and high load) and three levels of fault severity (healthy state, 70% breakage and full broken rotor bar). Each test consisted of a 10-s startup transient, followed by a steady-state motor operation. Figure 4 shows an example of a stator current time-frequency distribution of one of the motor tests with one broken rotor bar. The trajectories of the two fault-related harmonics observed are parallel to the first frequency component in both regimes. However, this paper aims to demonstrate that this fault can be diagnosed even in transient regimes. For this reason, only one section of the startup transient is used for diagnosis purposes. This section is circled in Figure 4, where only the middle six seconds are considered to avoid edge effects at the end of the transient, but especially at the beginning.
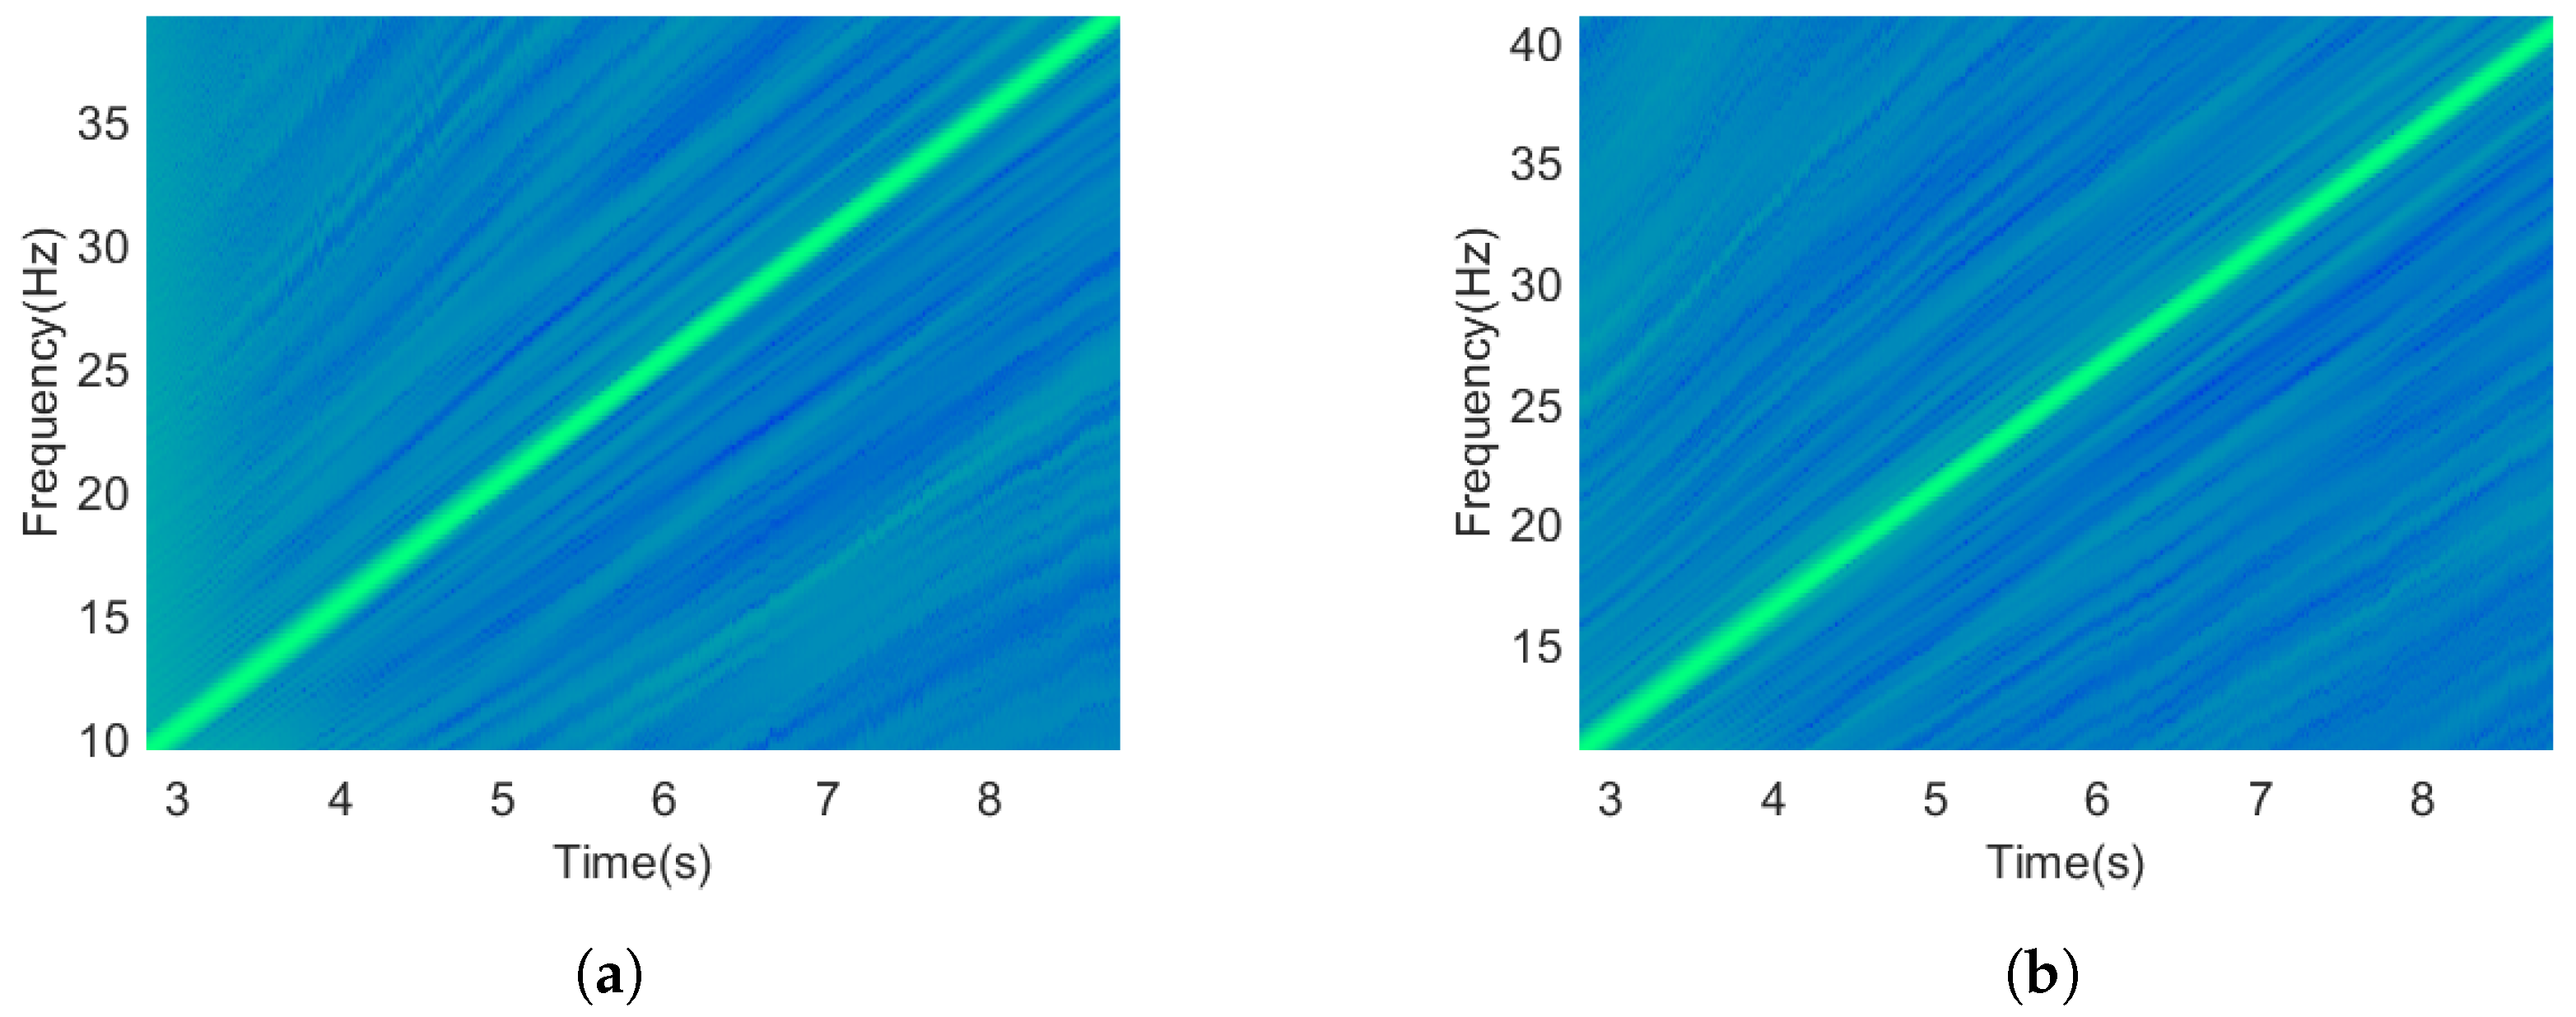
The Dragon Transform has been applied to all laboratory tests to obtain their time-frequency distributions. Some examples, for the middle 6 s, are shown in Figure 5. The fault severity quantification is the energy density in the time-frequency distribution along the fault-related harmonics trajectory, as shown in Figure 5. The excellent time and frequency resolutions delivered by the Dragon Transform permits the observation of the fault-related trajectories (see Figure 5c,d), which are absent in the healthy cases (see Figure 5a,b). These combined resolutions allow us to quantify the fault severity during the transient.
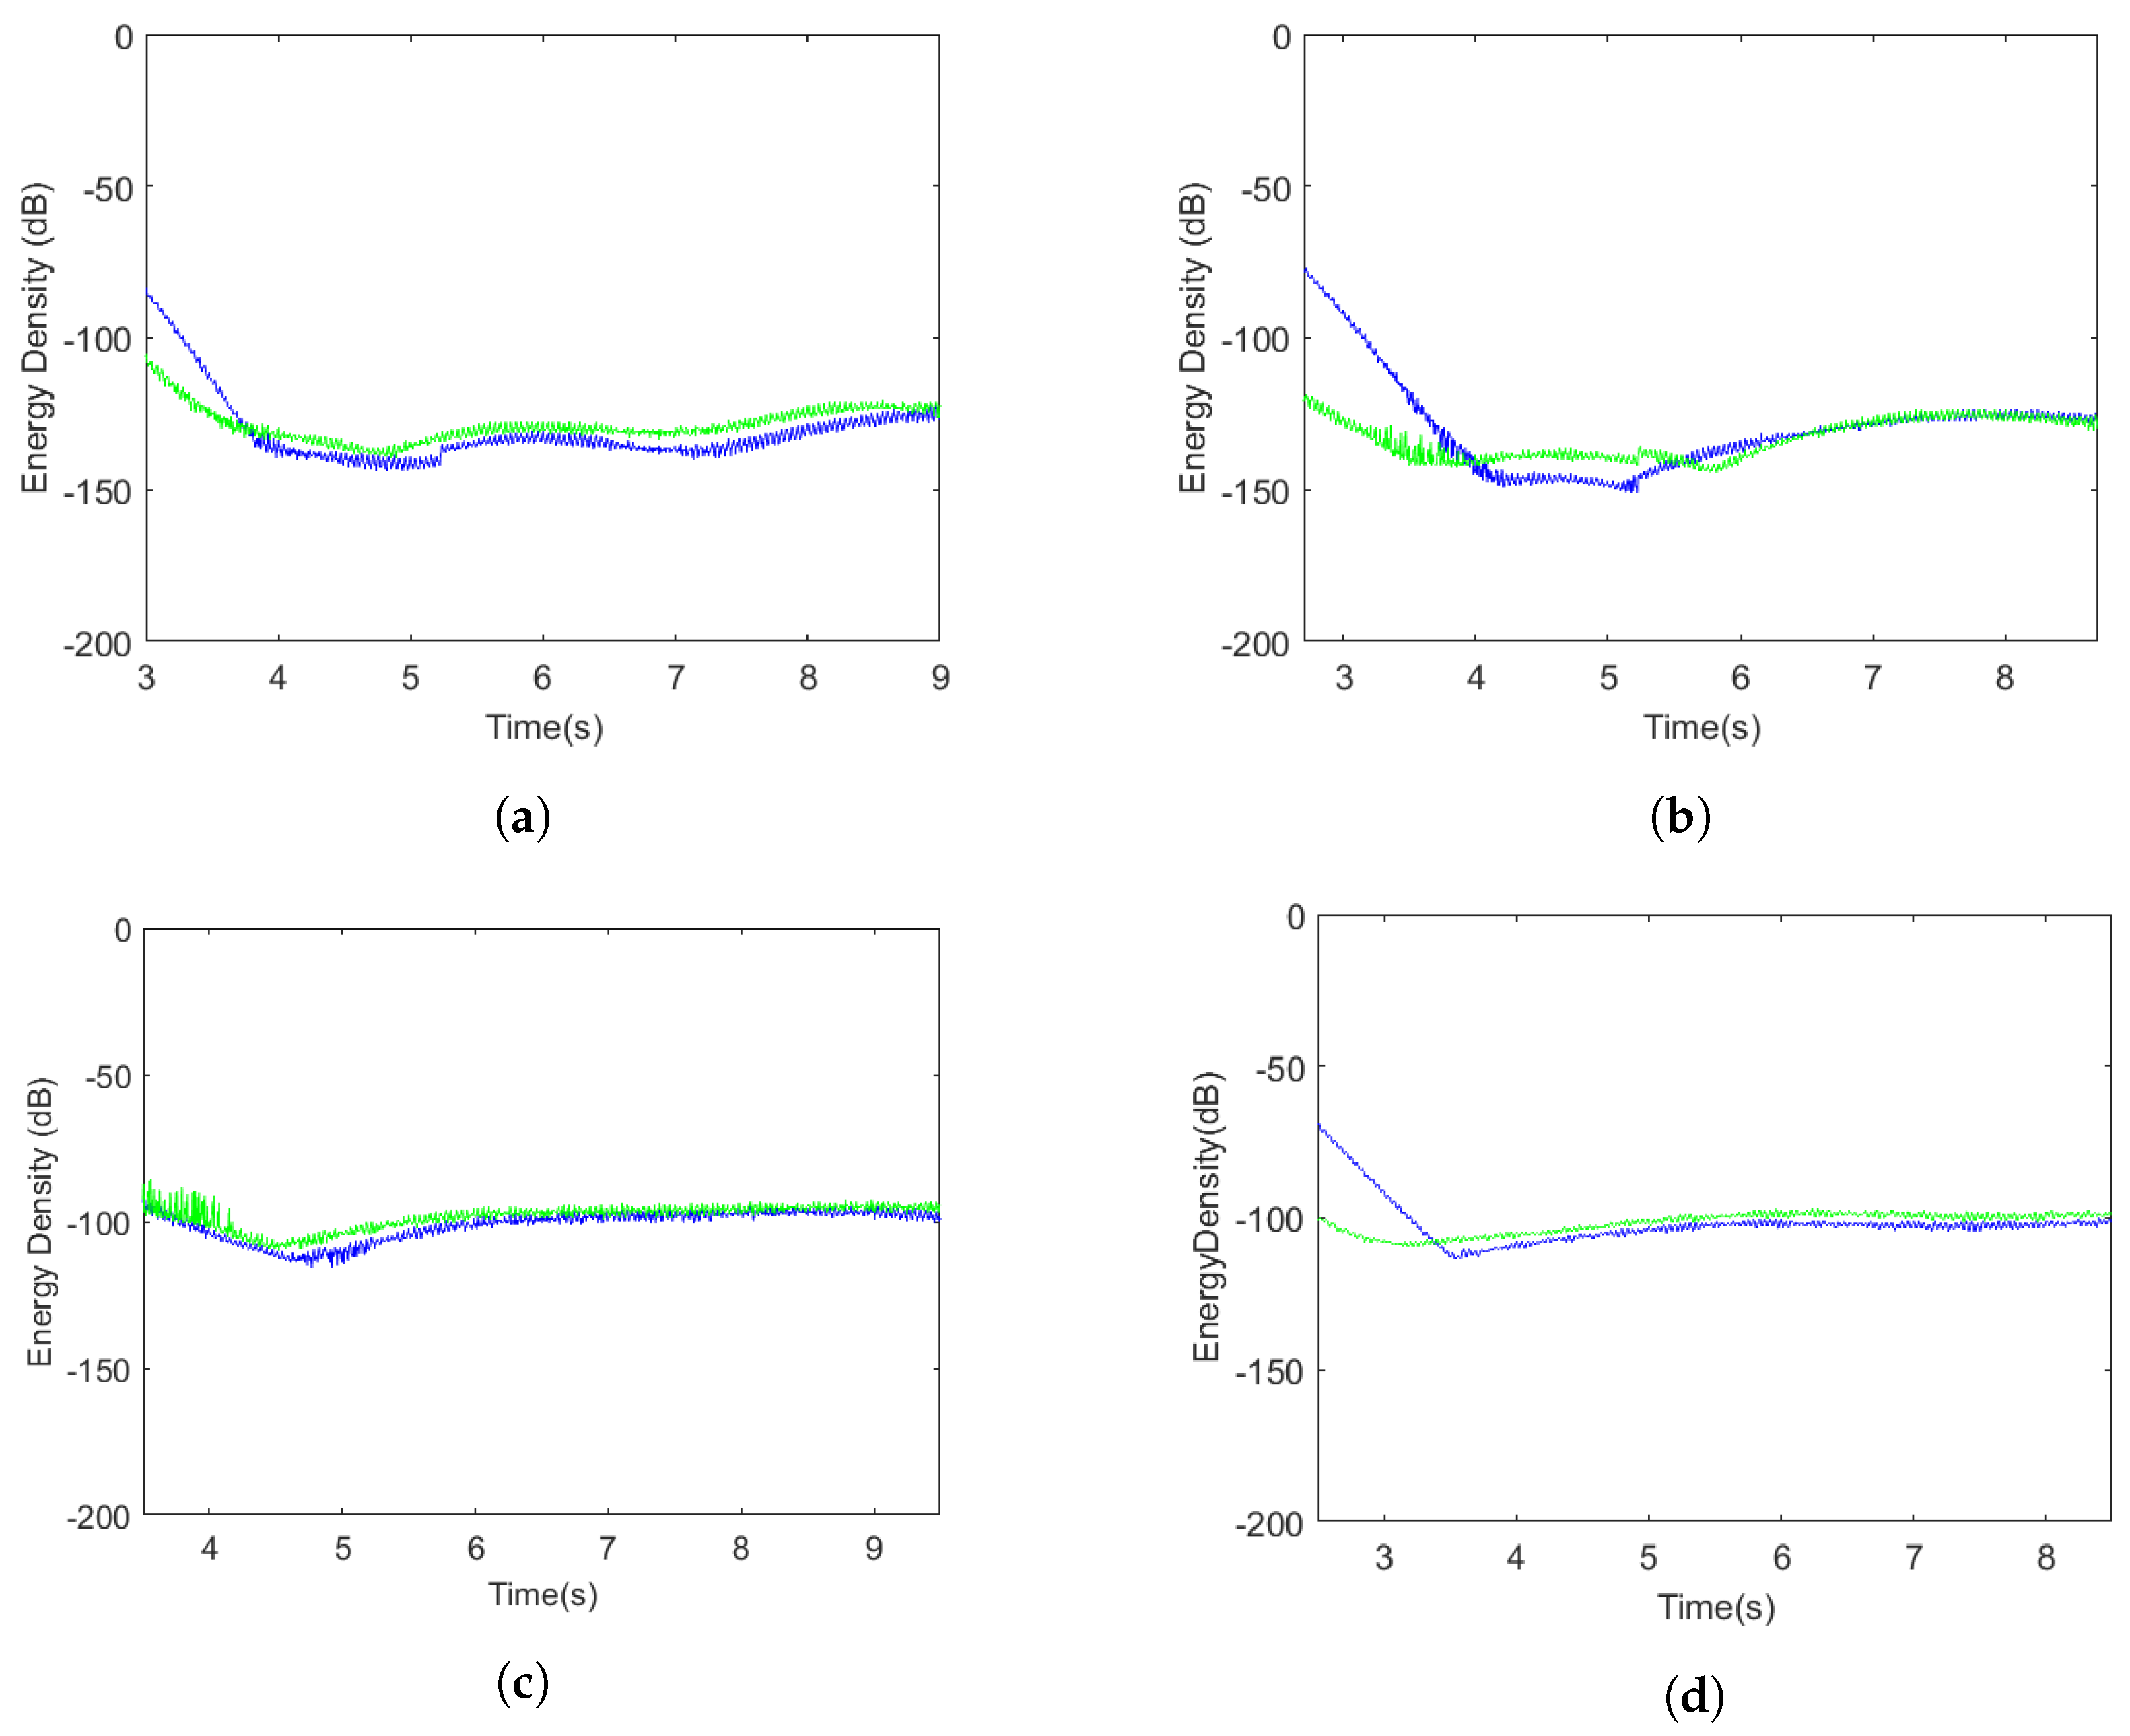
Figure 6 shows the energy of the fault-related harmonics along the trajectories given by Equation (4). As it can be observed, the energy of the faulty trajectories (Figure 6c,d) is higher than the healthy cases (Figure 6a,b). These quantification curves have been calculated for all laboratory tests and are the input to the ANOVA to achieve the fault diagnosis during the startup transient.

4.2. Fault Diagnosis with ANOVA

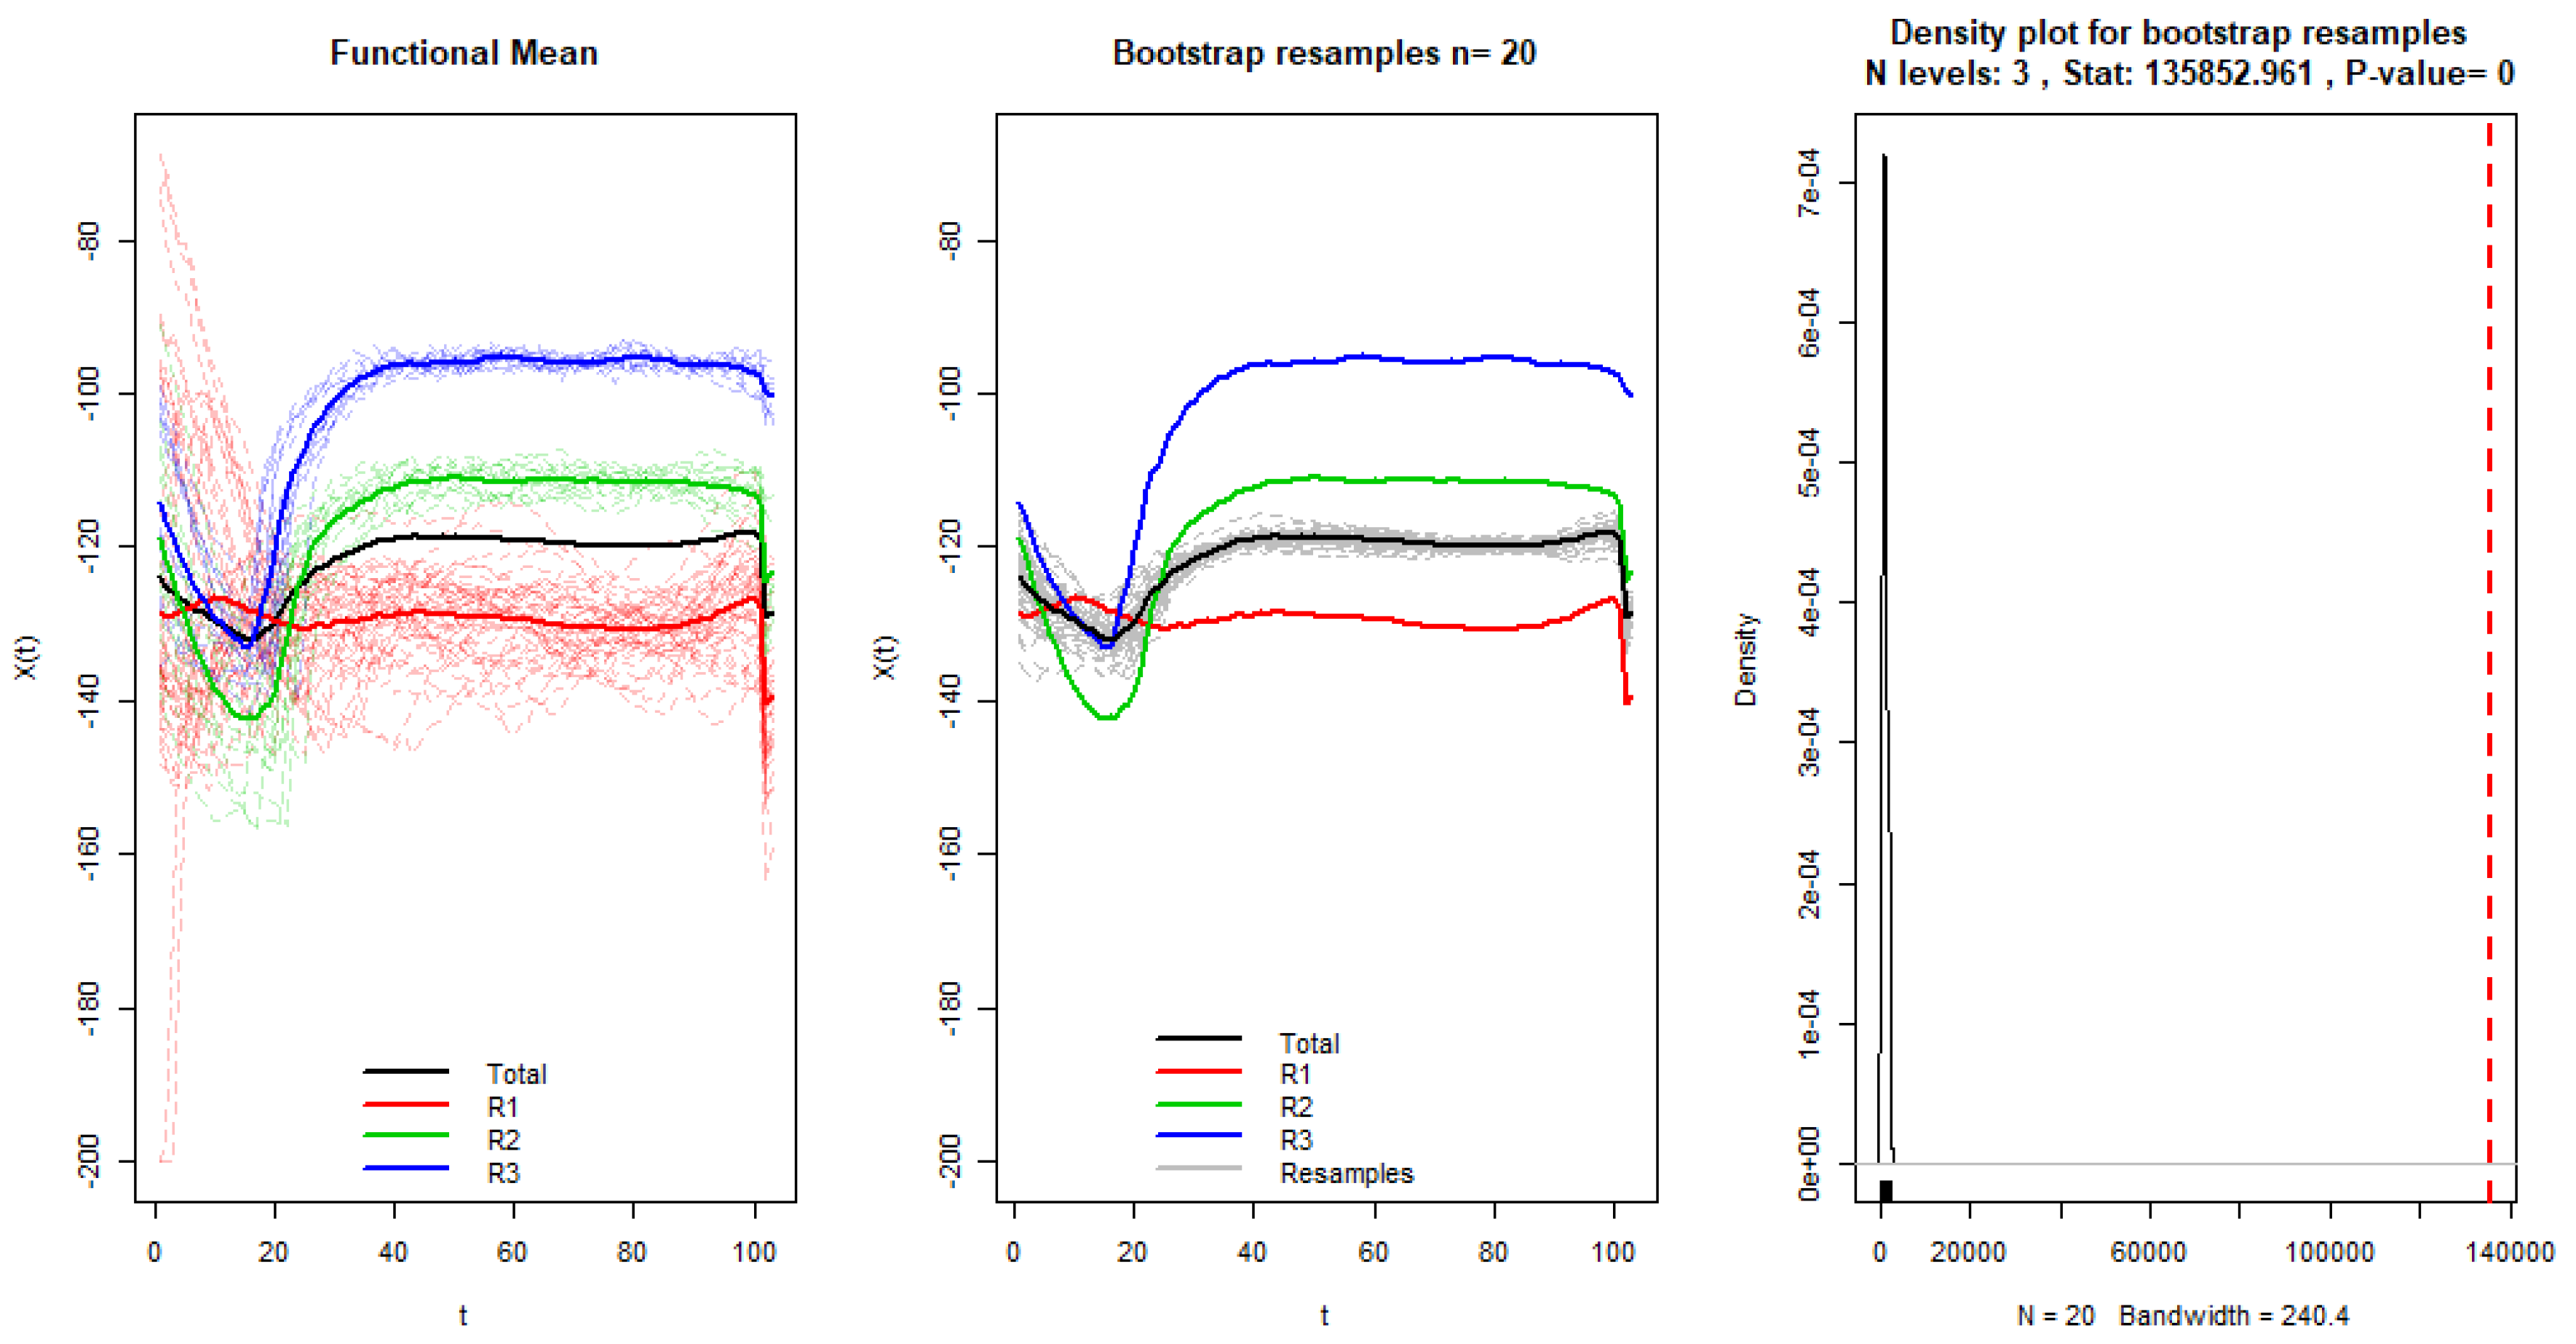
In this section, we provide the results obtained applying the functional ANOVA procedures to the set of curves obtained from the time-frequency distributions given by the Dragon Transform from the stator currents of all laboratory experiments on three different situations. This procedure will serve to analyze whether the mean curves for the three categories in which fault severities are classified (healthy motor, medium fault, and full fault) can be considered the same or if significant differences among mean curves can be detected. In the first scenario, motors under high load are considered, using the USH values provided by the Dragon Transform as input values for the functional ANOVA. Notice that as only the USH values are used and not the LSH values, the procedure is not considering all the available information and thus even better results would be obtained if both sidebands are used as input. The results for this first scenario are given in Figure 7. The left panel shows the mean curves for each of the three states considered (solid lines, red for healthy motor state R1, green for medium fault state R2 and blue for full fault state R3) together with all curves for each state (dotted color lines) and the global mean (solid black line). In the middle panel the mean curves are pictured together with dotted grey lines simulating the type of variability expected for the mean curves if the equality of means condition H 0 holds. It can be seen that the mean colored curves, in all cases monitored, are placed apart from the grey curves suggesting that the null hypothesis H 0 does not hold. This appreciation is confirmed in the right panel by seeing the bootstrap simulated values for the functional ANOVA test statistic (dashed red vertical line) and that show how the value of the test statistics are highly unlikely to be generated by the distribution of the test statistic under the null hypothesis. The p-value is close to 0, which clearly reinforces the rejection decision of the equality of mean curves stated under the null hypothesis H 0 .
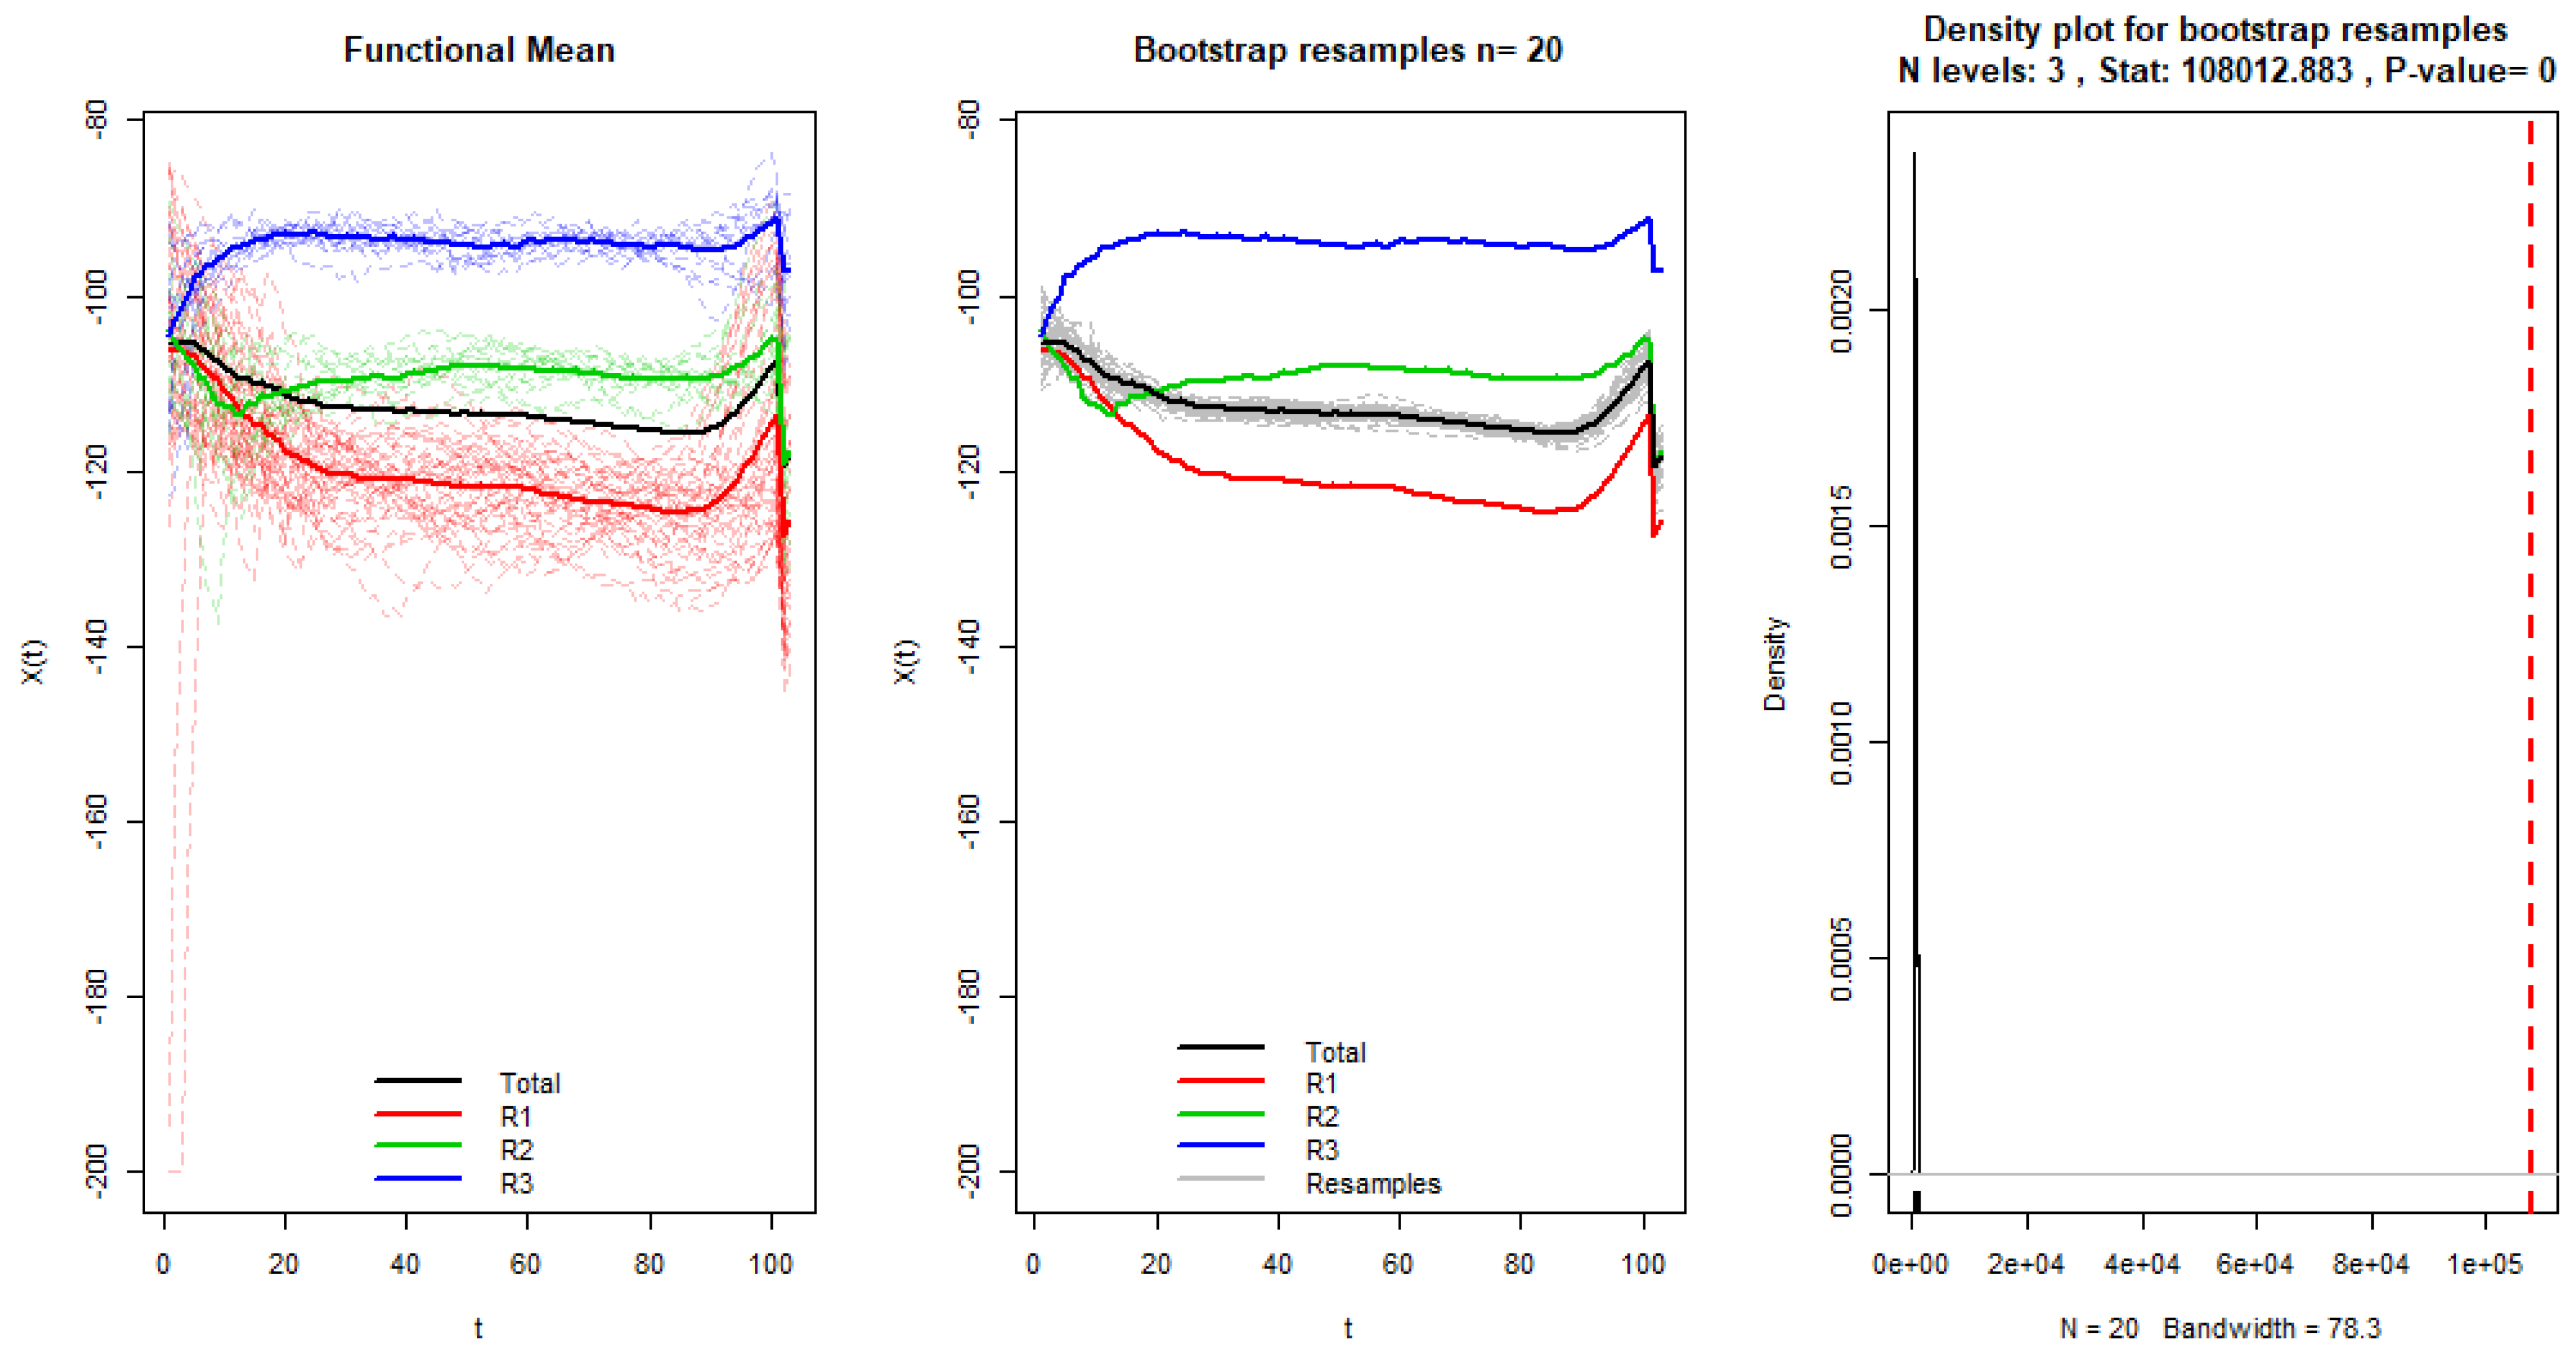
The second scenario is that of low-load motors, which is a condition that makes diagnosis more difficult. As in the previous case, only the functional ANOVA procedure with the USH values is provided. The results obtained are shown in Figure 8. The third panel of the figure shows that the functional ANOVA also clearly detects the differences among the three mean curves.
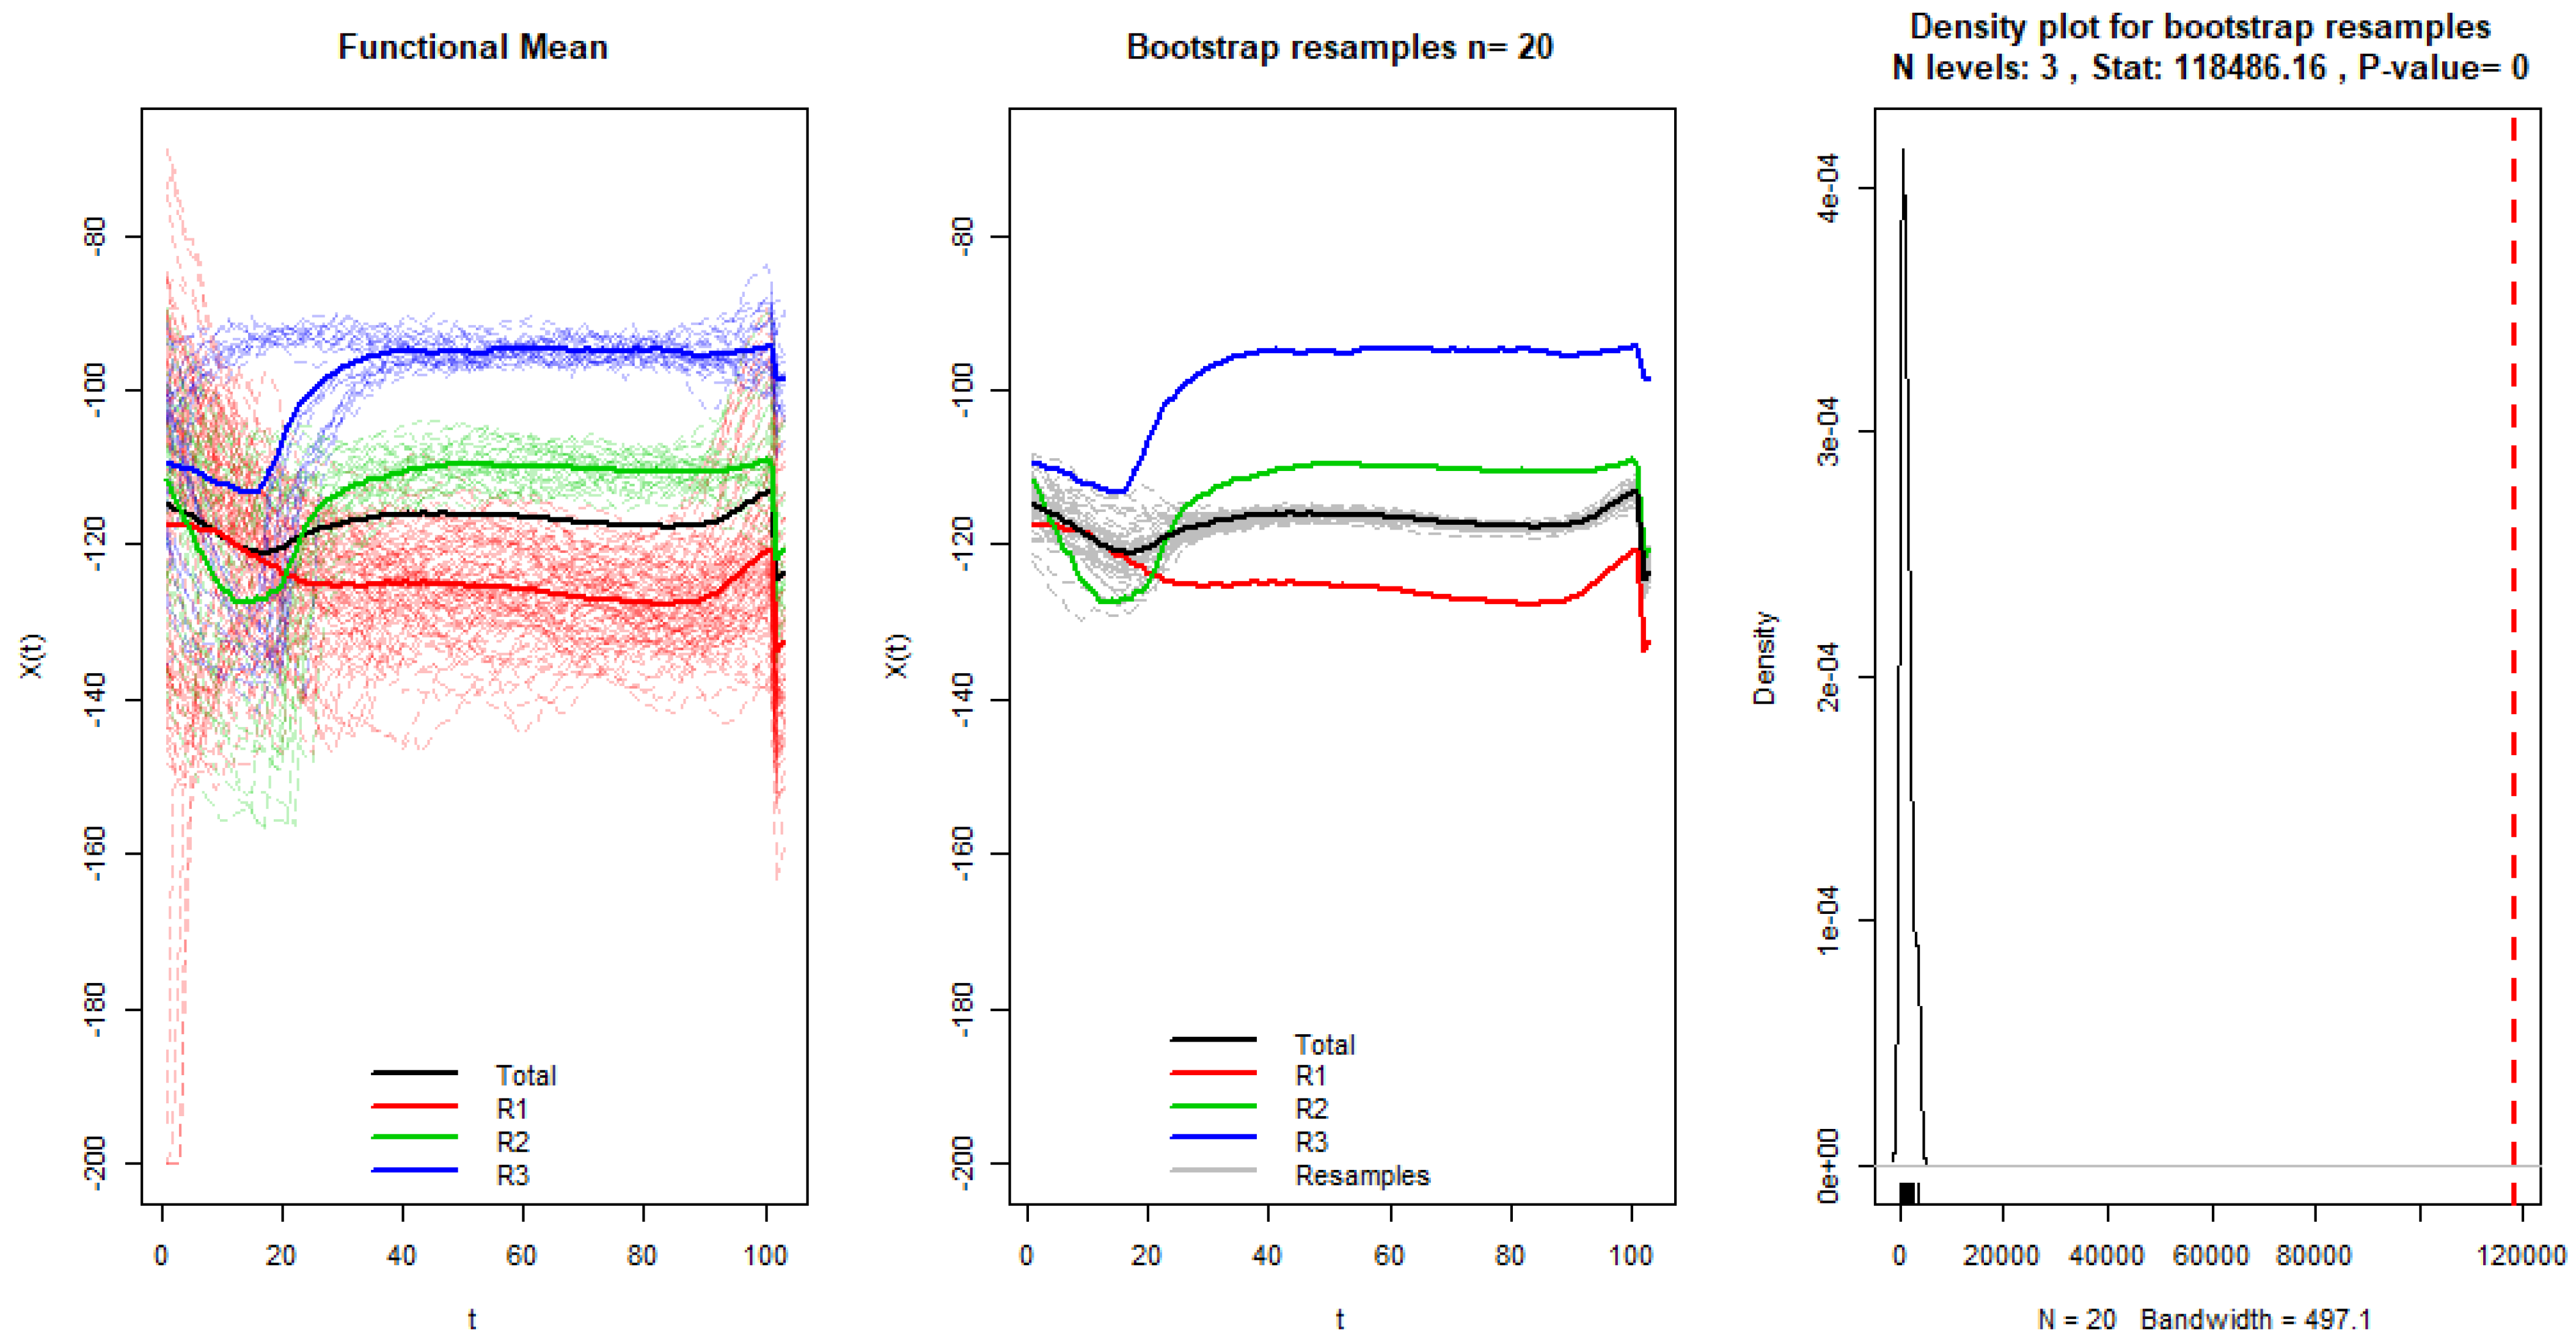
Finally, to check what would happen for the general case when the motor can be working under different load levels, a third scenario is considered where all USH values are provided independently of the motor load. The first panel of Figure 9 shows that this should be a more difficult situation for the functional ANOVA procedure since there is more confusion among the curves. However, the third panel of Figure 9 shows that even in this more general scenario, the functional ANOVA detects the difference among the mean curves of the three different motor states with a 0 p-value.
These results open the door to consider the Dragon Transform curves as a powerful diagnostic tool for detecting troubles in the state of the motors. The previous figures also show that apart from an initial readjusting stage where undesired border effects are eliminated, sustained increased values of these curves are a clear symptom of troubles in these motors and that this seems to be always the case independently of the load level analyzed.

5. Conclusions

Although much effort has been put in recent years in developing techniques for fault detection and diagnosis of the condition of induction motors, there are still challenges to be solved. One of the main challenges is to solve the difficulties in the diagnosis introduced by the inverter operation, which is widely spread presently. To solve these problems, this paper has proposed the use of the Dragon Transform together with the statistical technique known as functional ANOVA. The Dragon Transform allows obtaining time-frequency curves with sufficient resolution to highlight the trajectory of the fault harmonics. In addition, it allows quantifying these trajectories, which opens the door to apply statistical techniques to support the diagnosis. In this sense, the use of functional ANOVA has been proposed to perform the diagnosis working directly with the curves obtained after the application of the aforementioned transform.
The capability of the proposed methodology has been tested in a case study in which an induction motor driven by an inverter has been tested under different load regimes and in three different states of rotor bar breakage. The good results obtained both at high and low load (especially complicated situation for the case of broken bars) have been shown. Even the ability to diagnose correctly including different load regimes at the same time has been proved. However, the proposed methodology should be tested with motors operating at very low loads, although this situation may not be very common in the industry.
The methodology presented in this paper can be implemented in a cloud computing system or dedicated mini-pc. Signal capturing does not need a high sampling frequency as far as low-pass filters are used to avoid frequency aliasing. The ANOVA is not very computer demanding but the calculation of the Dragon Transform requires more computing power than a microcontroller.

Author Contributions

Conceptualization, D.M.-S., L.A.G.-E., M.A.F.-T. and O.D.-P.; methodology, V.F.-C., L.A.G.-E. and J.P.-L.; software, V.F.-C., L.A.G.-E. and J.P.-L.; validation, M.A.F.-T. and O.D.-P.; investigation, V.F.-C. and L.A.G.-E.; resources, D.M.-S. and L.A.G.-E.; data curation, V.F.-C., L.A.G.-E. and J.P.-L.; writing—original draft preparation, O.D.-P., V.F.-C., L.A.G.-E. and D.M.-S.; writing—review and editing, M.A.F.-T. and J.P.-L.; visualization, V.F.-C., L.A.G.-E. All authors have read and agreed to the published version of the manuscript.

Funding

This research has been partially funded by the University of Valladolid.

Institutional Review Board Statement

Not applicable.

Informed Consent Statement

Not applicable.

Data Availability Statement

Not applicable.

Conflicts of Interest

The authors declare no conflict of interest.

Abbreviations

The following abbreviations are used in this manuscript:
IMInduction motor
LSHLower side harmonic
USHUpper side harmonic

References

  1. Yahia, K.; Cardoso, A.; Zouzou, S. Broken Rotor Bars Diagnosis in an Induction Motor Fed From a Frequency Converter: Experimental Research. Int. J. Syst. Assur. Eng. Manag. 2012, 3, 40–46. [Google Scholar] [CrossRef]
  2. Asad, B.; Vaimann, T.; Kallaste, A.; Belahcen, A.; Rassõlkin, A.; Iqbal, M.N. Broken rotor bar fault detection of the grid and inverter fed induction motor by effective attenuation of the fundamental component. IET Electr. Power Appl. 2019, 13, 2005–2014. [Google Scholar] [CrossRef]
  3. Finley, R.; Lang, N.; Harshman, M.; Gaerke, T. Optimizing motor and drives packages for best cost of ownership, performance & reliability. In Proceedings of the 2012 Petroleum and Chemical Industry Conference (PCIC), New Orleans, LA, USA, 24–26 September 2012; pp. 1–13. [Google Scholar] [CrossRef]
  4. Beleiu, H.G.; Maier, V.; Pavel, S.G.; Birou, I.; Pică, C.S.; Dărab, P.C. Harmonics Consequences on Drive Systems with Induction Motor. Appl. Sci. 2020, 10, 1528. [Google Scholar] [CrossRef] [Green Version]
  5. De La Barrera, P.M.; Otero, M.; Schallschmidt, T.; Bossio, G.; Leidhold, R. Active broken rotor bars diagnosis in induction motor drives. IEEE Trans. Ind. Electron. 2020, 1. [Google Scholar] [CrossRef]
  6. Asad, B.; Vaimann, T.; Belahcen, A.; Kallaste, A.; Rassõlkin, A. Rotor Fault Diagnostic of Inverter Fed Induction Motor Using Frequency Analysis. In Proceedings of the 12th International Symposium on Diagnostics for Electrical Machines, Power Electronics and Drives (SDEMPED), Toulouse, France, 27–30 August 2019; IEEE: Danvers, MA, USA, 2019; pp. 127–133. [Google Scholar] [CrossRef] [Green Version]
  7. Ganesan, S.; David, P.W.; Balachandran, P.K.; Samithas, D. Intelligent Starting Current-Based Fault Identification of an Induction Motor Operating under Various Power Quality Issues. Energies 2021, 14, 304. [Google Scholar] [CrossRef]
  8. Romero-Troncoso, R.; Garcia-Perez, A.; Morinigo-Sotelo, D.; Duque-Perez, O.; Osornio-Rios, R.; Ibarra-Manzano, M. Rotor unbalance and broken rotor bar detection in inverter-fed induction motors at start-up and steady-state regimes by high-resolution spectral analysis. Electr. Power Syst. Res. 2016, 133, 142–148. [Google Scholar] [CrossRef]
  9. Yumurtaci, M.; Üstün, S.; Nese, S.; Çymen, H. Comparison of Output Current Harmonics of Voltage Source Inverter used Different PWM Control Techniques. Weas Trans. Power Syst. 2008, 11, 695–704. [Google Scholar]
  10. Martin-Diaz, I.; Morinigo-Sotelo, D.; Duque-Perez, O.; Romero-Troncoso, R.J. An Experimental Comparative Evaluation of Machine Learning Techniques for Motor Fault Diagnosis Under Various Operating Conditions. IEEE Trans. Ind. Appl. 2018, 54, 2215–2224. [Google Scholar] [CrossRef]
  11. Wolbank, T.M.; Stojicic, G.; Nussbaumer, P. Monitoring of partially broken rotor bars in induction machine drives. In Proceedings of the IECON 2010—36th Annual Conference on IEEE Industrial Electronics Society, Glendale, AZ, USA, 7–10 November 2010; IEEE: Danvers, MA, USA, 2019; pp. 912–917. [Google Scholar] [CrossRef]
  12. Gyftakis, K.N.; Antonino-Daviu, J.A.; Garcia-Hernandez, R.; McCulloch, M.D.; Howey, D.A.; Marques Cardoso, A.J. Comparative Experimental Investigation of Broken Bar Fault Detectability in Induction Motors. IEEE Trans. Ind. Appl. 2016, 52, 1452–1459. [Google Scholar] [CrossRef] [Green Version]
  13. Chen, J.; Hu, N.; Zhang, L.; Chen, L.; Wang, B.; Zhou, Y. A Method for Broken Rotor Bars Diagnosis Based on Sum-of-Squares of Current Signals. Appl. Sci. 2020, 10, 5980. [Google Scholar] [CrossRef]
  14. Elvira-Ortiz, D.A.; Morinigo-Sotelo, D.; Zorita-Lamadrid, A.L.; Osornio-Rios, R.A.; Romero-Troncoso, R.D.J. Fundamental Frequency Suppression for the Detection of Broken Bar in Induction Motors at Low Slip and Frequency. Appl. Sci. 2020, 10, 4160. [Google Scholar] [CrossRef]
  15. Fernandez-Cavero, V.; Morinigo-Sotelo, D.; Duque-Perez, O.; Pons-Llinares, J. A Comparison of Techniques for Fault Detection in Inverter-Fed Induction Motors in Transient Regime. IEEE Access 2017, 5, 8048–8063. [Google Scholar] [CrossRef]
  16. Fernandez-Cavero, V.; Pons-Llinares, J.; Duque-Perez, O.; Morinigo-Sotelo, D. Detection and quantification of bar breakage harmonics evolutions in inverter-fed motors through the dragon transform. ISA Trans. 2021, 109, 352–367. [Google Scholar] [CrossRef] [PubMed]
  17. Fernandez-Cavero, V.; Pons-Llinares, J.; Duque-Perez, O.; Morinigo-Sotelo, D. Detection of broken rotor bars in non-linear startups of inverter-fed induction motors. In Proceedings of the 12th International Symposium on Diagnostics for Electrical Machines, Power Electronics and Drives (SDEMPED), Toulouse, France, 27–30 August 2019; IEEE: Danvers, MA, USA, 2019; pp. 309–315. [Google Scholar] [CrossRef]
  18. Pons-Llinares, J.; Antonino-Daviu, J.; Roger-Folch, J.; Moríñigo-Sotelo, D.; Duque-Pérez, O. Mixed eccentricity diagnosis in Inverter-Fed Induction Motors via the Adaptive Slope Transform of transient stator currents. Mech. Syst. Signal Process. 2014, 48, 423–435. [Google Scholar] [CrossRef]
  19. Ramsay, J.; Silverman, B.W. Functional Data Analysis; Springer: New York, NY, USA, 2005. [Google Scholar] [CrossRef]
  20. Ferraty, F.; Vieu, P. Nonparametric Functional Data Analysis; Springer: New York, NY, USA, 2006. [Google Scholar] [CrossRef]
  21. Cuevas, A.; Febrero, M.; Fraiman, R. An anova test for functional data. Comput. Stat. Data Anal. 2004, 47, 111–122. [Google Scholar] [CrossRef]
  22. Febrero-Bande, M.; de la Fuente, M.O. Statistical Computing in Functional Data Analysis: The R Package fda.usc. J. Stat. Softw. Artic. 2012, 51, 1–28. [Google Scholar] [CrossRef] [Green Version]
  23. R Core Team. R: A Language and Environment for Statistical Computing; R Foundation for Statistical Computing: Vienna, Austria, 2018; Available online: https://www.R-project.org/ (accessed on 8 March 2021).
  24. Zhang, J. Analysis of Variance for Functional Data; Chapman and Hall/CRC: New York, NY, USA, 2013. [Google Scholar] [CrossRef]
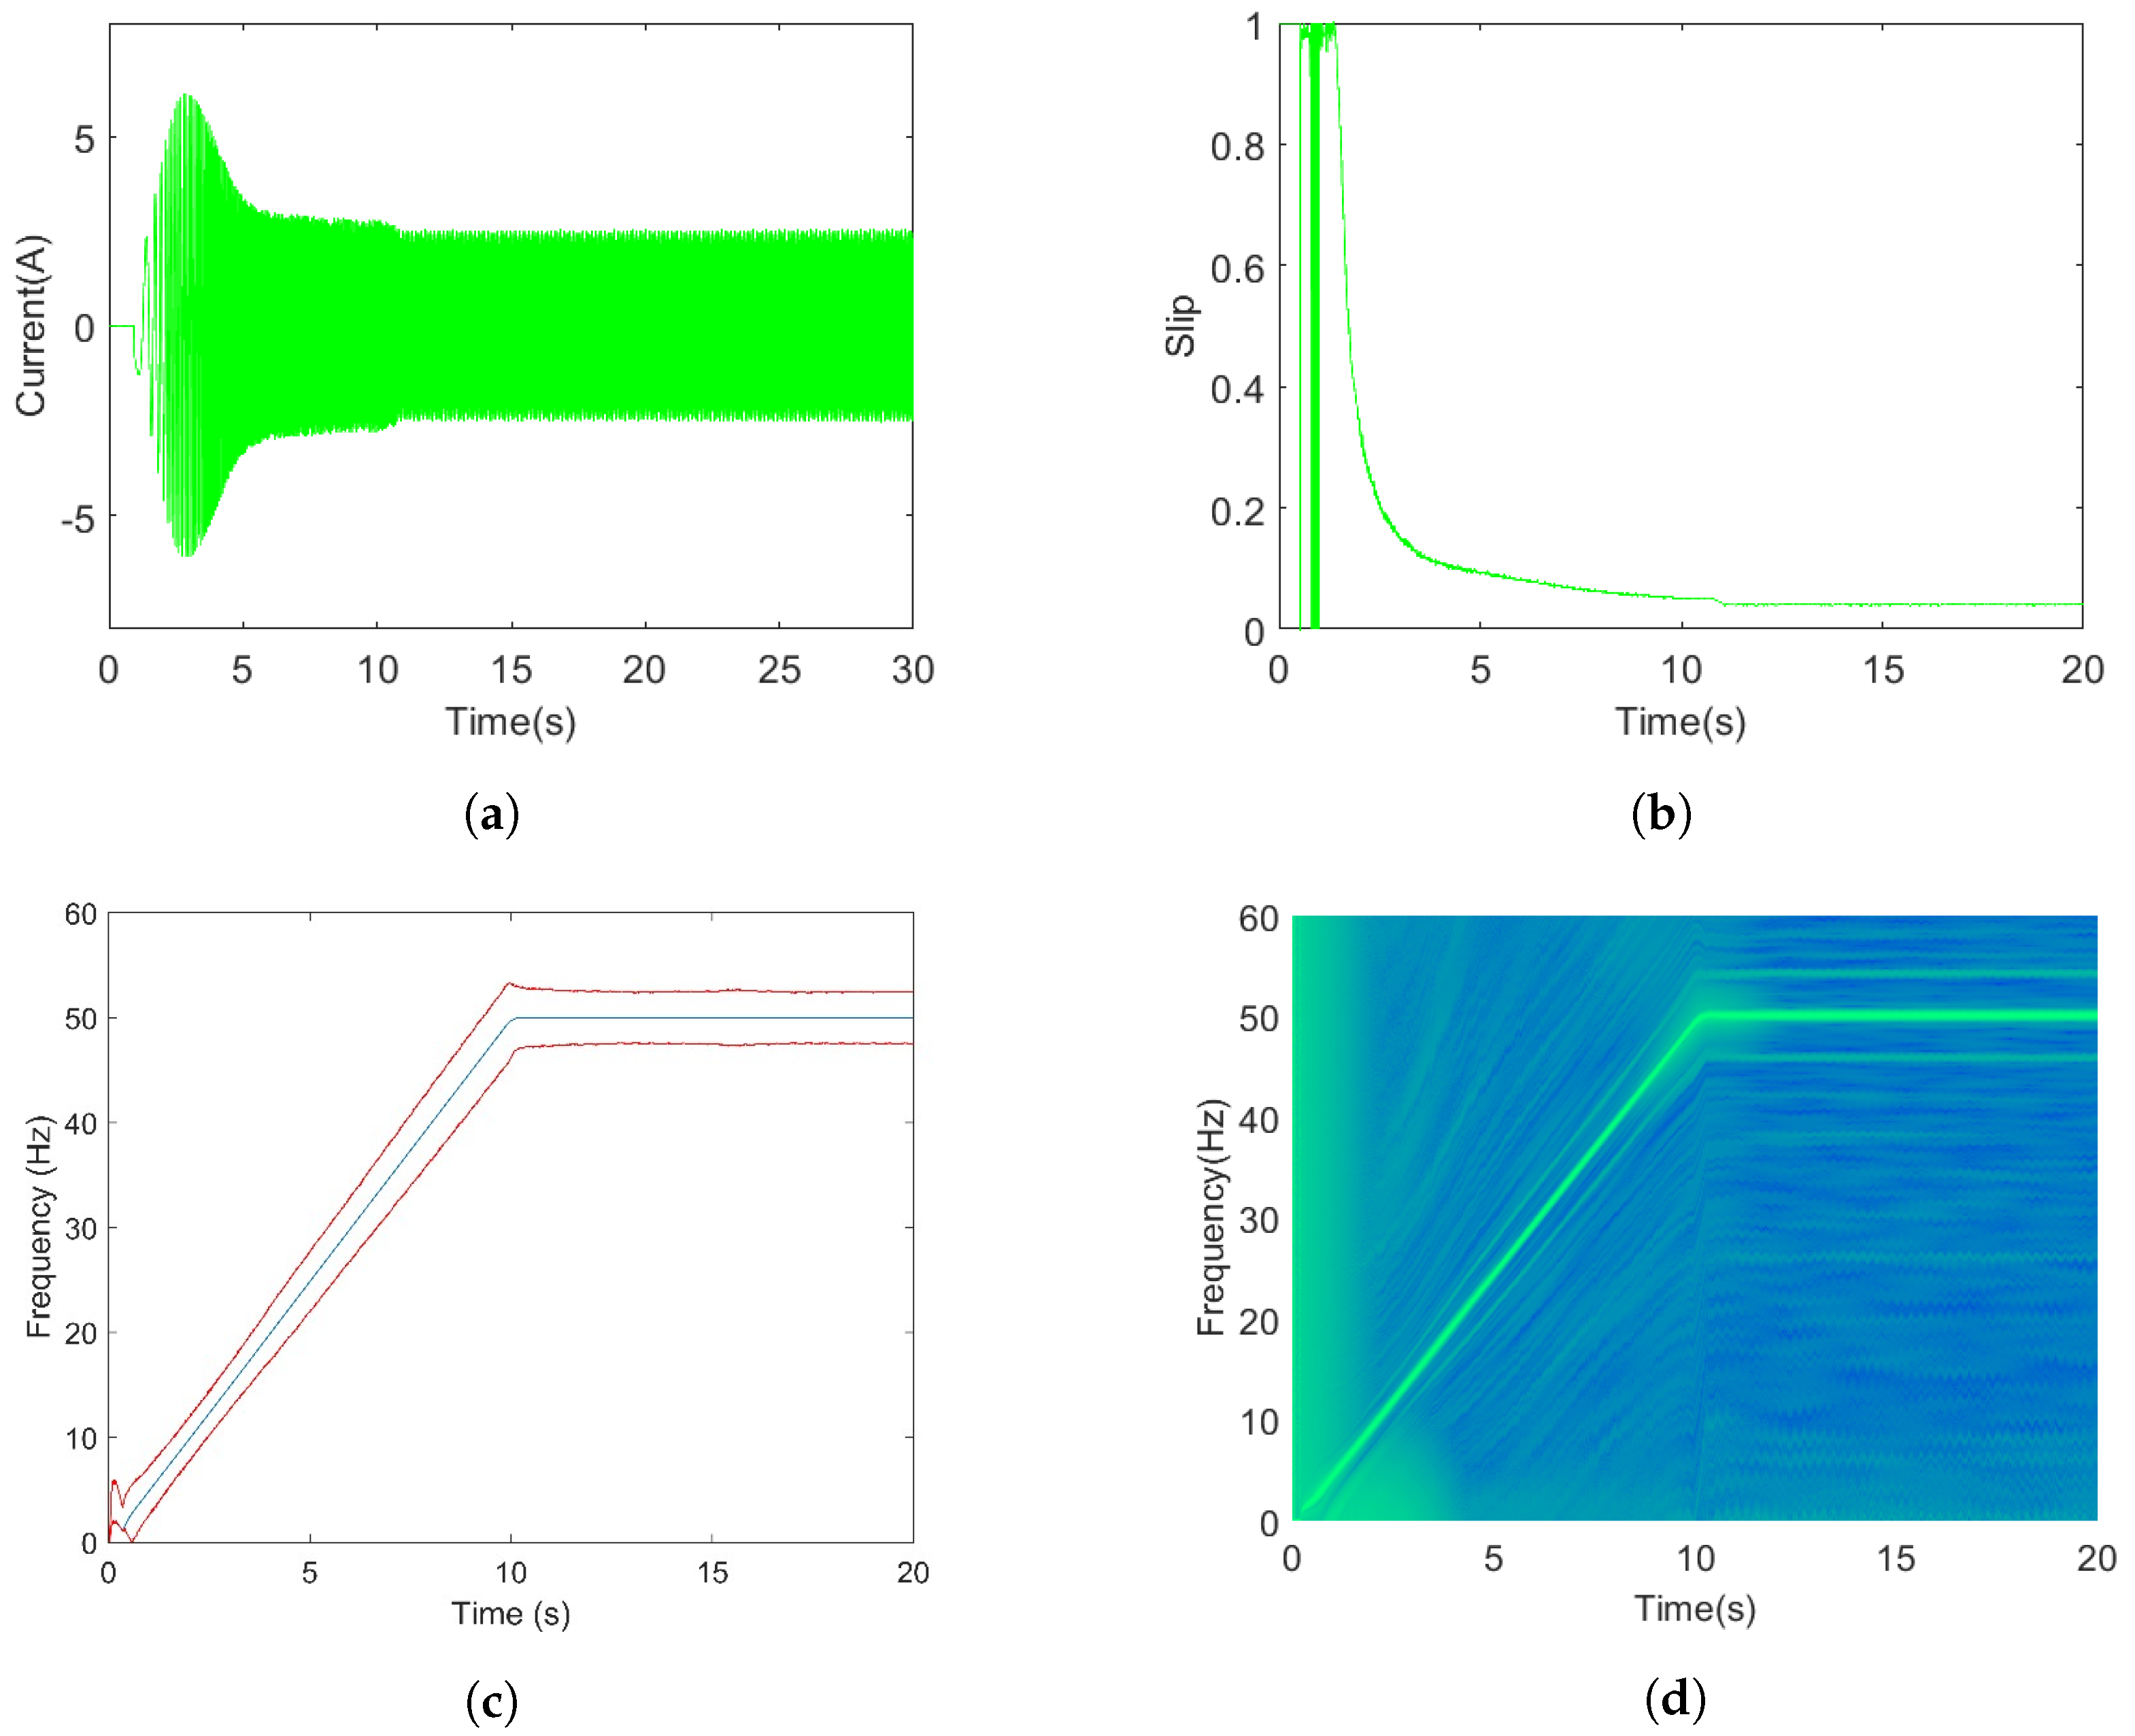
Figure 1. Analysis with the Dragon Transform of the stator current of an inverter-fed induction motor with a broken rotor bar during a linear startup: (a) Stator current; (b) Motor slip; (c) Theoretical trajectories of the first component and the bar breakage harmonics; (d) Time-frequency distribution of the stator current given by the Dragon transform.
Applsci 11 03769 g001
Figure 2. Fault severity quantification of the case shown in Figure 1: time evolution of the energy density along the bar breakage harmonic trajectories (LSH in blue and USH in green).
Applsci 11 03769 g002
Figure 3. Elements of the test bench: (1) Induction motor; (2) Magnetic powder brake; (3) Brake control unit; (4) Laptop; (5) Custom-made board of sensors; (6) CompaqDAQ by National Instruments; (7) ABB inverter.
Applsci 11 03769 g003
Figure 4. Time-frequency distribution of the stator current. The black circle marks the area analyzed.
Applsci 11 03769 g004
Figure 5. Time-frequency distributions of the stator current for the following cases: (a) Healthy motor under low load; (b) Healthy motor under high load; (c) Motor with one broken rotor bar under low load; (d) Motor with one broken rotor bar under high load.
Applsci 11 03769 g005aApplsci 11 03769 g005b
Figure 6. Fault severity quantification curves from the time-frequency distribution of Figure 5 for the following: (a) Healthy motor under low load; (b) Healthy motor under high load; (c) Motor with one broken rotor bar under low load; (d) Motor with one broken rotor bar under high load
Applsci 11 03769 g006
Figure 7. Functional ANOVA results of the analysis of the upper harmonic (USH) trajectories with the motor under high load.
Applsci 11 03769 g007
Figure 8. Functional ANOVA results of the analysis of the upper harmonic (USH) trajectories with the motor under low load.
Applsci 11 03769 g008
Figure 9. Functional ANOVA results of the analysis of the upper harmonic (USH) trajectories with the motor under both load levels.
Applsci 11 03769 g009
Publisher’s Note: MDPI stays neutral with regard to jurisdictional claims in published maps and institutional affiliations.