Article

Machine Learning Applied to the NOx Prediction of Diesel Vehicle under Real Driving Cycle

1
Transportation Pollution Research Center, National Institute of Environmental Research, (Environmental Research Complex), Hwangyeong-ro 42 Seo-gu, Incheon 22689, Korea
2
Department of Environmental Engineering, Inha University, Incheon 22212, Korea
3
National Infrastructure Research Division, Korea Research Institute for Human Settlements, 5 Gukchaegyeonguwon-ro, Sejong-si 30149, Korea
*
Author to whom correspondence should be addressed.
Appl. Sci. 2021, 11(9), 3758; https://doi.org/10.3390/app11093758
Submission received: 15 March 2021 / Revised: 12 April 2021 / Accepted: 19 April 2021 / Published: 21 April 2021
(This article belongs to the Section Environmental Sciences)

Abstract

:
Euro 6 standards impose stringent nitrogen oxide (NOx) emission limits on diesel cars. NOx emissions are significantly different between Euro 6 diesel cars and the previous standards in real-world driving. In this research, the NOx concentrations of Euro 6 diesel engines during real-world driving were studied considering various factors. Real driving emission (RDE) tests were conducted using vehicles equipped with portable emissions measurement systems. Urban, rural, and motorway test routes were utilized. Road environment, atmospheric, and after-treatment performance factors were collected in each case. An artificial neural network was used for evaluation using RDE test data and various statistical parameters. It was found that the proposed method predicted the pollutant emissions effectively. Lastly, the relative importance of each predictor was derived, and the NOx concentrations were analyzed. These approaches provide accurate emission information for an environmental effect evaluation that reflects more realistic road conditions.

1. Introduction

Diesel-powered vehicles emit higher levels of NOx and particulate matter (PM) [1], which are airborne pollutants having direct effects on human health [2]. The types of NOx exhausted from diesel cars are primarily aerosols, followed by particulate formations [3,4]. Many countries pay serious attention to NOx emissions, and several efforts have been made to meet the stringent regulations for the vehicular emissions of criteria pollutants [5,6]. The Euro 6 standard imposes a significant reduction in NOx emissions from diesel engines compared to Euro 5. For instance, Euro 6 is a huge improvement over Euro 5, whereby the NOx limit has decreased from 0.18 to 0.08 g/km, showing a 56% reduction, while it is 84% lower than that of the Euro 3 level [7,8]. These results are closely connected to development of exhaust gas recirculation (EGR), selective catalytic reduction (SCR), and combustion and fuel injection systems for clean combustion engines, which are dedicated to reducing the NOx emissions from diesel vehicles.
However, studies have proven that there are NOx emission gaps between actual emission and laboratory tests [9,10], implying that emissions standards are less effective in reality than expected [11,12]. Expectedly, an emissions scandal occurred, which is also known as Dieselgate, in September 2015 [13,14]. To solve the gaps between on-road and laboratory tests, RDE tests were conducted by the EU in 2017 [15]. The RDE test procedure using a portable emission measurement system (PEMS) involves measuring the pollutants emitted by vehicles during real-world driving. Although PEMS operates under limited driving conditions such as altitude and temperature, on the road, it reflects the real driving conditions [16]. Owing to these advantages, analyses of gaseous emission characteristics from diesel vehicles under realistic road conditions have been conducted using the RDE test procedure [17,18].
There has been a considerable amount of research on the factors affecting NOx emissions of diesel cars under realistic road conditions with the previous standards (prior to Euro 6). These studies indicated that the NOx emissions from diesel cars in previous standards were significantly affected by the road grade, showing a decline with decreasing vehicle speed during uphill driving (ranging from 3.8 to 5.3 g·L−1 on the basis of vertical grades) [19].
Furthermore, the driving pattern factors, such as speed and acceleration, were observed to affect the environment because of NOx emissions. These factors related to road environmental parameters could have significant effects on NOx emissions [20,21]. For instance, vehicular traffic leads to an increase in air pollutants, which is one of the main sources in internal combustion engine processes.
Meanwhile, Euro 6 diesel vehicles are subjected to emission control technologies, and the NOx emissions from Euro-6 diesel vehicles can be well controlled by utilizing NOx control technologies such as EGR and combustion and fuel injection systems for clean combustion engines [8]. Recently, academia and industry have researched and invested in conventional diesel combustion to develop an innovative combustion system for improving the CO2 and the NOx soot tradeoffs; examples include advanced combustion concepts, specific bowl design, and advanced fuel injection systems, which are becoming a part of the ICE context [22,23]. All these strategies can effectively clean the exhaust gases, as well as contribute to an improvement in efficiency and performance for NOx reductions in real road conditions [24,25].
This finding implies that road environmental factors have little impact on NOx in the Euro 6 standard. However, the extent to which these factors affect NOx emissions in real-world driving is unknown. Similar studies for Euro 6 diesel vehicles are lacking because of the more complex interactive mechanisms of NOx formation in Euro 6 diesel vehicles than in the previous standards. Thus, the current method cannot be applied to road networks in South Korea for NOx emissions from Euro 6 diesel vehicles. Thus, the NOx emissions of Euro 6 diesel vehicles under real driving conditions, considering three types of factors influencing the NOx emissions (road environmental factors, atmospheric factors, and after-treatment performance factors) need to be investigated.
Accordingly, the objectives of this research were as follows: (1) to test Euro 6 light-duty diesel vehicles using PEMSs under real-world driving conditions in South Korea; (2) to collect the various types of data (road environment, atmospheric, and after-treatment performance factors) from the tested vehicles; (3) to propose an artificial neural network (ANN) approach as an evaluation tool and perform model verifications; (4) to derive the relative importance of NOx concentration values and analyze NOx concentrations using the proposed method.
This study was focused on determining the NOx emissions of Euro 6 light-duty diesel engines during real-world driving using the proposed ANN approach as an evaluation tool; the artificial intelligence model is widely used to deal with big data in various research areas. ANN models have been applied to pollutants and meteorological areas as estimation models.
This study demonstrates the NOx concentrations of Euro 6 diesel vehicles as a function of the road environment, atmospheric conditions, and after-treatment performance factors, all of which were explored separately by previous studies. The proposed ANN model could be applied to road networks in South Korea for a better understanding of NOx concentrations during the real driving of Euro-6 diesel vehicles.

2. Methodology

2.1. Artificial Neural Network

An artificial neural network (ANN) is a computing system designed to simulate the way the human brain analyzes and processes information, which has self-learning capabilities, enabling it to produce better results. The ANN model is a systematic and appropriate tool for handling complex and big data, which is widely used to deal with big data in various research areas [26,27]. In particular, the ANN model has been applied as an estimation model for pollutants and meteorological areas [28,29].
Furthermore, the ANN model determines the complex interactions (road environment, atmospheric conditions, and after-treatment performance factors) in terms of the NOx emissions from diesel-engine vehicles. For this reason, the model can deal with the probability of an event with high variability of NOx emissions using complex variables for diesel engine functions. In this section, the multilayer perceptron (MLP) and backpropagation (BP) are reviewed as the main functions of ANNs. In this study, MLP and BP were implemented using neuralnet in R program, which is a programming language for statistical computing.

2.2. Multilayer Perceptron

A multilayer Perceptron (MLP) is a class of feedforward artificial neural network (ANN), referring to networks composed of multiple layers of perceptrons with threshold activation. MLPs are widely used in different research studies and consist of input, hidden, and output segments. Furthermore, the MLP has nodes and activation functions [30]. The MLP structure in the ANN model is given by
y = f ( i = 1 N ω i x i + θ ) ,
where xi denotes the inputs, ωi denotes the weights, Σ is the summing function, f is the activation function, and y is the output.
Figure 1 presents the schematic of an MLP, where the input signals ( x 1 ,   x 2 , x n ) denote the cell inputs. The weights (ω) are multiplied by the input signals; then, the net input is formed by summing the threshold values varying from −1 to +1.
There are three activation functions—tangent hyperbolic, sigmoid, and linear functions—in the ANNs that are used for research [31,32]. Of these, the sigmoid function is commonly applied to generalize an ANN, which predicts the probability as an output because probability exists only between 0 and 1. Therefore, the sigmoid function applied in this study can be defined as
x = 1 1 + e x .

2.3. Backpropagation Training

Backpropagation of error (henceforth BP) is a method for training feedforward neural networks. For training data, the BP algorithm in the R package program was applied in this study. The BP algorithm is applied to compute the gradient of the loss function for weights in ANNs, and it is the most widely used for optimizing network performance in the process of adjusting weights [33,34].
BP training consists of three steps. In the first step, the respective layer starts with the first hidden layer and each unit in that layer. This procedure is followed by the computation of the output of the activation function of the unit. The activation function of the hidden layer unit is given by
O b = h h i d d e n ( p = 1 P i b . p W b . p + b b ) , where   h h i d d e n ( x ) = 1 1 + e x .
In Equation (3), Ob is the output of the current hidden layer unit b, P is either the number of units in the previous hidden layer or the number of network inputs, ib.p is an input to unit b from either the previous hidden layer unit p or the network input p, Wb.p is the weight modifying the connection from either unit p to unit b or from input p to unit b, and bb is the bias. The unit calculates activity x using the sigmoid function hhidden(x) of the total weighted input.
In the second step, the error term is computed for each unit in the hidden layer. In this way, the computation task is conducted for different values between the output and actual network output. Here, the direction of propagation is from layer B to layer A. The error term is given by
δ b = h H i d d e n ( x ) n 1 N δ n ω n , b ,
where N represents the number of units in the other hidden layer, δn is the error term for a unit in the next layer, and wn,b is the weight modifying the connection from unit b to unit n.
The third step involves changing the weight that modifies every connection from the hidden layer unit p or network input p to unit b is according to
w b , p = α δ b O p ,
where α denotes the learning rate, and Op is the output of unit p or the network input p.
The BP training converges to a near-optimal solution on the basis of the total squared error after all three steps, if no weights have different values. The process is calculated as shown below.
E b = 1 2 b 1 b ( D b O b ) 2 ,
where b represents the number of units in the output layer, Db is the desired network output, and Ob is the actual network.

3. Data Description

3.1. Selection of Test Routes

The European Commission (EC) has suggested test routes in accordance with RDE requirements, and these routes can be divided into three types: urban, rural, and motorway routes. The distance share is distributed as follows: 29–44% in urban sections, 23–43% in rural sections, and 23–43% in motorway sections. The driving speed is 60 km/h or less in urban sections, between 60 and 90 km/h in rural sections, and more than 90 km/h in motorway sections [35].
In compliance with the RDE light-duty vehicle (LDV) regulations suggested by the EC, the Ministry of Environment in South Korea developed RDE LDV routes (KOR-NIER Route) with PEMSs [36,37]. Figure 2 presents the KOR-NIER routes for cold and hot tests, which were set in Seoul city and its surroundings, as summarized in Table 1. The total length of the KOR-NIER route for the cold test is 90.6 km: 32.7 km in urban sections, 29.0 km in rural sections, and 28.9 km in motorway sections. The total length of the KOR-NIER route for the hot test is 73.6 km: 26.5 km in urban sections, 19.7 km in rural sections, and 27.4 km in motorway sections.

3.2. Dataset

In this study, three tested Euro 6 light-duty diesel vehicles were selected for data. The tested diesel vehicles collected various types of variables using PEMS devices in 1 s intervals over 6 days. PEMS is a vehicle emission-testing device, which was designed to meet worldwide regulatory standards in a package that can be installed in a wide range of light-duty vehicles. PEMS measures exhaust flow such as the NOx emitted from vehicles during field testing on roads. Table 2 lists the information about the tested vehicles utilized in this research.
The NOx emission of Euro 6 diesel vehicles cannot be explained by one segment because the interactive mechanisms of NOx formation in the Euro 6 diesel vehicle are more complex than those in the previous diesel vehicle standards. These interactive mechanisms are mutually affected by three segments, including road environmental and atmospheric factors; furthermore, the after-treatment performance can be a critical factor, unlike in the case of the previous standard.
The road environment factors include the location (longitude and latitude), road grade (vertical slope) calculated from the altitude (mean of 20.4 m and maximum of 79 m for the cold test and mean of 25.1 m and maximum of 175 m for the hot test in these test routes), and distance, where there were two or three lanes with widths of 3.5 m in the RDE test routes. The collected road data, such as road grade, have considerable effects on the NOx emission rate; in particular, a higher road grade leads to a higher NOx emission rate while driving [38]. In addition, the altitude influences the NOx emission rate [39]. Furthermore, in terms of vehicle speed, the acceleration and deceleration of the vehicle are strongly correlated with NOx emissions [40].
All these variables in the road environmental factors can be summarized as concepts of vehicle-specific power (VSP), [41,42]; the VSP value has been used to determine vehicle emissions [43,44] and can be defined as follows:
VSP = A r V + B V 2 + C V 3 + M V ( a + g sin θ ) M ,
where VSP is the instantaneous power per unit mass of the vehicle ( kW / ton ) , a is the vehicle acceleration ( m / s 2 ), V is the vehicle speed (m/s), A r is the rolling resistance coefficient ( kW s / m ) , B is the speed correction to the rolling resistance coefficient ( kW s 2 / m 2 ) , C is the air drag resistance coefficient ( kW s 3 / m 3 ) , M is the vehicle mass ( ton ) , θ is the road grade ( % ) , and g   is   the gravitational constant ( 9.8   m S 2 ) .
Therefore, the VSP method was applied in this study, and the passenger car coefficient values of A r   ( 0.156461 ) , B   ( 0.00200193 ) , C   ( 0.000492646 ) , and M   ( 1.4788 ) suggested by the EPA were used.
Regarding atmospheric factors, including the NOx concentrations, data on relative humidity, ambient temperature, and ambient pressure were collected; these attributes are important variables that strongly affect NOx concentrations. For example, NOx emissions are highly affected by the ambient temperature and relative humidity, and higher NOx concentrations result from lower temperatures and higher relative humidity values [45,46].
As an after-treatment performance factor, the EGR rate is a critical parameter for NOx emissions, defined as the percentage of exhaust gases constituting the total gas mass induced into the engine. A higher EGR rate denotes lower NOx emissions levels [47]. Therefore, the EGR rate value was used in this study.
The intake air temperature has a dominant effect on the NOx emissions from internal combustion engines [48]. The intake air temperature is measured by a sensor located on the bottom of the intake manifold inside the vehicle, placed directly behind the throttle valve housing. In general, temperature readings can be ±10 °C compared to the ambient temperature of the vehicle, depending on the outside temperature and the temperature of the engine. The mean intake air temperature was approximately 7 °C higher than the mean ambient temperature, as presented in Table 3.
NOx emissions can differ between hot and cold tests during engine starting. NOx emissions increase when a diesel catalyst temperature at the inlet of the Urea-SCR catalyst is not sufficiently high [49]. A few researchers indicated that the NOx emissions during cold starts were higher than during warm-engine operation. Cold starting is a major contributor of NOx emissions in diesel cars [50]. After-treatment systems deteriorate functionally at low temperatures during an engine cold start [51]. The catalytic converter then generates smoke pollution [52,53]. Therefore, the EC added cold-start provisions as part of the third regulatory RDE package [54]. Nonetheless, there were no measured SCR performance data (Urea-SCR catalyst temperature) or LNT data from PEMSs in these tests. Consequently, the Urea-SCR catalyst temperature data were replaced with exhaust temperature data, as the exhaust is directly related to the catalyst temperature in a diesel engine. Generally, SCR performance can be effective at temperatures around 200 °C in rural and motorway regions. LNT catalysts can store NOx effectively at lower temperatures in urban regions with low speed; subsequently, trapped NOx is released from the catalyst when the engine operation mode is switched to rich conditions.
Figure 3 presents a comparison of NOx concentrations during a cold start (KOR-NIER Route 1) and hot start (KOR-NIER Route 2) in an example of one diesel test vehicle listed in Table 2. The figure shows that the NOx mean value is 8.3 ppm during the cold test, which is 8.3 times higher than the 1.0 ppm obtained during the hot test over 500 s. These results indicate that catalyst light-off issues during cold start are very important for pollutant emissions [55].

4. ANN Model Establishment

4.1. Data Classification

Table 3 describes the input variables used in the proposed ANN. The dataset consisted of eight features, one dependent (y) and seven independents ( x 1 ,   x 2 . ,     and   x   7 ), all of which were numerical values. Range and mean were collected through 6 days of experiments in different scenarios for the neural network, as defined in Table 3.

4.2. Data Normalization and Training

The data were normalized within the 0 to 1 range before training the ANN; this approach leads to faster convergence and error reduction. Table 4 summarizes the normalized values for each variable.
In this study, the applied MLP architecture consisted of seven inputs and one neuron in the output layer; furthermore, the architecture was designed to have two neurons in the hidden layer as fewer hidden nodes are generally preferred to avoid overfitting. The datasets in the ANNs were categorized into two sets (training and testing datasets) for the validation. It is important to split the dataset into training and testing datasets. However, as issues were noted regarding the testing dataset size, 80% of the datasets were used as the training dataset and 20% were used as the testing dataset in some studies to avoid the “overtraining” phenomenon [56]. In this case, a training set size with 80% training data was used, and 20% of the data were used as the validation set in the ANNs.

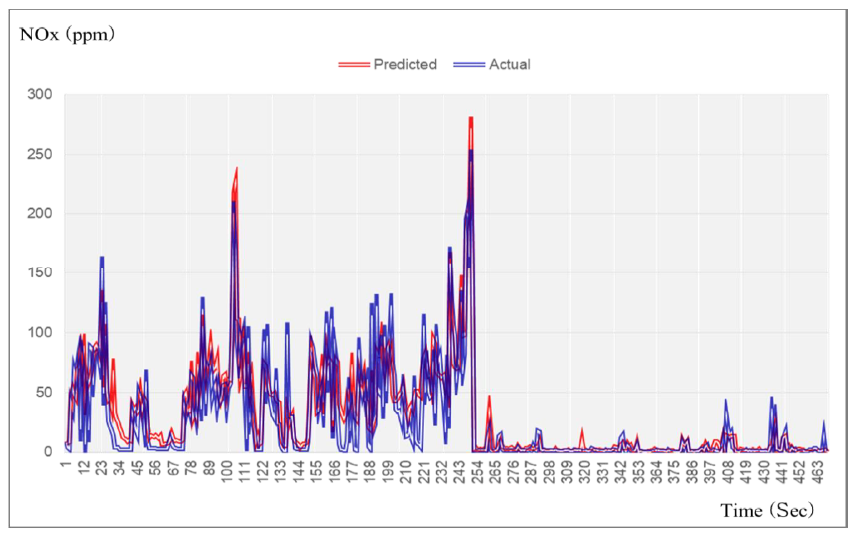
5. Evaluation of Model Performance

The performance of the ANN models was statistically measured with respect to the MSE, RMSE, and CR .
MSE = 1 N i = 1 n ( y i ^ y i ) 2 ,     RMSE = 1 N p i = 1 N p ( y i ^ y i ) 2 ,
CR = n i = 1 N p y i y i ^ i = 1 N p y i i = 1 N p y i ^ n i = 1 N p y i 2 ( i = 1 N p y i 2 ) × n i = 1 N p y i 2 ^ ( i = 1 N p y i 2 ^ ) ,
where y i represents the observed values, y i ^ denotes the predicted values, and N is the training data size. The MSE, RMSE, and CR for the estimation model were determined to be 0.00043, 0.02084, and 0.73, respectively. In the ANN model, CR = 0.73, which indicated a good correlation between the target and predicted outputs. Furthermore, the MSE and RMSE were low. Therefore, the model can be considered to be appropriate for predicting the NOx concentrations from Euro 6 diesel vehicles while driving on realistic roads.
Figure 4 describes the comparison of estimated and actual values, where red and blue lines correspond to the predicted and actual outputs, respectively. The graph depicts the NOx concentrations on the y-axis and the number of input datasets on the x-axis. As shown, the developed ANN model is close to the actual values. The NOx concentrations were relatively high during engine starting, but NOx concentrations tended to decrease and stabilize due to emission reduction technology.

6. Model Application

This method can be applied to real road networks for the analysis of air pollution (NOx), especially for Euro 6 light-duty diesel engines.

6.1. Analysis of Relative Variable Importance

The Garson methodology was applied in this study to calculate variable importance by using the R software package “Garson”. The Garson algorithm is mostly used with ANN models to provide the relative importance for the prediction when using hidden inputs and outputs [57,58,59].
Figure 5 presents the relative variable importance results in ANN, all weights specific to a predictor were generated as values between 0 and 1 to determine the relative predictor importance. Figure 5 displays the relative importance of each predictor in determining the NOx concentration. The effects of each input variable (road environment, atmospheric, and after-treatment performance factors) on NOx concentrations were considered. The results imply that the weights of the EGR rate had the greatest effect on the NOx concentrations value (approximately 46%). The features ranked second, third, and fourth were the ambient temperature, exhaust temperature, and relative humidity with 16.2%, 15.8%, and 15%, respectively. The VSP had the smallest effect on the NOx concentration value (approximately <1% of the total effect), unlike in diesel vehicles compliant with previous standards.
In summary, NOx emissions from Euro 6 light-duty diesel engines were significantly affected by EGR rate and exhaust temperature, which are after-treatment performance factors. On the other hand, the road environment had the smallest effect on NOx concentrations. The NOx emissions of a Euro 6 light-duty diesel engine are the least affected by the road environment conditions (road grade, vehicle speed, and acceleration) because of the development of after-treatment technologies, which adhere to the stringent Euro-6 standards.

6.2. Analysis of NOx Concentrations

In this section, a study on how the NOx concentration would be estimated during real-world driving using data derived from the ANN was conducted. The analysis of the NOx concentrations was performed using data derived from ANN. Figure 6 presents the results of vehicle speed, acceleration, and NOx concentrations as a function of speed classification in the ANN (below 60 km/h (urban), 60–90 km/h (rural), and above 90 km/h (motorway)). The deviation of acceleration/deceleration was relatively large on urban roads because of traffic congestion in urban areas. Meanwhile, the deviation on rural roads and motorways was relatively lower.
The speed distribution below 60 km/h represented a large portion. In terms of the acceleration patterns for speed classification, the acceleration rates were more widely estimated below 60 km/h than for other speed classifications.
However, the NOx concentration was less influenced by the acceleration rate in this case. Furthermore, it was found that higher NOx concentrations were predicted at speeds higher than 90 km/h. This result is assumed to be due to the occurrence of high temperature as a function of high-speed heating of the vehicle engine on the motorway.
So far, dependences on atmospheric factors such as ambient temperature and relative humidity have been overlooked in the inventory of the latest Euro 6 emission standard, but these dependences are important from an air quality perspective [60]. Accordingly, the NOx concentration in terms of ambient temperature and relative humidity, which were regarded as main factors for NOx in the analysis of relative variable importance, were analyzed in this study. Figure 7 presents the results of predicted NOx concentrations as a function of ambient temperature and relative humidity in ANN, where the red circled region presents the section with a relatively high concentration according to speeds and engine condition (cold or hot). It was found that higher NOx concentrations tended to be estimated at low ambient temperatures and high relative humidity within the red dotted circle in Figure 7. In particular, higher NOx concentrations were estimated at ambient temperatures around 20–27 °C and relative humidity around 50–70%.
In the analysis by speed classification, relatively higher NOx concentrations were estimated at low speeds (below 60 km/h; urban area) because of signaled intersections and traffic jams in urban area, which lead to frequent acceleration and braking. Higher NOx concentrations were estimated during the cold phase in the analysis by test type, as the unbalanced circumstances between heat transfer and self-ignition reactions lead to higher NOx emissions in the cold starting process. During this time, combustion suffers from a lack of stability reflected in misfires due to deterioration of the Urea-SCR and after-treatment systems; then, catalytic converters generate smoke pollution, which may escape from the uncontrolled system as tailpipe emissions, when engine block and coolant temperature are low.
Lastly, according to the relative variable importance analysis, after-treatment performance factors were proven to be major factors among all the variables, in terms of affecting NOx concentration. Therefore, the NOx concentrations as a function of the exhaust temperature and EGR rate were evaluated in this study. Figure 8 presents the results of NOx concentrations predicted as a function of exhaust temperature and EGR rate according to speed classification in the ANN. Regarding the NOx concentration as a function of exhaust temperature, according to speed classification, the predicted NOx concentration tended to increase at higher exhaust temperatures up to 200 °C. The point at which SCR and LNT were used was not clear in the exhaust temperature graph, because of a lack of related data, which will be explored in a future study.
According to the analysis of the NOx concentration as a function of the EGR rate according to the speed classification results, the predicted NOx concentration was distributed widely at low EGR rates. The NOx concentration tended to decrease as the EGR rate increased under all speed classifications.

7. Conclusions and Discussion

Euro 6 is a significant improvement over the previous standard owing to the development of after-treatment technologies. Hence, NOx concentrations from Euro 6 diesel cars may be significantly different from previous standards during real-world driving. Accordingly, a comprehensive approach in this study was necessary to analyze the NOx concentrations from a Euro 6 diesel engine, considering three types of factors (road environmental, atmospheric, and after-treatment performance factors). To this end, three tested vehicles (Euro 6 light-duty diesel vehicles), equipped with PEMSs, were used to collect data during real-world driving. Then, an ANN model was established, and the results imply that the accuracy obtained was appropriate for modeling.
In terms of model application, relative variable importance and analyses for NOx concentrations were performed using the ANN model. The relative variable importance results indicated that after-treatment performance factors were highly associated with NOx concentrations, whereby the weight of the EGR rate was the main factor, with the most significant effect on the NOx concentration value. Following this, the ambient temperature, exhaust temperature, and relative temperature had considerable effects on NOx concentrations, while the VSP had the smallest effect on the NOx concentrations, contributing about 0.8 of the total effect. In fact, these road factors were the main factors influencing NOx concentrations in the previous standards.
In the analysis of the NOx concentrations for each variable, the vehicle speed, acceleration, and NOx concentrations were analyzed as a function of speed classifications (below 60 km/h, 60–90 km/h, and above 90 km/h). The acceleration rates at below 60 km/h were widely distributed; however, this acceleration portion showed a low influence on NOx concentrations. Meanwhile, higher NOx concentrations were predicted at high speed. In the NOx concentration obtained as a function of ambient temperature and relative humidity, higher NOx concentrations were estimated at low ambient temperatures and high relative humidity within a specific range. In particular, the higher NOx concentrations were estimated at ambient temperatures around 20–27 °C and relative humidity of 50–70%. Furthermore, relatively higher NOx concentrations were estimated at low speeds, and NOx concentrations were higher during the cold test.
Lastly, in the analysis of the NOx concentration with respect to the after-treatment performance factors, the predicted NOx concentration increased with increasing exhaust temperature up to 200 °C. Furthermore, the predicted NOx concentration tended to decrease as the EGR rate increased in the NOx concentration obtained as a function of the EGR rate.
In summary, the highlights of this study are shown below.
  • Analysis of NOx emissions from Euro 6 diesel engines was conducted.
  • Tests and analyses were performed under real-world driving conditions.
  • Road environmental, atmospheric, and after-treatment factors were collected.
  • The proposed ANN method predicts pollutant emissions (NOx) with good performance.
  • The relative importance of each predictor on NOx emission values was derived.
This research, indeed, had data limitations. For model estimation, various data types are needed that include the different road conditions. The RDE test in this study was conducted within the boundaries specified by the RDE requirements; certain driving conditions were excluded by setting the boundary segments in relation to dynamic driving. Therefore, the ANN model in this study was limited in reflecting various types of road conditions. Furthermore, atmospheric information is needed; in particular, the dependences on atmospheric factors such as ambient temperature and relative humidity in the inventory of the latest Euro 6 emission standard are currently regarded as less important. Thus, performing more experiments with different scenarios or characteristics with different types of vehicles, as well as using emission reduction technology such as SCR and LNT, are necessary. All limitations of this study provide significant opportunities for further research.
However, this research is particularly significant because it determined the NOx concentrations of Euro 6 diesel vehicles on the basis of three main factors (the road environment, atmospheric conditions, and after-treatment performance factors), which were not previously considered together.
This study offers several contributions to the research topic of NOx concentrations from Euro 6 diesel vehicles. First, the proposed method provides information of NOx emissions from Euro 6 diesel cars under more realistic environmental road conditions from the perspective of transport and environment. Second, the proposed method can be used as an environmental guide for decision-makers in the transportation sector to provide pollutant information to the authorities in South Korea. Lastly, this approach can be implemented to allow the development of new innovative technologies for improving its performance, for example, by enhancing the ATS and ICEs, especially for the higher NOx road conditions.

Author Contributions

Conceptualization, J.L. (Jonghak Lee) and S.K.; methodology, H.K.; software, J.L. (Jonghak Lee); formal analysis, J.L. (Jongtae Lee) and J.K.; writing—original draft preparation, J.L. (Jonghak Lee); writing—review and editing, T.Y.; supervision, J.L. (Jongtae Lee). All authors have read and agreed to the published version of the manuscript.

Funding

This research was funded by the Ministry of Environment (MOE) of the Republic of Korea, grant number NIER-2020-03-01-001 and the APC was funded by the Ministry of Environment (MOE) of the Republic of Korea.

Institutional Review Board Statement

Not applicable.

Informed Consent Statement

Not applicable.

Data Availability Statement

Not applicable.

Acknowledgments

This work was supported by a grant from the National Institute of Environmental Research (NIER), funded by the Ministry of Environment (MOE) of the Republic of Korea (NIER-2020-03-01-001).

Conflicts of Interest

The authors declare no conflict of interest.

References

  1. Valverde, V.; Giechaskiel, B. Assessment of Gaseous and Particulate Emissions of a Euro 6d-Temp Diesel Vehicle Driven >1300 km Including Six Diesel Particulate Filter Regenerations. Atmosphere 2020, 11, 645. [Google Scholar] [CrossRef]
  2. Anenberg, S.C.; Miller, J.; Minjares, R.; Du, L.; Henze, D.K.; Lacey, F.; Malley, C.S.; Emberson, L.; Franco, V.; Klimont, Z.; et al. Impacts and mitigation of excess diesel-related NOx emissions in 11 major vehicle markets. Nat. Cell Biol. 2017, 545, 467–471. [Google Scholar] [CrossRef] [PubMed]
  3. Link, M.F.; Kim, J.; Park, G.; Lee, T.; Park, T.; Bin Babar, Z.; Sung, K.; Kim, P.; Kang, S.; Kim, J.S.; et al. Elevated production of NH4NO3 from the photochemical processing of vehicle exhaust: Implications for air quality in the Seoul Metropolitan Region. Atmos. Environ. 2017, 156, 95–101. [Google Scholar] [CrossRef]
  4. Platt, S.M.; El Haddad, I.; Pieber, S.M.; Zardini, A.A.; Suarez-Bertoa, R.; Clairotte, M.; Daellenbach, K.R.; Huang, R.-J.; Slowik, J.G.; Hellebust, S.; et al. Gasoline cars produce more carbonaceous particulate matter than modern filter-equipped diesel cars. Sci. Rep. 2017, 7, 4926. [Google Scholar] [CrossRef]
  5. Transport Policy. Topics: Emissions Standards. 2017. Available online: http://www.transportpolicy.net/topic/emissions-standards (accessed on 12 March 2021).
  6. Winkler, S.L.; Anderson, J.E.; Garza, L.; Ruona, W.C.; Vogt, R.; Wallington, T.J. Vehicle criteria pollutant (PM, NOx, CO, HCs) emissions: How low should we go? npj Clim. Atmos. Sci. 2018, 1, 26. [Google Scholar] [CrossRef]
  7. Johnson, T.V. Review of Vehicular Emissions Trends. SAE Int. J. Engines 2015, 8, 1152–1167. [Google Scholar] [CrossRef] [Green Version]
  8. International Council on Clean Transportation. NOX Control Technologies for Euro 6 Diesel Passenger cars-Market Penetration and Experimental Performance Assessment. 2015. Available online: www.theicct.org (accessed on 11 March 2021).
  9. Baldino, C.; Tietge, U.; Muncrief, R.; Bernard, Y.; Mock, P. Road Tested: Comparative Overview of Real-World Versus Type-Approval NOx and CO2 Emissions from Diesel Cars in Europe; International Council on Clean Transportation: Washington, DC, USA, 2017. [Google Scholar]
  10. Degraeuwe, B.; Weiss, M. Does the New European Driving Cycle (NEDC) really fail to capture the NOX emissions of diesel cars in Europe? Environ. Pollut. 2017, 222, 234–241. [Google Scholar] [CrossRef]
  11. Hooftman, N.; Messagie, M.; Van Mierlo, J.; Coosemans, T. A review of the European passenger car regulations—Real driving emissions vs local air quality. Renew. Sustain. Energy Rev. 2018, 86, 1–21. [Google Scholar] [CrossRef]
  12. Posada, F.; Badshah, H.; Rodriguez, F. In-Use NOx Emissions and Compliance Evaluation for Modern Heavy-Duty Vehicles in Europe and the United States. International Council on Clean Transportation. 2020. Available online: https://theicct.org/publications/inuse-nox-hdvs-us-eu (accessed on 12 March 2021).
  13. Ministero delle Infrastrutture e dei Trasporti; Istituto Motori del CNR. Report Finale Programma di Prove per la Valutazione del Comportamento Emissivo di Vetture Diesel Euro 5 Commercializzate in Italia con Prove in Laboratorio e su Pista; Istituto Motori del CNR: Napoli, Italy, 2017. [Google Scholar]
  14. Parloff, R. How VW paid $25 billion for ’Dieselgate’—And got off easy. Fortune, 28 August 2018. [Google Scholar]
  15. European Commission. Commission regulation (EU) 2017/1151 of 1 June 2017 supplementing Regulation (EC) No 715/2007 of the European Parliament and of the Council on Type-Approval of motor Vehicles With Respect to Emissions from Light Passenger and Commercial Vehicles (Euro 5 and Euro 6) and on Access to Vehicle Repair and Maintenance Information, Amending Directive 2007/46/EC of the European Parliament and of the Council, Commission Regulation (EC) No 692/2008 and Commission Regulation (EU) No 1230/2012 and repealing Commission Regulation (EC) No 692/2008. Off. J. Eur. Union OJL 2017, 175, 1–643. [Google Scholar]
  16. Suarez-Bertoa, R.; Valverde, V.; Clairotte, M.; Pavlovic, J.; Giechaskiel, B.; Franco, V.; Kregar, Z.; Astorga, C. On-road emissions of passenger cars beyond the boundary conditions of the real-driving emissions test. Environ. Res. 2019, 176, 108572. [Google Scholar] [CrossRef]
  17. Chong, H.S.; Park, Y.; Kwon, S.; Hong, Y. Analysis of real driving gaseous emissions from light-duty diesel vehicles. Transp. Res. Part D Transp. Environ. 2018, 65, 485–499. [Google Scholar] [CrossRef]
  18. Costagliola, M.A.; Costabile, M.; Prati, M.V. Impact of road grade on real driving emissions from two Euro 5 diesel vehicles. Appl. Energy 2018, 231, 586–593. [Google Scholar] [CrossRef]
  19. Kean, A.J.; Harley, R.A.; Kendall, G.R. Effects of Vehicle Speed and Engine Load on Motor Vehicle Emissions. Environ. Sci. Technol. 2003, 37, 3739–3746. [Google Scholar] [CrossRef] [Green Version]
  20. Brundell-Freij, K.; Ericsson, E. Influence of street characteristics, driver category and car performance on urban driving patterns. Transp. Res. Part D Transp. Environ. 2005, 10, 213–229. [Google Scholar] [CrossRef]
  21. Ericsson, E. Independent driving pattern factors and their influence on fuel-use and exhaust emission factors. Transp. Res. Part D Transp. Environ. 2001, 6, 325–345. [Google Scholar] [CrossRef]
  22. Paramashivaiah, B.M.; Banapurmath, N.R.; Rajashekhar, C.R.; Khandal, S.V. Studies on Effect of Graphene Nanoparticles Addition in Different Levels with Simarouba Biodiesel and Diesel Blends on Performance, Combustion and Emission Characteristics of CI Engine. Arab. J. Sci. Eng. 2018, 43, 4793–4801. [Google Scholar] [CrossRef]
  23. Chaichan, M.T.; Kadhum, A.A.H.; Al-Amiery, A.A. Novel technique for enhancement of diesel fuel: Impact of aqueous alumina nano-fluid on engine’s performance and emissions. Case Stud. Therm. Eng. 2017, 10, 611–620. [Google Scholar] [CrossRef]
  24. Chiatti, G.; Chiavola, O.; Frezzolini, P.; Palmieri, F. On the link between diesel spray asymmetry and off-axis needle dis-placement. Appl. Sci. 2017, 7, 375. [Google Scholar] [CrossRef] [Green Version]
  25. Bermúdez, V.; Serrano, J.R.; Piqueras, P.; Sanchis, E.J. On the Impact of Particulate Matter Distribution on Pressure Drop of Wall-Flow Particulate Filters. Appl. Sci. 2017, 7, 234. [Google Scholar] [CrossRef] [Green Version]
  26. Biancofiore, F.; Busilacchio, M.; Verdecchia, M.; Tomassetti, B.; Aruffo, E.; Bianco, S.; Di Tommaso, S.; Colangeli, C.; Rosatelli, G.; Di Carlo, P. Recursive neural network model for analysis and forecast of PM10 and PM2.5. Atmos. Pollut. Res. 2017, 8, 652–659. [Google Scholar] [CrossRef]
  27. Russo, A.; Lind, P.G.; Raischel, F.; Trigo, R.; Mendes, M. Neural network forecast of daily pollution concentration using optimal meteorological data at synoptic and local scales. Atmos. Pollut. Res. 2015, 6, 540–549. [Google Scholar] [CrossRef] [Green Version]
  28. Fang, D.; Wang, J. A novel application of artificial neural network for wind speed estimation. Int. J. Sustain. Energy 2015, 36, 1–15. [Google Scholar] [CrossRef]
  29. Sofuoglu, S.C.; Sofuoglu, A.; Birgili, S.; Tayfur, G. Forecasting Ambient Air SO2 Concentrations Using Artificial Neural Networks. Energy Sources Part B Econ. Plan. Policy 2006, 1, 127–136. [Google Scholar] [CrossRef] [Green Version]
  30. Delen, D.; Sharda, R.; Bessonov, M. Identifying significant predictors of injury severity in traffic accidents using a series of artificial neural networks. Accid. Anal. Prev. 2006, 38, 434–444. [Google Scholar] [CrossRef]
  31. Bawa, V.S.; Kumar, V. Linearized sigmoidal activation: A novel activation function with tractable non-linear charac-teristics to boost representation capability. Expert Syst. Appl. 2009, 120, 346–356. [Google Scholar] [CrossRef]
  32. Luy, M.; Saray, U. Wind speed estimation for missing wind data with three different backpropagation algorithms. Energy Educ. Sci. Technol. Part A Energy Sci. Res. 2012, 30, 45–54. [Google Scholar]
  33. Gonzalez, R.C.; Woods, R.E. Digital Image Processing; Addison-Wesley: New York, NY, USA, 1993. [Google Scholar]
  34. Kingdon, J.; Bsc, J.K.M. Intelligent Systems and Financial Forecasting; Springer: Berlin/Heidelberg, Germany, 1997. [Google Scholar]
  35. Bodisco, T.; Zare, A. Practicalities and Driving Dynamics of a Real Driving Emissions (RDE) Euro 6 Regulation Homologation Test. Energies 2019, 12, 2306. [Google Scholar] [CrossRef] [Green Version]
  36. Kang, G.; Lee, J.; Park, J.; Cha, J.; Chon, M.S. Development of Korean RDE Routes for On-road Emissions Measurement of Light Duty Vehicles. Trans. Korean Soc. Automot. Eng. 2017, 25, 287–296. [Google Scholar] [CrossRef] [Green Version]
  37. Ministry of Environment in South Kore. Evaluations of Real Driving Emissions (RDE-LDV) with Light-Duty Vehicles (LDVs)—Research on Introduction of 3rd RDE Package; NIER NO.11-1480523-003289-01 NIER-SP2017-215; Ministry of Environment in South Kore: Sejong City, Korea, 2017.
  38. Cicero-Fernândez, P.; Long, J.R.; Winer, A.M. Effects of grades and other loads on on-road emissions of hydrocarbons and carbon monoxide. J. Air Waste Manag. Assoc. 1997, 47, 898–904. [Google Scholar] [CrossRef] [Green Version]
  39. Zhou, H.; Zhao, H.; Feng, Q.; Yin, Z.; Li, J.; Qin, K.; Li, M.; Cao, L. Effects of Environmental Parameters on Real-World NOx Emissions and Fuel Consumption for Heavy-Duty Diesel Trucks Using an OBD Approach. SAE Tech. Pap. Ser. 2018. [Google Scholar] [CrossRef]
  40. Provataris, S.A.; Savva, N.S.; Chountalas, T.D.; Hountalas, D.T. Prediction of NOx emissions for high speed DI Diesel engines using a semi-empirical, two-zone model. Energy Convers. Manag. 2017, 153, 659–670. [Google Scholar] [CrossRef]
  41. EPA. Motor Vehicle Emission Simulator; EPA: Washington, DC, USA, 2010.
  42. Ko, M.; Lord, D.; Zietsman, J. Environmentally Conscious Highway Design for Crest Vertical Curves. Transp. Res. Rec. J. Transp. Res. Board 2012, 2270, 96–106. [Google Scholar] [CrossRef]
  43. Jiménez-Palacios, J.L. Understanding and Quantifying Motor Vehicle Emissions with Vehicle Specific Power and TILDAS Remote Sensing; University of Cambridge: Cambridge, UK, 1999. [Google Scholar]
  44. Zhai, Z.; Tu, R.; Xu, J.; Wang, A.; Hatzopoulou, M. Capturing the Variability in Instantaneous Vehicle Emissions Based on Field Test Data. Atmosphere 2020, 11, 765. [Google Scholar] [CrossRef]
  45. Khalid, A. Effect of Ambient Temperature and Oxygen Concentration on Ignition and Combustion Process of Diesel Spray. Asian J. Sci. Res. 2013, 6, 434–444. [Google Scholar] [CrossRef] [Green Version]
  46. McCormick, R.; Graboski, M.; Newlin, A.; Ross, J. Effect of Humidity on Heavy-Duty Transient Emissions from Diesel and Natural Gas Engines at High Altitude. J. Air Waste Manag. Assoc. 1997, 47, 784–791. [Google Scholar] [CrossRef] [Green Version]
  47. Kumar, B.R.; Saravanan, S. Effect of exhaust gas recirculation (EGR) on performance and emissions of a constant speed DI diesel engine fueled with pentanol/diesel blends. Fuel 2015, 160, 217–226. [Google Scholar] [CrossRef]
  48. Plee, S.; Ahmad, T.; Myers, J.; Faeth, G. Diesel NOx emissions—A simple correlation technique forintake air effects. Symp. Combust. 1982, 19, 1495–1502. [Google Scholar] [CrossRef]
  49. Strots, V.O.; Santhanam, S.; Adelman, B.J.; Griffin, G.A.; Derybowski, E.M. Deposit Formation in Urea-SCR Systems. SAE Int. J. Fuels Lubr. 2009, 2, 283–289. [Google Scholar] [CrossRef]
  50. European Commission. Including Cold-Start Emissions in the Real-Driving Emissions (RDE) Test Procedure—An Assessment of Cold-Start Frequencies and Emission Effects. JRC 105595, EUR 28472 EN. 2017. Available online: https://ec.europa.eu/jrc (accessed on 16 March 2021).
  51. Zhu, G.; Liu, J.; Fu, J.; Xu, Z.; Guo, Q.; Zhao, H. Experimental study on combustion and emission characteristics of turbocharged gasoline direct injection (GDI) engine under cold start new European driving cycle (NEDC). Fuel 2018, 215, 272–284. [Google Scholar] [CrossRef]
  52. Mahadevan, G.; Subramanian, S. Experimental Investigation of Cold Start Emission using Dynamic Catalytic Converter with Pre-Catalyst and Hot Air Injector on a Multi Cylinder Spark Ignition Engine. SAE Tech. Pap. Ser. 2017, 1. [Google Scholar] [CrossRef]
  53. Rath, M.K.; Acharya, S.K.; Patnaik, P.P. CI engine performance during cold weather condition using preheated air and engine by waste energy. Int. J. Ambient. Energy 2017, 38, 534–540. [Google Scholar] [CrossRef]
  54. European Environmental Agency. Air Quality in Europe—2016 Report; European Environmental Agency: Copenhagen, Denmark, 2016.
  55. Gao, J.; Tian, G.; Sorniotti, A.; Karci, A.E.; Di Palo, R. Review of thermal management of catalytic converters to decrease engine emissions during cold start and warm up. Appl. Therm. Eng. 2019, 147, 177–187. [Google Scholar] [CrossRef]
  56. Lahiri, S.K.; Khalfe, N. Process Modeling and Optimization Strategies Integrating Support Vector Regression and Differential Evolution: A Study of Industrial Ethylene Oxide Reactor. Chem. Prod. Process. Model. 2008, 3. [Google Scholar] [CrossRef]
  57. Garson, G.D. Interpreting neural network connection weights. Artif. Intell. Expert 1991, 6, 46–51. [Google Scholar]
  58. Goh, A. Back-propagation neural networks for modeling complex systems. Artif. Intell. Eng. 1995, 9, 143–151. [Google Scholar] [CrossRef]
  59. Olden, J.D.; Joy, M.K.; Death, R.G. An accurate comparison of methods for quantifying variable importance in artificial neural networks using simulated data. Ecol. Model. 2004, 178, 389–397. [Google Scholar] [CrossRef]
  60. Grange, S.K.; Farren, N.J.; Vaughan, A.R.; Rose, R.A.; Carslaw, D.C. Strong Temperature Dependence for Light-Duty Diesel Vehicle NOx Emissions. Environ. Sci. Technol. 2019, 53, 6587–6596. [Google Scholar] [CrossRef] [Green Version]
Figure 1. Schematic of MLP.
Applsci 11 03758 g001
Figure 2. In this research, KOR-NIER Routes 1 and 2 for the cold test and hot test, respectively, were chosen in Seoul city and its surroundings.
Applsci 11 03758 g002
Figure 3. NOx concentration comparison during cold and hot starts in an example of one diesel test vehicle.
Applsci 11 03758 g003
Figure 4. Comparison of estimated and actual values.
Applsci 11 03758 g004
Figure 5. Relative variable importance results in ANN.
Applsci 11 03758 g005
Figure 6. Vehicle speed, acceleration, and NOx concentrations as a function of speed classification in the ANN.
Applsci 11 03758 g006
Figure 7. Predicted NOx concentrations as a function of ambient temperature and relative humidity in the ANN.
Applsci 11 03758 g007
Figure 8. NOx concentrations predicted as a function of exhaust temperature and EGR rate according to speed classification in the ANN.
Applsci 11 03758 g008
Table 1. Summary of KOR-NIER routes.
Driving PortionKOR-NIER Route for Cold TestKOR-NIER Route for Hot Test
UrbanRuralMotorwayTotalUrbanRuralMotorwayTotal
Trip distance (km)32.729.028.990.626.519.727.473.6
Trip share (%)36.132.031.9100.036.026.737.3100.0
Trip duration (s)35761361999593643089519306189
Average vehicle speed (km/h)32.976.7104.1-22.174.6106.1-
Table 2. Information about the vehicles tested in this study.
Vehicle TypeFuelEmissions LevelEmission Reduction
Technology
Test Day
SUVDieselEuro 6- Selective catalytic reduction
- Exhaust gas recirculation
- Lean NOx trap
- Diesel particulate filter
Hot test: 24 September 2019
Cold test: 20 September 2019
SUVHot test: 14 October 2019
Cold test: 10 October 2019
SedanHot test: 6 August 2018
Cold test: 6 July 2018
- Selective catalytic reduction
- Exhaust gas recirculation
- Diesel particulate filter
Table 3. Variable descriptions for ANN.
VariableDefinitionCode and Value
x 1 Relative humidityNumerical value: range of 30.5–73.6%, mean: 48.0%
x 2 Ambient temperatureNumerical value: range of 15.8–31.3 °C, mean: 22.9 °C
x 3 Ambient pressureNumerical value: range of 989–1023 mbar, mean: 1010 mbar
x 4 Vehicle specific powerNumerical value: range of −35.9–68.2 kW/ton, mean: 4.9 kW/ton
x 5 Intake air temperatureNumerical value: range of 18–54 °C, mean: 29.2 °C
x 6 EGR rateNumerical value: range of 0–30.2%, mean: 14.97%
x 7 Exhaust temperatureNumerical value: range of 22.2–200 °C, mean: 80.5 °C
YNOx coefficientNumerical value: range of 0–3779 ppm, mean: 38.5 ppm
Table 4. Data normalization results.
VariableMinimumFirst QuartileMedianMeanThird QuartileMaximum
x 1 0.00000.17870.38280.40630.59401.0000
x 2 0.00000.45850.54630.59360.75611.0000
x 3 0.00000.47060.64710.60530.73531.0000
x 4 0.00000.39010.41810.44330.51731.0000
x 5 0.00000.16670.25000.31010.41671.0000
x 6 0.00000.00000.17330.18890.27721.0000
x 7 0.00000.25220.31220.32700.37281.0000
y0.00000000.00015880.00044980.01018130.00404821.0000
Publisher’s Note: MDPI stays neutral with regard to jurisdictional claims in published maps and institutional affiliations.

