
The Impact of Additive Manufacturing on the Flexibility of a Manufacturing Supply Chain


Abstract
1. Introduction
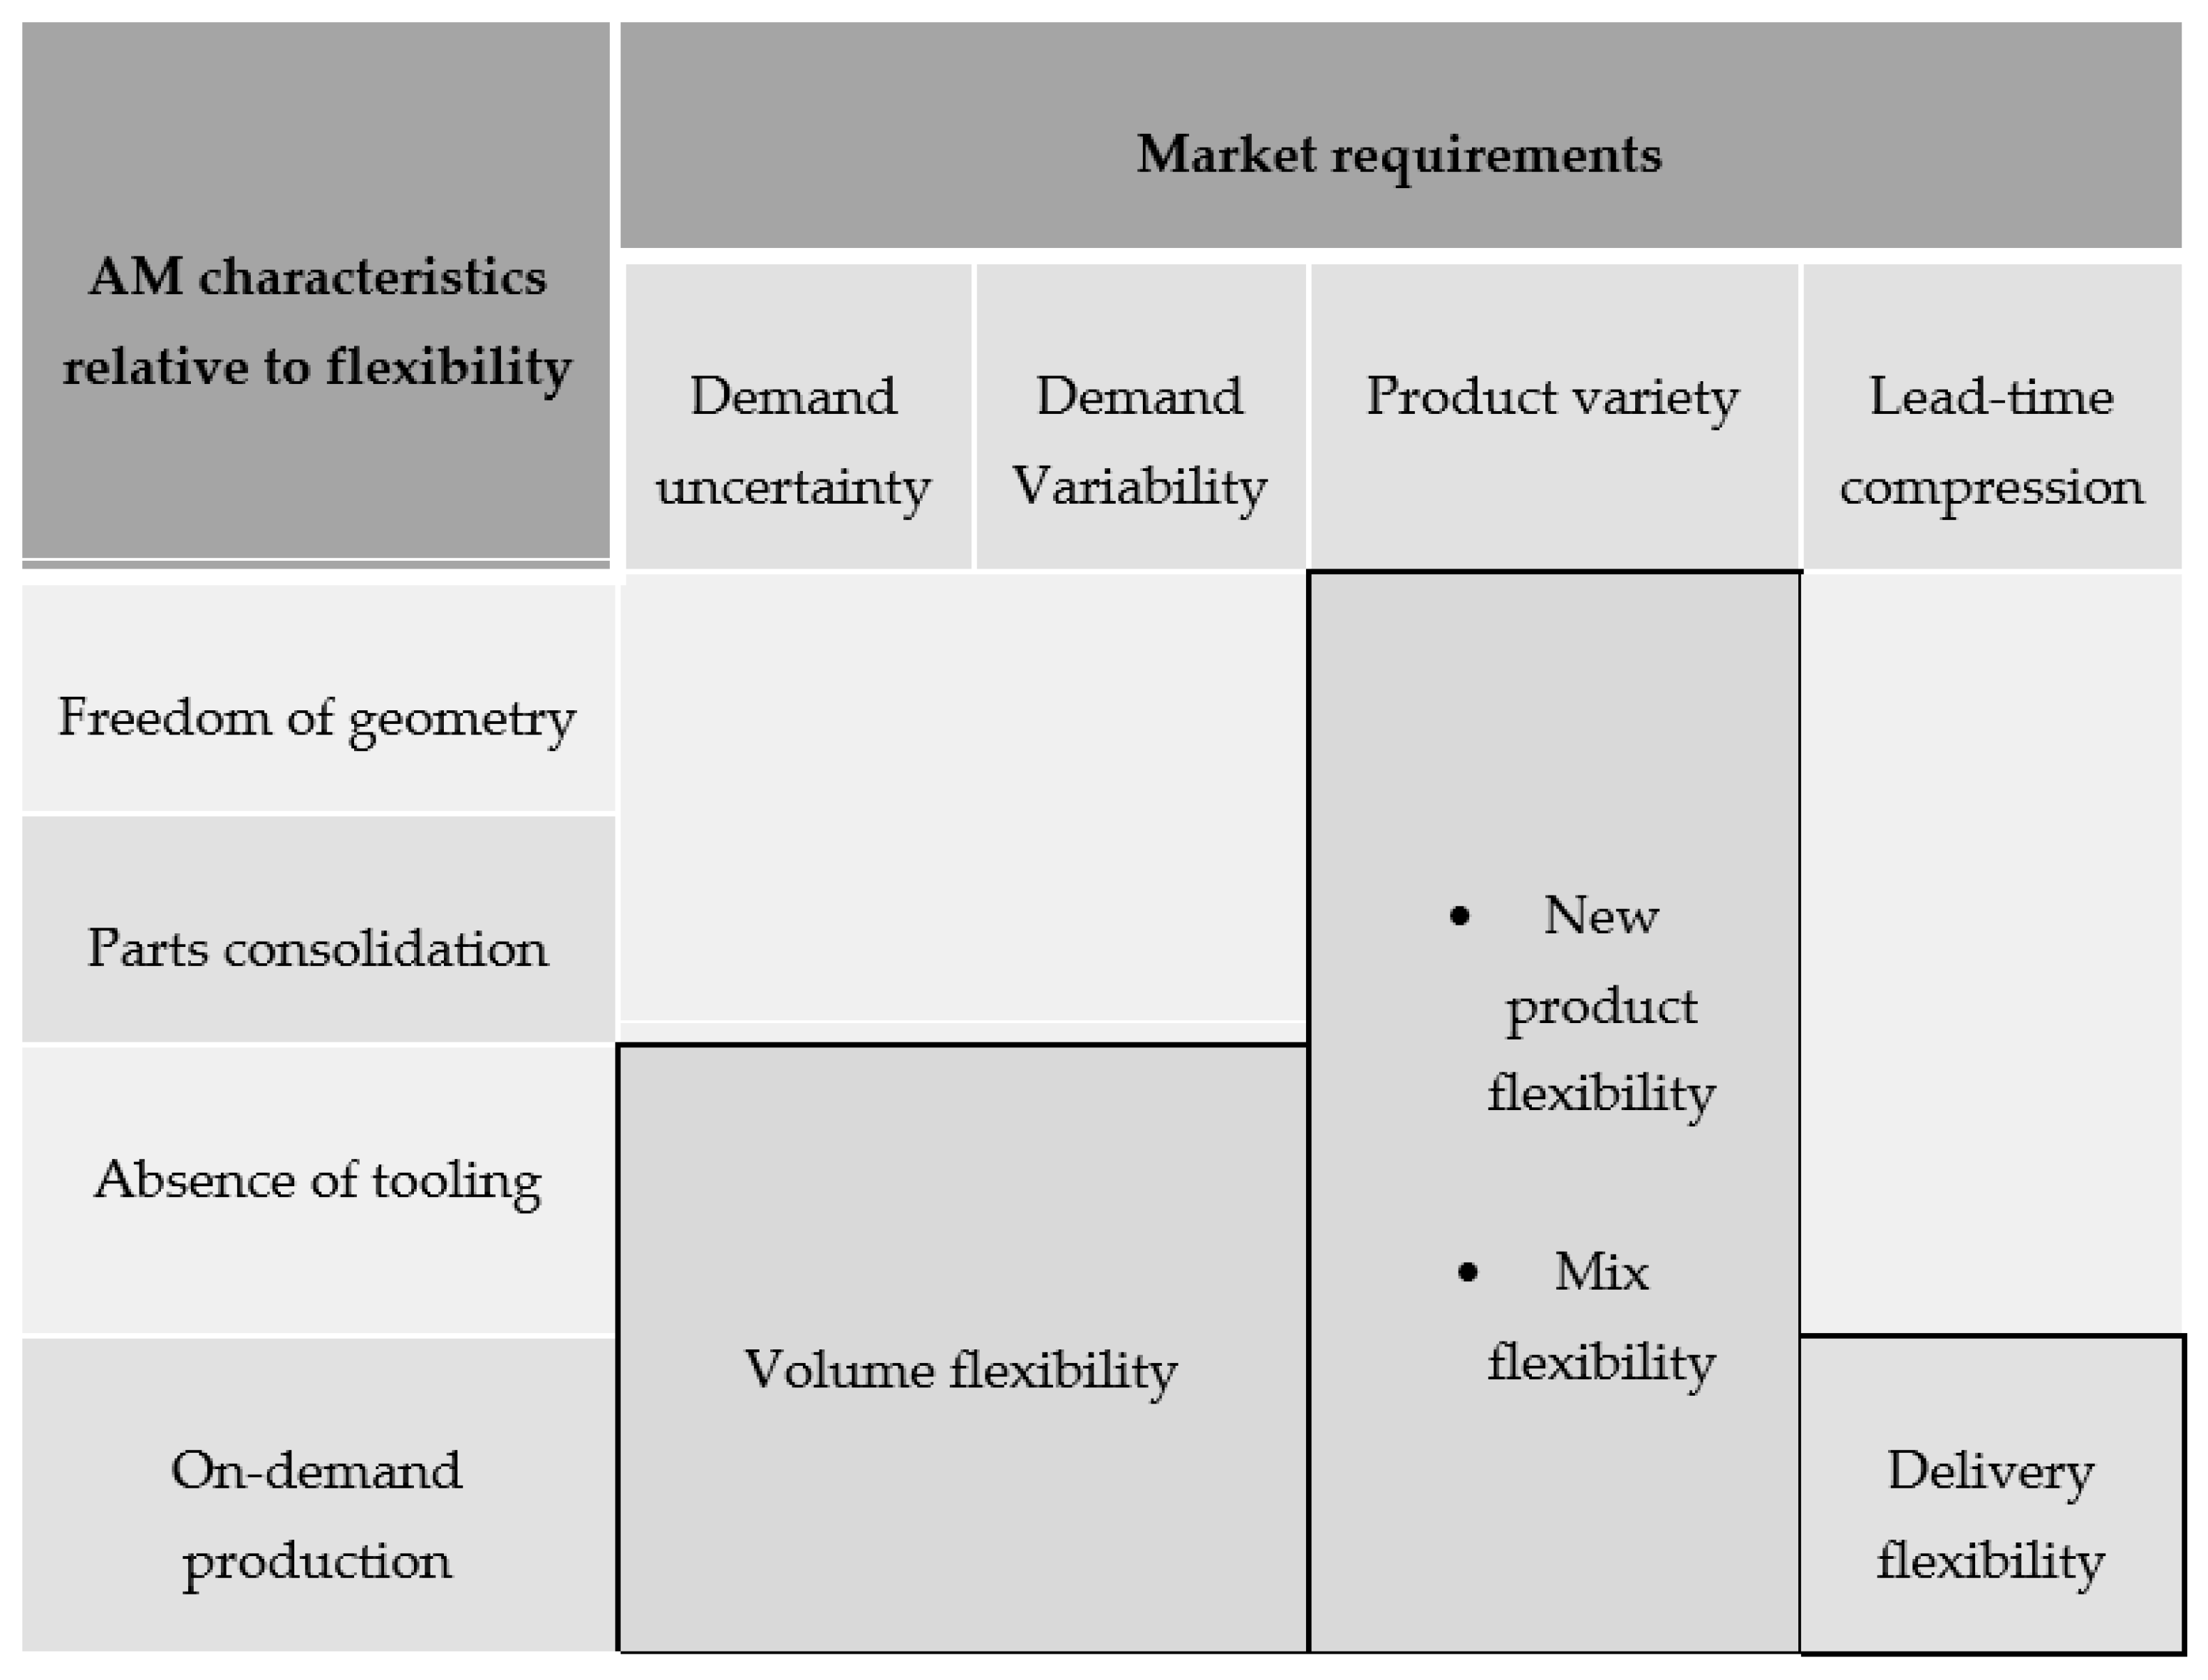
2. Development of a Conceptual Model of Flexibility in AM
3. Case Study
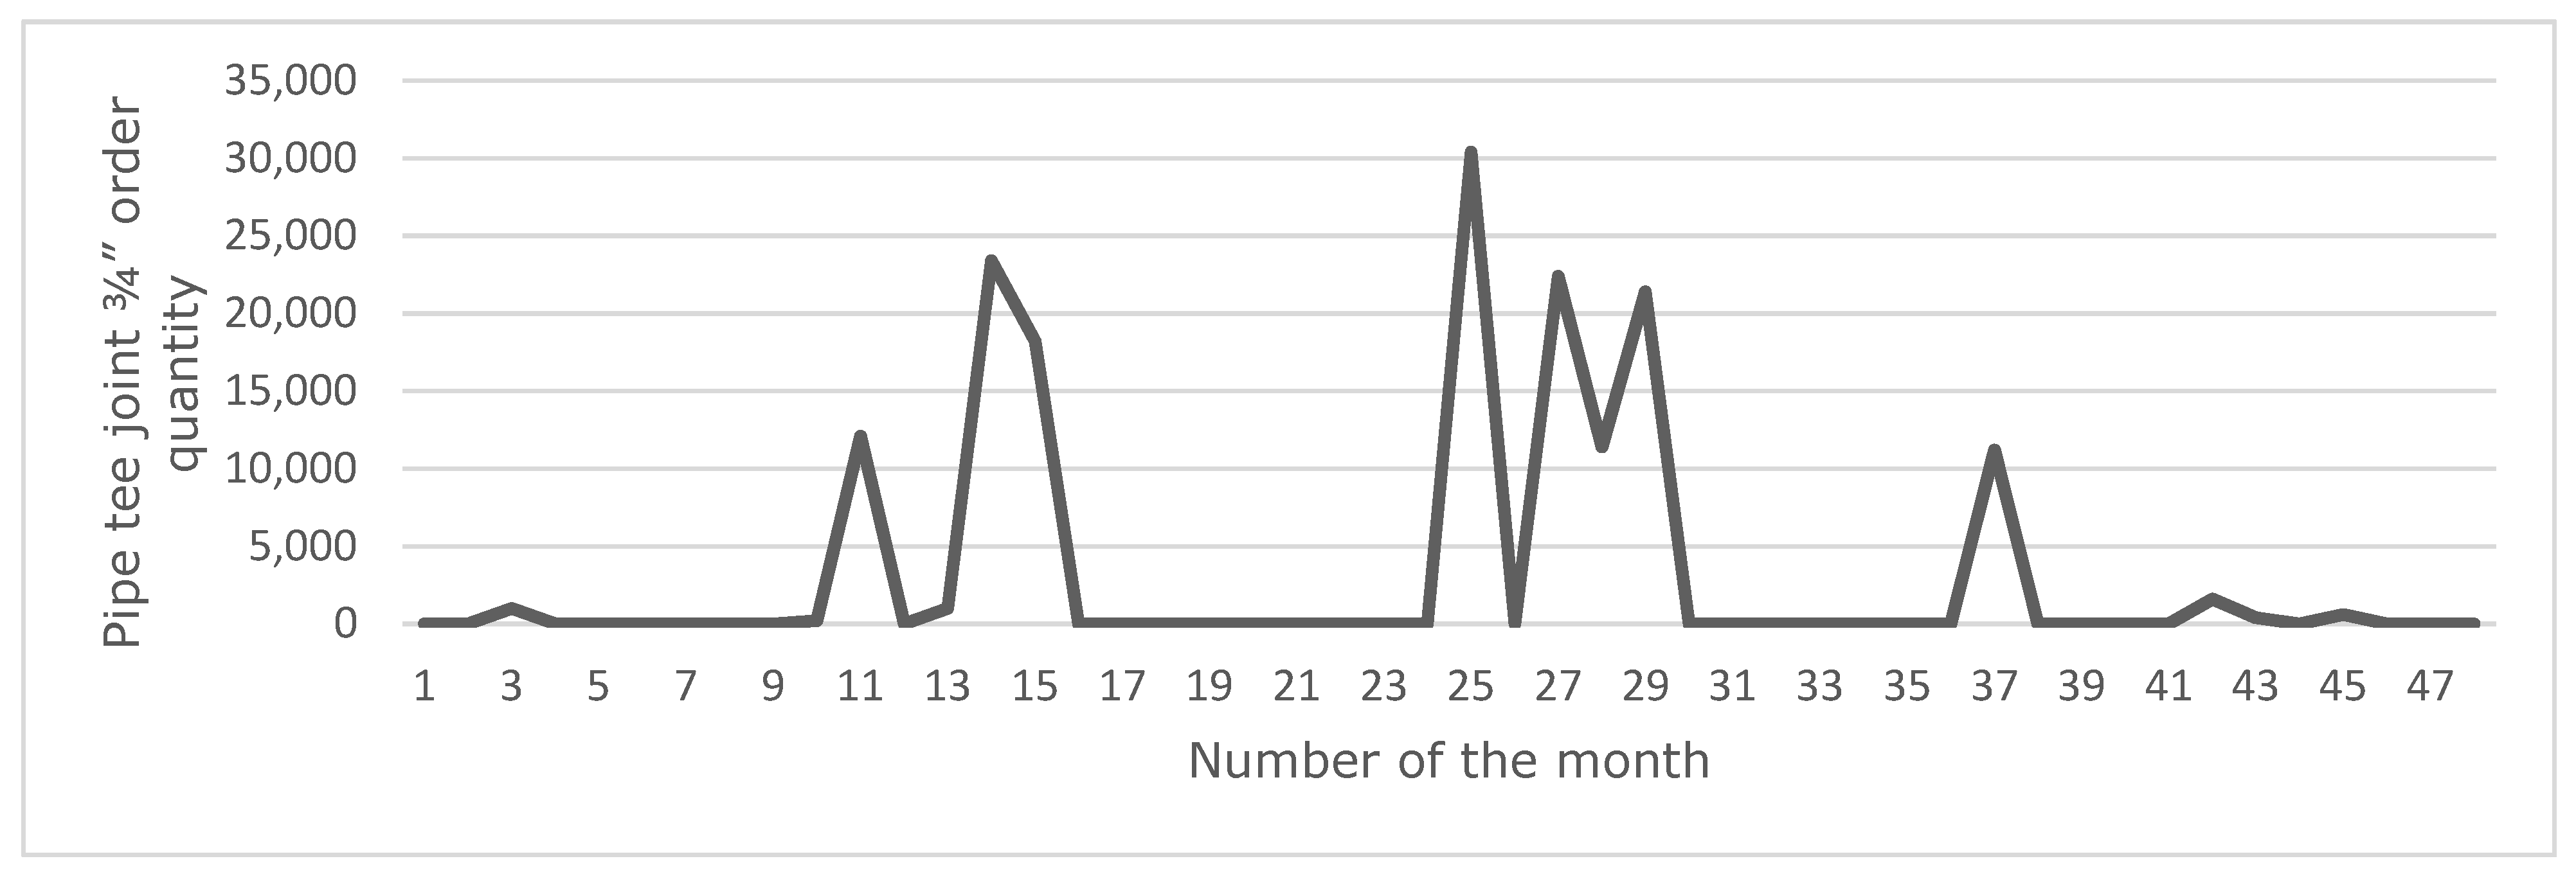
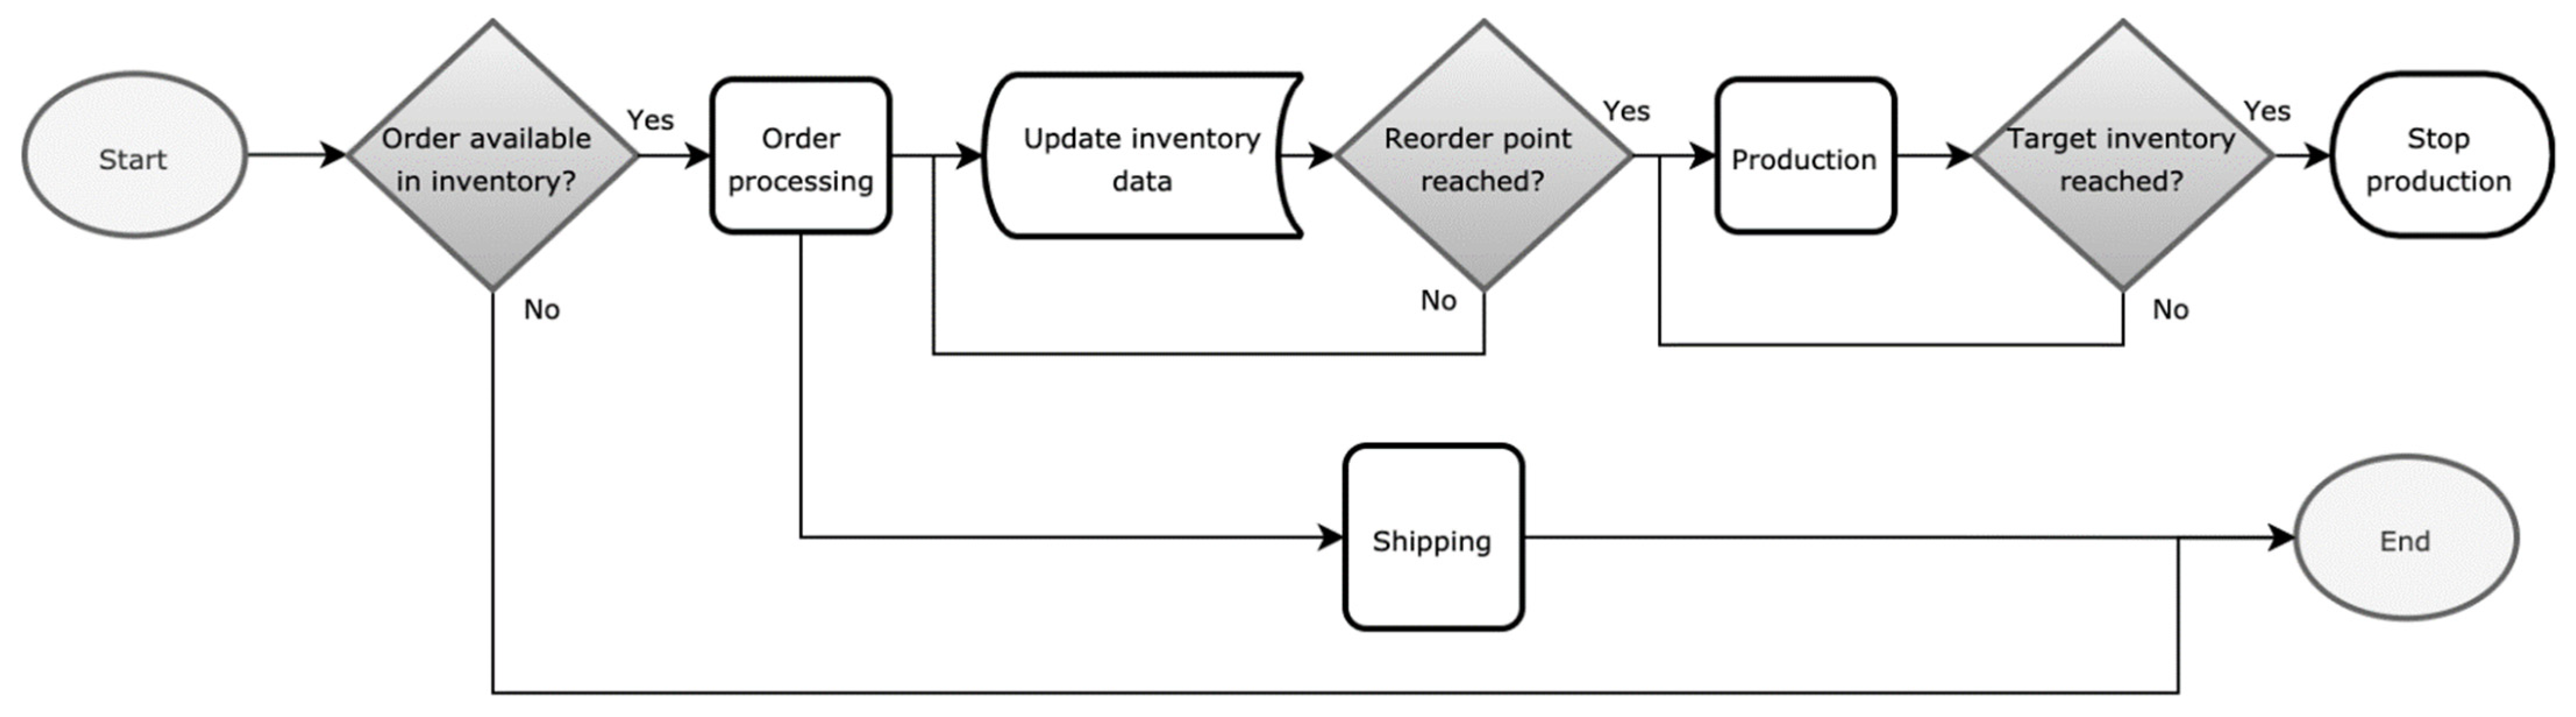
3.1. Description and Data Collection
3.2. Manufacturing Cost Parameters
3.3. Flexibility Metrics
3.3.1. Volume Flexibility
3.3.2. Mix Flexibility
3.3.3. Delivery Flexibility
3.3.4. New Product Flexibility
3.4. Results
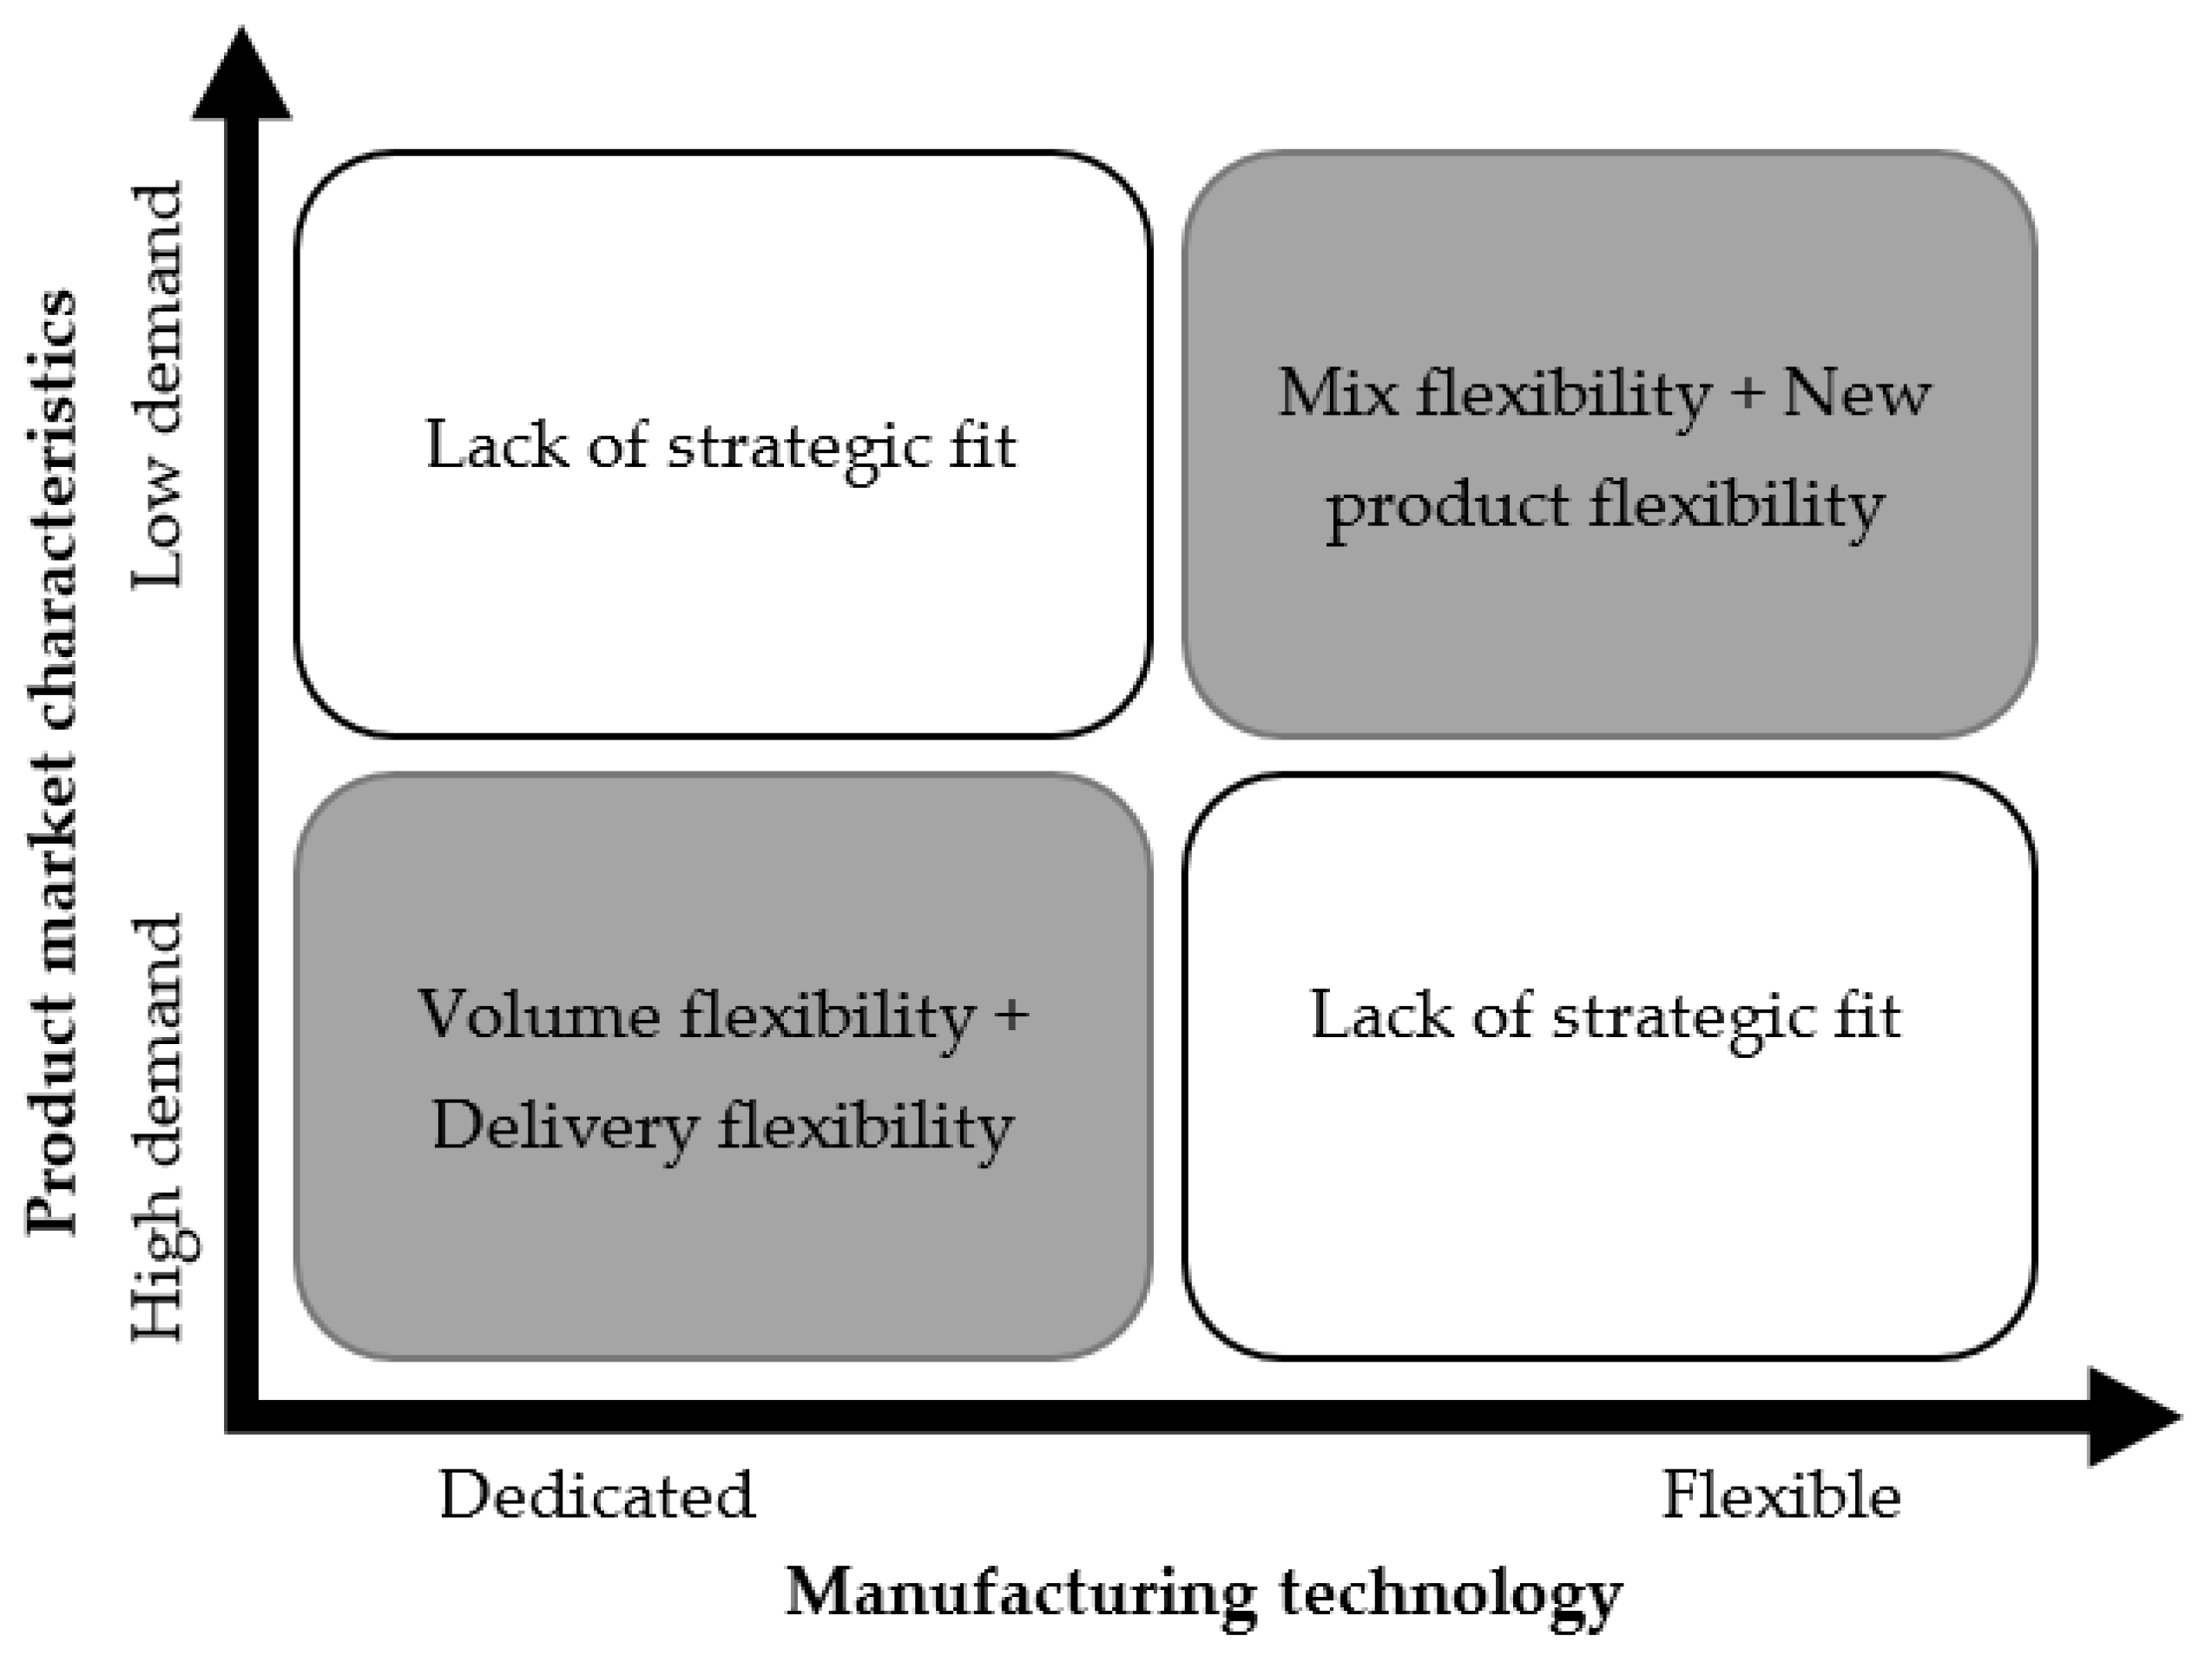
4. Discussion
5. Conclusions
Author Contributions
Funding
Institutional Review Board Statement
Informed Consent Statement
Data Availability Statement
Conflicts of Interest
Appendix A
References
- Chopra, S.; Sodhi, M. Reducing the risk of supply chain disruptions. MIT Sloan Manag. Rev. 2014, 55, 72–80. [Google Scholar]
- Carlino, G.A. Economies of Scale in Manufacturing Location: Theory and Measure; Springer Science & Business Media: New York, NY, USA, 2012; Volume 12. [Google Scholar]
- Cotteleer, M.; Joyce, J. 3D opportunity: Additive manufacturing paths to performance, innovation, and growth. Deloitte Rev. 2014, 14, 5–19. [Google Scholar]
- Sreedevi, R.; Saranga, H. Uncertainty and supply chain risk: The moderating role of supply chain flexibility in risk mitigation. Int. J. Prod. Econ. 2017, 193, 332–342. [Google Scholar] [CrossRef]
- Duclos, L.K.; Vokurka, R.J.; Lummus, R.R. A conceptual model of supply chain flexibility. Ind. Manag. Data Syst. 2003, 103, 446–4566. [Google Scholar] [CrossRef]
- Sánchez, A.M.; Pérez, M.P. Supply chain flexibility and firm performance. Int. J. Oper. Prod. Manag. 2005, 25, 681–700. [Google Scholar] [CrossRef]
- Chung, B.D.; Kim, S.I.; Lee, J.S. Dynamic supply chain design and operations plan for connected smart factories with additive manufacturing. Appl. Sci. 2018, 8, 583. [Google Scholar] [CrossRef]
- Brettel, M.; Klein, M.; Friederichsen, N. The relevance of manufacturing flexibility in the context of Industrie 4.0. Procedia CIRP 2016, 41, 105–110. [Google Scholar] [CrossRef]
- Mellor, S.; Hao, L.; Zhang, D. Additive manufacturing: A framework for implementation. Int. J. Prod. Econ. 2014, 149, 194–201. [Google Scholar] [CrossRef]
- Weller, C.; Kleer, R.; Piller, F.T. Economic implications of 3D printing: Market structure models in light of additive manufacturing revisited. Int. J. Prod. Econ. 2015, 164, 43–56. [Google Scholar] [CrossRef]
- Selldin, E.; Olhager, J. Linking products with supply chains: Testing Fisher’s model. Supply Chain Manag. Int. J. 2007, 12, 42–51. [Google Scholar] [CrossRef]
- Pujawan, I.N. Assessing supply chain flexibility: A conceptual framework and case study. Int. J. Integr. Supply Manag. 2004, 1, 79–97. [Google Scholar] [CrossRef]
- Chan, F.; Bhagwat, R.; Wadhwa, S. Increase in flexibility: Productive or counterproductive? A study on the physical and operating characteristics of a flexible manufacturing system. Int. J. Prod. Res. 2006, 44, 1431–1445. [Google Scholar] [CrossRef]
- Kim, M.; Suresh, N.C.; Kocabasoglu-Hillmer, C. An impact of manufacturing flexibility and technological dimensions of manufacturing strategy on improving supply chain responsiveness: Business environment perspective. Int. J. Prod. Res. 2013, 51, 5597–5611. [Google Scholar] [CrossRef]
- Tipu, S.A.A.; Fantazy, K.A. Supply chain strategy, flexibility, and performance. Int. J. Logist. Manag. 2014, 25. [Google Scholar] [CrossRef]
- Sethi, A.K.; Sethi, S.P. Flexibility in manufacturing: A survey. Int. J. Flex. Manuf. Syst. 1990, 2, 289–328. [Google Scholar] [CrossRef]
- Vokurka, R.J.; O’Leary-Kelly, S.W. A review of empirical research on manufacturing flexibility. J. Oper. Manag. 2000, 18, 485–501. [Google Scholar] [CrossRef]
- Eyers, D.R.; Potter, A.T. Industrial Additive Manufacturing: A manufacturing systems perspective. Comput. Ind. 2017, 92, 208–218. [Google Scholar] [CrossRef]
- Eyers, D.R.; Potter, A.T.; Gosling, J.; Naim, M.M. The flexibility of industrial additive manufacturing systems. Int. J. Oper. Prod. Manag. 2018, 38, 2313–2343. [Google Scholar] [CrossRef]
- Verboeket, V.; Krikke, H. Additive manufacturing: A game changer in supply chain design. Logistics 2019, 3, 13. [Google Scholar] [CrossRef]
- Delic, M.; Eyers, D.R. The effect of additive manufacturing adoption on supply chain flexibility and performance: An empirical analysis from the automotive industry. Int. J. Prod. Econ. 2020, 228, 107689. [Google Scholar] [CrossRef]
- Mohd Yusuf, S.; Cutler, S.; Gao, N. The impact of metal additive manufacturing on the aerospace industry. Metals 2019, 9, 1286. [Google Scholar] [CrossRef]
- Holweg, M. The three dimensions of responsiveness. Int. J. Oper. Prod. Manag. 2005, 25, 603–622. [Google Scholar] [CrossRef]
- Koste, L.L.; Malhotra, M.K. A theoretical framework for analyzing the dimensions of manufacturing flexibility. J. Oper. Manag. 1999, 18, 75–93. [Google Scholar] [CrossRef]
- Malhotra, M.K.; Mackelprang, A.W. Are internal manufacturing and external supply chain flexibilities complementary capabilities? J. Oper. Manag. 2012, 30, 180–200. [Google Scholar] [CrossRef]
- Reichhart, A.; Holweg, M. Creating the customer-responsive supply chain: A reconciliation of concepts. Int. J. Oper. Prod. Manag. 2007, 27, 1144–1172. [Google Scholar] [CrossRef]
- Stevenson, M.; Spring, M. Flexibility from a supply chain perspective: Definition and review. Int. J. Oper. Prod. Manag. 2007, 27, 685–713. [Google Scholar] [CrossRef]
- Ngo, T.D.; Kashani, A.; Imbalzano, G.; Nguyen, K.T.; Hui, D. Additive manufacturing (3D printing): A review of materials, methods, applications and challenges. Compos. Part B Eng. 2018, 143, 172–196. [Google Scholar] [CrossRef]
- Gibson, I.; Rosen, D.; Stucker, B.; Khorasani, M. Additive Manufacturing Technologies; Springer: Berlin/Heidelberg, Germany, 2014; Volume 17. [Google Scholar]
- Chen, D.; Heyer, S.; Ibbotson, S.; Salonitis, K.; Steingrímsson, J.G.; Thiede, S. Direct digital manufacturing: Definition, evolution, and sustainability implications. J. Clean. Prod. 2015, 107, 615–625. [Google Scholar] [CrossRef]
- Mani, M.; Lyons, K.W.; Gupta, S. Sustainability characterization for additive manufacturing. J. Res. Natl. Inst. Stand. Technol. 2014, 119, 419. [Google Scholar] [CrossRef] [PubMed]
- Muñoz, E.; Capón, E.; Laínez, J.M.; Moreno-Benito, M.; Espuña, A.; Puigjaner, L. Operational, tactical and strategical integration for enterprise decision-making. In Computer Aided Chemical Engineering; Elsevier: Amsterdam, The Netherlands, 2012; Volume 30, pp. 397–401. [Google Scholar]
- Atzeni, E.; Iuliano, L.; Minetola, P.; Salmi, A. Redesign and cost estimation of rapid manufactured plastic parts. Rapid Prototyp. J. 2010, 16, 308–316. [Google Scholar] [CrossRef]
- Olhager, J. Strategic positioning of the order penetration point. Int. J. Prod. Econ. 2003, 85, 319–329. [Google Scholar] [CrossRef]
- Halawa, F.; Lee, I.G.; Shen, W.; Khan, M.E.; Nagarur, N. The Implementation of Hybrid MTS\MTO as a Promoter to Lean-Agile: A Simulation Case Study for Miba Sinter Slovakia. In IIE Annual Conference Proceedings; IEEE: Piscataway, NJ, USA, 2017; pp. 1006–1011. [Google Scholar]
- Tersine, R.J. Principles of Inventory and Materials Management, 4th ed.; Pearson PLC: London, UK, 1994. [Google Scholar]
- EOS. Laser Sintering System with Two Lasers for the Production of Large Parts and for Industrial High-Throughput Manufacturing. 2019. Available online: https://3dplace.co/public/pdf/EOS_System_Data_Sheet_EOS_P_770_EN.pdf (accessed on 19 April 2021).
- Ruffo, M.; Tuck, C.; Hague, R. Empirical laser sintering time estimator for Duraform PA. Int. J. Prod. Res. 2006, 44, 5131–5146. [Google Scholar] [CrossRef]
- Baumers, M.; Holweg, M. Cost Impact of the Risk of Build Failure in Laser Sintering. In Proceedings of the Solid Freeform Fabrication Symposium 2016, Austin, TX, USA, 8–10 August 2016. [Google Scholar]
- Upton, D.M. The management of manufacturing flexibility. Calif. Manag. Rev. 1994, 36, 72–89. [Google Scholar] [CrossRef]
- Petrick, I.J.; Simpson, T.W. 3D printing disrupts manufacturing: How economies of one create new rules of competition. Res. Technol. Manag. 2013, 56, 12–16. [Google Scholar] [CrossRef]
- Hasan, T. Parametric analysis of part suitability. In Additive Manufacturing; Massachusetts Institute of Technology: Cambridge, MA, USA, 2017. [Google Scholar]
- Beamon, B.M. Measuring supply chain performance. Int. J. Oper. Prod. Manag. 1999, 19, 275–292. [Google Scholar] [CrossRef]
- Hopkinson, N.; Dicknes, P. Analysis of rapid manufacturing—using layer manufacturing processes for production. Proc. Inst. Mech. Eng. Part C J. Mech. Eng. Sci. 2003, 217, 31–39. [Google Scholar] [CrossRef]
- Verboeket, V.; Krikke, H. The disruptive impact of additive manufacturing on supply chains: A literature study, conceptual framework and research agenda. Comput. Ind. 2019, 111, 91–107. [Google Scholar] [CrossRef]
- Lau, R. Critical factors for achieving manufacturing flexibility. Int. J. Oper. Prod. Manag. 1999, 19, 328–341. [Google Scholar] [CrossRef]
- Zhang, Q.; Vonderembse, M.A.; Lim, J.-S. Manufacturing flexibility: Defining and analyzing relationships among competence, capability, and customer satisfaction. J. Oper. Manag. 2003, 21, 173–191. [Google Scholar] [CrossRef]
- Angkiriwang, R.; Pujawan, I.N.; Santosa, B. Managing uncertainty through supply chain flexibility: Reactive vs. proactive approaches. Prod. Manuf. Res. 2014, 2, 50–70. [Google Scholar] [CrossRef]
- Jack, E.P.; Raturi, A.S. Measuring and comparing volume flexibility in the capital goods industry. Prod. Oper. Manag. 2003, 12, 480–501. [Google Scholar] [CrossRef]
- Berman, B. 3-D printing: The new industrial revolution. Bus. Horiz. 2012, 55, 155–162. [Google Scholar] [CrossRef]
- Mainkar, A.V.; Lubatkin, M.; Schulze, W.S. Toward a product-proliferation theory of entry barriers. Acad. Manag. Rev. 2006, 31, 1062–1075. [Google Scholar] [CrossRef]
- Salvador, F.; Forza, C.; Rungtusanatham, M. Modularity, product variety, production volume, and component sourcing: Theorizing beyond generic prescriptions. J. Oper. Manag. 2002, 20, 549–575. [Google Scholar] [CrossRef]
- Mehrpouya, M.; Dehghanghadikolaei, A.; Fotovvati, B.; Vosooghnia, A.; Emamian, S.S.; Gisario, A. The potential of additive manufacturing in the smart factory industrial 4.0: A review. Appl. Sci. 2019, 9, 3865. [Google Scholar] [CrossRef]
- Sjödin, D.R.; Parida, V.; Leksell, M.; Petrovic, A. Smart factory implementation and process innovation: A preliminary maturity model for Leveraging Digitalization in Manufacturing Moving to smart factories presents specific challenges that can be addressed through a structured approach focused on people, processes, and technologies. Res. Technol. Manag. 2018, 61, 22–31. [Google Scholar]
- Gielisch, C.; Fritz, K.-P.; Noack, A.; Zimmermann, A. A product development approach in the field of micro-assembly with emphasis on conceptual design. Appl. Sci. 2019, 9, 1920. [Google Scholar] [CrossRef]
- Nguyen-Duc, A.; Khalid, K.; Shahid Bajwa, S.; Lønnestad, T. Minimum viable products for internet of things applications: Common pitfalls and practices. Future Internet 2019, 11, 50. [Google Scholar] [CrossRef]
- Storbacka, O. Rapid Prototyping: Creating a Minimum Viable Product Using a Single-Board Microcontroller. Ph.D. Thesis, Luleå University of Technology, Luleå, Sweden, 2018. [Google Scholar]
- Reichwein, J.; Vogel, S.; Schork, S.; Kirchner, E. On the applicability of agile development methods to design for additive manufacturing. Procedia CIRP 2020, 91, 653–658. [Google Scholar] [CrossRef]
- Atzeni, E.; Salmi, A. Economics of additive manufacturing for end-usable metal parts. Int. J. Adv. Manuf. Technol. 2012, 62, 1147–1155. [Google Scholar] [CrossRef]
- Ruffo, M.; Tuck, C.; Hague, R. Cost estimation for rapid manufacturing-laser sintering production for low to medium volumes. Proc. Inst. Mech. Eng. Part B J. Eng. Manuf. 2006, 220, 1417–1427. [Google Scholar] [CrossRef]
- Achillas, C.; Tzetzis, D.; Raimondo, M.O. Alternative production strategies based on the comparison of additive and traditional manufacturing technologies. Int. J. Prod. Res. 2017, 55, 3497–3509. [Google Scholar] [CrossRef]


| Flexibility Metric | Unit | AM | IM |
|---|---|---|---|
| Volume flexibility | % | 58.70 | 65.68 |
| Mix flexibility | hr | 0.33 | 4.91 |
| Delivery flexibility | % | 75.35 | 92.85 |
| New product flexibility | € | 0 | 30,000 |
Publisher’s Note: MDPI stays neutral with regard to jurisdictional claims in published maps and institutional affiliations. |
© 2021 by the authors. Licensee MDPI, Basel, Switzerland. This article is an open access article distributed under the terms and conditions of the Creative Commons Attribution (CC BY) license (https://creativecommons.org/licenses/by/4.0/).
Share and Cite
Alogla, A.A.; Baumers, M.; Tuck, C.; Elmadih, W. The Impact of Additive Manufacturing on the Flexibility of a Manufacturing Supply Chain. Appl. Sci. 2021, 11, 3707. https://doi.org/10.3390/app11083707
Alogla AA, Baumers M, Tuck C, Elmadih W. The Impact of Additive Manufacturing on the Flexibility of a Manufacturing Supply Chain. Applied Sciences. 2021; 11(8):3707. https://doi.org/10.3390/app11083707
Chicago/Turabian StyleAlogla, Ageel Abdulaziz, Martin Baumers, Christopher Tuck, and Waiel Elmadih. 2021. "The Impact of Additive Manufacturing on the Flexibility of a Manufacturing Supply Chain" Applied Sciences 11, no. 8: 3707. https://doi.org/10.3390/app11083707
APA StyleAlogla, A. A., Baumers, M., Tuck, C., & Elmadih, W. (2021). The Impact of Additive Manufacturing on the Flexibility of a Manufacturing Supply Chain. Applied Sciences, 11(8), 3707. https://doi.org/10.3390/app11083707