1. Introduction
Zero-energy buildings minimize the energy consumed through the building envelope by installing high-performance insulation and a double skin facade. Zero energy is also achieved by generating energy using renewable energy such as solar or geothermal heat sources. Korea has decided to mandate zero-energy buildings in stages from 2020 to 2030, and the government is currently proposing support measures such as easing building standards, subsidies, and tax support, along with pilot projects. In this study, in order to optimize the upcoming general introduction of zero-energy buildings, the study aims to establish an integrated planning methodology for zero-energy buildings by proposing an approach for integrated planning methodology from the point of view of zero-energy buildings that is expanded from the existing design methodology (interpretation of space, logical arrangement, aesthetic form, maximum floor area ratio, etc.). This planning methodology is verified in terms of energy loss and energy production.
This study proposes an integrated design process that considers a building’s orientation, heat transmission rate of the building envelope, surface to volume ratio (S/V ratio) of the building in terms of heat gain and heat loss, and also examine the potential for solar power generation. In this study, an optimal design plan for a zero-energy building was derived by comparing the building envelope element that can reduce the energy consumption of the building and the solar energy production. The solar panel is considered in combination with the building envelope because the electric energy production is determined according to the roof area and the direction of the building. The design concept of a zero-energy building was derived by reviewing previous studies on the building design method. The passive and active elements were extracted by analyzing the case of zero-energy buildings and design criteria. A differential design concept for zero-energy buildings was established and a zero-energy building planning methodology was established. Finally, the process was verified by simulating energy consumption and production (
Figure 1).
2. Preliminary Review
2.1. Review of the Building Design Processes
As shown in
Figure 2, the existing architectural design process consists of Pre-Design, Schematic Design, Detailed Design, Construction Document, Construction Stage, and Post Occupancy (Maintenance) processes. In the general architectural design process, the design focuses on the form and function of the building in the basic design stage, and then the structural design for the stability of the building is performed in the detailed design stage. In this process, consideration of high-efficiency facilities and eco-friendly elements which is necessary to enhance the possibilities of achieving a zero energy building are of low importance [
1].
Currently, a new methodology is being used to design green buildings. The American Institute of Architects has also continued its efforts to develop new design methodologies and design standards for sustainable architecture [
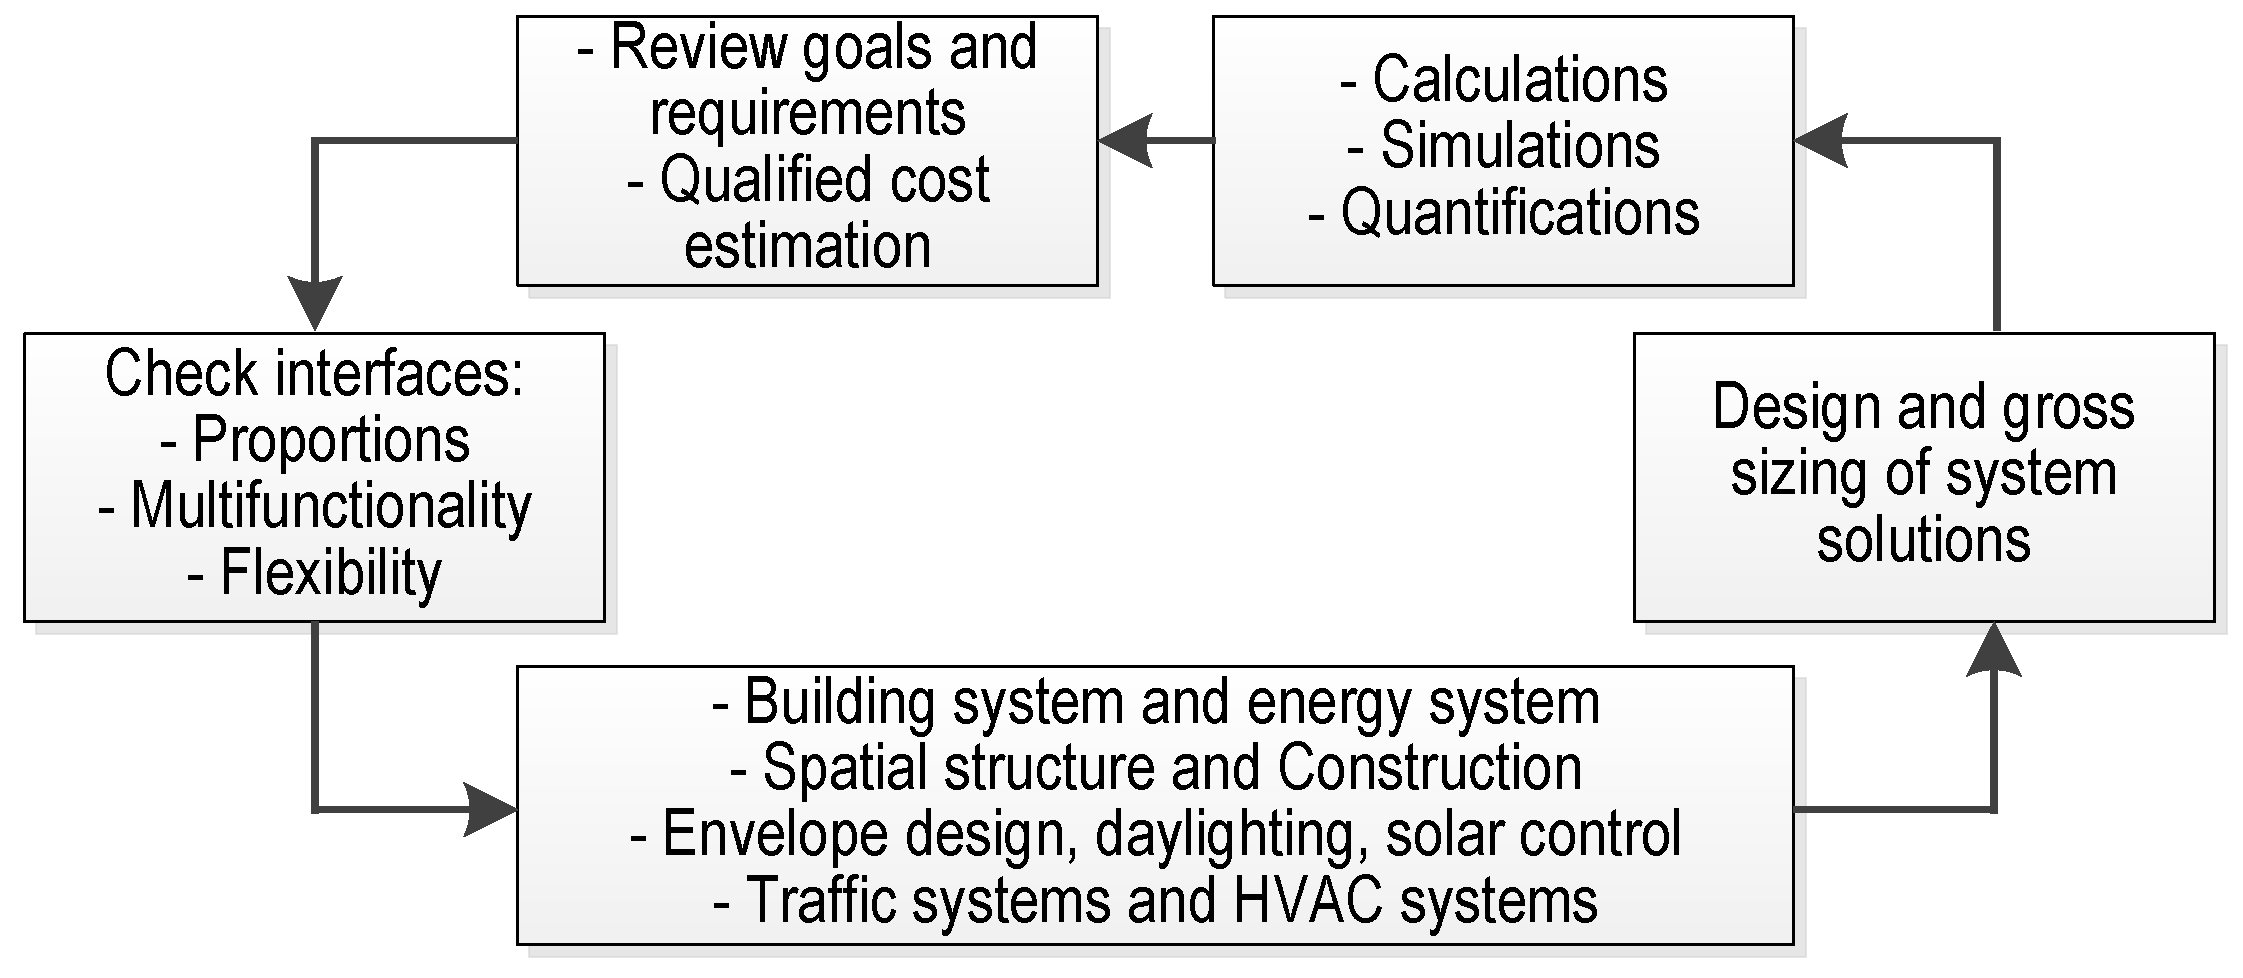
1]. The International Energy Agency (IEA) shows the commonly used integrated design process (
Figure 3). This is a design process in which experts in the energy field cooperate from the initial design stage to develop alternatives, compare them with the set goals, and develop them again [
2,
3]. Only after this stage did the possibility of implementing a zero-energy building begin to gradually increase [
4]. Previous research has been conducted to refine the integrated building design process. Each step in the building planning process in the University of British Columbia’s Green Building Design Program can be associated with each step of the architectural design process shown in
Figure 3. This process consists of seven steps, from the first step of the program planning and site selection to the seventh step of creating specifications and construction drawings [
5].
In Korea, the ecological architectural design process considers an integrated building design process [
6]. The content of this process focuses on the design stage that has a great influence on the environmental and energy performance of a building, and deals with design, initial work, conceptual design, basic design, and integrated design [
7].
In this study, in order to derive the necessary process of zero-energy building planning, the related items were extracted by separating the contents related to the energy production and consumption of the building from the previously considered building design process (
Table 1).
From the comparison of common elements of the design processes, the process of implementing a zero-energy building should first optimize the application of passive methods to minimize the use of cooling and heating energy. Next, the energy used by the building should be minimized by supplying the energy required for the functioning of the building through the production of renewable energy.
2.2. Review of the Building Codes
In order to derive the necessary elements of zero-energy building planning, previous studies and the standards related to energy-saving building design in Korea and Germany was analyzed. Additionally, case studies of zero-energy buildings were conducted. According to research by Chang [
8] and Lee [
9], in the case of buildings with the same volume and thermal performance, energy consumption is inversely correlated with envelope area. In addition to deriving correlations with building energy according to various building shapes with the same volume according to the combination of unit modules, changes according to the window area ratio were also examined. In this study, a building with a small envelope area exposed to the outside air increases energy savings. Even for buildings of the same volume, the window area ratio is changed according to the layout and shape of the building, so the window–wall ratio should be considered in the design process.
In order to derive the passive elements, the difference between the energy saving elements of the building was derived, as shown in
Table 2, by comparing the energy saving design standards of Korea and the passive house standards of Germany. The design of a zero-energy building needs to consider the orientation of the building and the proportion of windows on the south side at the building planning stage, as in the German passive house standard. In addition, the results of Lee’s research [
9] related to active elements are summarized, as shown in
Table 3, and applied to this study to select solar power generation, solar heat collection, and geothermal energy as renewable energy sources that can be applied to zero-energy buildings [
10].
2.3. Review of the Projects
The elements necessary for zero-energy building planning were derived from building case studies. Examples for analysis are representative eco-friendly and zero-energy buildings in Europe, Japan, and the United States, with 19 in Europe, 5 in Japan, and 11 in the US;
Table 4). In total, for 35 cases of eco-friendly and zero energy buildings, the frequently applied technologies are summarized in high-performance windows (34 times), high-performance insulation (33 times), solar control device, BIPV (Building Integrated PhotoVoltaics), solar heat collection (20 times), and heat recovery ventilation system (19 times).
3. Zero-Energy Building Planning Method
Based on the preliminary review, the necessary elements of the zero-energy building design are the orientation, layout and shape of the building, the area and insulation of the envelope, the window insulation performance, natural ventilation, heat recovery ventilation, solar radiation control device, high efficiency air conditioner, high efficiency boiler, high efficiency lighting, solar power generation, solar heat collection, and geothermal heat (
Table 5).
The concept of the zero-energy building planning process was established based on the necessary elements of zero-energy building planning reviewed in the previous section. The first necessary element of zero-energy building planning is determining a shape of building that can fundamentally reduce the building load by decreasing the seasonal heating/cooling demand according to S/V of the building [
11]. This has become much more important compared to the past, when solar power generation panel or BIPV was not installed because the installation capacity of solar energy is determined among the renewable energy that can be installed according to the shape of the building. The second factor is to orient the building so that it uses as much solar energy as possible. The third factor is the design of a renewable energy system [
12]. As the biggest difference between the previous green architecture, green building, eco-friendly architecture, ecological architecture and zero energy architecture, the building does not consume energy but actively produces energy to reduce the negative total energy use of the building to zero or negative. The fourth factor is the design of insulation and windows as a shell that can reduce energy requirements [
13,
14].
As the energy requirement decreases, zero energy can be achieved with less energy production, so improving the insulation performance and air-tight envelope are essential factors. The fifth factor is the design of a building system of heating, cooling, hot water, ventilation, and lighting that allows the energy demand to be met with the minimum input energy [
15]. Manufacturers must continuously develop new products to increase efficiency. Apart from the control of individual products, linkage control between products from the energy point of view and integrated control from the point of energy optimization should be implemented.
Figure 4 shows the above contents as a sequential process. The heating, cooling, hot water, ventilation, and lighting design is the last component of the design process because it is an area that must be in charge of the manufacturer or product level.
In particular, the difference between the concept of the zero-energy building planning process proposed herein and the planning process performed in the existing architectural design is that the shape of the building is first confirmed before the orientation of the building. Whereas the existing building shape design was to reduce the required energy in terms of heat gain and heat loss by the envelope, from a zero-energy building perspective, the shape of building is interpreted as a variable that can determine the installation capacity of solar panels for renewable energy production. This variable eventually determines the energy production of a zero-energy building. Therefore, after determining the shape of the building, the most advantageous direction can be found in terms of energy. In addition, in considering the renewable energy system, in the case of zero-energy buildings, an optimal solution between increasing energy production using renewable energy and reducing energy demand through high-performance insulation and windows is needed to achieve the goal of the integrated concept of energy independence.
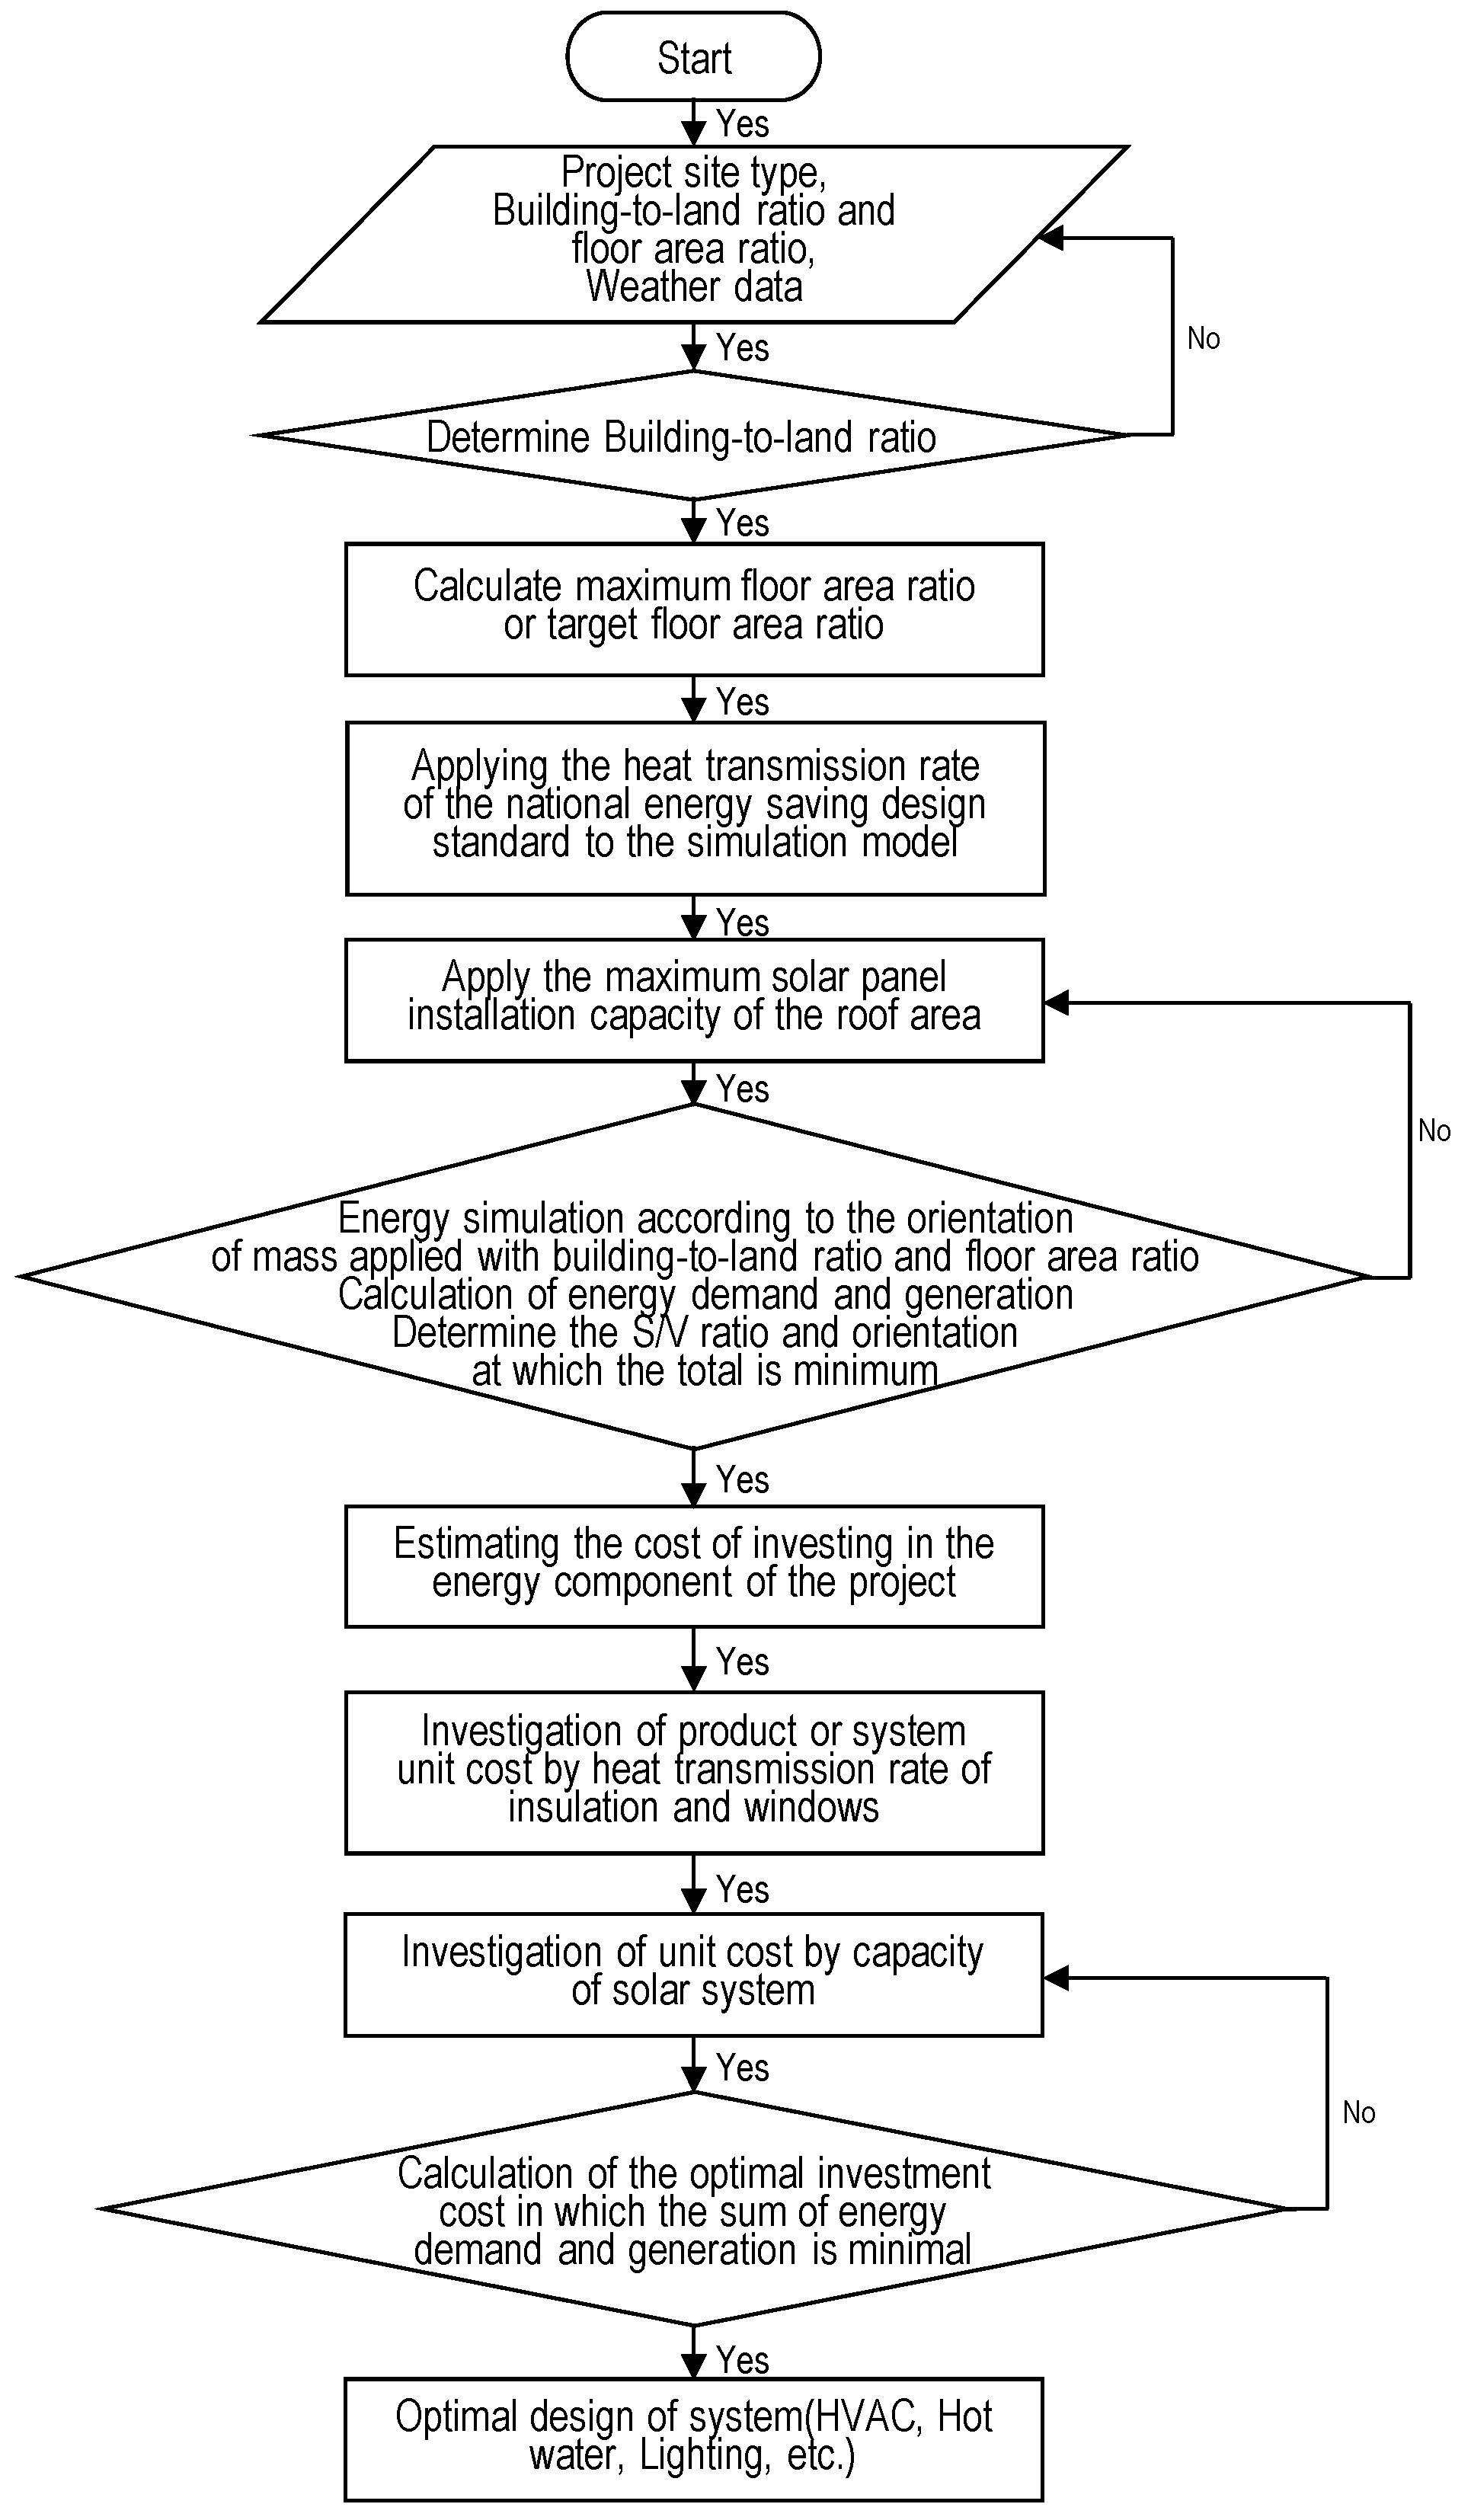
Figure 5 is a schematic diagram of the process of integrated zero-energy building planning methodology. First, the type of site where the project is being executed, the applicable building-to-land ratio and floor area ratio, and weather data of the area are collected as basic data, and then the building-to-land ratio and maximum floor area ratio or target floor area ratio are set with the client.
As the basic data of energy simulation, the heat transmission rate of the building energy saving design standard of the site is applied, and the maximum solar installation capacity that can be installed in the roof area is calculated. The calculated data are used to determine the shape of the building, the S/V ratio, and the direction of the building in which the sum of energy consumption and energy production is minimized by performing energy simulation while repeatedly changing the shape and S/V ratio of the building. Next, the range or the cost of the project that can be invested in energy consumption and production are estimated.
Exterior wall insulation and window insulation increase the build cost but decrease the ongoing energy consumption, and the cost increase and energy production increase when investing in a solar system are compared. Finally, an optimal financial solution is found by optimizing the design of the cooling, heating, hot water, ventilation, and lighting system.
4. Verification of Zero-Energy Building Integrated Planning Methodology
In this section, to verify the zero-energy building planning process, the calculation of solar power generation according to the shape, S/V ratio, and direction of the building was verified as energy consumption and production. The small office model, which is the simplest form of 16 reference building models provided by the Department of Energy (DOE), was selected. In this model, the floor area and the number of floors were adjusted so that the volume and total floor area were the same and the S/V ratio was different. According to the characteristics of the S/V ratio, the energy consumption and production changes were compared and analyzed, and the results were analyzed.
4.1. Verification According to S/V Ratio and Solar Panel Installation
In order to compare and analyze the energy consumption and energy production according to the S/V ratio of the building, a standard building to compare the difference in energy production and demand according to the S/V ratio change was modeled, as shown in
Figure 6, using TRNSYS [
16]. The small office of DOE was modeled by modifying it to have the same volume and different S/V ratios, as shown in
Table 6. In order to realistically consider the energy consumption and energy production calculation of the simulation model, the heat transmission rate of the building energy conservation design standard was applied, as shown in
Table 7.
Table 8 shows the indoor cooling and heating setting conditions for the simulation.
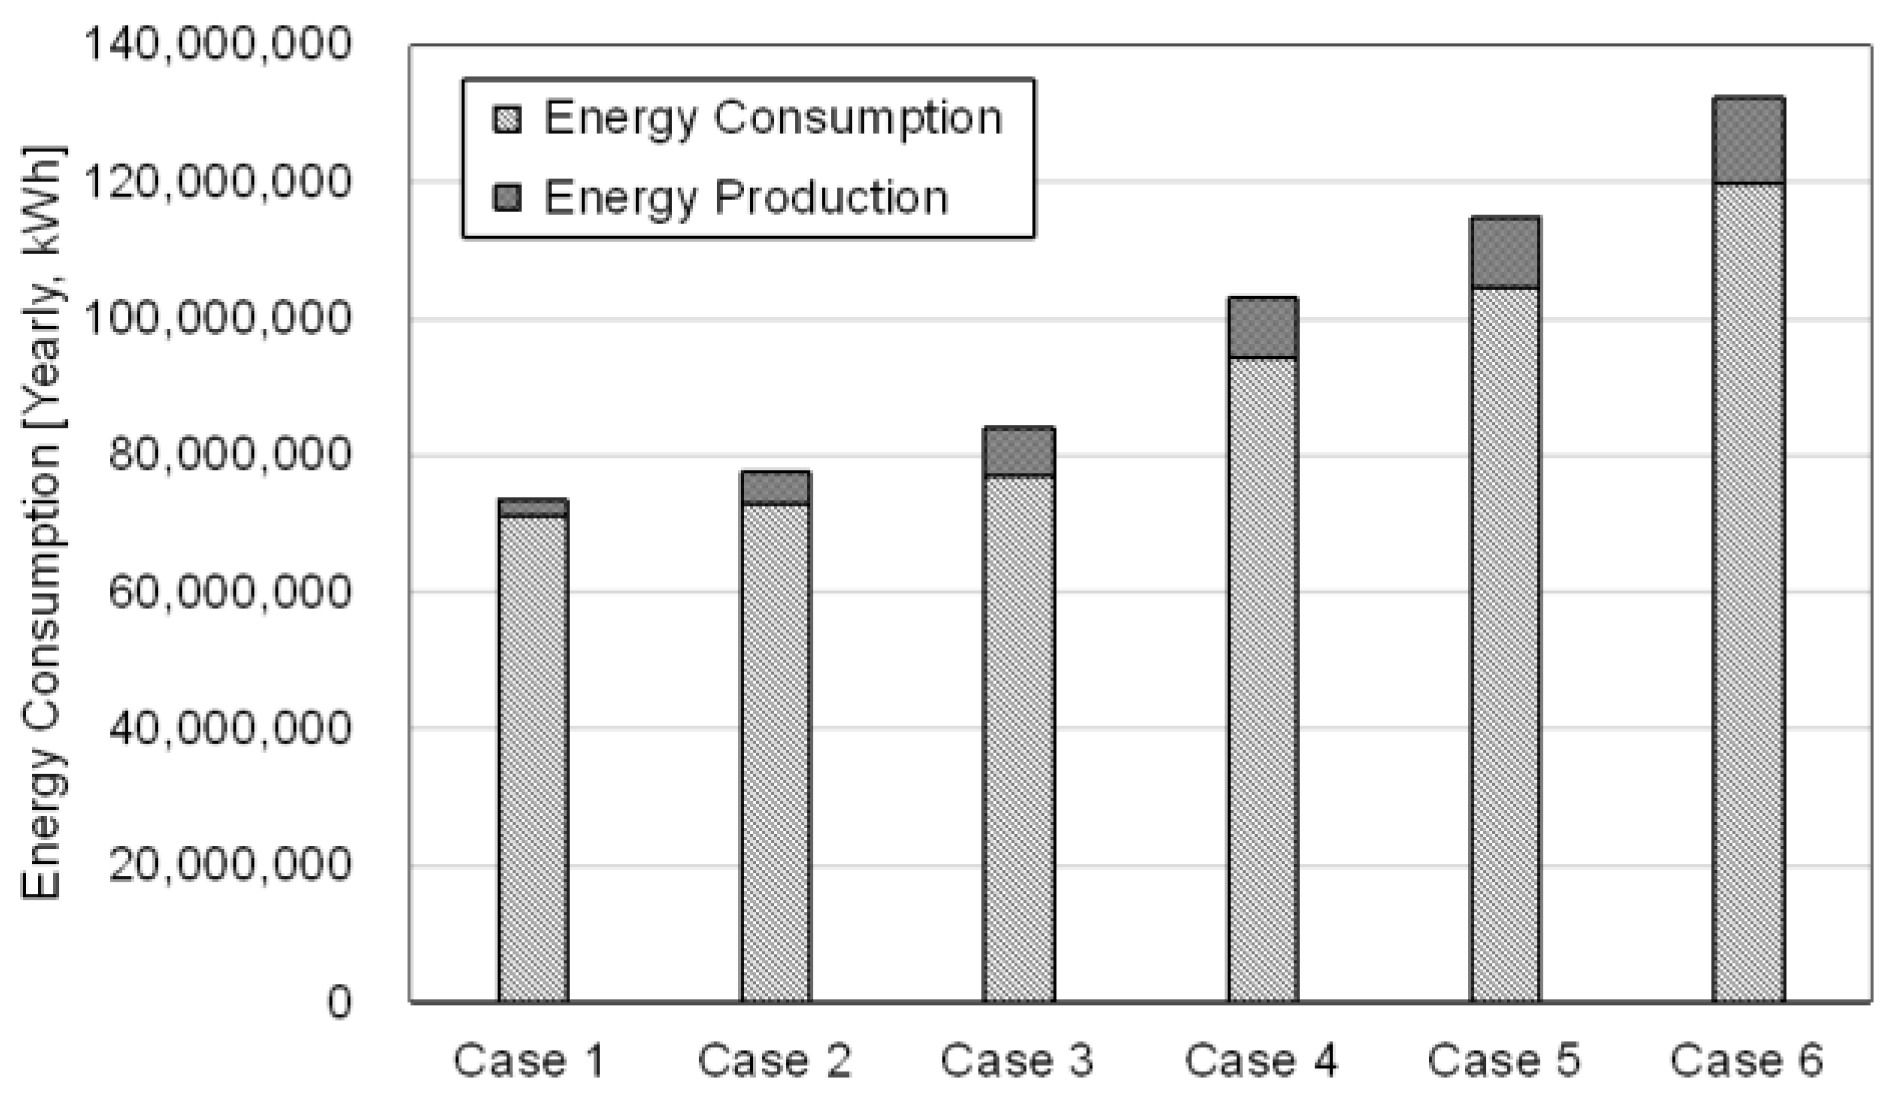
The simulation revealed that the annual energy consumption is affected by the S/V ratio, as shown in
Figure 7. For buildings of the same volume, the smaller the outer envelope area, the smaller the energy requirement. Therefore, in zero-energy building planning, it is necessary to reduce the envelope area as much as possible. The design of the building is decided under comprehensive considerations such as the client’s demand, aesthetic point of view, and site constraints, but in order to achieve a zero-energy building, a design with the lowest S/V ratio should be selected from among various design candidates.
Energy production was calculated assuming that solar panels are installed on 50% of the roof area. As the floor area gradually increases from case 1 to case 6 as the S/V ratio changes, the solar panel installation area of the roof is also increased. The annual energy production is affected by the S/V ratio, as shown in
Figure 7. For buildings of the same volume, the energy production increases as the roof area among the envelope areas increases. In the case of a building in which solar power is applied as a renewable energy source, the change in the energy consumption and the energy production occurs at the same time according to the change in the S/V ratio. Therefore, when planning a zero-energy building, it is necessary to determine the S/V ratio from an optimal solution point of view rather than determining the shape of the building based on one of the criteria of energy consumption or energy production. As a result, as shown in
Figure 7, in terms of final energy requirements based on the sum of energy consumption and energy production, the case 2 building type with S/V of 0.58 is the most reasonable alternative when planning a zero-energy building.
4.2. Verification of Building Orientation and Solar Panel Installation
While changing the orientation of the building, energy consumption and energy production were estimated. The energy saving rate according to the zero-energy building planning method can be determined by calculating the final energy consumption according to the various directions of the building. Among the DOE reference buildings, a large office building could represent a square-shaped general building, which is suitable for the installation of roof solar panel and BIPV modules. In this study, a large office of DOE was simulated using TRNSYS (
Figure 8) with boundary conditions, as shown in
Table 9 and
Table 10.
The indoor cooling and heating conditions were set, as shown in
Table 11, and the energy consumption of the building was calculated by summing the three items: heating load, cooling load, and latent heat. In particular, the energy consumption was calculated by changing the orientation of the buildings in three regions with different latitudes among a total of 36 orientations at 10-degree intervals from the south direction. The simulation shown in
Figure 9 revealed that the energy consumption is the largest in the northeast direction, and regardless of the area where the building is located, the direction with the least energy consumption is south (
Figure 10). Therefore, analyzing and selecting the building orientation are necessary to minimize the energy consumption in the zero-energy building planning process.
Solar panels applied for energy production can be classified into rooftop PV and BIPV modules. The rooftop PV is always installed facing south in the northern hemisphere, and it was assumed to be installed so that the sunlight and panels could be incident at 90 degrees. In addition, it is assumed that BIPV is installed on the outer wall of the building to maintain a 90-degree angle to the ground (
Table 12). For solar power generation conditions, Reference Insolation 1000 W/m
2 and NOCT (normal operating solar cell temperature) Insolation 800 W/m
2 were used for solar energy simulation. Energy production was calculated for each of the 36 orientations by adding up the annual production of rooftop PV and BIPV modules.
The simulation revealed that the energy production decreases in the order of Daejeon, Busan, and Seoul due to the difference in insulation by region. Therefore, in the planning of a zero-energy building, the effect of solar power installation should be reflected depending on the region. In addition, to analyze the correlation between the direction of the building and the energy production, the energy production of a total of 36 orientations at 10-degree intervals from the south direction was identified. As shown in
Table 13, the west has the highest energy production and the northeast has the lowest energy production. This is the effect of the BIPV installation, and the proportion of the BIPV module installed on the south side of the square building is larger than that on the east and west sides. The west side, where the south side receives sunlight until the latest, has the greatest power generation.
The final energy consumption analysis, shown in
Table 14 and
Figure 11, revealed that large offices in the case of applying the heat transmission rate of the central region to the Daejeon region decrease in the order of Seoul, Daejeon, and Busan. This is due to local weather conditions, and the Busan area, which shows relatively high energy production conditions and relatively low basic energy consumption, is the most advantageous area, with a final energy consumption of 80% of that of Seoul.
Finally, for large office buildings, the final energy consumption was estimated by subtracting the energy production from the energy consumption of the three areas in Seoul, Daejeon, and Busan (
Table 15).
Figure 11 shows the energy reduction as a result of the analysis of the final energy consumption derived by assuming that the energy produced by the rooftop PV and the BIPV module is consumed in the building. The energy consumption reduction ranges from 17% to 30%, due to differences in solar panel application boundary conditions. In addition, the energy reduction increases in the order of Seoul, Daejeon, and Busan, mostly due to the difference in energy consumption, with only minor difference in energy production in each region.
5. Conclusions
This study establishes and verifies a zero-energy building planning methodology that considers the building’s energy consumption and energy production, which are critical in the design process. Therefore, the effect of the S/V ratio of the same volume building on the energy consumption, the effect of solar panels installation on the energy production, and the final energy requirement were analyzed. The results are summarized as follows.
(1) The planning methodology focused on a zero-energy building should minimize the energy consumption by applying passive technology and reduce the final energy demand by producing renewable energy. In addition to increasing the amount of energy consumption through passive design elements, energy production elements centered on solar energy source must be considered in the planning methodology.
(2) An area that consumes a lot of heating and cooling energy has a high energy requirement, so any reduction in the energy requirement strongly affects the final energy requirement considering the energy production. In such an area, since the energy requirement is proportional to the envelope area, the energy-saving S/V ratio should be considered in the planning methodology of a zero-energy building.
(3) In order to increase the building’s solar energy production, a plan for the maximum application of new and renewable energy sources such as BIPV and rooftop solar power must be implemented. Also, the building’s S/V ratio and orientation must be considered in a design process to reduce the final energy consumption through solar energy production.
(4) Insulation is most important in the central region of Korea, and solar power installation in the southern region. Therefore, the process of planning a zero-energy building needs to integrate the energy consumption and production according to the building location.
In the future, there are plans to study the effect of achieving zero energy buildings by applying various renewable energy sources and to evaluate them in terms of LCA (life cycle assessment) in order to optimize the design methodology.
Author Contributions
Conceptualization, S.L.; methodology, S.P.; software, S.L.; validation, S.P.; investigation, S.P.; data curation, S.L.; writing—original draft preparation, S.L.; writing—review and editing, S.P.; visualization, S.L.; supervision, S.P.; project administration, S.L.; funding acquisition, S.P. All authors have read and agreed to the published version of the manuscript.
Funding
This research was funded by the Sun Moon University Research Grant of 2019.
Institutional Review Board Statement
Not applicable.
Informed Consent Statement
Not applicable.
Data Availability Statement
Not applicable.
Acknowledgments
This work was supported by the Sun Moon University Research Grant of 2019.
Conflicts of Interest
The authors declare no conflict of interest.
References
- Kim, M.G.; Kang, H.S. A study on design application of eco-friendly integrated design process. J. Korea Inst. Ecol. Arch. Environ. 2013, 13, 87–94. [Google Scholar] [CrossRef]
- International Energy Agency. Integrated Design Process: A Guideline for Sustainable and Solar-Optimized Building Design; International Energy Agency: Paris, France, 2003. [Google Scholar]
- Sahib, Y. Modernizing Building Energy Codes 2013; The International Energy Agency Policy Pathway Series; International Energy Agency: Paris, France, 2013; pp. 24–28. [Google Scholar]
- Lee, B.Y.; Kim, K.H. A study on the integrated design process for sustainable architecture. J. Arch. Inst. Korea 2009, 25, 55–62. [Google Scholar]
- University of British Columbia. UBC Integrated Design Process. 2020. Available online: https://planning.ubc.ca/sustainability/sustainability-action-plans/green-building-action-plan/institutional-building-requirements/ubc-integrated-design-process (accessed on 28 February 2021).
- Lee, H.J. A Study on the Energy Self-Sufficient House. Master’s Thesis, Graduate School of Semyung University, Chungbuk, Korea, 2016. [Google Scholar]
- Tae, Y.R. Architectural design process by the changes of sustainable design guidelines of public project. J. Korean Solar Energy Soc. 2010, 30, 63–70. [Google Scholar]
- Chang, W.S.; Shin, H.C.; Choi, W.K. Energy sensitivity analysis according to the design variables with the same volume building. J. Korean Inst. Arch. Sustain. Environ. Build. Syst. 2014, 8, 104–110. [Google Scholar]
- Lee, M.J.; Kim, W.S.; Lee, W.J.; Lee, W.T. A study about reduction rates of building energy demand for a detached house according to building energy efficient methods. J. Arch. Inst. Korea 2012, 28, 275–283. [Google Scholar]
- Kim, S.H. A Study for Building Design Process Using Ecological Approach. Master’s Thesis, Graduate School of Sungkyunkwan University, Seoul, Korea, 2002. [Google Scholar]
- Choi, W.K.; Kim, H.J.; Suh, S.J. A study on the analysis of energy consumption patterns according to the building shapes with the same volume. J. Korean Solar Energy Soc. 2007, 27, 103–109. [Google Scholar]
- Hong, W.-P. Economic analysis and energy saving evaluation for smart grid system of hospital building. J. Korean Inst. Illum. Electr. Install. Eng. 2010, 24, 129–139. [Google Scholar] [CrossRef]
- Jang, H.J.; Park, J.C. A study on the energy efficiency evaluation of zero energy building. J. Korean Inst. Arch. Sustain. Environ. Build. Syst. 2010, 4, 149–156. [Google Scholar]
- Rodriguez-Ubinas, E.; Rodriguez, S.; Voss, K.; Todorovic, M.S. Energy efficiency evaluation of zero energy houses. Energy Build. 2014, 83, 23–35. [Google Scholar] [CrossRef]
- Peippo, K.; Lund, P.; Vartiainen, E. Multivariate optimization of design trade-offs for solar low energy buildings. Energy Build. 1999, 29, 189–205. [Google Scholar] [CrossRef]
- Zogou, O.; Stapountzis, H. Energy analysis of an improved concept of integrated PV panels in an office building in central Greece. Appl. Energy 2011, 88, 853–866. [Google Scholar] [CrossRef]
Figure 1.
Research process.
Figure 1.
Research process.
Figure 2.
Conventional building design process.
Figure 2.
Conventional building design process.
Figure 3.
Integrated building design diagram by IEA Task 23.
Figure 3.
Integrated building design diagram by IEA Task 23.
Figure 4.
Simplified concept of zero-energy building planning process.
Figure 4.
Simplified concept of zero-energy building planning process.
Figure 5.
Zero-energy building integrated planning methodology.
Figure 5.
Zero-energy building integrated planning methodology.
Figure 6.
Simulation model for energy analysis by TRNSYS: (a) energy consumption model; (b) energy production model.
Figure 6.
Simulation model for energy analysis by TRNSYS: (a) energy consumption model; (b) energy production model.
Figure 7.
Energy consumption, production and final energy consumption according to S/V ratio change.
Figure 7.
Energy consumption, production and final energy consumption according to S/V ratio change.
Figure 8.
Large office simulation model.
Figure 8.
Large office simulation model.
Figure 9.
Energy consumption according to the building orientation.
Figure 9.
Energy consumption according to the building orientation.
Figure 10.
Energy consumption according to the region.
Figure 10.
Energy consumption according to the region.
Figure 11.
Final energy consumption and reduction rate according to region.
Figure 11.
Final energy consumption and reduction rate according to region.
Table 1.
Comparison of common elements of each design process.
Table 1.
Comparison of common elements of each design process.
| Contents | Green Building Design Program by UBC [5] | Biological Building Design Process by Kim [10] |
|---|
| Passive elements | 4th Stage: Building orientation and configuration
4.1 Use site resources to reduce building loads and enhance indoor environmental quality
4.2 Develop a project specific building form and massing
4.3 Configure internal layout to reduce loads and enhance IEQ
5th Stage: Building systems design
5.1 Energy design
5.3 Envelope design | 3rd Stage: Concept design
① Sunlight, topography (slope), airflow analysis
⑤ Agreement on building design and system access plan according to energy source
4th Stage: Basic design
② Building design (building shape and structure, Openings, Material)
5th Stage: Integrated design
①Building orientation/shape (natural cooling technique, surface area ratio minimization, buffer space, thermal zoning, natural solar technique)
③ Building envelope design
④ Opening design |
Active
elements | 5th Stage: Building systems design
5.1 Energy design
5.4 Ventilation design
5.6 Lighting design
5.7 Mechanical design
5.8 Finalize building systems design
6th Stage: Interior finishes and appliances
6.1 Reduce internal loads | 4th Stage: Basic design
③ System design
5th Stage: Integrated design
⑤ HVAC system
⑥ Lighting power system
⑨ Evaluation |
Table 2.
Comparison of Korean building energy saving design standards and German passive house standards.
Table 2.
Comparison of Korean building energy saving design standards and German passive house standards.
| Energy Saving Elements | Energy Saving Design Standards of Buildings | Passive House Design Standards |
|---|
| Building orientation | - | South |
| Window area ratio on the south facade | - | 40% |
| Insulation of the facade | Classification by building location and components | 0.1 W/(m2K) |
| Glass | Classification by building location and components | ≤0.75 W/(m2K) |
| Window frame | | ≤0.80 W/(m2K) |
| Air-tightness (infiltration) | <5 m2/(h·m2) | ≤0.6/h |
| Heat storage performance | Description on night electricity heat storage system | Recommended |
| Heat recovery ventilation system | Explained in the mechanical equipment section of the energy performance index | Efficiency > 80% |
| Shadings | Explained in the architectural section of the energy performance index | Recommended |
Table 3.
Types of renewable energy and the applicability of produced energy to buildings.
Table 3.
Types of renewable energy and the applicability of produced energy to buildings.
| Energy Producing Elements | New and Renewable Energy Source | Type of Produced Energy | Building Applicability |
|---|
| New energy | Hydrogen | Electricity, thermal energy | Low |
| Fuel Cell | Electricity, thermal energy | Medium |
| Coal gasification and liquefied electricity | Electricity, thermal energy, gas | Low |
Renewable
energy | Sunlight | Electricity | High |
| Solar heat | Thermal energy | High |
| Wind | Electricity | Medium |
| Water | Electricity | Low |
| Ocean | Electricity | Low |
| Geothermal | Thermal energy | High |
| Biomass | Electricity, thermal energy, gas | Medium |
| Waste | Electricity, thermal energy | Medium |
Table 4.
Zero-energy building technology for various projects.
Table 4.
Zero-energy building technology for various projects.
| Project | Region | Applied Technology |
|---|
| Europe | Japan | U.S.A | High-Performance Insulation | High-Performance Window | Solar Control Device | HRV System | Motion Sensor | TABS | BIPV | Solar Heat Collection | Geothermal | Bio-Mass | Recycle | Reuse | Local Materials | Renewable Materials |
|---|
| 3 Liter Twin Houses | √ | | | ○ | ○ | | ○ | | | | ○ | | | | | | |
| Buttisholz | √ | | | ○ | ○ | ○ | | | | | ○ | ○ | | | | | |
| Chinolo House | √ | | | ○ | ○ | ○ | ○ | | | ○ | | | | | | | |
| Goteborg | √ | | | ○ | ○ | ○ | ○ | | | | ○ | | | | | | |
| Hannover House | √ | | | ○ | ○ | | ○ | | | | ○ | | | | | | |
| Hockerton Housing | √ | | | ○ | ○ | ○ | ○ | | ○ | ○ | | | | | | | |
| Horbranz House | √ | | | ○ | ○ | | ○ | | | | ○ | ○ | | | | | |
| House W | √ | | | ○ | ○ | | ○ | | | | ○ | ○ | | | | | |
| Husby Amfi | √ | | | ○ | ○ | ○ | ○ | | | | | | | | | | |
| ISIS Solar Passive Apartment | √ | | | ○ | ○ | | ○ | | | ○ | ○ | | | | | | |
| Kassel House | √ | | | ○ | ○ | | ○ | | | ○ | | | | | | | |
| Konstanz | √ | | | ○ | ○ | ○ | ○ | | | | ○ | ○ | | | | | |
| Kuchl House | √ | | | ○ | ○ | | ○ | | | ○ | ○ | | | | | | |
| Nebikon House | √ | | | ○ | ○ | | ○ | | | | | ○ | | | | | |
| Passivehouse in Gaspoltshofen | √ | | | ○ | ○ | | | | | ○ | ○ | ○ | ○ | | | | |
| Plus-energy Settlement | √ | | | ○ | ○ | ○ | ○ | | | ○ | | | ○ | | | | |
| Riverdijk | √ | | | ○ | ○ | ○ | ○ | | | | ○ | | | | | | |
| Steinhude Sea Recreation Facility | √ | | | ○ | ○ | | | | | ○ | ○ | | ○ | | | | ○ |
| Sunny Woods | √ | | | ○ | ○ | ○ | ○ | | | ○ | ○ | ○ | | | | | |
| Okamoto Solar House | | √ | | ○ | ○ | | | | ○ | | ○ | | | | | | |
| Okayama House | | √ | | ○ | ○ | ○ | | | | | ○ | | | | | | |
| Sunny Eco House | | √ | | ○ | ○ | ○ | | | | ○ | ○ | | | | | | |
| Sustainable Solar House | | √ | | ○ | ○ | | | | ○ | | ○ | | | | | | |
| Zero Energy House in Kanagawa | | √ | | ○ | ○ | | | | | ○ | ○ | | | | | | |
| Adam Joseph Lewis Center | | | √ | ○ | ○ | ○ | | ○ | | ○ | | | | ○ | ○ | ○ | ○ |
| Aldo Leopold Legacy Center | | | √ | ○ | | ○ | | | | ○ | | ○ | ○ | ○ | | ○ | ○ |
| Audubon Center | | | √ | | ○ | ○ | | ○ | ○ | ○ | ○ | | | ○ | | ○ | ○ |
| Challengers Tennis Club | | | √ | ○ | ○ | ○ | | ○ | ○ | ○ | | | | ○ | | ○ | |
| Demonstration House in Kansas City | | | √ | ○ | ○ | | ○ | | | | | | | ○ | | | ○ |
| Environmental Technology Center | | | √ | | ○ | ○ | | ○ | ○ | ○ | | | | ○ | | ○ | ○ |
| Home Depot Smart Home | | | √ | ○ | ○ | ○ | ○ | ○ | | ○ | ○ | | | ○ | | | ○ |
| Idae Z2 Squared Design Facility | | | √ | ○ | ○ | | | ○ | | ○ | | ○ | | ○ | ○ | ○ | |
| Nueva School | | | √ | ○ | ○ | ○ | | ○ | | ○ | | | | ○ | | ○ | |
| Science House | | | √ | ○ | ○ | ○ | ○ | ○ | ○ | ○ | | ○ | | ○ | ○ | ○ | |
| World Headquarter for IFAW | | | √ | ○ | ○ | ○ | | | | | | | | ○ | | | ○ |
| Total | 19 | 5 | 11 | 33 | 34 | 20 | 19 | 8 | 7 | 20 | 20 | 10 | 4 | 11 | 3 | 8 | 8 |
Table 5.
Passive and active design elements of zero energy buildings.
Table 5.
Passive and active design elements of zero energy buildings.
| Contents | Passive Elements | Active Elements |
|---|
| Energy consumption | Orientation of the building
layout and shape of the building, area and insulation of the envelope, window insulation performance, natural ventilation, solar radiation control device | Heat recovery ventilation, high efficiency air conditioner, high efficiency boiler, high efficiency lighting |
| Energy production | - | Solar power generation, solar heat collection, geothermal heat |
Table 6.
S/V ratio modification of small office.
Table 6.
S/V ratio modification of small office.
| Case | Width [m] | Depth [m] | Height [m] | Ratio of Lateral to Longitudinal Length [-] | Floor Area | Surface Area | Volume | S/V Ratio |
|---|
| 1 | 11.6 | 11.6 | 11.6 | 1.0 | 134.6 | 807.3 | 1560.9 | 0.52 |
| 2 | 16.1 | 16.1 | 6.02 | 1.0 | 259.2 | 906.1 | 1560.4 | 0.58 |
| 3 | 40.0 | 10.0 | 3.9 | 4.0 | 400.0 | 1190.0 | 1560.0 | 0.76 |
| 4 | 22.6 | 22.6 | 3.1 | 1.0 | 510.8 | 1298.1 | 1562.9 | 0.83 |
| 5 | 30.0 | 20.0 | 2.6 | 1.5 | 600.0 | 1460.0 | 1560.0 | 0.94 |
| 6 | 38.0 | 19.0 | 2.1 | 2.0 | 722.0 | 1690.2 | 1559.5 | 1.08 |
Table 7.
Properties of small office simulation model.
Table 7.
Properties of small office simulation model.
| Building Type | Wall Type | Total Thickness [m] | U-Value [W/mwK] |
|---|
| Central | Southern | Central | Southern |
|---|
| Small Office | Adjacent ceiling | 0.358 | 0.330 | 0.220 | 0.260 |
| Adjacent wall | 0.207 | 0.178 | 0.360 | 0.450 |
| Exterior roof | 0.480 | 0.420 | 0.150 | 0.180 |
| Exterior wall | 0.270 | 0.213 | 0.260 | 0.320 |
| Ground floor | 0.430 | 0.370 | 0.220 | 0.250 |
| Window | 0.026 | 0.026 | 1.490 | 1.800 |
Table 8.
Annual boundary condition of small office simulation model.
Table 8.
Annual boundary condition of small office simulation model.
| Properties | Condition |
|---|
| Heating setting temperature | 20 °C, Humidity 30% |
| Cooling setting temperature | 26 °C |
| Weather data | Representative weather data by statistical analysis of the region from 1981 to 2010 for 30 years |
| Number of ventilations | 0.5 time/h |
Table 9.
Modification of DOE (Department of Energy) reference building for large office simulation.
Table 9.
Modification of DOE (Department of Energy) reference building for large office simulation.
| Building Type | Floor Area [m2] | Story |
|---|
| Original | Modified | Central | Original |
|---|
| Large Office | 46,320 | 3656 | Large Office | 46,320 |
Table 10.
Properties of large office simulation model.
Table 10.
Properties of large office simulation model.
| Building Type | Wall Type | Total Thickness [m] | U-Value [W/mwK] |
|---|
| Central | Southern | Central | Southern |
|---|
| Large Office | Adjacent ceiling | 0.358 | 0.330 | 0.220 | 0.260 |
| Adjacent wall | 0.207 | 0.178 | 0.360 | 0.450 |
| Exterior roof | 0.480 | 0.420 | 0.150 | 0.180 |
| Exterior wall | 0.270 | 0.213 | 0.260 | 0.320 |
| Ground floor | 0.430 | 0.370 | 0.220 | 0.250 |
| Window | 0.026 | 0.026 | 1.490 | 1.800 |
Table 11.
Annual boundary condition of large office simulation model.
Table 11.
Annual boundary condition of large office simulation model.
| Properties | Condition |
|---|
| Heating setting temperature | 20 °C, Humidity 30% |
| Cooling setting temperature | 26 °C |
| Weather data | Representative weather data by statistical analysis of the region from 1981 to 2010 for 30 years |
| Number of ventilations | 0.5 time/h |
Table 12.
Boundary condition for photovoltaic modules.
Table 12.
Boundary condition for photovoltaic modules.
| Contents | Area | Capacity |
|---|
| Rooftop PV | 70% (Rooftop) | 256.5 kW |
| BIPV | 30% (South facade) | 62.7 kW |
| 30% (West facade) | 41.8 kW |
| 30% (East facade) | 41.8 kW |
| Total | - | 402.8 kW |
Table 13.
Building orientation with high energy production.
Table 13.
Building orientation with high energy production.
| Contents | 1st | 2nd | 3rd |
|---|
| Orientation [°] | Produced Energy [kJ/h] | Orientation [°] | Produced Energy | Orientation [°] | Produced Energy |
|---|
| Seoul | 90 | 600,004,585 | 100 | 599,863,957 | 80 | 597,264,743 |
| Daejeon | 90 | 752,933,650 | 80 | 752,350,262 | 100 | 749,617,380 |
| Busan | 90 | 747,771,046 | 80 | 745,898,465 | 100 | 745,453,000 |
Table 14.
Building orientation with low energy production.
Table 14.
Building orientation with low energy production.
| Contents | 36th | 35th | 34th |
|---|
| Orientation [°] | Produced Energy [kJ/h] | Orientation [°] | Produced Energy | Orientation [°] | Produced Energy |
|---|
| Seoul | 230 | 434,560,713 | 250 | 433,433,754 | 240 | 432,252,401 |
| Daejeon | 250 | 531,999,645 | 240 | 528,155,941 | 230 | 528,077,720 |
| Busan | 250 | 506,904,344 | 230 | 504,696,289 | 240 | 503,629,377 |
Table 15.
Final energy consumption.
Table 15.
Final energy consumption.
| Contents | Average of Energy Demand [kJ/h] | Average of Energy Generation [kJ/h] | Final Average of Energy Demand [kJ/h] |
|---|
| Seoul | 3,089,933,688 | 520,313,958 | 2,569,619,730 |
| Daejeon (Southern U-Value) | 3,502,698,245 | 644,985,657 | 2,857,712,588 |
| Daejeon (Central U-Value) | 3,198,209,746 | 2,553,224,089 |
| Busan | 2,684,092,649 | 631,502,370 | 2,052,590,279 |
| Publisher’s Note: MDPI stays neutral with regard to jurisdictional claims in published maps and institutional affiliations. |
© 2021 by the authors. Licensee MDPI, Basel, Switzerland. This article is an open access article distributed under the terms and conditions of the Creative Commons Attribution (CC BY) license (https://creativecommons.org/licenses/by/4.0/).


