Article

Evaluation and Validation of Viscous Oil Cavitation Model Used in Torque Converter

1
School of Mechanical Engineering, Beijing Institute of Technology, Beijing 100081, China
2
National Key Lab of Vehicular Transmission, Beijing Institute of Technology, Beijing 100081, China
3
China North Vehicle Research Institute, Beijing 100072, China
*
Author to whom correspondence should be addressed.
Appl. Sci. 2021, 11(8), 3643; https://doi.org/10.3390/app11083643
Submission received: 2 March 2021 / Revised: 6 April 2021 / Accepted: 13 April 2021 / Published: 18 April 2021
(This article belongs to the Section Mechanical Engineering)

Abstract

:
Hydraulic torque converter is widely used in transmission units as it is able to provide variable speed and torque ratio, isolate vibration, and absorb shock. The pursuit of a highly packed power unit requires a high capacity/speed torque converter, consequently resulting in a higher risk for cavitation and severe performance degradation, noise, vibration, and even failure. Existing cavitation models generally focus on water, and the empirical parameters are not suitable for the cavitation prediction of torque converter which utilizes high viscosity oil as its working medium. This paper focused on the influence of parameters on the performance and cavitation characteristics of torque converter. A full flow passage geometry and different computational fluid dynamics (CFD) models with cavitation were developed to predict torque converter fluid behavior by resolving Reynolds-averaged Navier–Stokes equations using finite volume method (FVM). The numerical results indicated that nuclei volume fraction, vaporization coefficient, mean nucleation site radius, and maximum density ratio have great influences on the cavitation behavior. These parameters altered the degree of cavitation and the pressure distribution on the surface of stator blades, and affected the stall performance such as stall capacity factor and torque ratio. The cavitation model was then modified to improve calculation accuracy. The test results showed that the prediction error under stall operating condition was decreased from 6.7% to 2%. This study provides insight on the influences of the empirical parameters on both internal cavitation behavior as well as overall hydrodynamic performance.

1. Introduction

Hydraulic torque converter is a closed-loop fluid machinery which transfers power by the conversion between fluid kinetic energy and mechanical energy, and it serves as a core component of automatic transmission and hydraulic transmission (Figure 1). Hydraulic torque converters are widely used in transmission systems of passenger cars, off-road vehicles, commercial vehicles and construction machinery because it is able to provide continuously variable transmission, self-adaption to load, and absorb vibration from the engine [1]. The internal flow state of a hydraulic torque converter is very complicated, the fluid pressure, velocity and temperature vary drastically over different operating conditions. The increasing demand for higher power density leads to higher flow velocity and lower local pressure, which makes the flow inside the torque converter more prone to cavitation. Cavitation will occur when the local pressure is lower than the vapor pressure of the working fluid, and it will not only reduce the performance of torque converter, but also cause vibration, noise, and a series of unfavorable issues [2,3].
Cavitation is a transient phase change phenomenon, vapor bubbles occur, grow, and collapse in liquid with the variation of local pressure. Hydraulic transmission oil is prone to cavitation because it contains a huge amount of dissolved gas and undissolved micro gas bubbles. The periodic growth and collapse of cavitation will cause vibration and noise of torque converter, and the high local pressure is generated during cavitation collapse, all of these will lead to poor performance, short service life, and cavitation damage or even damage the torque converter in severe cases. As the development of hydraulic torque converter is toward high capacity, high speed, and high power–weight ratio, cavitation in torque converters has become one of the key issues affecting performance and reliability. Therefore, it is of great theoretical and practical significance to study the cavitation flow phenomenon in a torque converter.
In recent decades, more and more attention has been paid to the research on the cavitation of hydraulic torque converter and the parameters of cavitation model [4]. Anderson made a systematic study on cavitation of torque converter under stall operating condition by using various experimental methods [5]. Watanabe predicted the cavitation behavior of automotive torque converter under stall, and studied the cavitation, vibration, and the relationship between them through experiments [6]. Dong found cavitation grew near the stator leading edge and expanded with the increase of pump speed by constant enthalpy vaporization model, resulting in severe performance degradation in hydraulic torque converter [7]. Tsutsumi studied the cavitation characteristics of a torque converter under different charging pressures and operating conditions by CFD method and Rayleigh–Plesset cavitation model [8,9]. Jaewon studied the cavitation characteristics of torque converter under various working conditions by Zwart model, found out cavitation mainly occurred in stator, which leads to serious deterioration of torque capability [10]. Zhao studied the mechanism of bubble breakup in the hydraulic torque converter by implanting bubbles in hydraulic torque converter, and calculated the bubble breakdown process by VOF model [11]. Liu studied the influence of stator blade shape on the cavitation process of a torque converter by Zwart model and found out cavitation was directly affected by internal mass flow rate, then he improved the torque converter design considering cavitation [12,13]. Kang [14] and Dong [15] studied the flow structure and cavitation phenomena in a hydraulic retarder by Zwart model, and found cavitation appeared near the back and root of rotor blade, and the vapor volume fraction increased with the increase of rotor speed. Guo investigated the dynamic cavitating flows inside a torque converter using transient CFD model and Zwart cavitation model, the results indicated that stator domain was the main place where cavitation occurred, and it brought about over 20% degradation in capacity constant [16]. Zhou modified the parameters of Kunz cavitation model by using the sequential approximate optimization method, and obtained the optimal condensation and evaporation coefficients of the cavitation model [17]. Morgut compared three widespread mass transfer cavitation models (the Kunz, Zwart, and FCM models), and tuned the empirical coefficients of different models by an optimization strategy [18]. Liu studied the parameters of centrifugal pump cavitation model (Zwart model) and found that the calculation accuracy will be improved by declining the condensation coefficient, the initial bubble radius or increasing the evaporation coefficient [19].
In recent years, a series of cavitation models based on transport equation have been proposed, the source term representing the vaporization and liquefaction processes is used to simulate the mass transport between vapor and liquid. The source term contains empirical constants, which are mostly obtained by numerical experiments of systemic water tunnel [19], most of previous studies accepted default empirical settings for their cavitation model. However, hydraulic torque converter is a fluid machinery with viscous oil as working medium. Compared with water, viscous oil has a smaller density, higher viscosity, lower vaporization pressure, smaller surface tension, and higher gas volume content at the same temperature, all these factors have complex relationship with the cavitation characteristics of viscous oil [20]. The empirical parameters of cavitation model leads to pronounced errors in terms of viscous oil cavitation prediction, which need to be studied in depth. Therefore, this study is devoted to the influences of cavitation parameters on both internal two-phase flow field and overall hydrodynamic performance numerically based on the cavitation characteristics of viscous oil, and the empirical parameters were modified to increase cavitation prediction accuracy.

2. Materials and Methods

ANSYS CFX 19.2 was employed to resolve the Reynolds-averaged Navier–Stokes equation of the full three-dimensional flow field. The following assumptions were put forward to improve the convergence and accuracy of steady-state/transient numerical calculation [2]: (1) The flow was incompressible and the heat transfer was ignored in torque converter. (2) The components were assumed to be absolutely rigid bodies, and deformation and axial displacement were not considered. (3) The leakage was neglected.

2.1. Multiphase Model

The key to cavitation simulation is to establish a proper cavitation model [21] which governs the mutual transformation between liquid and vapor. There are mainly two kinds of cavitation models—the state equation model and transport equation model. The state equation model simulates cavitation by assuming the function relationship between density and pressure, thus its accuracy relies on the assumed density-pressure function. The transport equation model determines the multi-phase mass transfer rate by local pressure and it is widely used in cavitation simulation, many multiple transport equation cavitation models were developed and validated by numerous research now, such as Zwart-Gerber–Belamri model [22], Kunz model [23], Schnerr–Sauer model [24], and Singhal model [25]. Compared with other models, Zwart cavitation model not only has higher accuracy and better robustness, but also is easy to converge and obtain obvious cavitation movement [26]. Therefore, the cavitation phenomenon of hydraulic torque converter was studied based on the Zwart cavitation model in this paper.
Under most engineering conditions, it is assumed that there are enough gas nuclei to induce cavitation inception. Therefore, the emphasis is put on the reasonable description of cavitation bubble growth and collapse. Based on the assumption that the cavitation bubble is spherical and there is zero slip velocity between fluid and cavitation bubbles, the dynamic equation of cavitation can be deduced from the Rayleigh–Plesset equation
R B d 2 R B d t 2 + 3 2 d R B d t 2 + 2 σ ρ f R B = p v p ρ f
where RB is the cavitation vapor bubble radius, p is the liquid pressure, pv represents the pressure in the bubble, ρf is the liquid density, and σ is the coefficient of surface tension. According to the Rayleigh–Plesset equation, the volume change of a single bubble depends on the difference between vaporization pressure and liquid pressure. The above equation reduces to
d R B d t = 2 3 p v p ρ f
Therefore, the volume change rate of bubble can be described by
d V B d t = d d t 4 3 π R B 3 = 4 π R B 2 2 3 p v p ρ f
The mass change of bubble is as follows,
d m B d t = ρ g d V B d t = 4 π R B 2 ρ v 2 3 p v p ρ f
where ρv represents the density of the vapor.
Zwart calculated the volume fraction (rg) by multiplying the number of bubbles per unit volume (NB) and the mass transfer rate of bubble volume (VB) [22]. The expression is as follows,
r v = V B N B = 4 3 π R B 3 N B
And the total interphase mass transfer rate is obtained as
m ˙ f v = N B d m B d t = 3 r v ρ v R B 2 3 p v p ρ f
This expression depends on the direction of phase transition. For the growth/vaporization of bubbles, it is given by the equation
m ˙ f v = F 3 r v ρ v R B 2 3 p v p ρ f sgn p v p
where F is a factor expressing the mass conversion rate direction, which includes vaporization (Fvap) and condensation (Fcond) processes. Fvap is different from Fcond because the condensation process is much slower than the vaporization process [27].
Although Equation (7) can be applied to the vaporization and condensation processes, the equation needs to be modified during the vaporization process.
The vaporization process begins with the nuclei and grows up to bubbles. However, with the increase of vapor volume fraction, the nuclei volume fraction decreases correspondingly; therefore, we replace rv in Equation (7) with rnuc(1 − rv) to give
m ˙ f v = F 3 r n u c 1 r v ρ v R B 2 3 p v p ρ f sgn p v p
where rnuc represents the nuclei volume fraction, which is also expressed in NVF.
For the condensation process, the equation of mass transfer rate is
m ˙ f v + = F c o n d 3 r v ρ v R B 2 3 p p v ρ f
For vaporization, the mass transfer rate can be reorganized as
m ˙ f v = F v a p 3 r n u c 1 r v ρ v R B 2 3 p v p ρ f

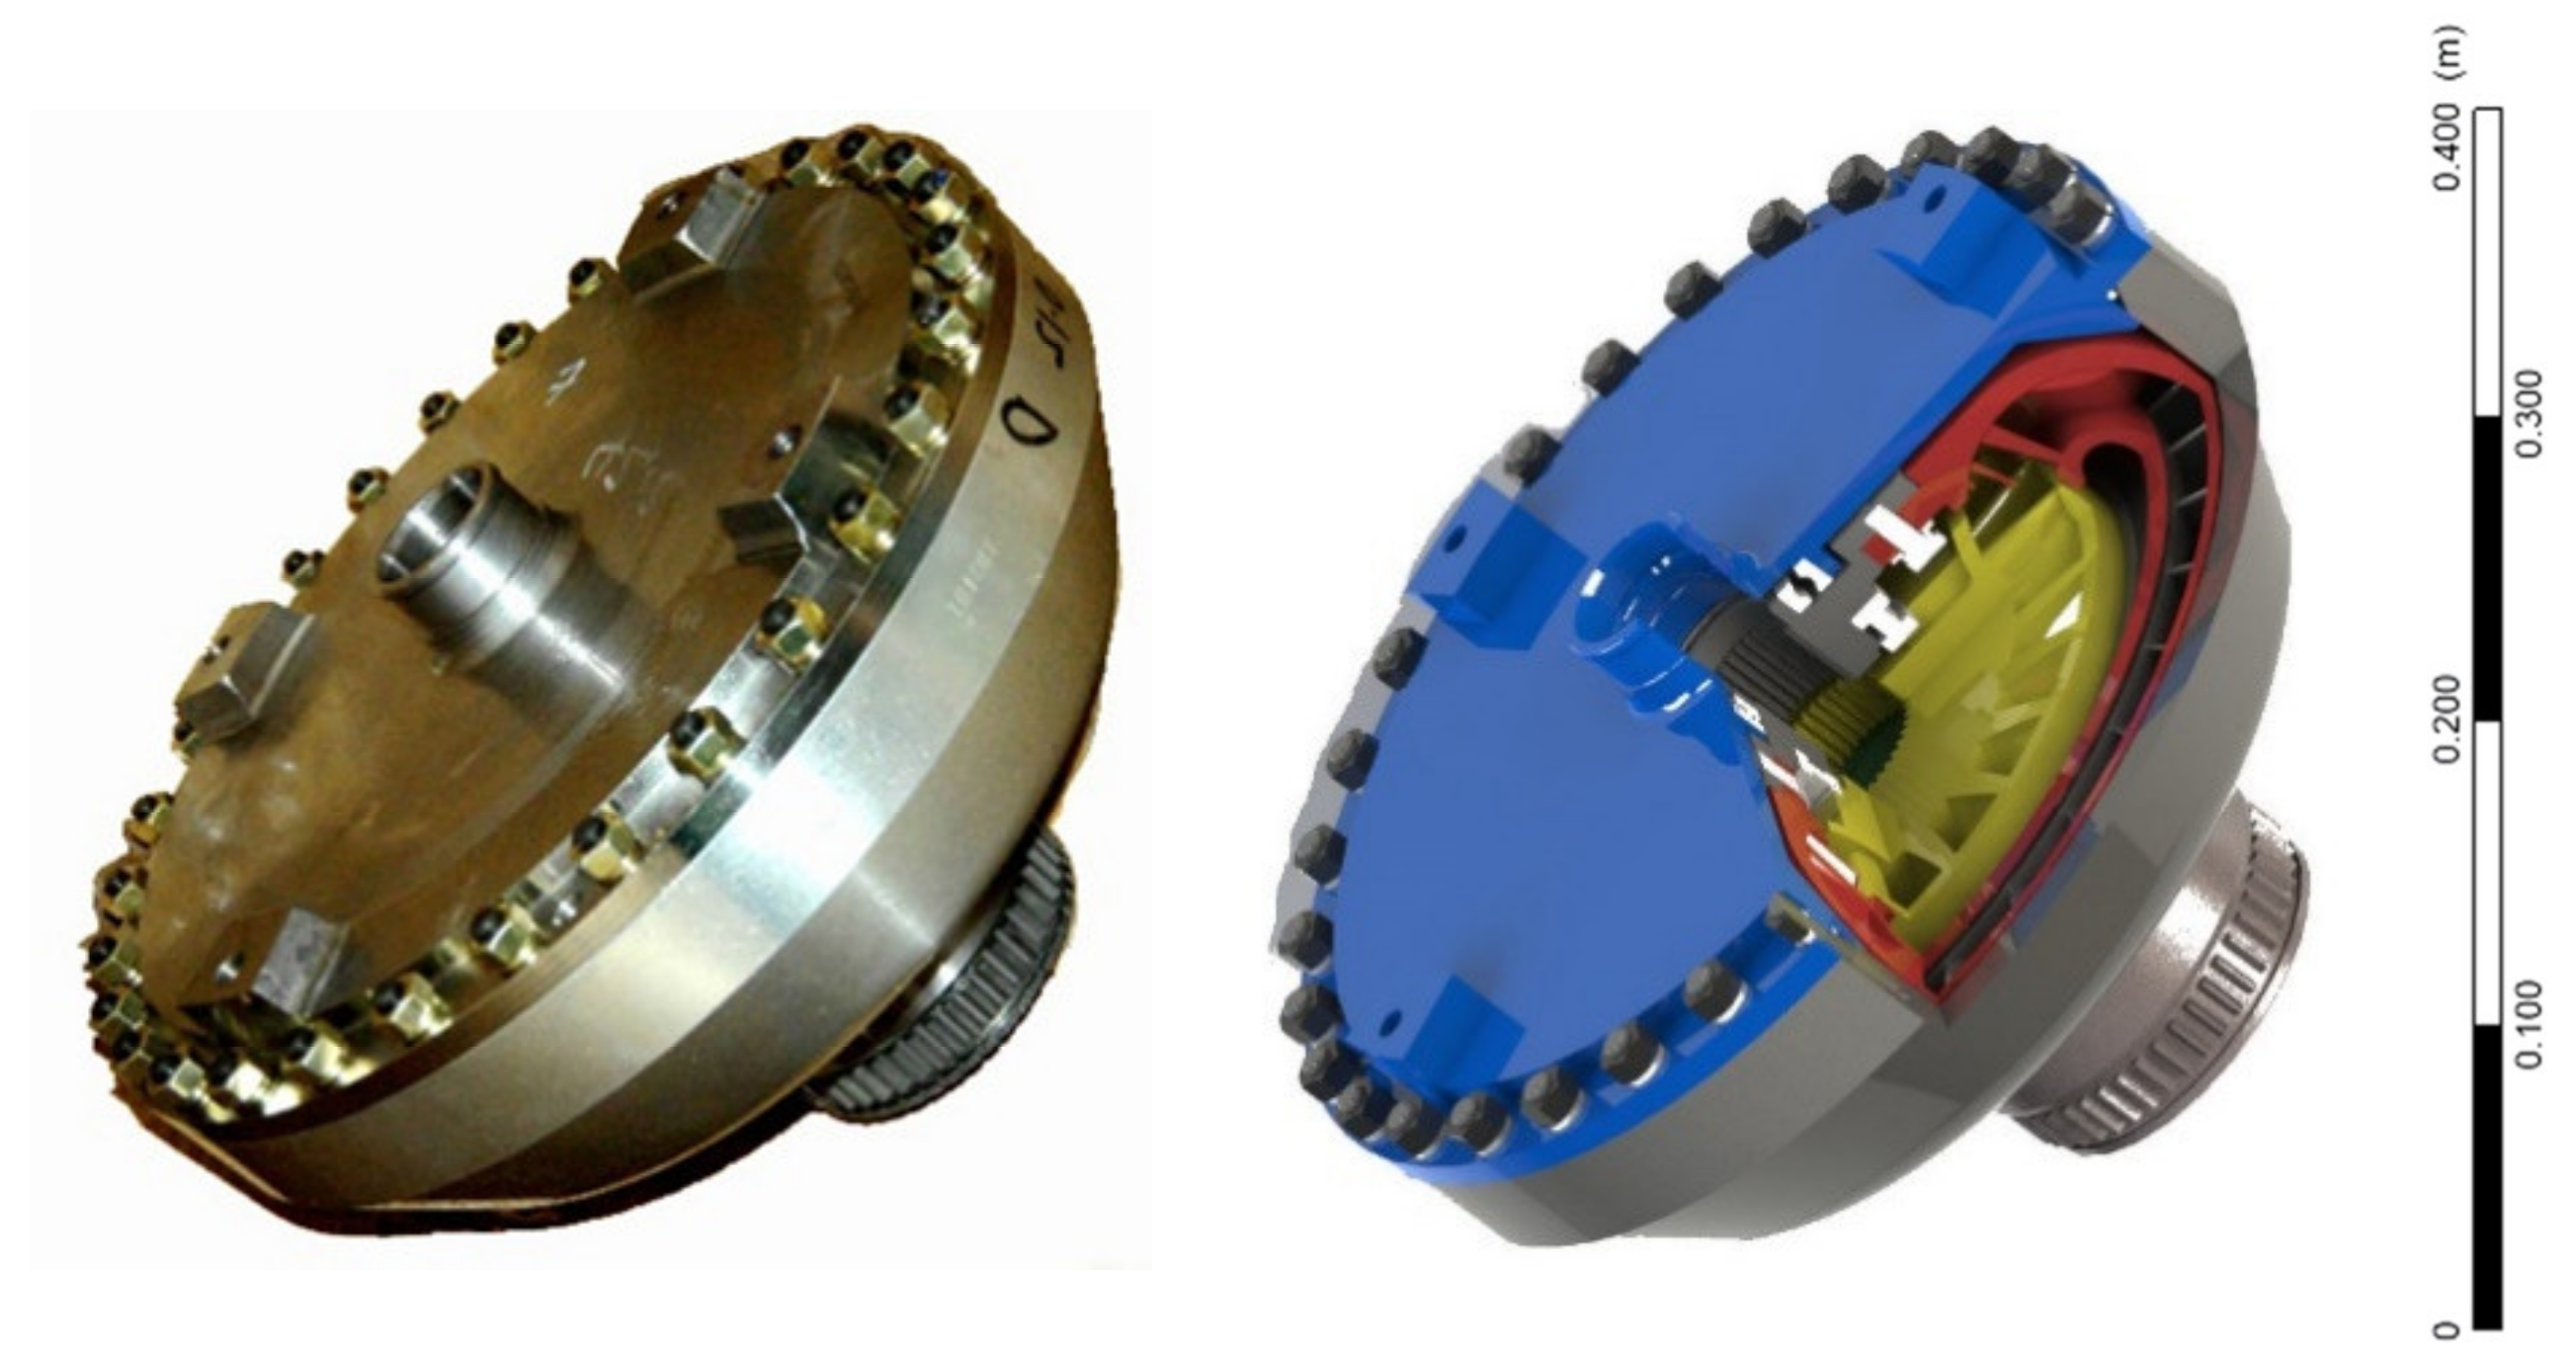
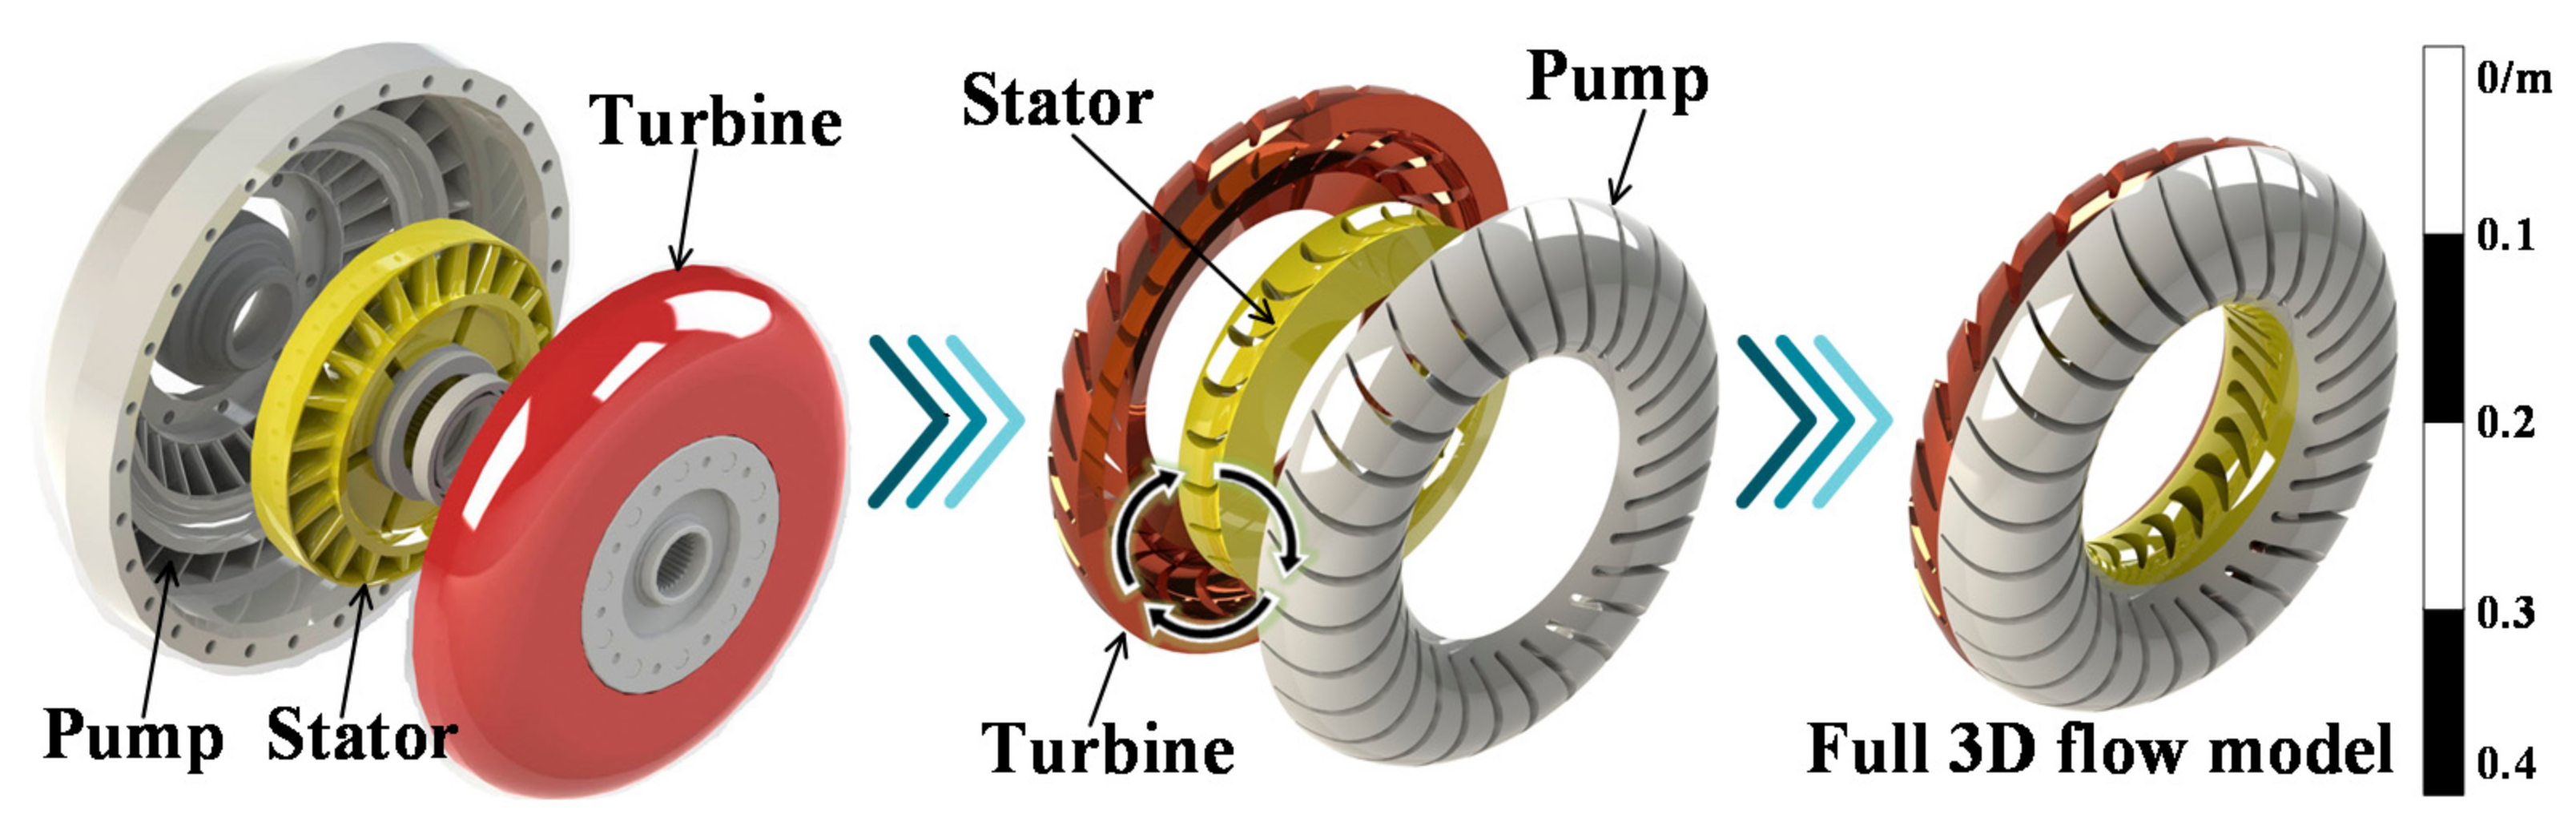
2.2. Geometry Model of the Torque Converter

The full flow passage (Figure 2) was extracted from a base torque converter whose torus diameter is 315 mm. The torque converter mainly consists of pump, turbine and stator, and the liquid flows in a closed-loop, the fluid flows circularly in the sequence of pump—turbine—stator. In order to realize the information exchange between different domains, it is necessary to establish interfaces models between adjacent domains. Moreover, the pump speed (NP) is a fixed value of 2000 rpm, the turbine speed (NT) is a variable value with a range from 0 to 1600 rpm, the stator speed (NS) is always 0 rpm, and the speed ratio condition is determined by pump speed and turbine speed (SR = NT/NP). We focused on the analysis of the cavitation performance of the torque converter under stall operating condition when cavitation reached its maximum extent.

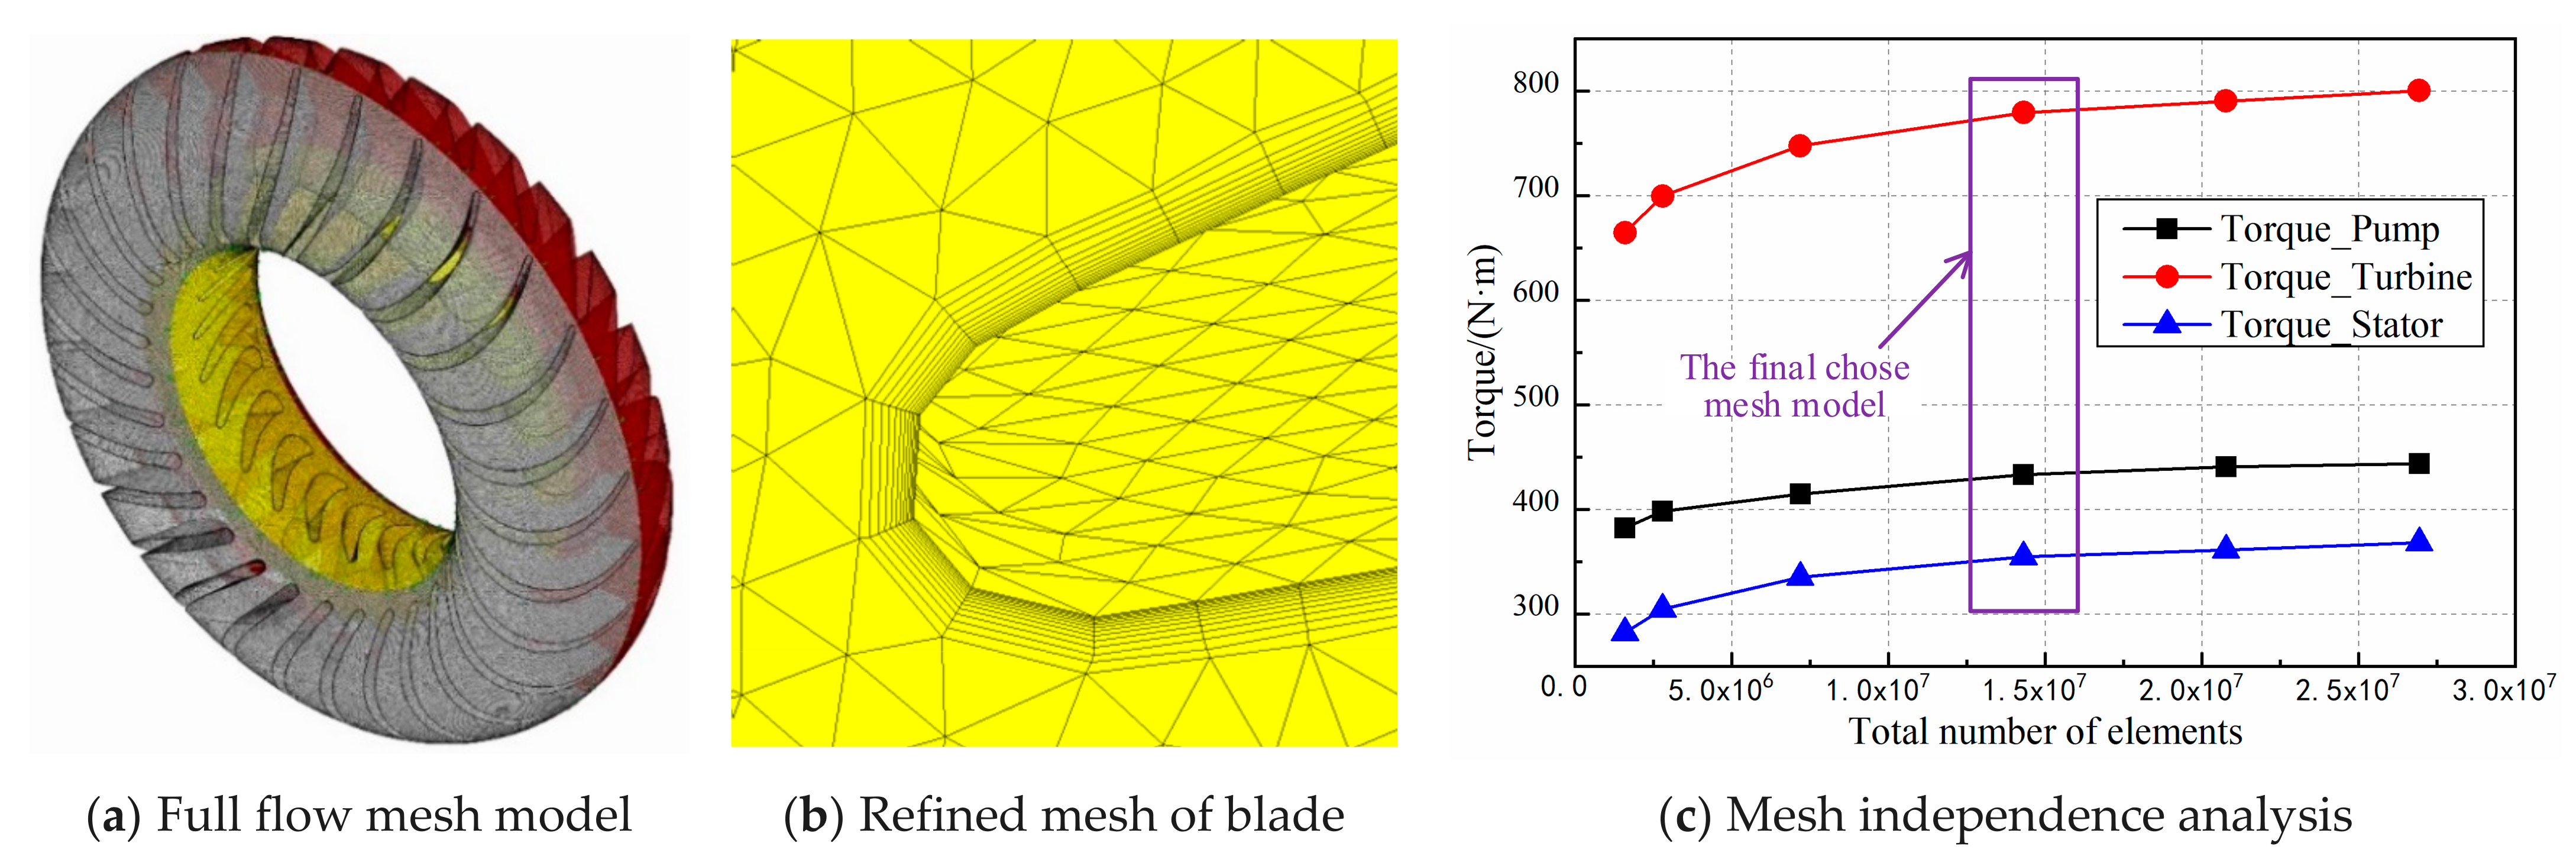
2.3. Mesh Independence Analysis
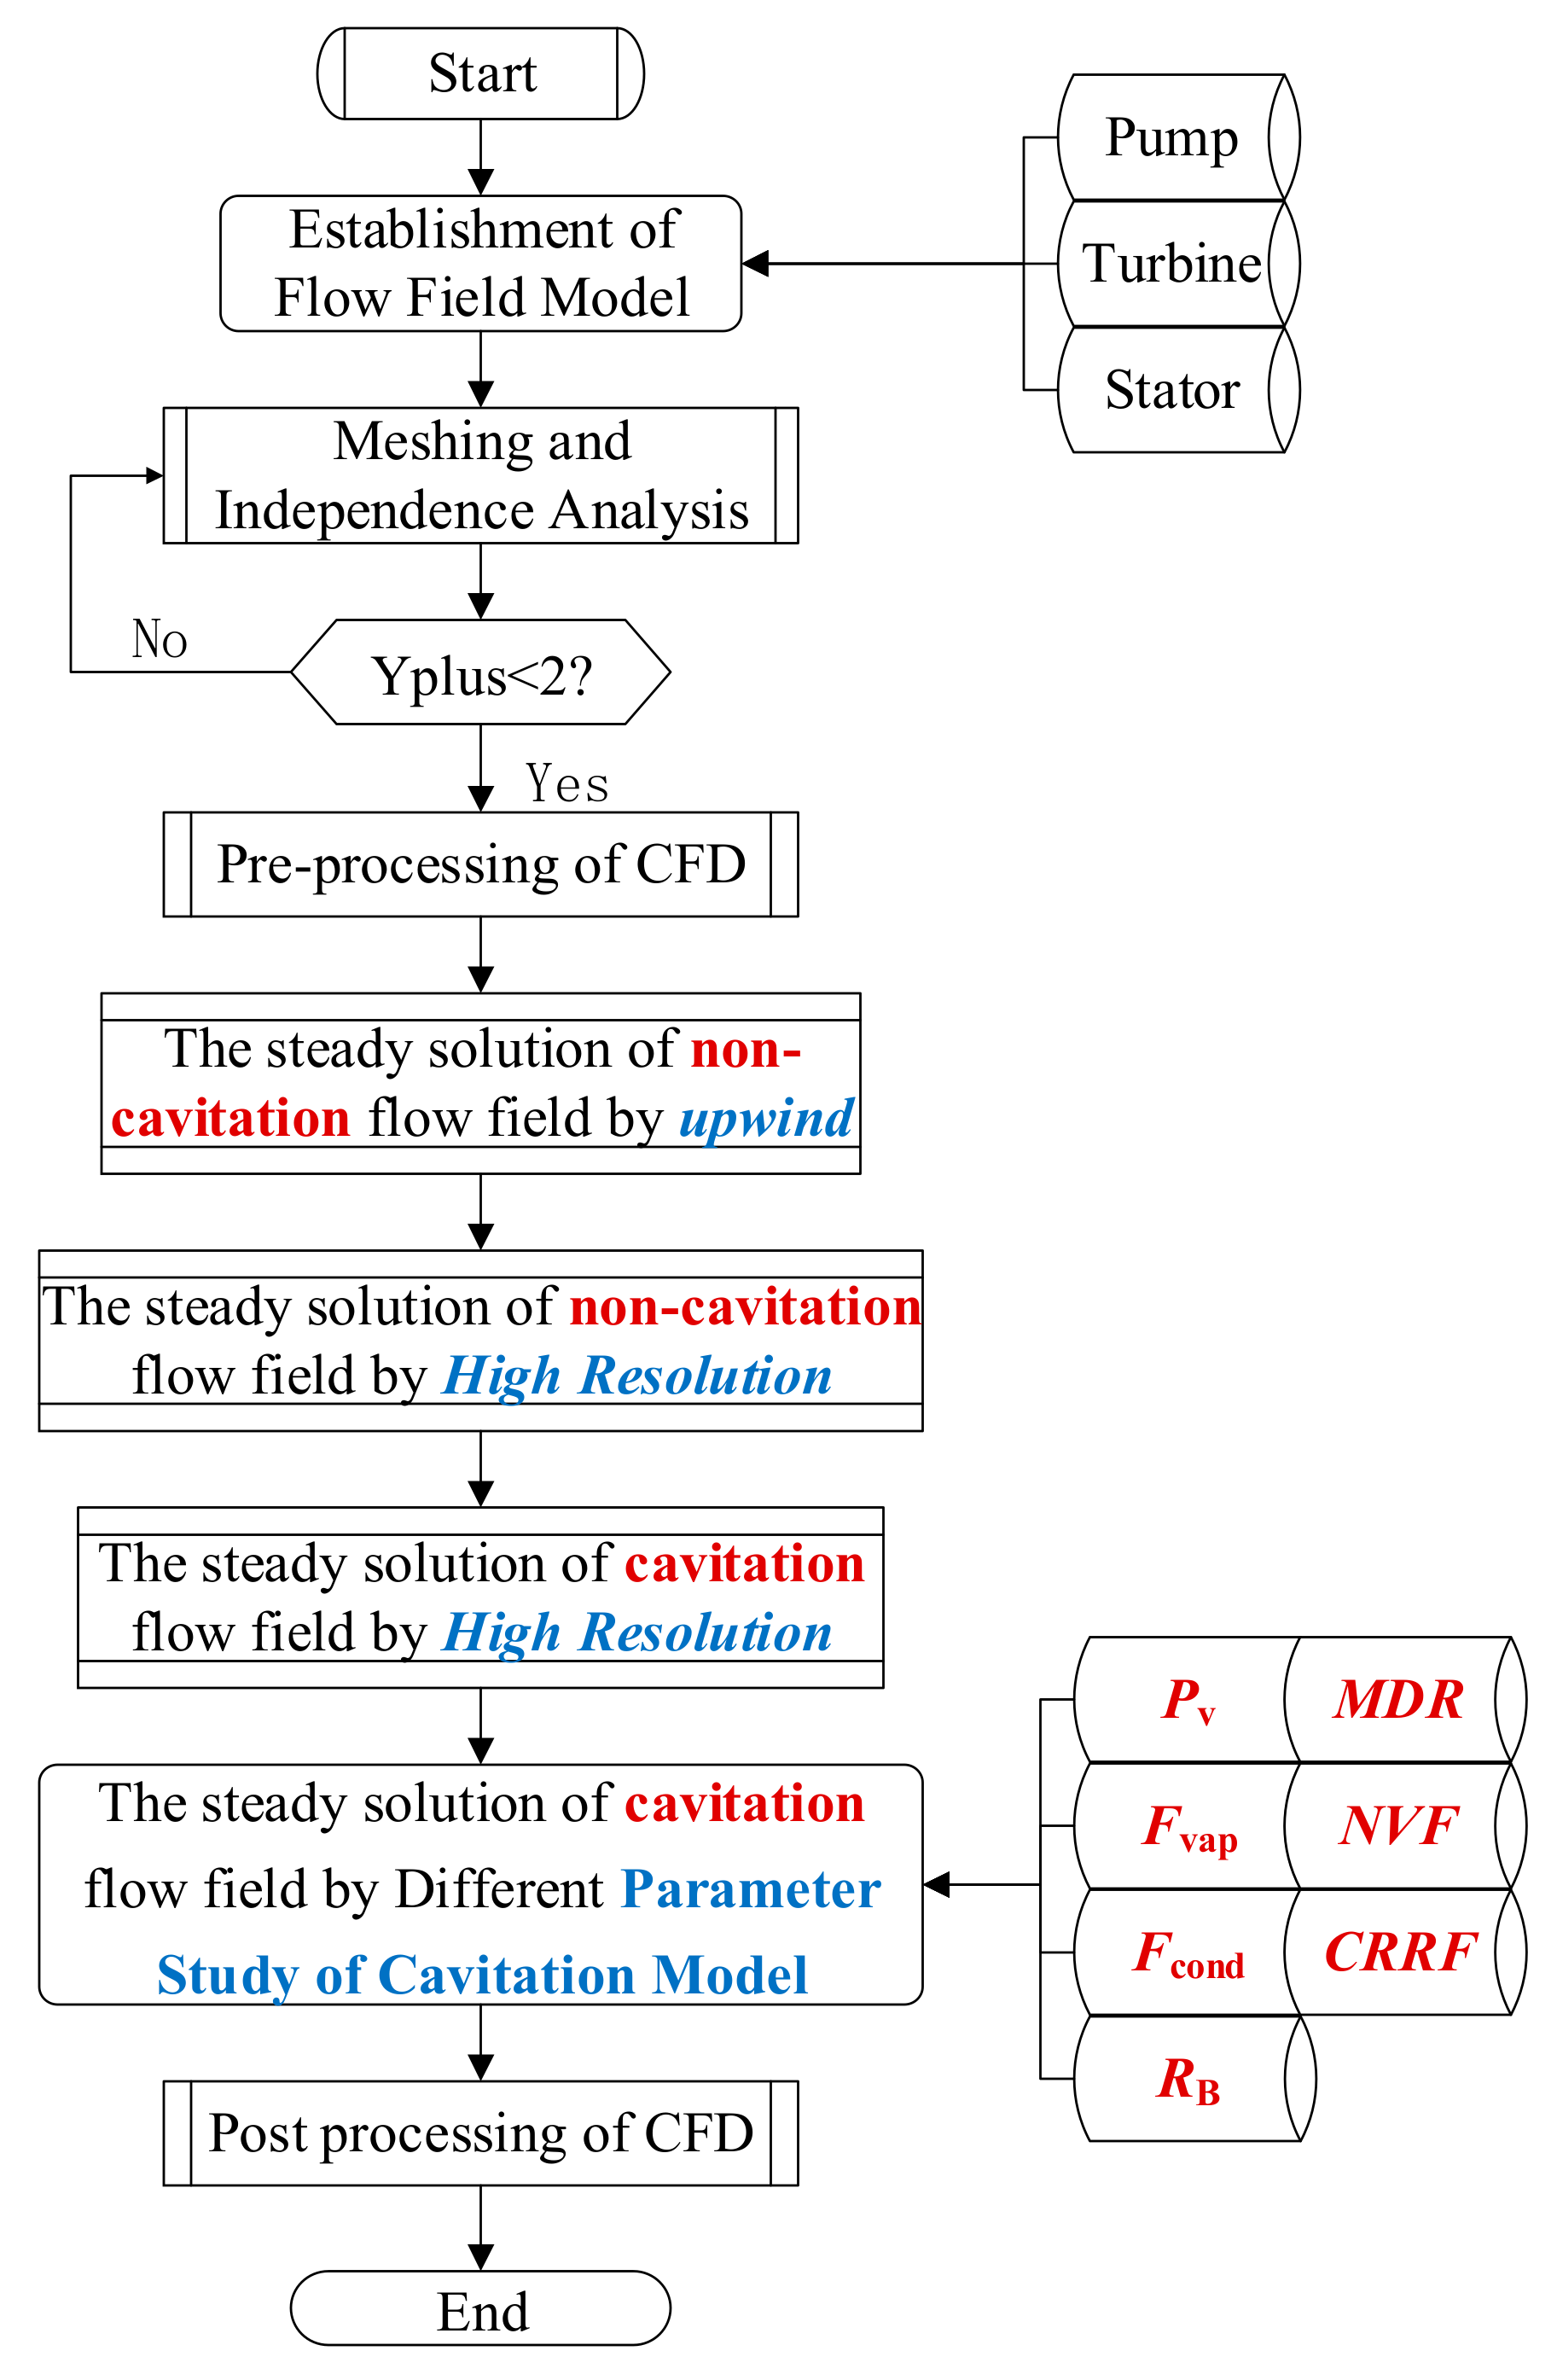
The three impellers were discretized using unstructured tetrahedral elements in ICEM-CFDTM of ANSYS 19.2. As the cavitation bubbles were generally small, a refined mesh around the blade is required to restore the real flow status and capture the cavitation flow behaviors.
The accuracy and efficiency of the solution are directly affected by the mesh density. In theory, a higher grid number would yield better accuracy; however, more mesh requires higher computing resources. Therefore, an appropriate mesh density should be determined by mesh independence analysis to achieve a proper balance between accuracy and computing cost, and the mesh model is considered independent if further refining the mesh produces less than 3% variation in results.
A mesh independence test was performed with different mesh resolutions, the reference pressure level was 0.4 MPa, and the pump speed was 2000 rpm, SR was 0.4. Figure 3 shows the torque results of pump, turbine and stator over variant mesh densities through the CFD calculation. Taking into account the computational efficiency and accuracy comprehensively, the element numbers of pump, turbine and stator are 7,538,148; 4,319,448; and 2,442,091 respectively, and the torque variation of pump, turbine and stator is 1.63%, 1.42%, and 1.90% respectively, which satisfies the requirement of mesh independence, as shown in Table 1, and the bold font is the final chose mesh model.
The mesh around the blade surface is densified with 12 layers of prism mesh whose minimum height is 0.015 mm, the mesh quality is analyzed again, and the Yplus values (which is a non-dimensional variable representing the distance from the wall to the first node away from the wall) of three impellers are all less than 2, which means that the boundary layer and wall function can meet the requirements of high accuracy. The final total element number is 22,431,217 after the boundary mesh generation.

2.4. CFD Settings

The parameter study on torque converter cavitation is carried out according to the flow chart shown in Figure 4. The internal flow of torque converter is three-dimensional, viscous and turbulent. The full flow model of torque converter was firstly established and then the meshing and mesh independence analysis were carried out, the mesh around the blade surface was refined and its Yplus should be less than 2.
The CFD calculation was divided into four steps to improve the accuracy and the convergence of the simulation, and the results of previous calculations were used as the initial value of next simulation because the convergence of solution is directly affected by initial value.
Firstly, the characteristics of torque converter ignoring cavitation were solved by a steady-state model with the upwind advection scheme, then the non-cavitation steady-state CFD model was performed by high-resolution advection scheme and turbulence numerics to provide accurate flow field status. Thirdly, the steady-state cavitation behavior was simulated using the high-resolution scheme and default cavitation parameters based on the non-cavitation model results. Lastly, a series of steady-state CFD cavitation models with cavitation empirical parameters were carried out using the steady-state non-cavitation outputs as its initial condition to study the influence of cavitation model parameters. After the calculation, the results were processed and the effects of cavitation parameters were analyzed.
The detailed CFD model settings are listed in Table 2. The pressure setting in the torque converter has no inlet or outlet boundaries because of the closed-loop flow. Therefore, a pressure value of 0.4 MPa was set at the charge oil inlet which is located at the interface between pump and stator corresponding to the test. The internal fluid fields of the torque converter under stall operating condition were calculated with non-cavitation and cavitation models, and then the pump torque (TP), turbine torque (TT), and other performance indices were derived from the CFD results.
In addition, there are seven parameters in the torque converter cavitation model. Pv is the saturated vapor pressure, and the vapor pressure of automatic transmission oil is very low, it was set to be 110 Pa in our previous studies [13]. Fcond is the cavitation condensation coefficient whose default value is 0.01 as condensation usually occurs slowly. Fvap is the cavitation vaporization coefficient with a much higher default value (50) to represent the growth (vaporization) rate of the cavitation bubbles. RB is the mean radius of cavitation bubble, and the default value of 2 × 10⁻⁶ m is considered reasonable. MDR is the maximum density ratio of oil and oilvapor which is used to clip the vapor density for all terms except the cavitation source term itself, its default value is 1000. NVF is the volume fraction of the nucleation sites with a default value of 5 × 10⁻⁴. CRRF is the cavitation rate under relaxation factor, and its default value is 0.25 [22,27,28].
In order to further study the cavitation model, the performance of torque converter with different cavitation parameters was calculated to analyze the sensitivity of each parameter. Herein the parameter study was conducted by varying each parameter while keeping the rest at their default level. The value ranges of the parameters were confirmed based on a large number of investigations and our numerical calculation. The specific levels of each parameter are shown in Table 3.

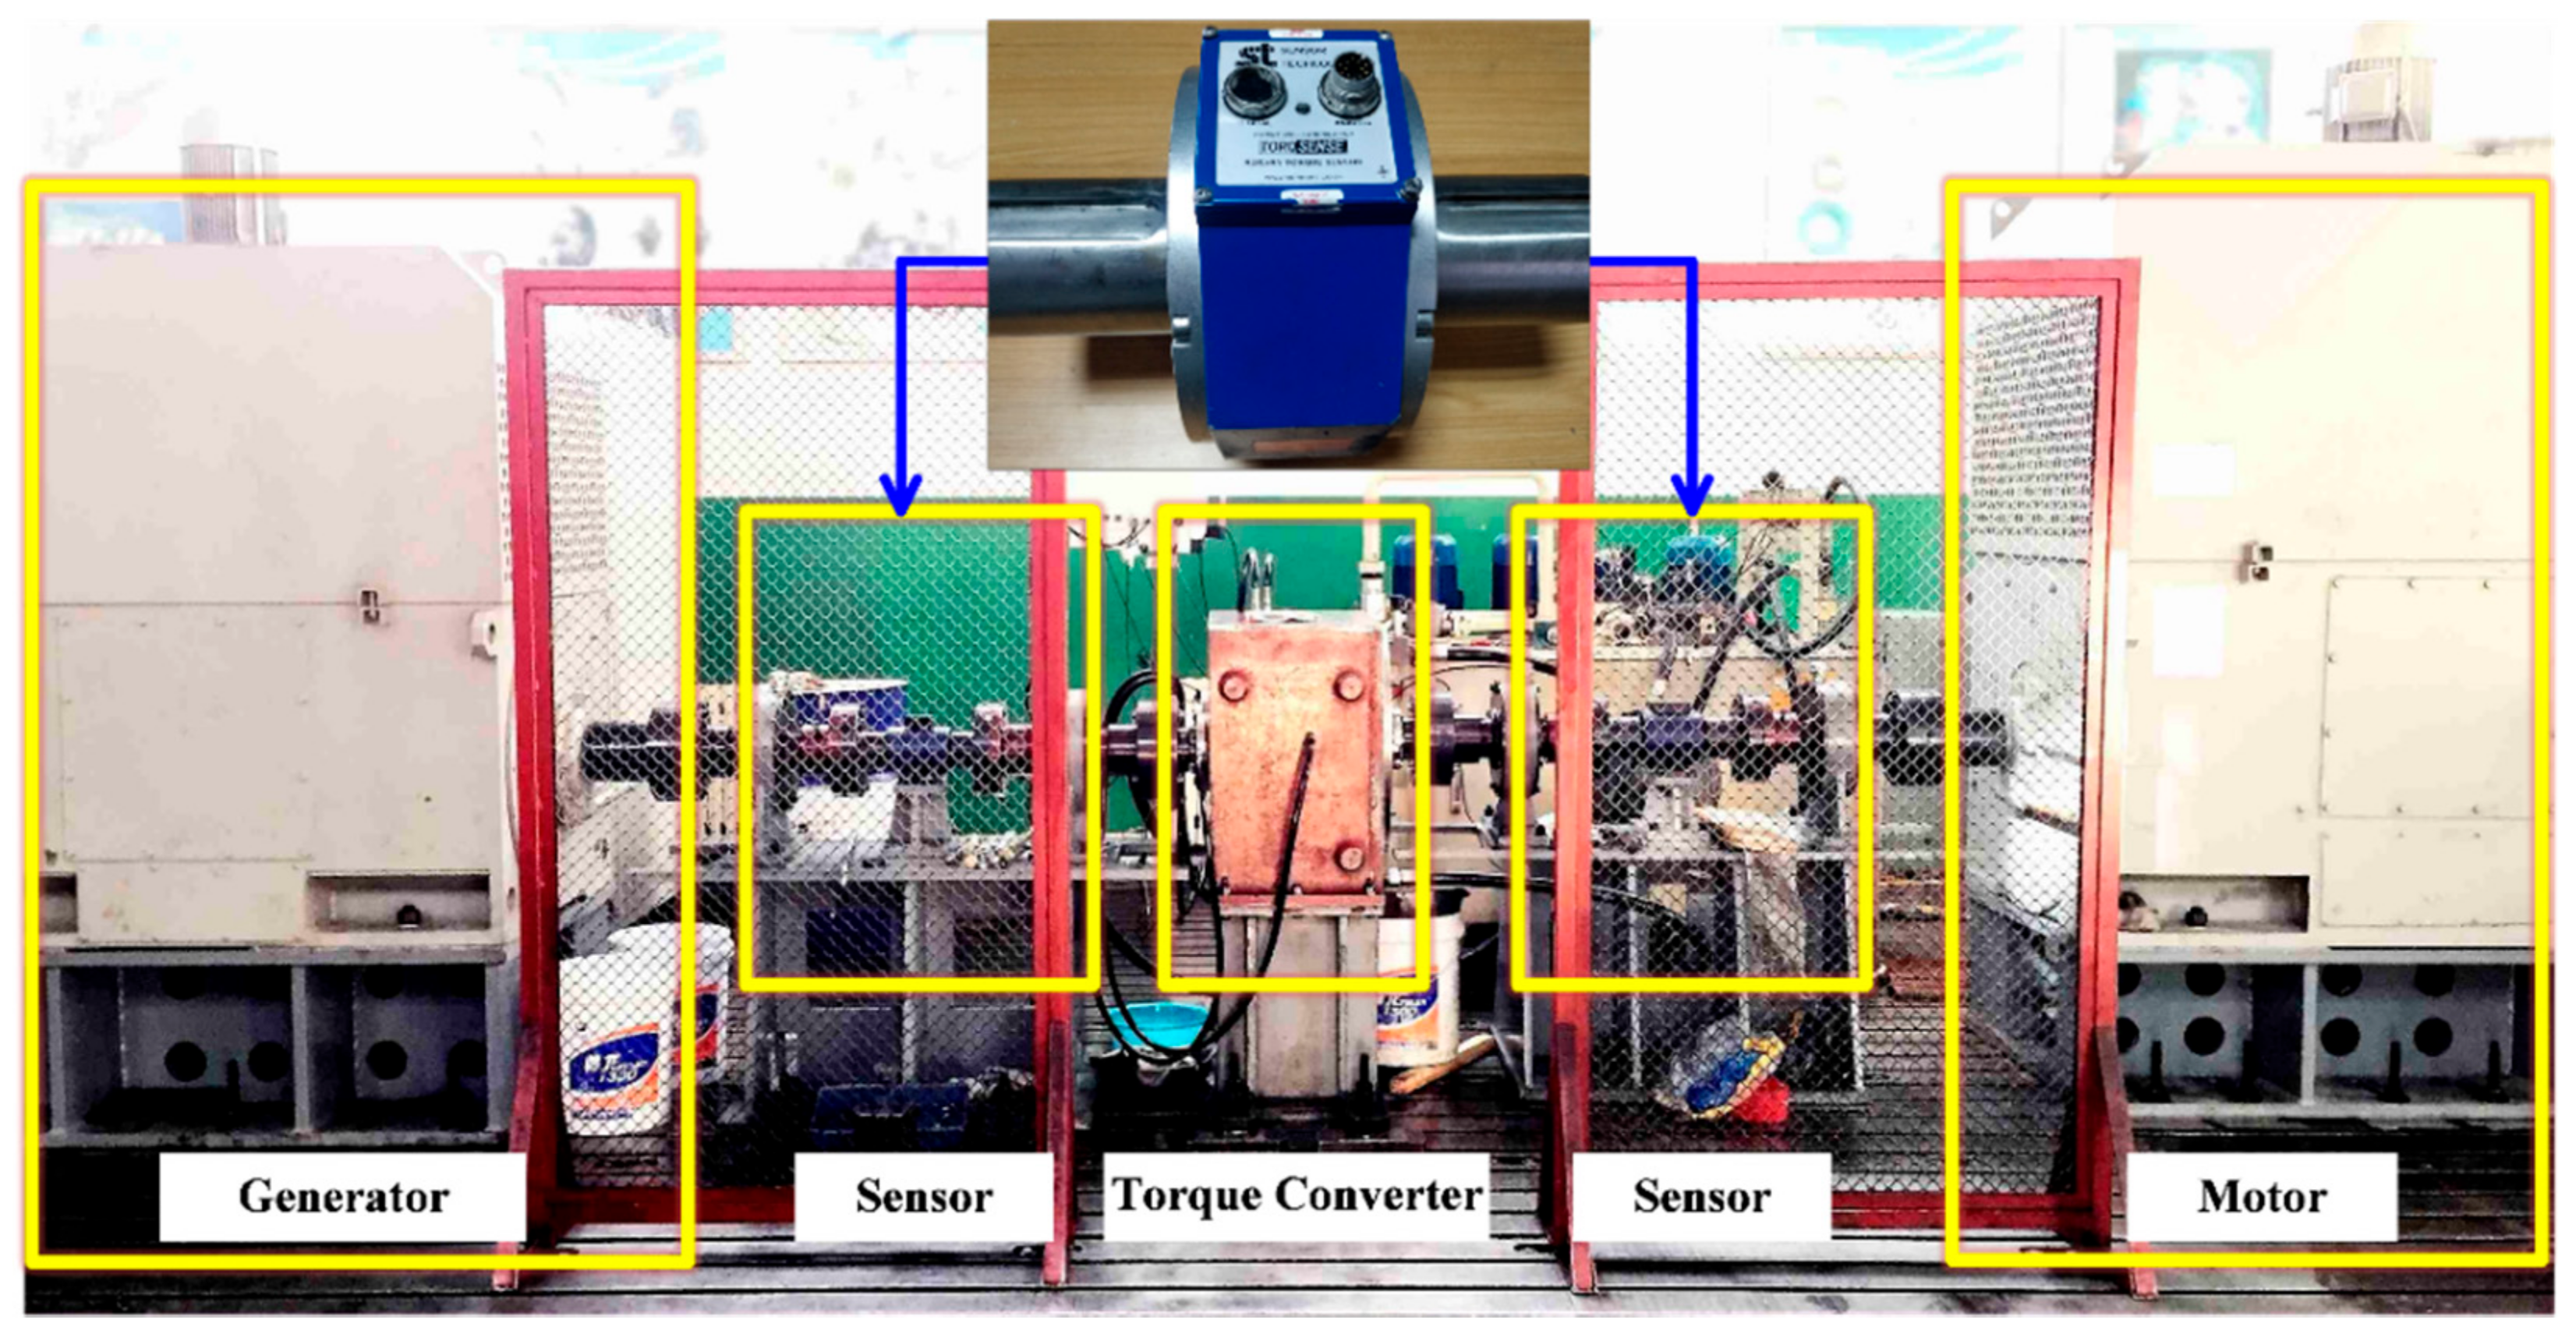
3. Hydraulic Torque Converter Test Rig

3.1. Macro Characteristic Test of Hydraulic Torque Converter

The test cell consists of a motor (300 kW) and a generator (300 kW) to simulate various speed conditions. The speed and torque sensors of Sensor Technology Ltd., with calibration accuracy of 0.25%, are installed at the input and output ends of the torque converter respectively, the maximum range is 5000 rpm and 2000 Nm respectively. Besides, the pressure and flow in the torque converter was supplied by a hydraulic system. The test speed ratio is realized by controlling the speed of motors (NP = 2000 rpm) and generator (NT = 0–1600 rpm) during the experiment, and the internal liquid pressure (Pc = 0.4 MPa) and temperature (TC = 90 °C) are realized by controlling the hydraulic system, as shown in Figure 5.

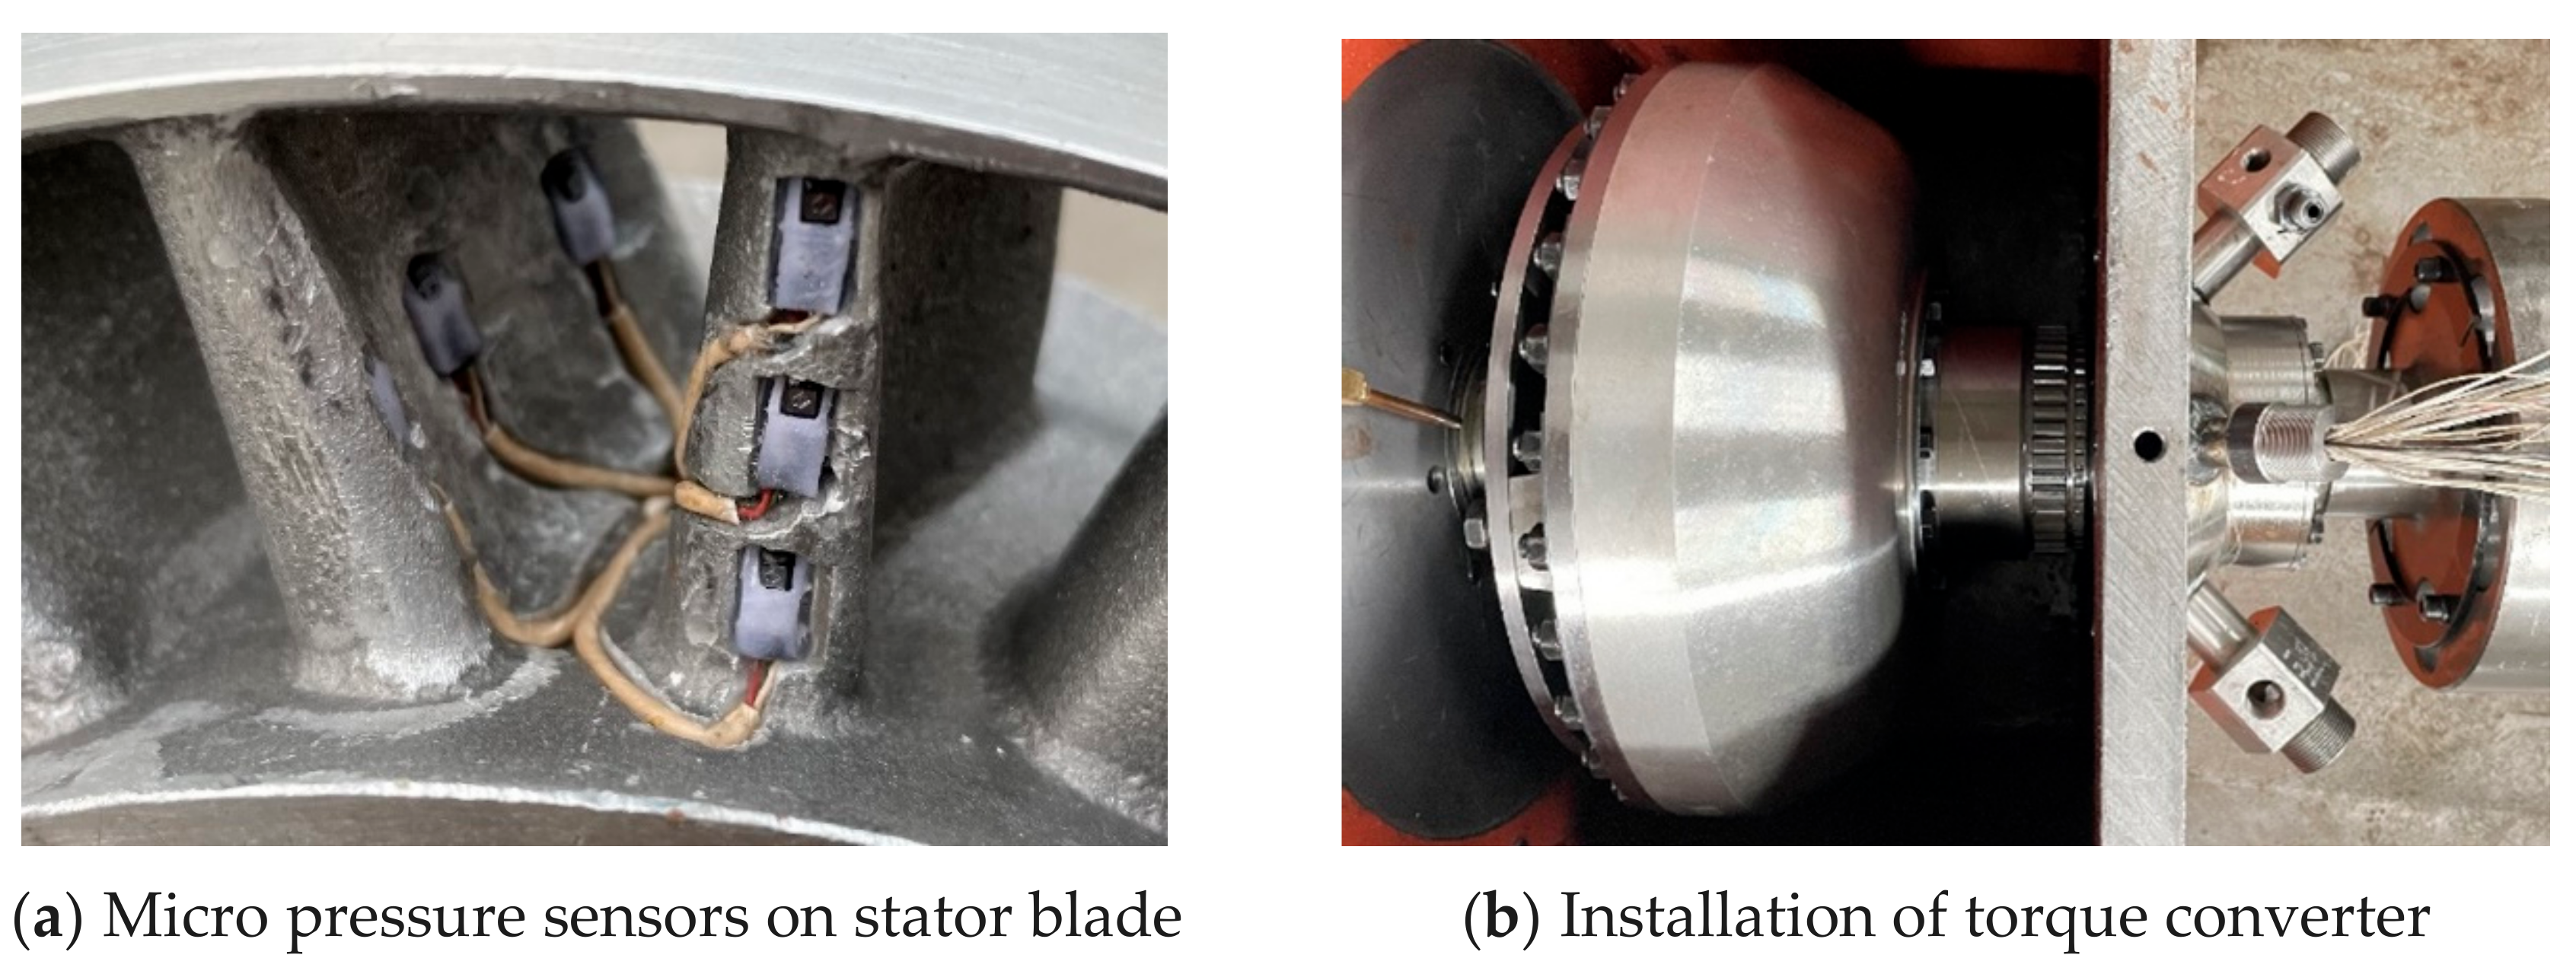
3.2. Micro Pressure Test Inside Hydraulic Torque Converter

Based on the torque converter test cell, the pressure sensors were integrated into stator blades to obtain the pressure information of flow field and cavitation in the torque converter, as shown in Figure 6. The micro pressure test data in torque converter will support and verify the modification of cavitation model parameters.
The features of these transducers include small foot print, high natural frequency, extreme resistance to vibration and shock, and wide temperature range. Which with size of 1.3 × 1.8 × 6.2 mm and frequency response of 1 × 10⁻⁴ s, the pressure range is 0–1.7 MPa, operating temperature range is −65 °F to +250 °F (−55 °C to +120 °C), and measurement accuracy by ±0.1%.

4. Parameter Study Results and Discussion

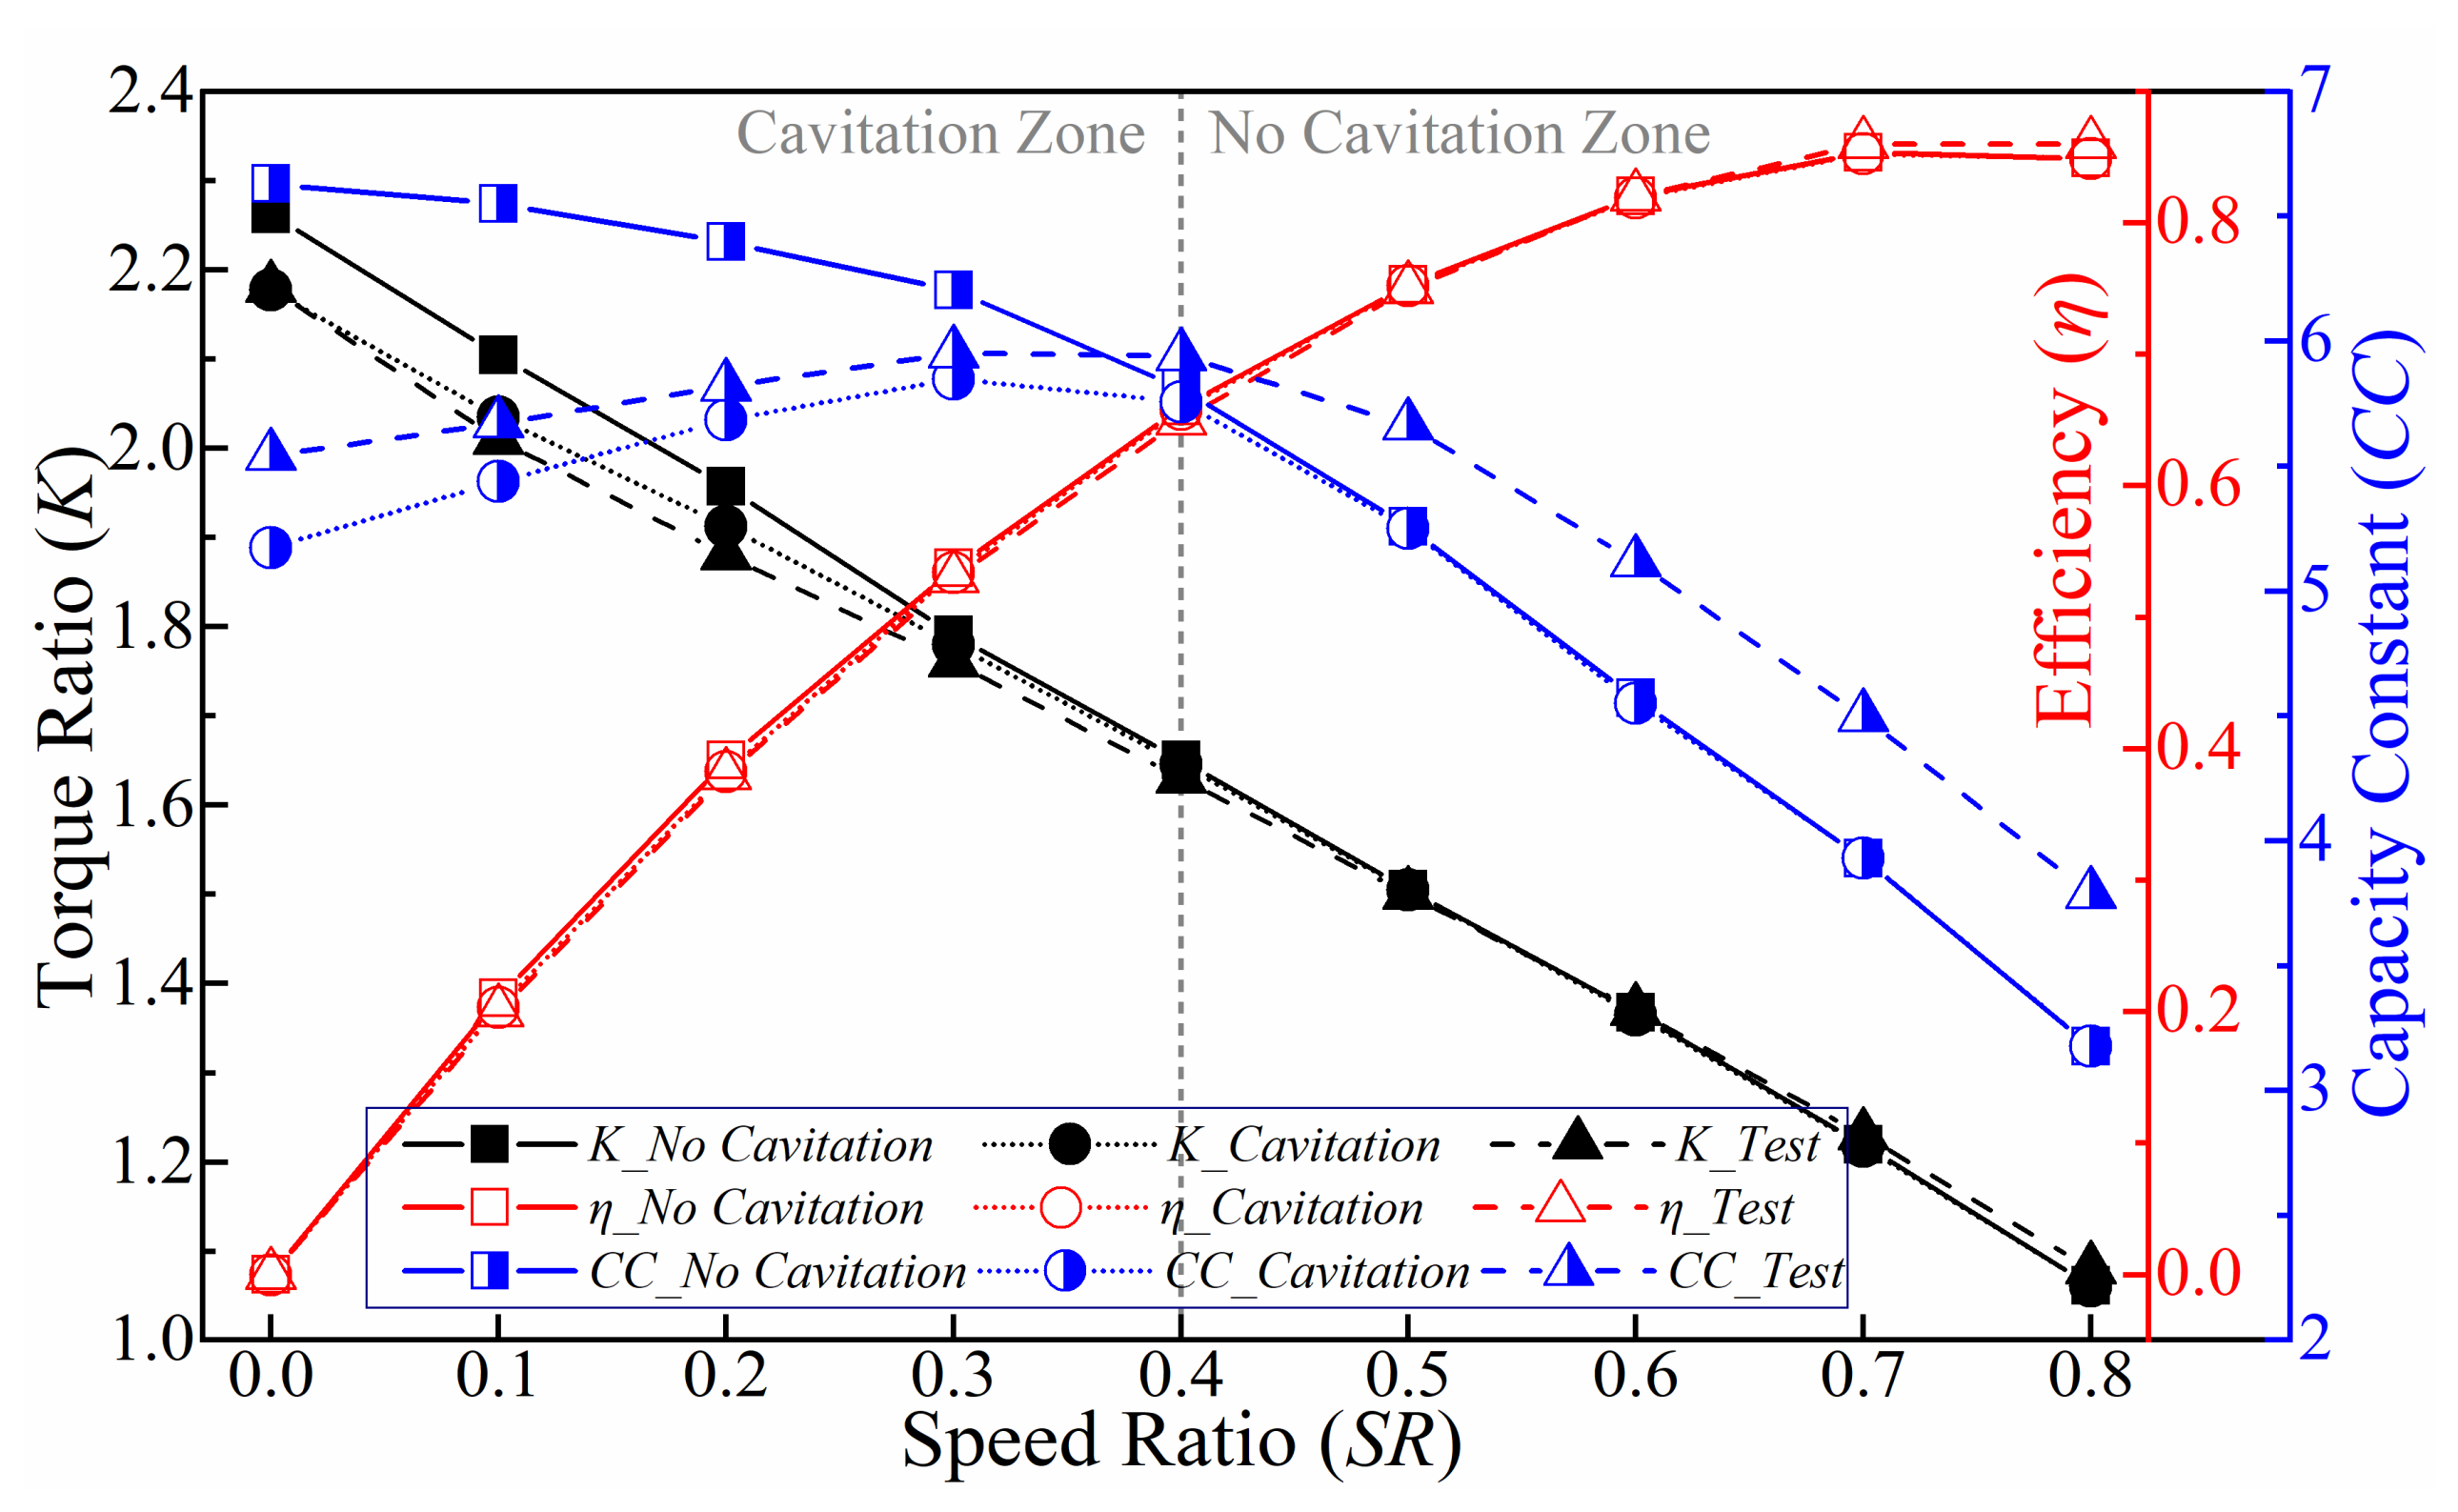
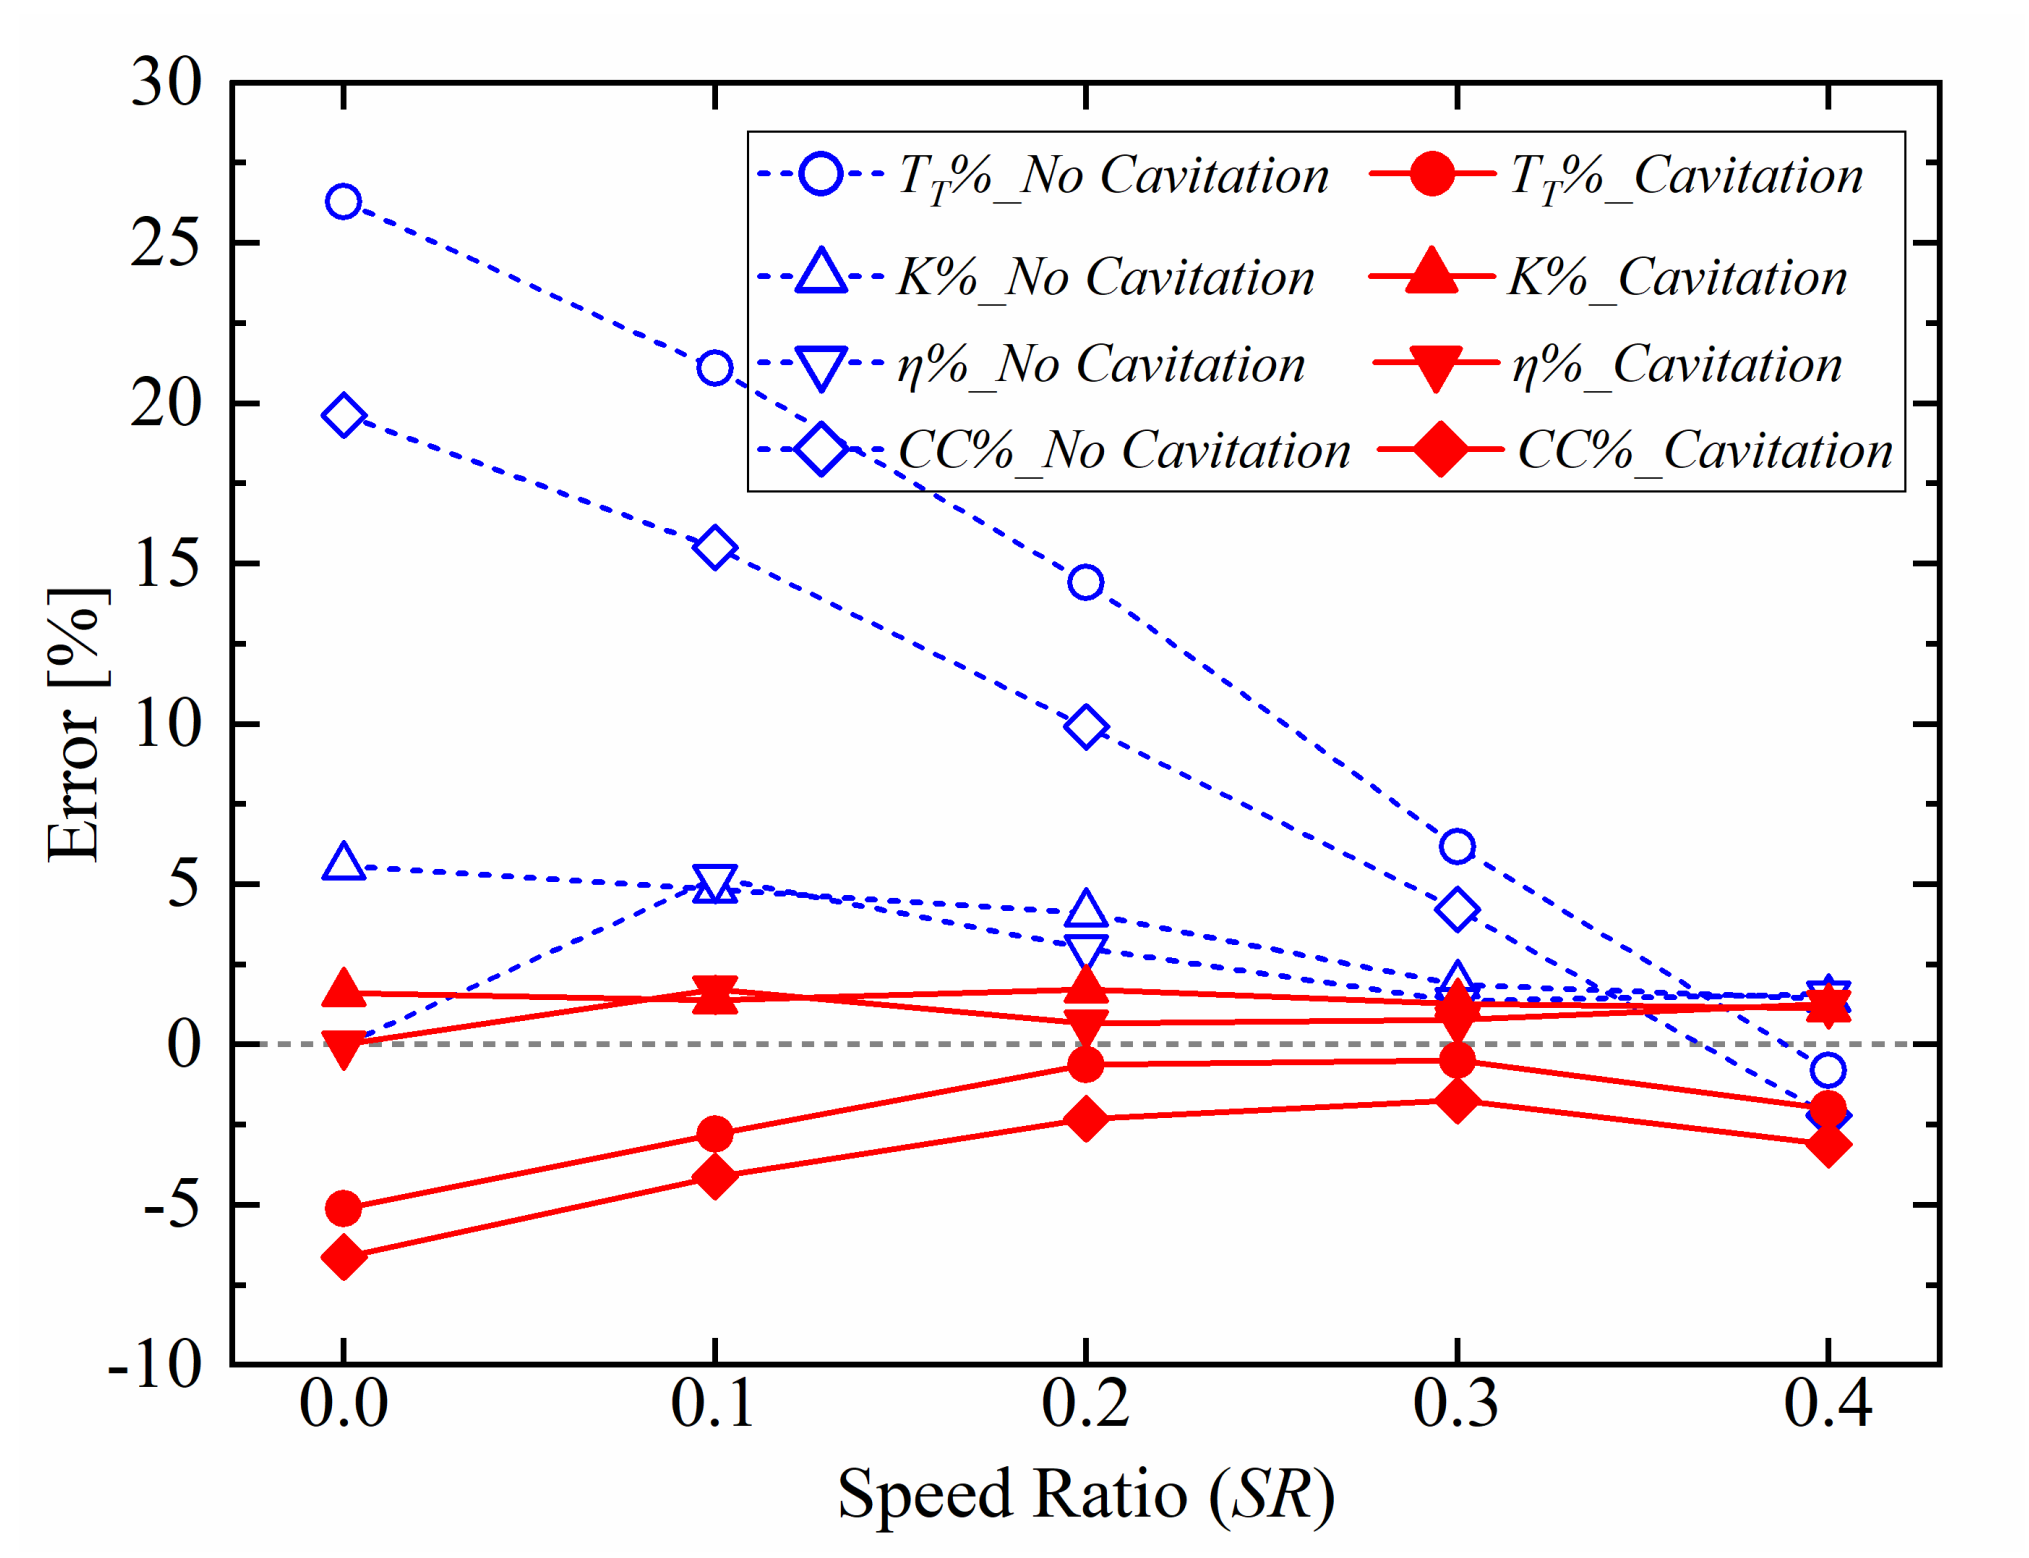
4.1. Influence of Cavitation on Hydrodynamic Performance

The torque of pump, turbine and stator can be obtained by the simulation. The performance metrics are torque ratio (K = TT/TP), efficiency (η = K*SR) and capacity constant (CC = TP*D−5*ωP−2), and the overall performance is compared with experimental data (Figure 7). The mass flow rate (MF) was also extracted from the simulation results to reveal the influence of cavitation.
The results revealed that cavitation deteriorated torque converter performance, which is the same as that of our previous studies [29]. When SR ≤ 0.4, the cavitation degree increased with the decrease of speed ratio and reached its maximum at stall operating condition (SR = 0), and the cavitation phenomenon disappeared when SR > 0.4. The influence of cavitation on the performance of hydraulic torque converter mainly lies in torque ratio, and capacity constant. As a result of cavitation, the torque ratio decreased by 3.7%, and the capacity constant decreased by 21.9% as shown in Figure 7.
The error comparison of turbine torque, torque ratio, efficiency and capacity constant between no cavitation and cavitation at various speed ratio under cavitating conditions is shown in Figure 8. It can be concluded that the error reaches the maximum under stall when cavitation was ignored, and the maximum capacity constant error was reduced from 19.6% to 6.7% by considering cavitation (Figure 8). However, a higher accuracy model could be achieved if proper empirical coefficients were adopted. Therefore, we studied the influence of empirical parameters to reveal the influence of the model parameters on the cavitation performance and flow state and optimized the cavitation model for torque converter cavitation simulation.

4.2. Analysis of Parameter Sensitivity

We analyzed the characteristics and internal flow field of torque converter under stall by establishing and solving the cavitation CFD models with different parameters. After the analysis and comparison of various parameters, the influence degree (the change rate of the torque converter performance caused by the parameter modification of the cavitation model) was calculated to express the relationship between cavitation model parameters and CFD results, as shown in Figure 9.
By comparing the additive influence degree of each parameter, we found out that the influence degree of them follows NVF > Fvap > RB > MDR > CRRF > Fcond > Pv.
It can be concluded from Figure 9. that NVF and Fvap both have a great influence on the performance of torque converter, especially on capacity constant and mass flow rate, yet they have limited influence on stall torque ratio. While RB, MDR, and CRRF have limited influence, which is also mainly reflected in capacity constant and mass flow rate. Other cavitation parameters have little effects on the performance of the torque converter, such as Fcond and Pv. It is worth noting that the capacity constant and mass flow rate of the torque converter varied pronouncedly under different cavitation parameters, while the torque ratio under stall is mildly affected by the cavitation parameter settings.

4.3. Analysis of the Influence of Significant Cavitation Parameters

The sensitivity analysis of cavitation parameters revealed the influence of the seven parameters on the performance of torque converter. In order to further study the influence of parameters on cavitation, we determined four significant cavitation model parameters—NVF, Fvap, MDR, and RB, and analyzed the effects of each parameter on hydraulic characteristics, cavitation bubbles volume shape, oil vapor volume fraction, and cavitation evolution process of torque converter in depth. We emphasized the investigation of flow behavior and hydrodynamic performance at stall operating condition with the most serious cavitation phenomenon.
The oil vapor volume fraction distribution in stator domain as shown in Figure 10, we found that cavitation mainly occurs at the leading edge of stator suction surface and the trailing edge of pressure surface. However, the cavitation near the blade tail is very small compared with that near the head, which is not convenient for observation and comparative analysis. Therefore, we focus on the cavitation of stator blade head.

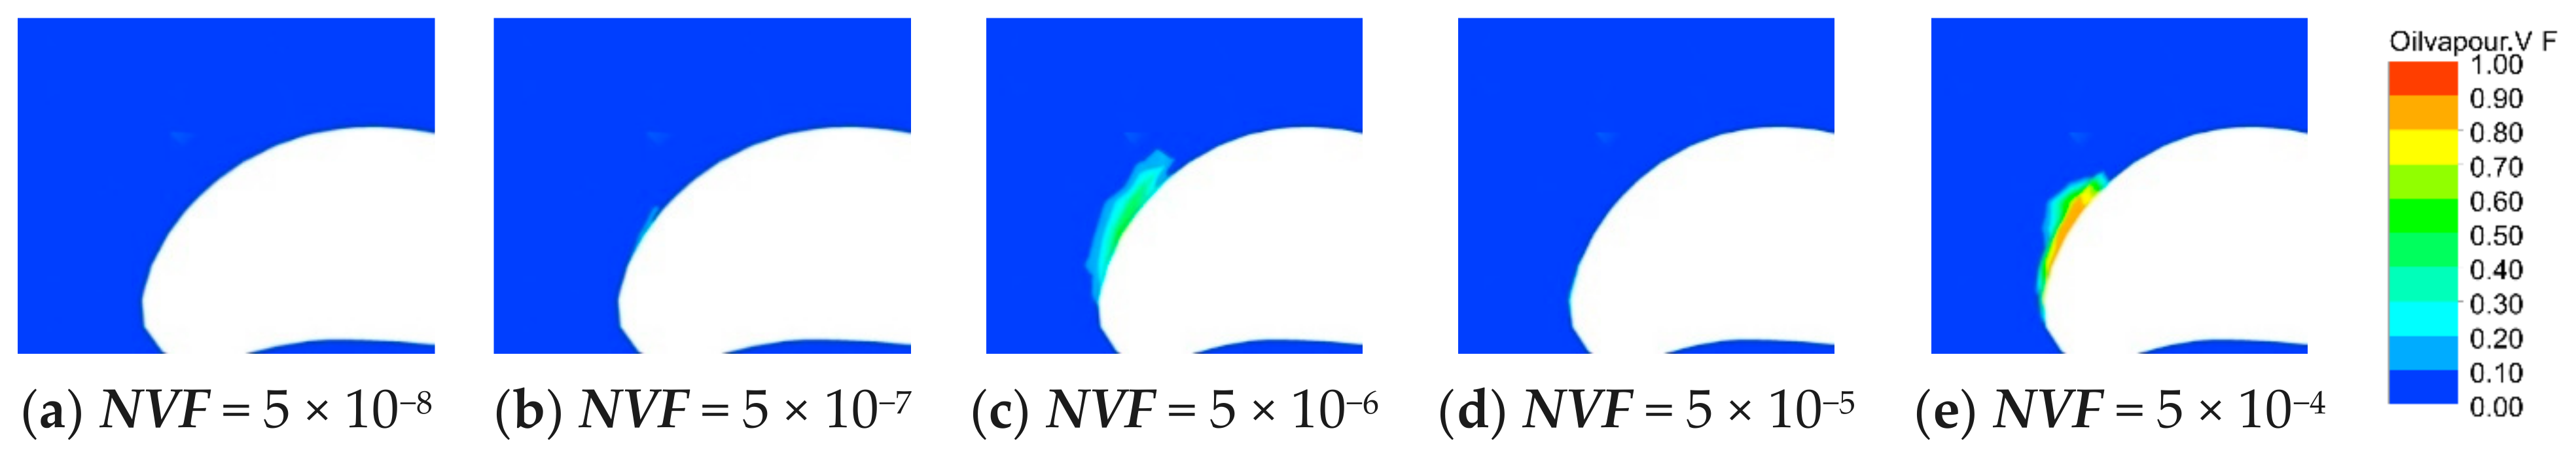
4.3.1. Nuclei Volume Fraction—NVF

The performance of torque converter under various NVF is shown in Figure 11. It is clear that nuclei volume fraction has a great influence on the performance of the torque converter. The capacity constant, torque ratio and mass flow rate decrease with an increasing NVF when NVF ≤ 5 × 10⁻⁵. NVF exhibits limited influence on the overall performance when NVF exceeds 5 × 10⁻⁵.
The absolute pressure distribution diagram of the middle streamline on stator blade surface (Figure 12) shows that there is a big differential pressure between the suction surface and pressure surface of stator blade, which decreases gradually from head to tail, the differential pressure makes torque converter play a role in transmitting torque. In addition, the pressure decreases drastically on the pressure surface of stator blade with an increasing NVF, and the pressure change near the head is more obvious, while it decreases slightly on the suction surface, which leads to the reduction of mass flow rate, capacity constant and torque ratio. However, there are also some errors caused by calculation and streamline selection (such as the high value of NVF = 5 × 10⁻⁴).
Figure 13 and Figure 14 are the oil vapor volume fraction and the bulk interphase mass transfer rate on the middle streamline of stator blade under various NVF. The results reveal that with the increase of NVF, the oil vapor volume fraction and the mass transfer rate of the head and tail on blade surface increase gradually, but they are always 0 in the middle of blade, indicating that cavitation mainly occurs at the leading edge of the stator suction surface, and the increase of NVF will aggravate the cavitation degree.
Figure 15 and Figure 16 show the 10% vapor volume fraction distribution in the stator domain and the oil vapor volume fraction distribution on the stator blades under various NVF. We ignored the trend error caused by blade selection and found, the volume of oil vapor bubbles at the head of stator blade gradually increases with an increasing NVF, and covers the entire head of the stator blade when NVF is greater than 5 × 10⁻⁶. The oil vapor volume fraction on the surface of blade exhibits an increasing trend, the area with high oil vapor volume fraction gradually expands as the NVF increases.
Figure 17 reveals that the volume of bubbles, the length of bubbles and the high oil vapor content area increase with an increasing NVF. As NVF represents the volume fraction of the nucleation sites, higher NVF indicates more oil vapor nuclei in the fluid, which consequently leads to an increasing volume of bubbles and deteriorated performance of torque converter. In conclusion, cavitation becomes more serious with the increase of NVF. The reason is that higher NVF indicates more nuclei sites, which results in heavier cavitation.

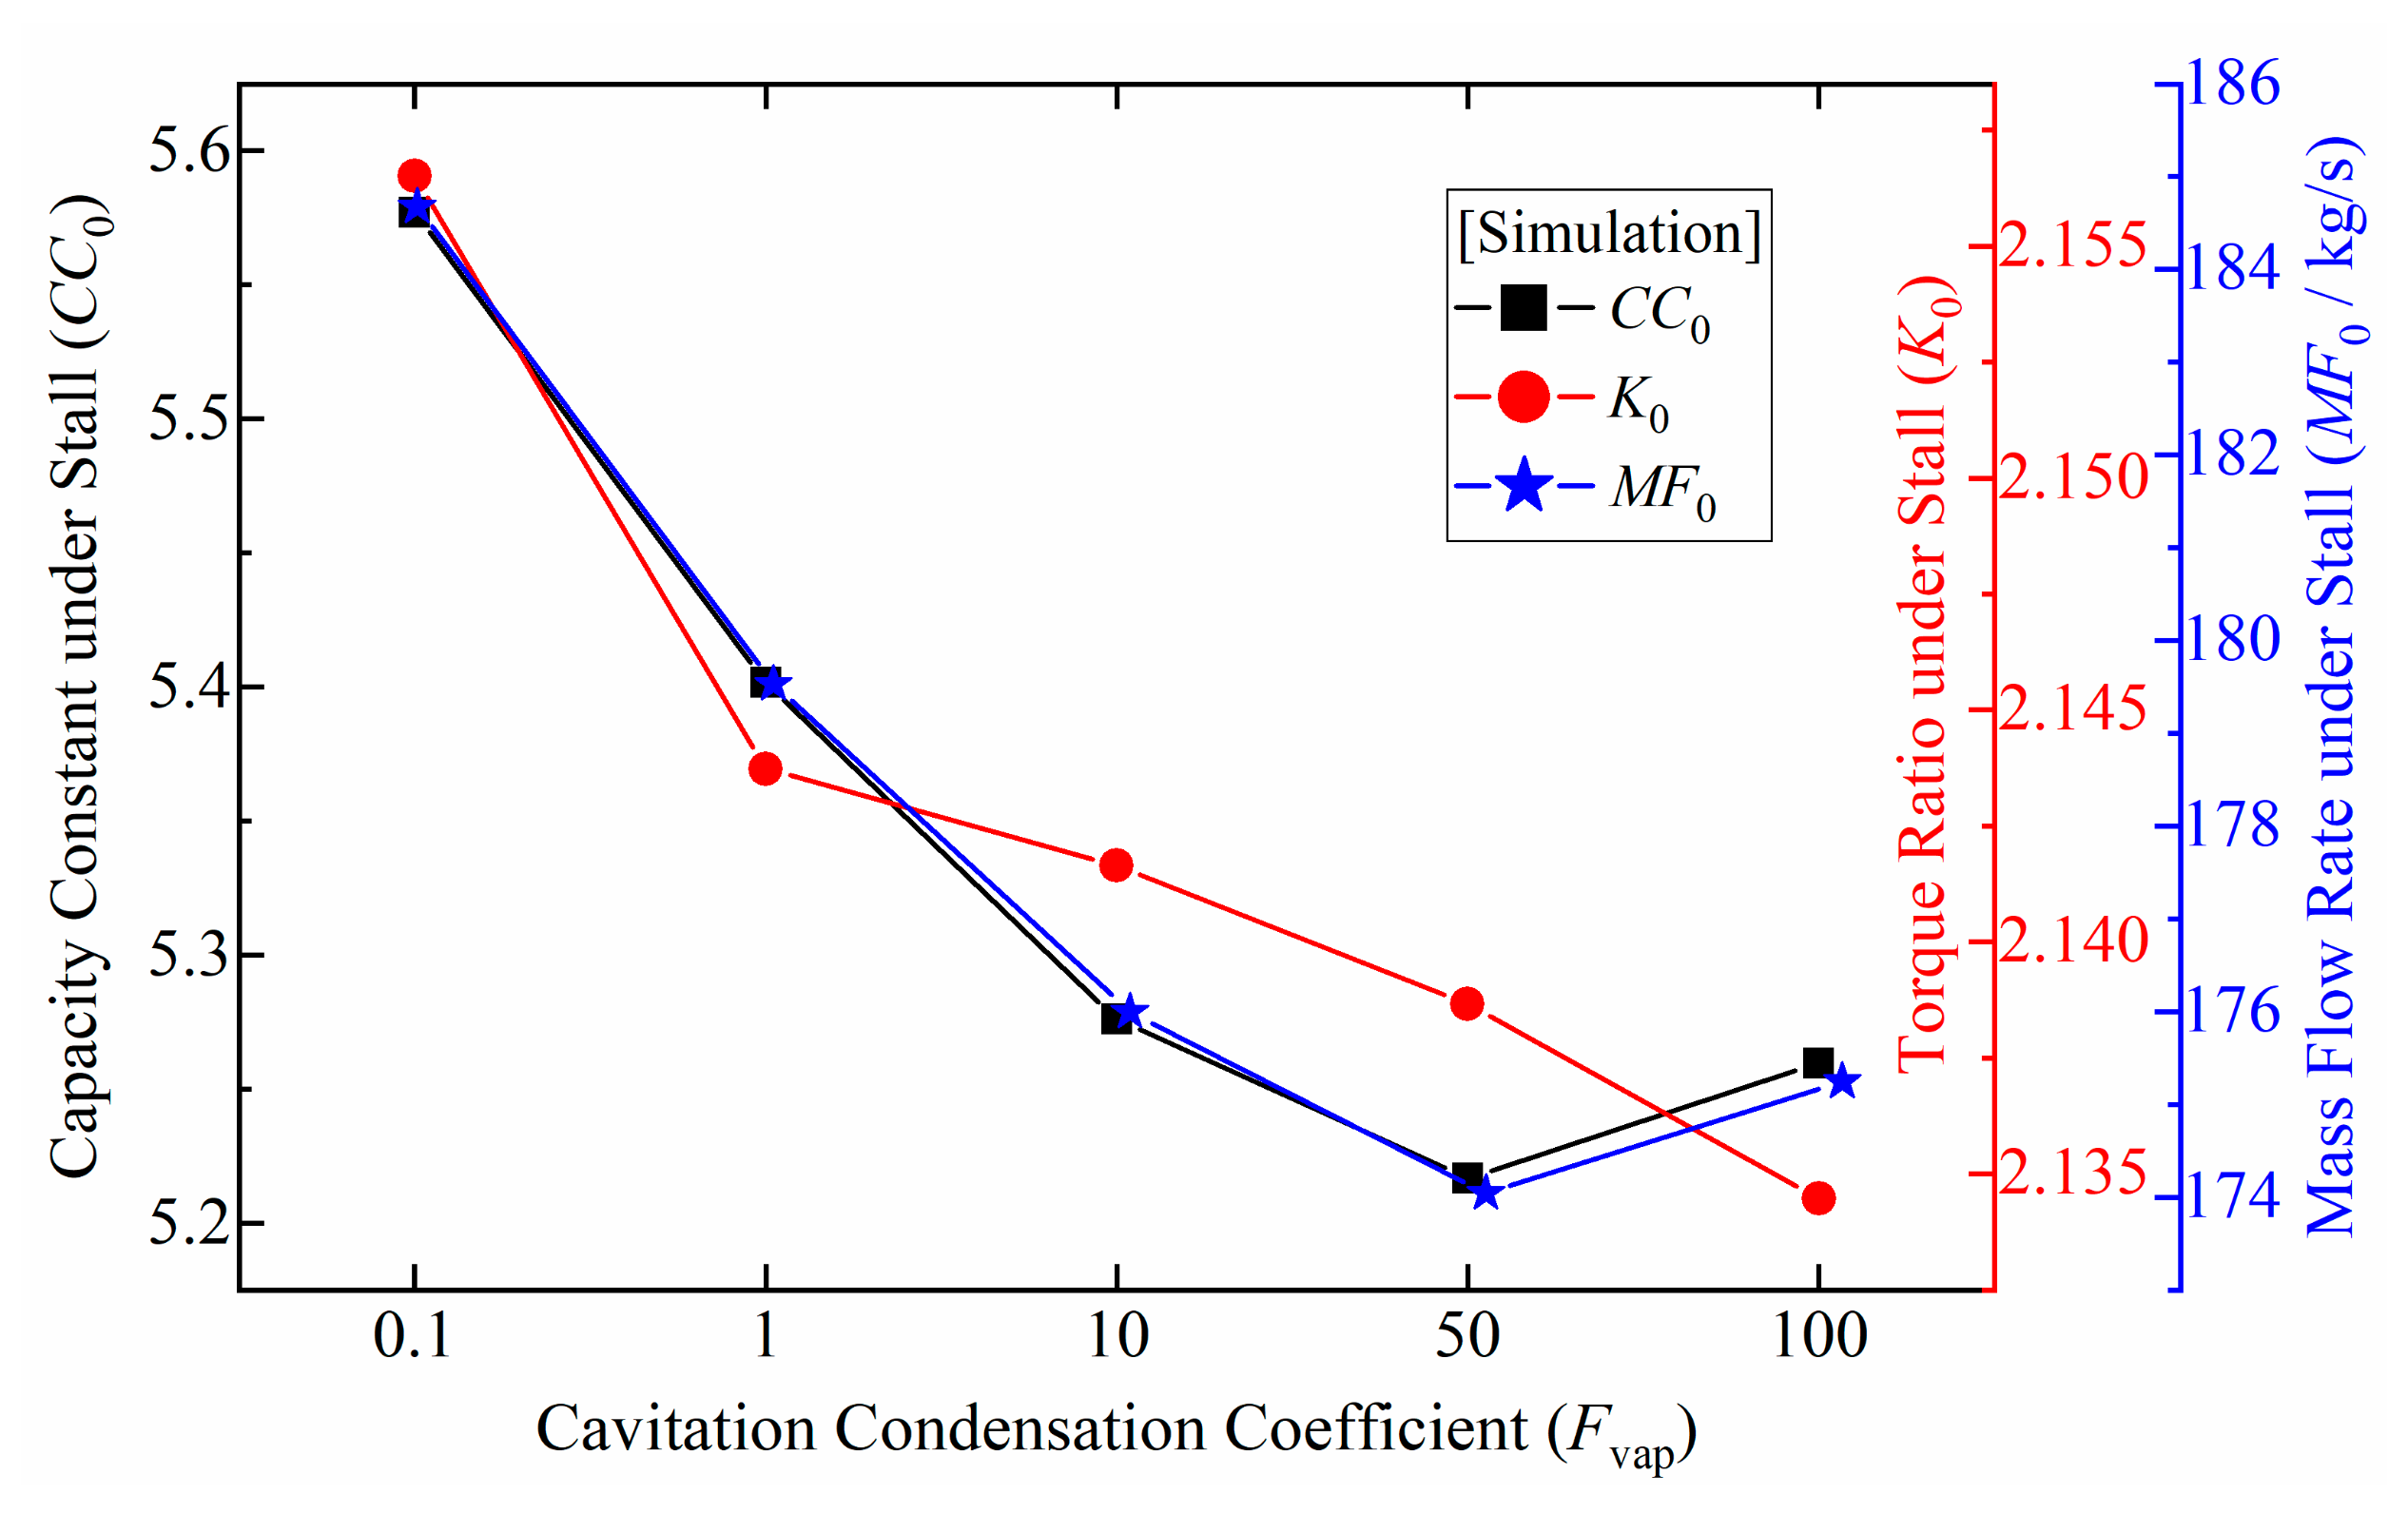
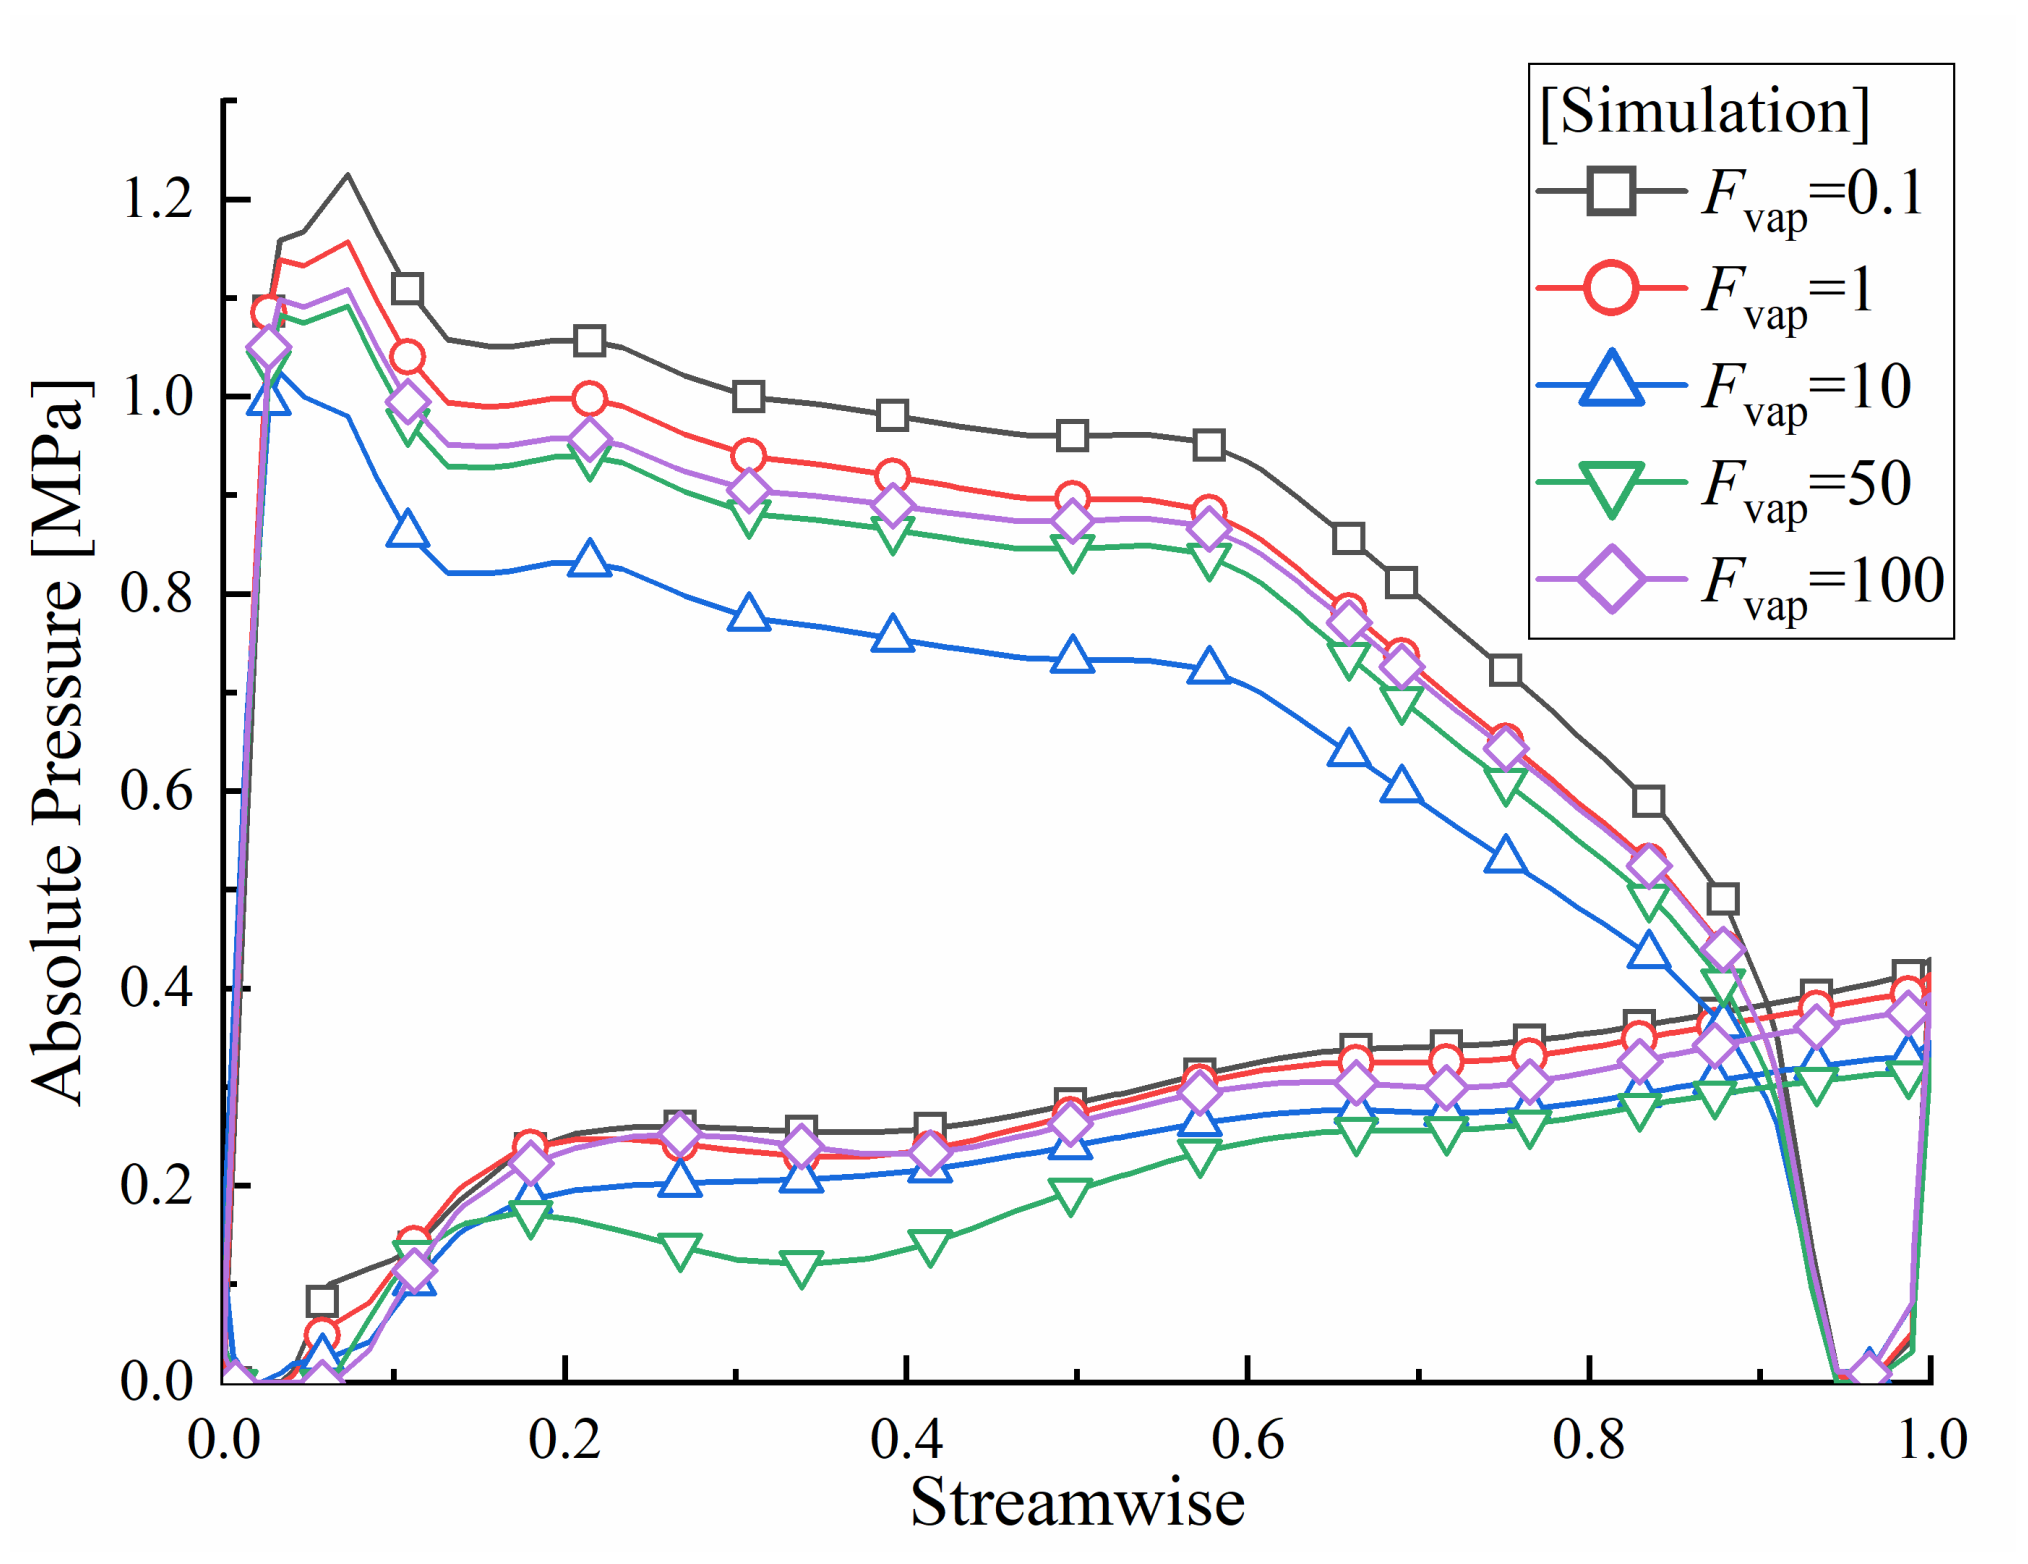
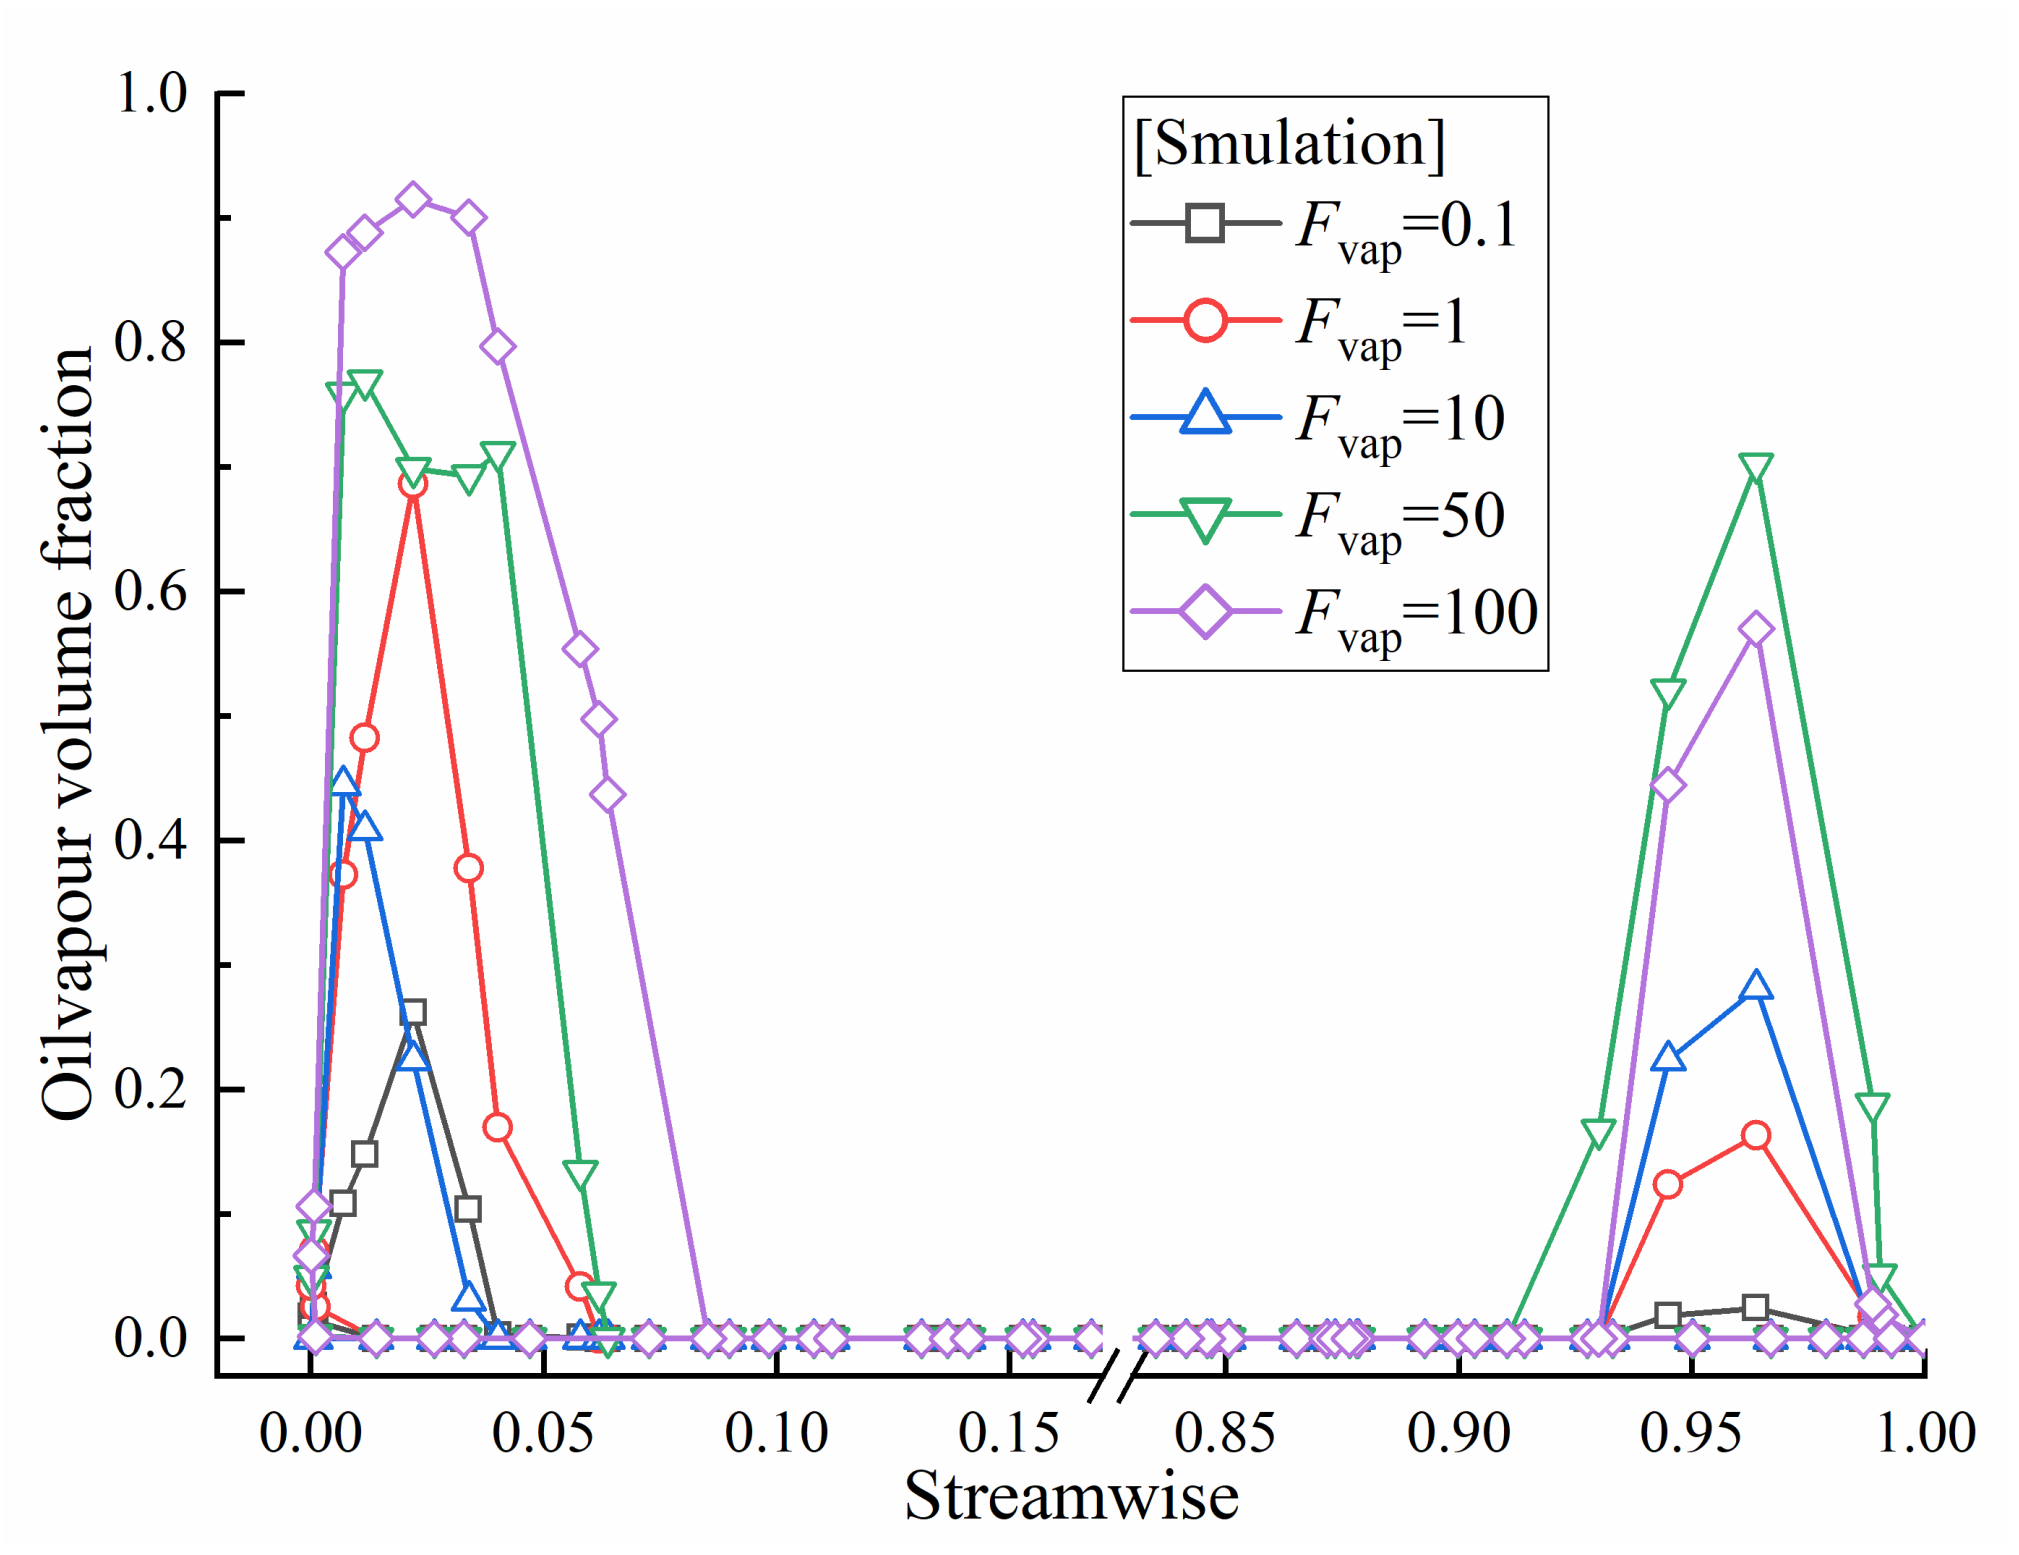
4.3.2. Cavitation Vaporization Coefficient—Fvap

The performance of torque converter under various Fvap is shown in Figure 18. Cavitation vaporization coefficient also has a significant influence on the performance. The increase of Fvap will decrease capacity constant, torque ratio and mass flow rate of the torque converter.
The absolute pressure distribution diagram of the middle streamline on stator blade surface (Figure 19) shows that with the increase of Fvap, the differential pressure between the two sides of stator blade decreases gradually, which leads to the reduction of mass flow rate, capacity constant, and torque ratio of torque converter.
Figure 20 and Figure 21 depict the oil vapor volume fraction and the bulk interphase mass transfer rate on the middle streamline of stator blade under various Fvap. We found that the oil vapor volume fraction and the mass transfer rate of the head and tail on blade surface increase gradually with an increasing Fvap, indicating that the increase of Fvap will aggravate the cavitation.
The 10% vapor volume fraction distribution in stator domain and the oil vapor volume fraction distribution on stator blades under various Fvap are shown in Figure 22 and Figure 23. The influence of Fvap is similar to that of NVF. Increasing Fvap leads to more and higher density oil vapor volume fraction.
The volume of bubbles around blade head increases with the increase of Fvap. To be more specific, the area with high gas content grows and expands, and the length of the oilvapor bubble also increases as Fvap increases (Figure 24). The reason is straight forward—the increase of the vaporization coefficient indicates quicker vaporization process, consequently leading to more bubbles generation and lower torque converter capacity and mass flow rate. In conclusion, the increase of Fvap will promote the cavitation process.

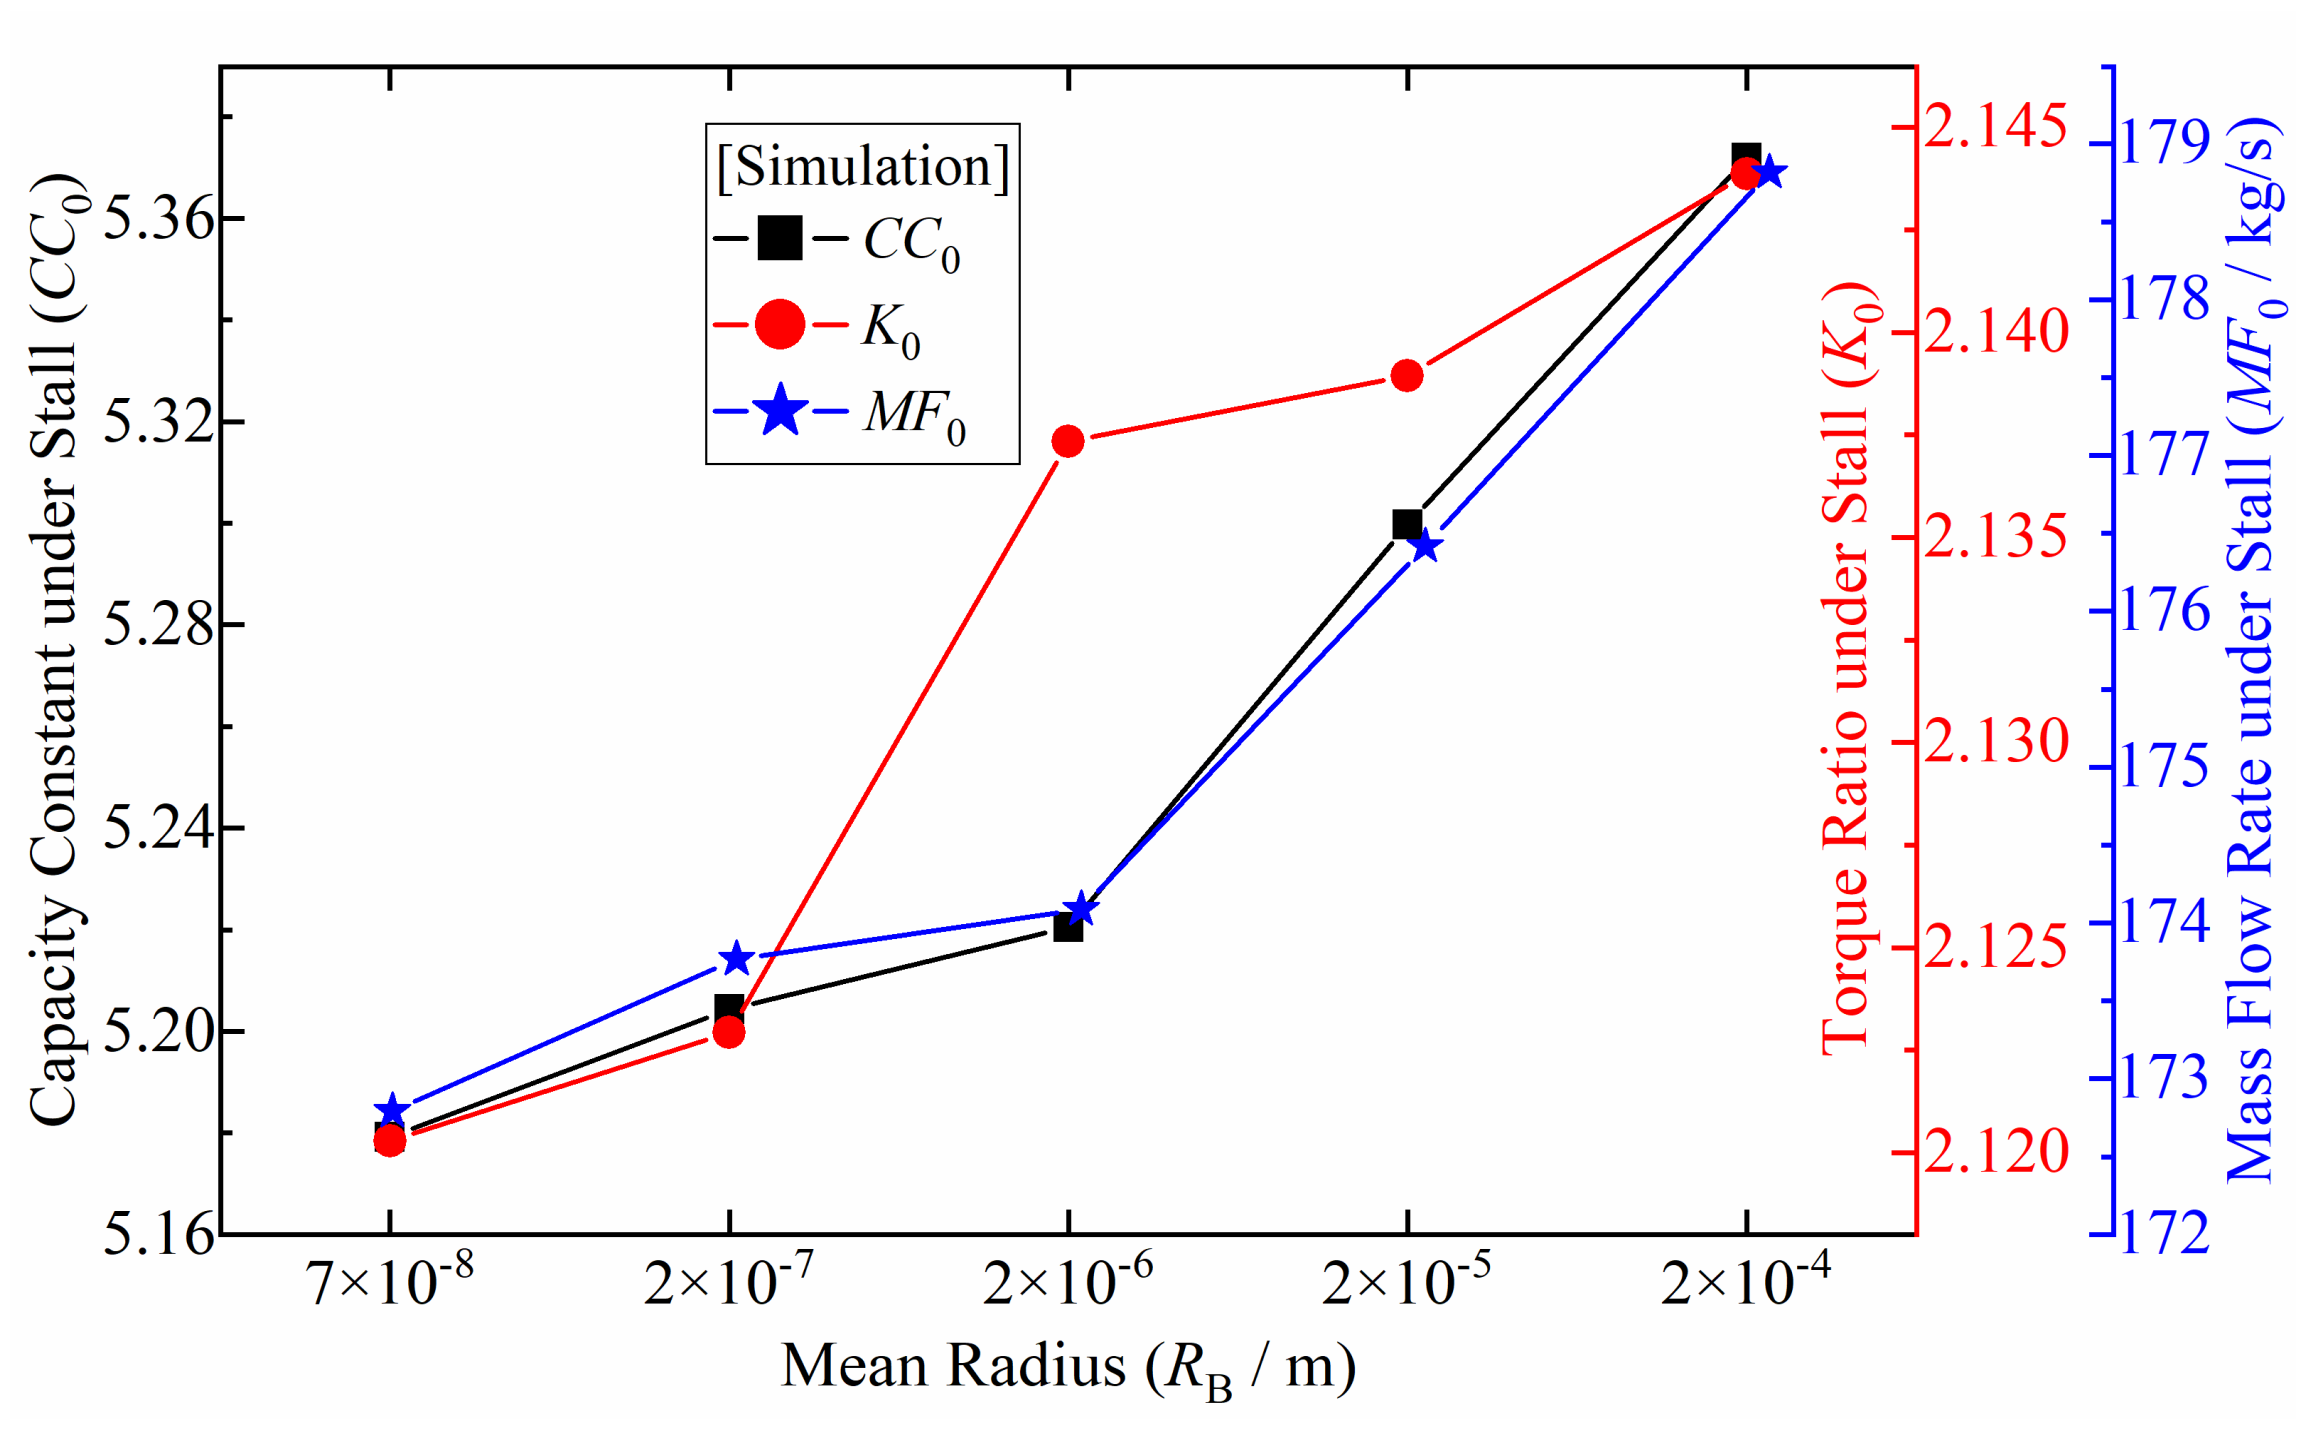
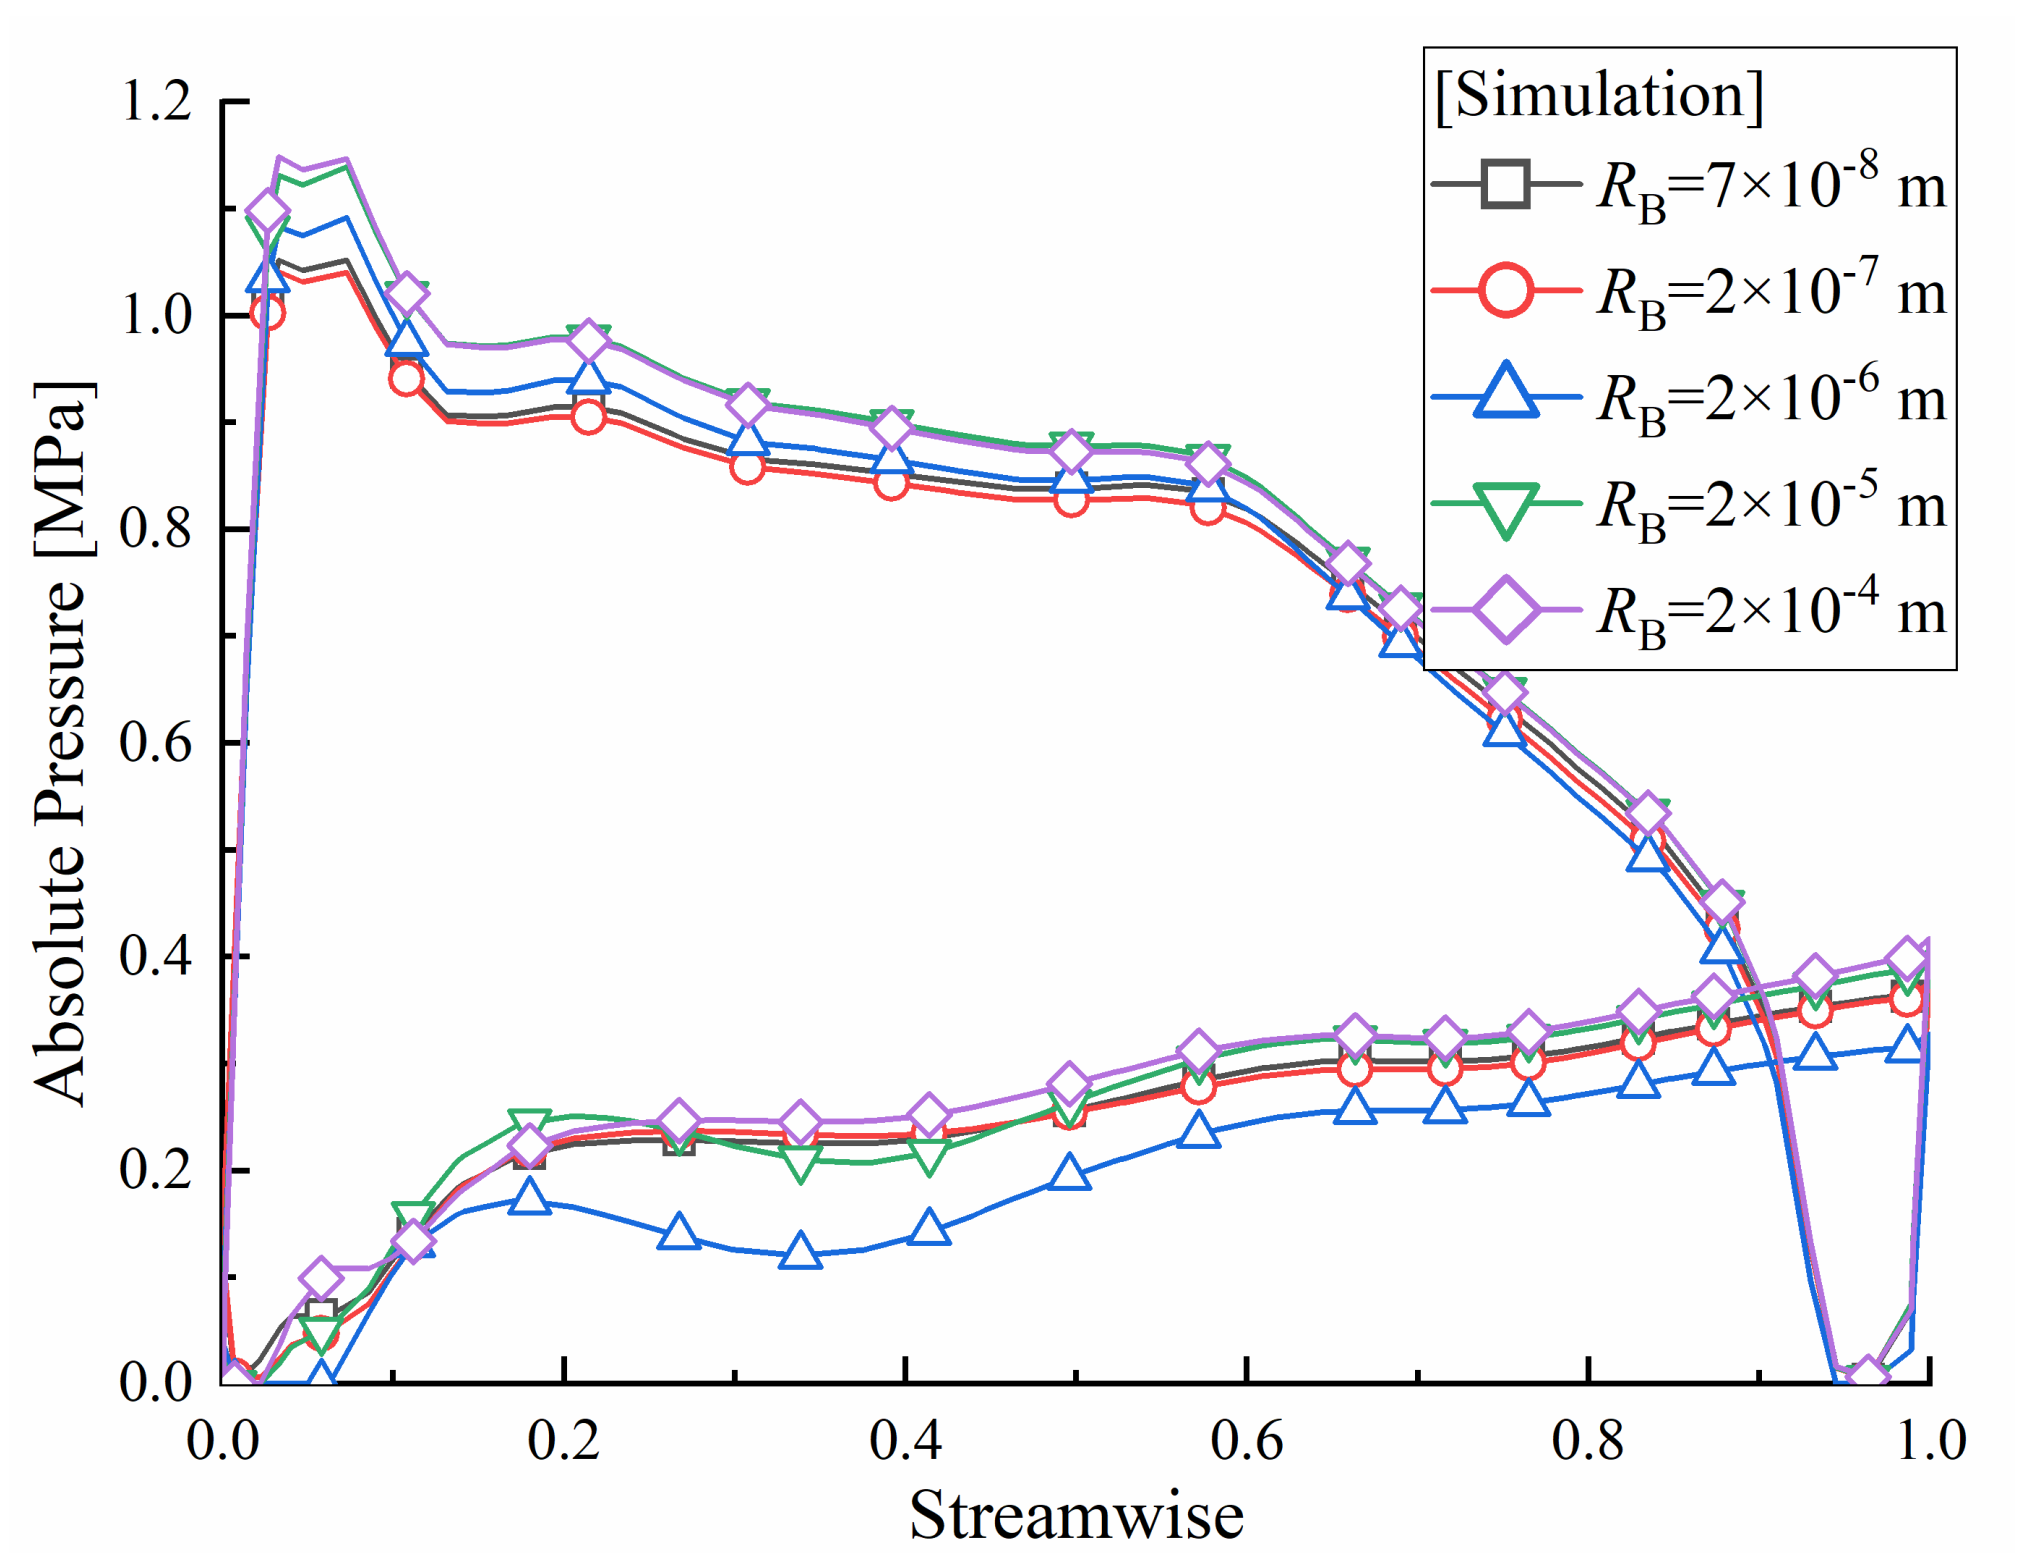
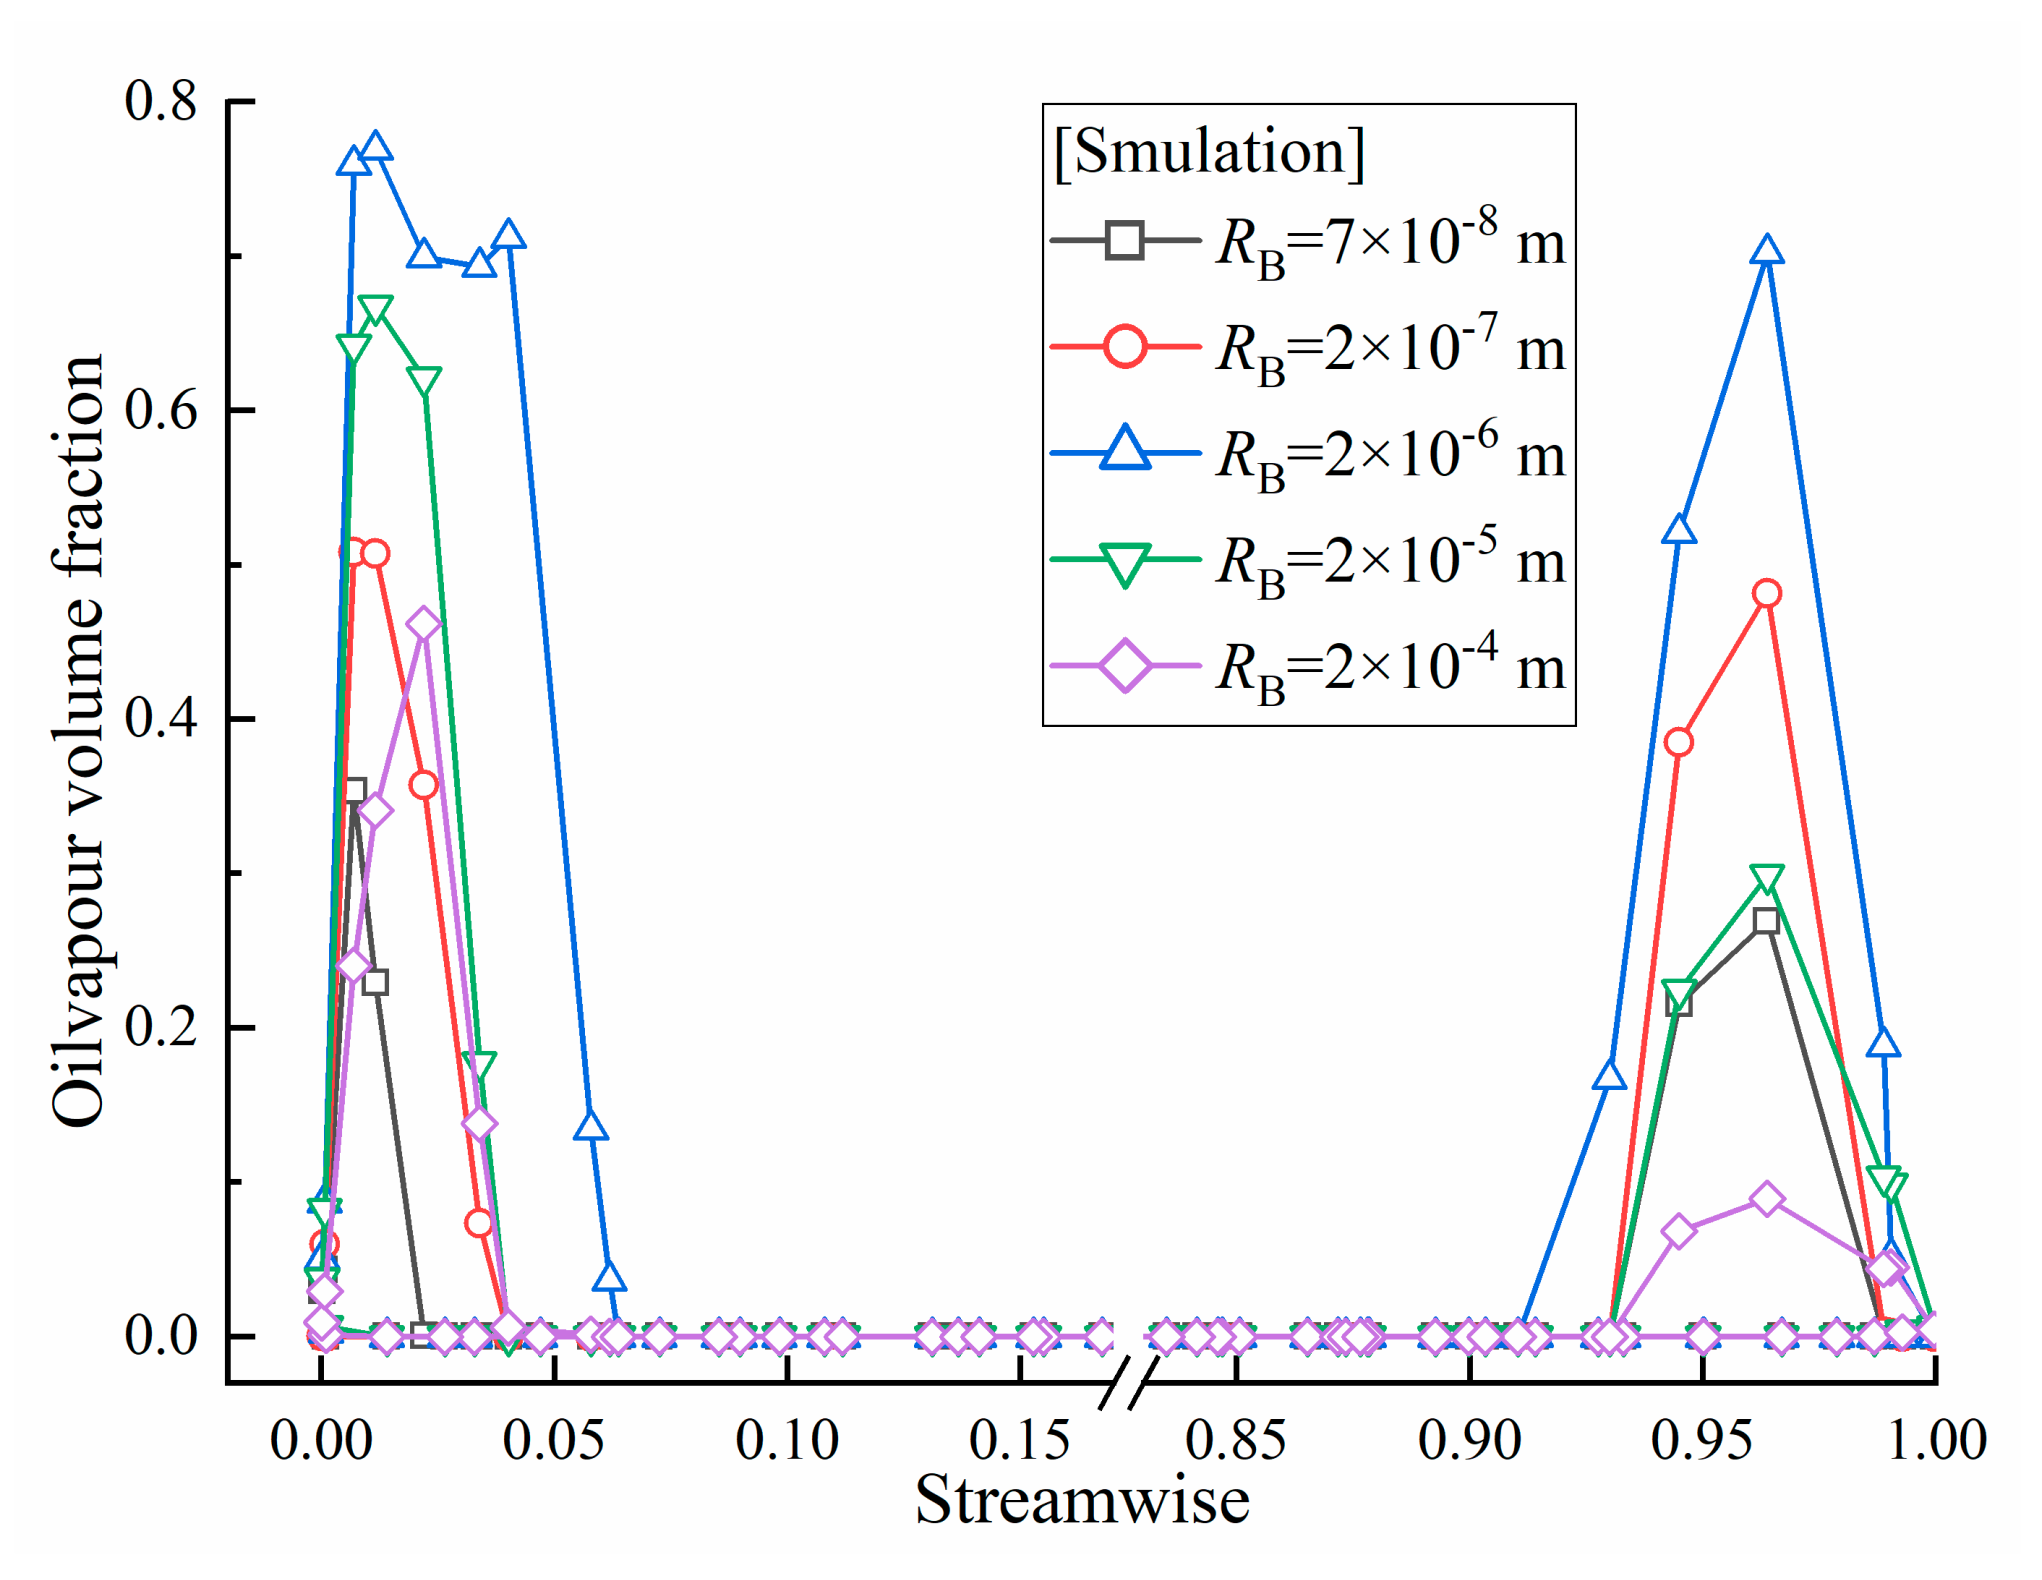
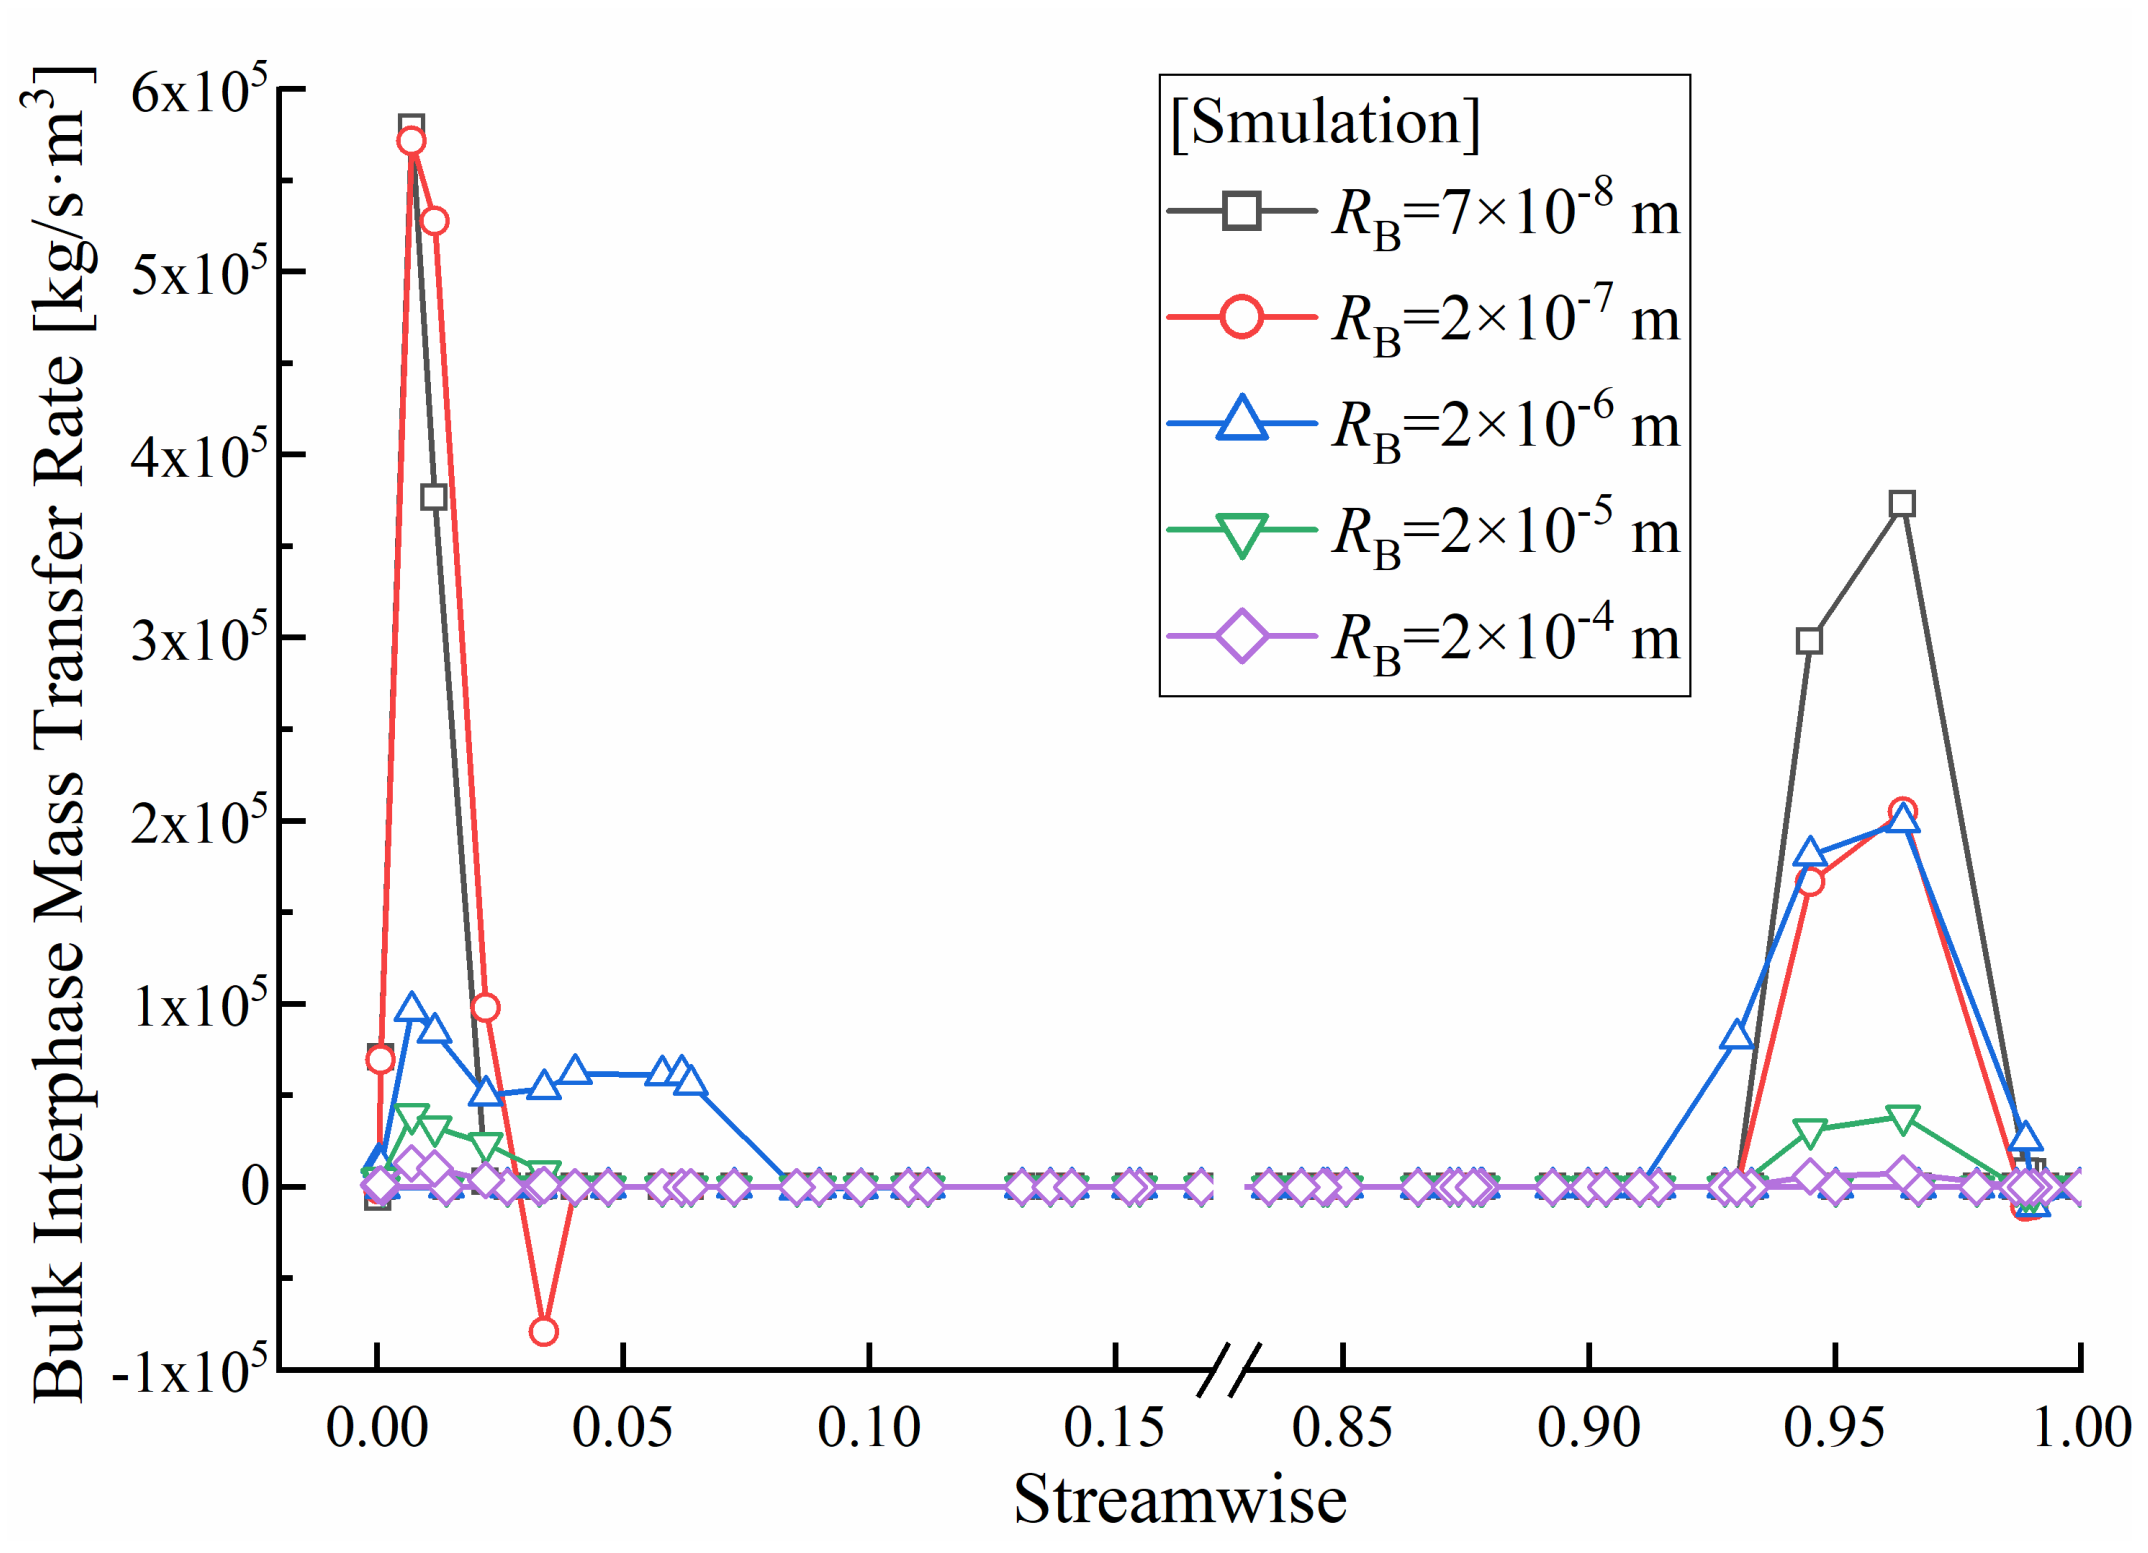
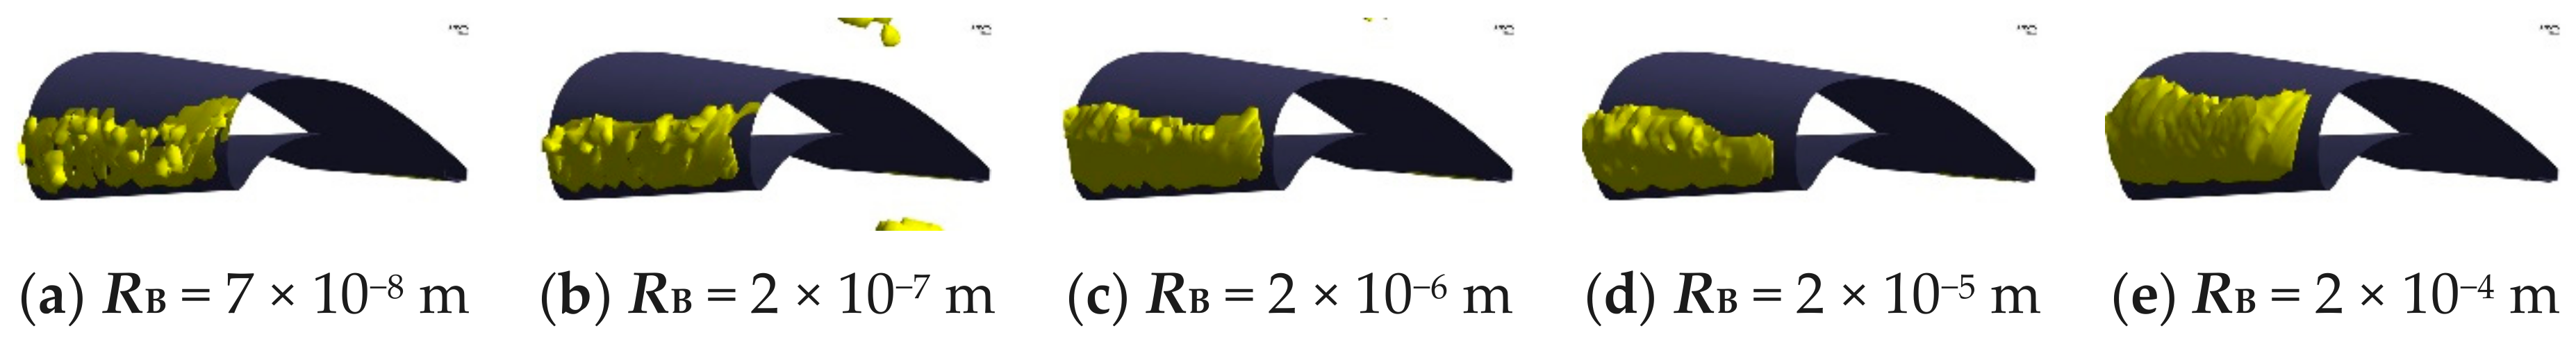
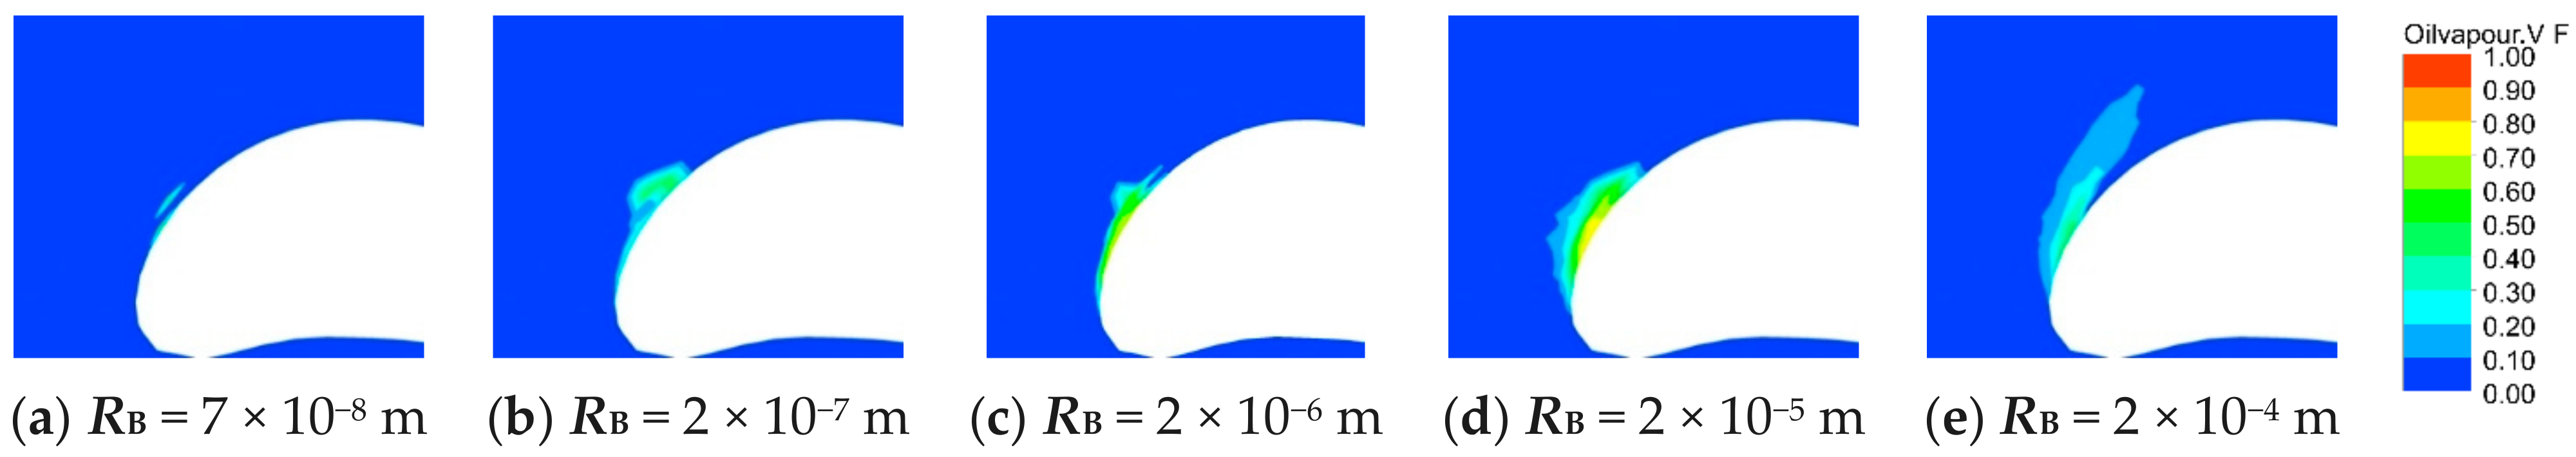
4.3.3. Mean Radius—RB

The performance of torque converter under various RB is shown in Figure 25. It is clear that mean radius has a significant influence on hydrodynamic performance. The mass flow rate, capacity constant and torque ratio of the torque converter exhibit a positive correlation with RB.
The absolute pressure distribution diagram of the middle streamline on stator blade surface (Figure 26) shows that with the increase of RB, the pressure has gradually increased on the pressure surface of the blade; however, the suction surface pressure decrease first and then increase. When RB =2 × 10⁻⁶ m, the suction surface pressure reaches the minimum value. As a result, the differential pressure between the two blade sides increases with the increase of RB, which increases the mass flow rate, the capacity constant and torque ratio of torque converter.
Figure 27 and Figure 28 illustrate the oilvapor volume fraction and the bulk interphase mass transfer rate on the middle streamline of stator blade under various RB. It is clear that the oilvapor volume fraction of the head and tail on blade first increases and then decreases with the increase of RB. It reaches the highest value when RB = 2 × 10⁻⁶ m. The mass transfer rate of the head and tail on blade surface decreases with an increasing RB. However, the oilvapor volume fraction and the bulk interphase mass transfer rate on the middle of blade surface are always 0 under various RB, it shows that cavitation mainly occurs at the leading edge of stator suction surface, and the change of RB will affect the cavitation degree in torque converter.
Figure 29 shows the 10% vapor volume fraction distribution in stator domain under various RB, we can conclude that the volume of oilvapor bubbles at the head of stator blade grows slightly with the increase of RB, and finally covers the entire head of stator blade.
The oilvapor volume fraction distribution in stator domain under various RB is shown in Figure 30. With the increase of RB, the length and the volume of bubbles increases. However, when RB =2 × 10⁻⁴ m, the oilvapor volume fraction decreases in spite of an increasing bubble length and volume. The reason is that it is easier for bubbles to grow when the radius of the gas core is bigger, which increases the bubble volume.

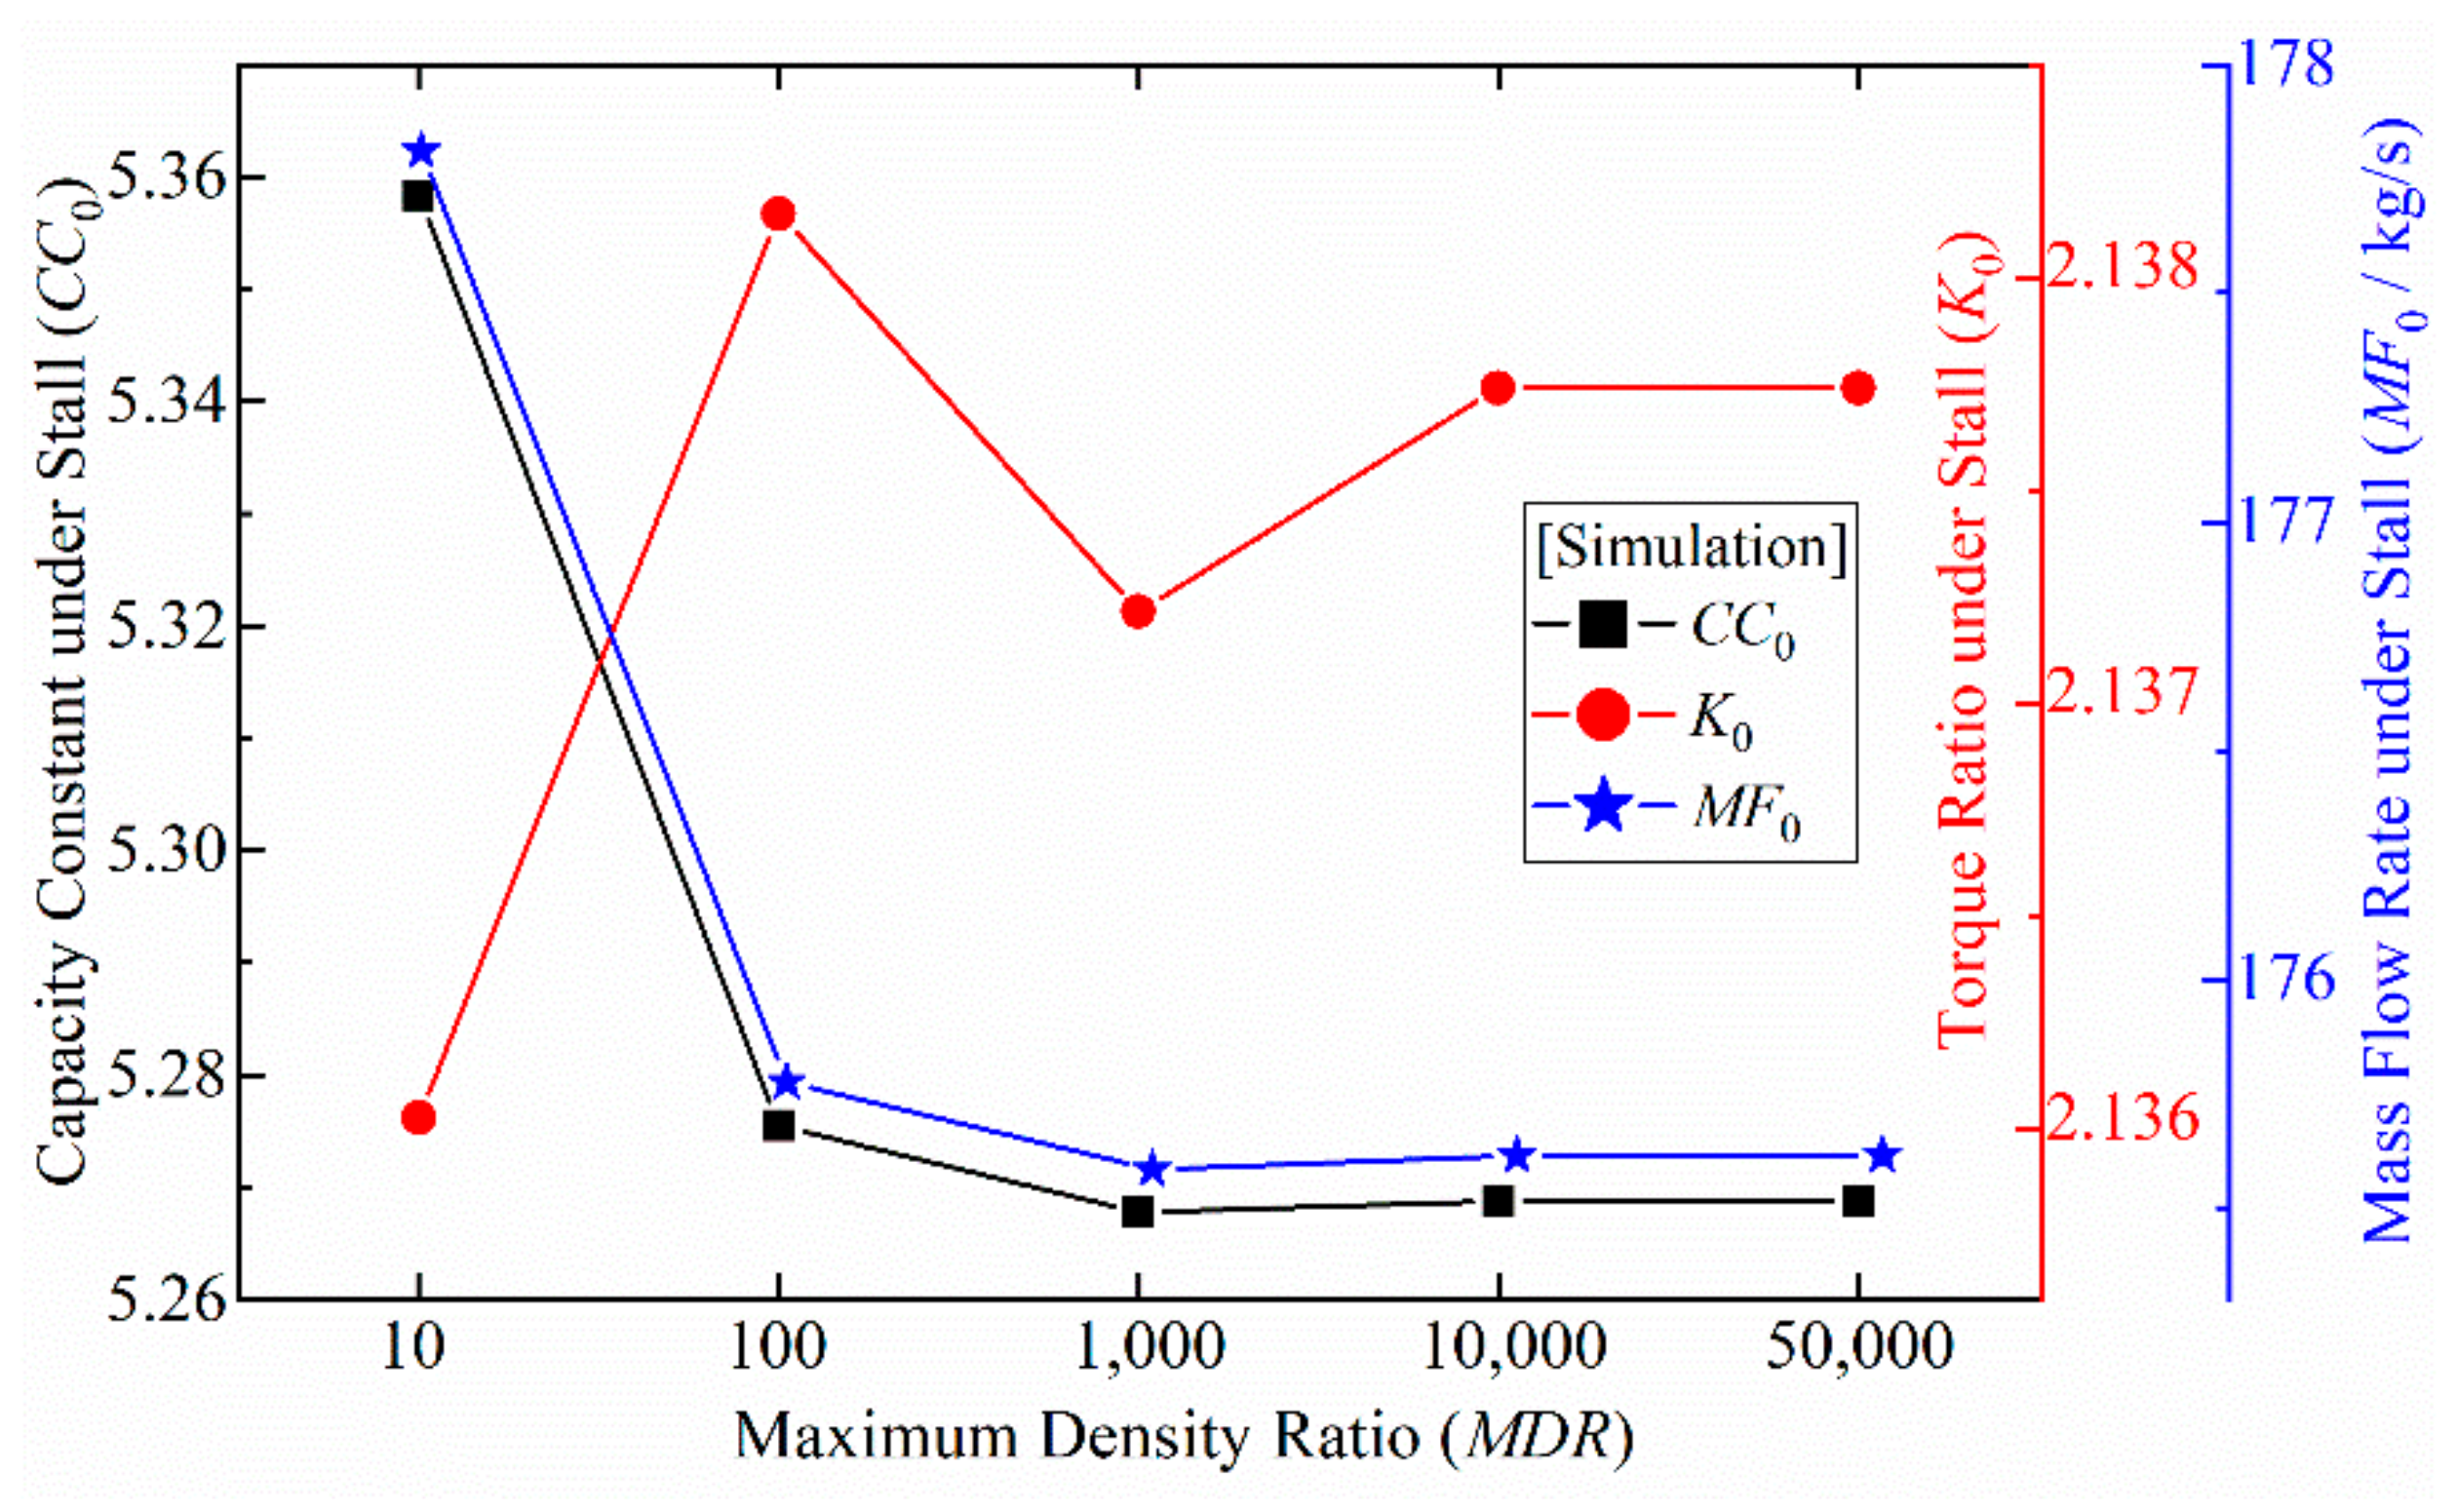
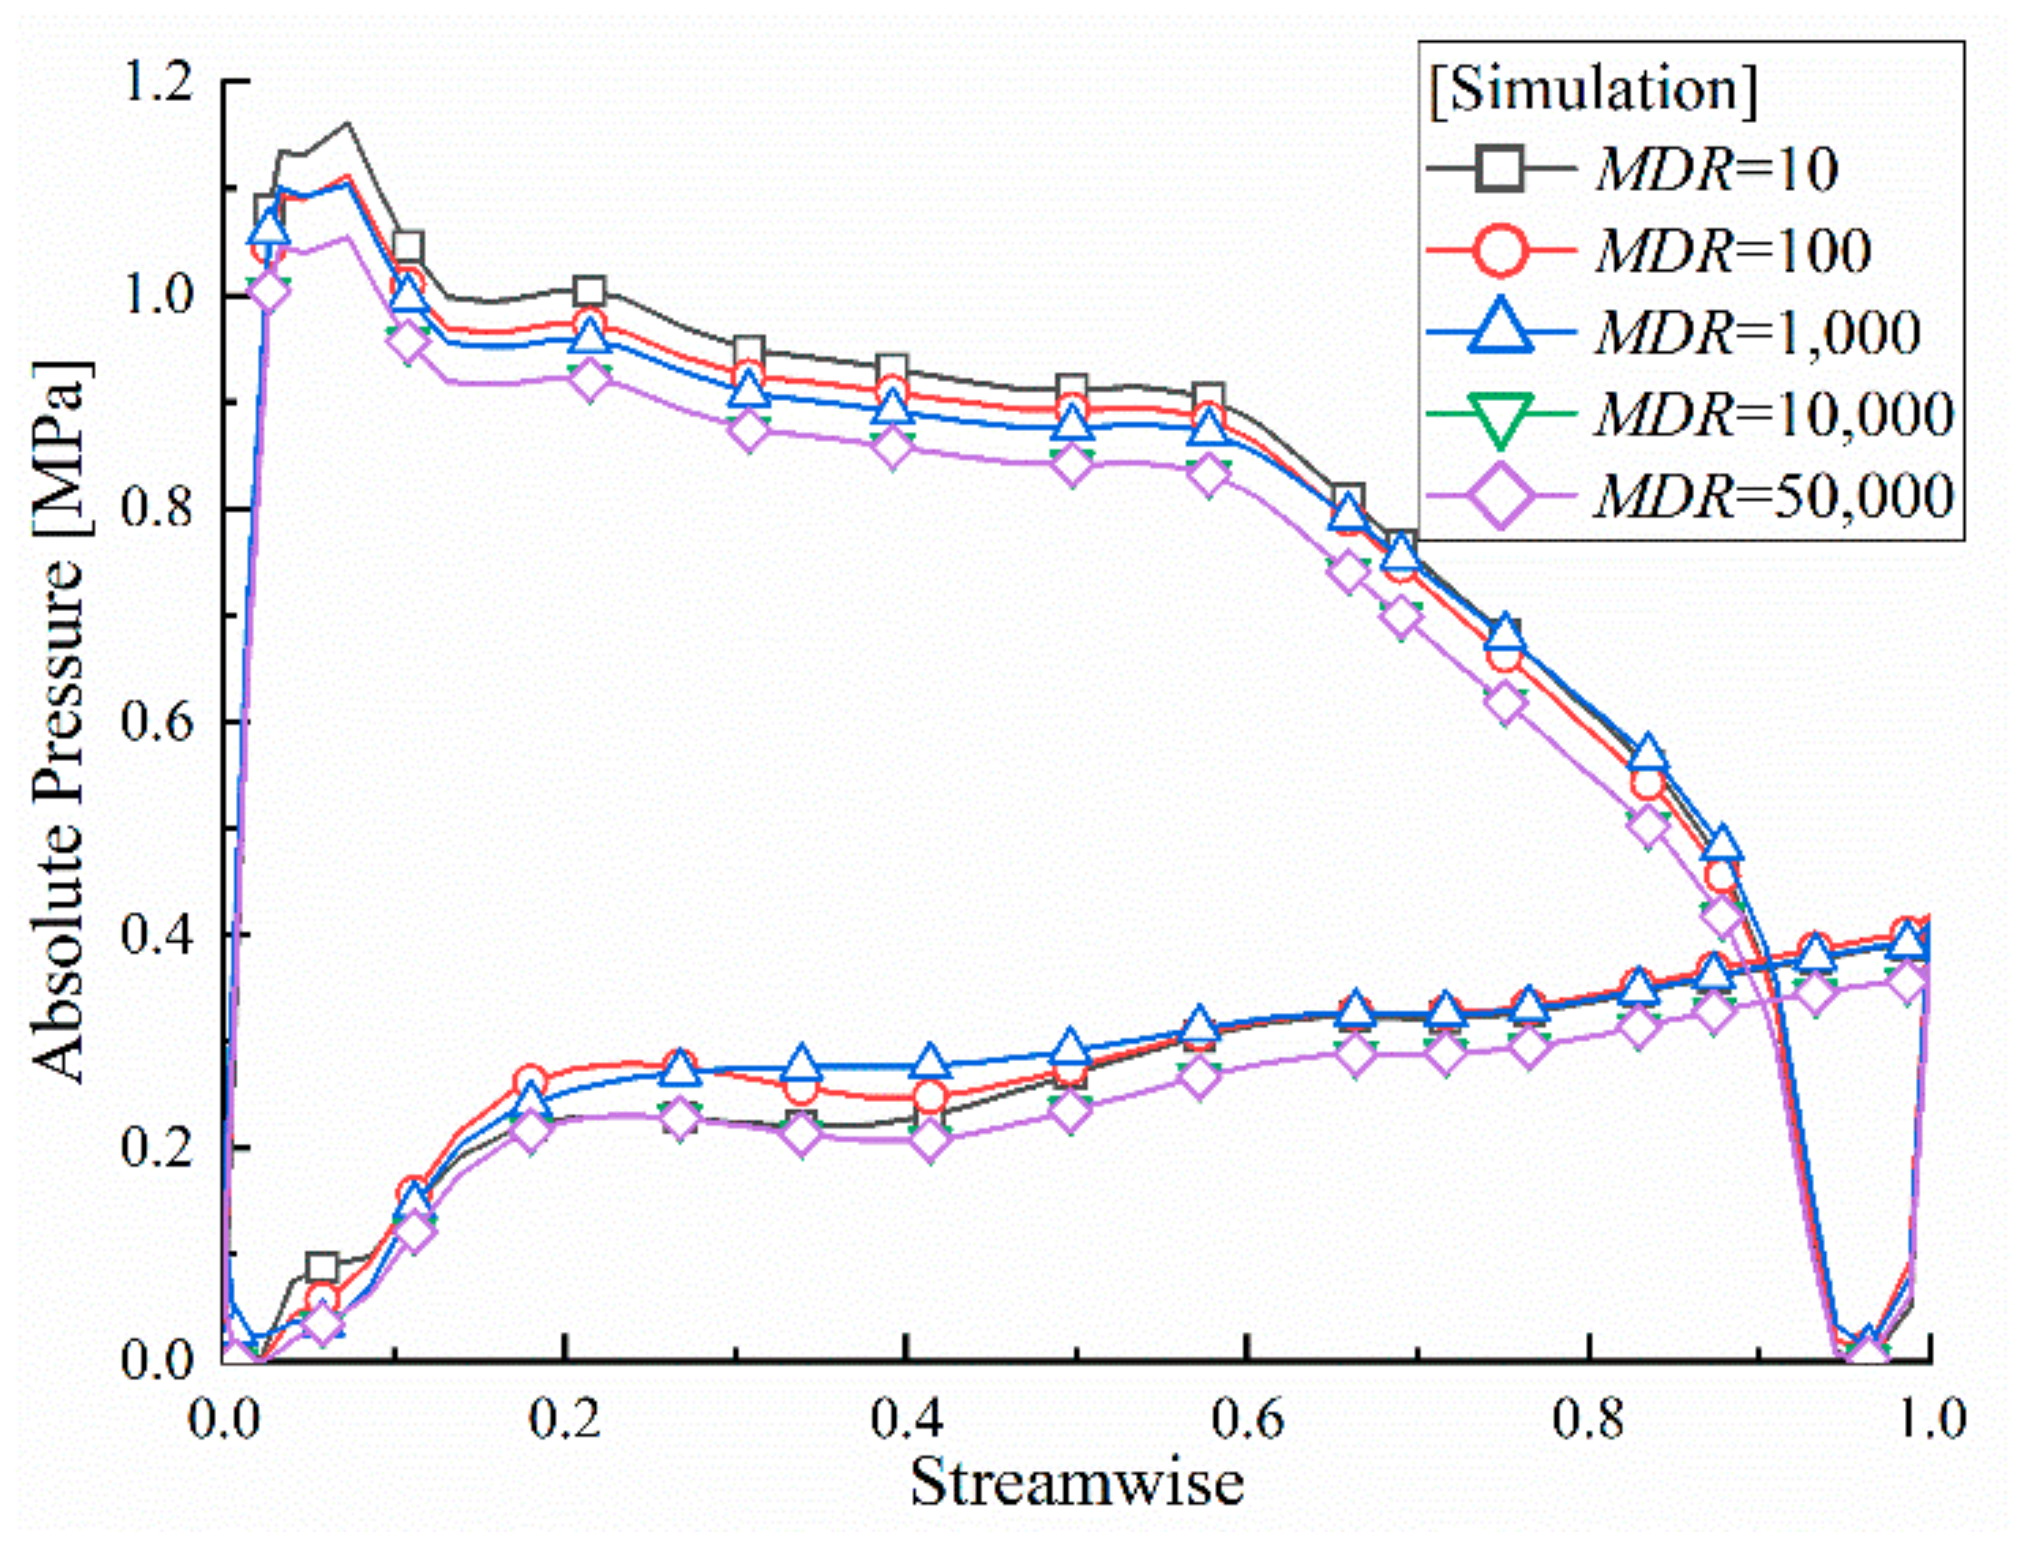
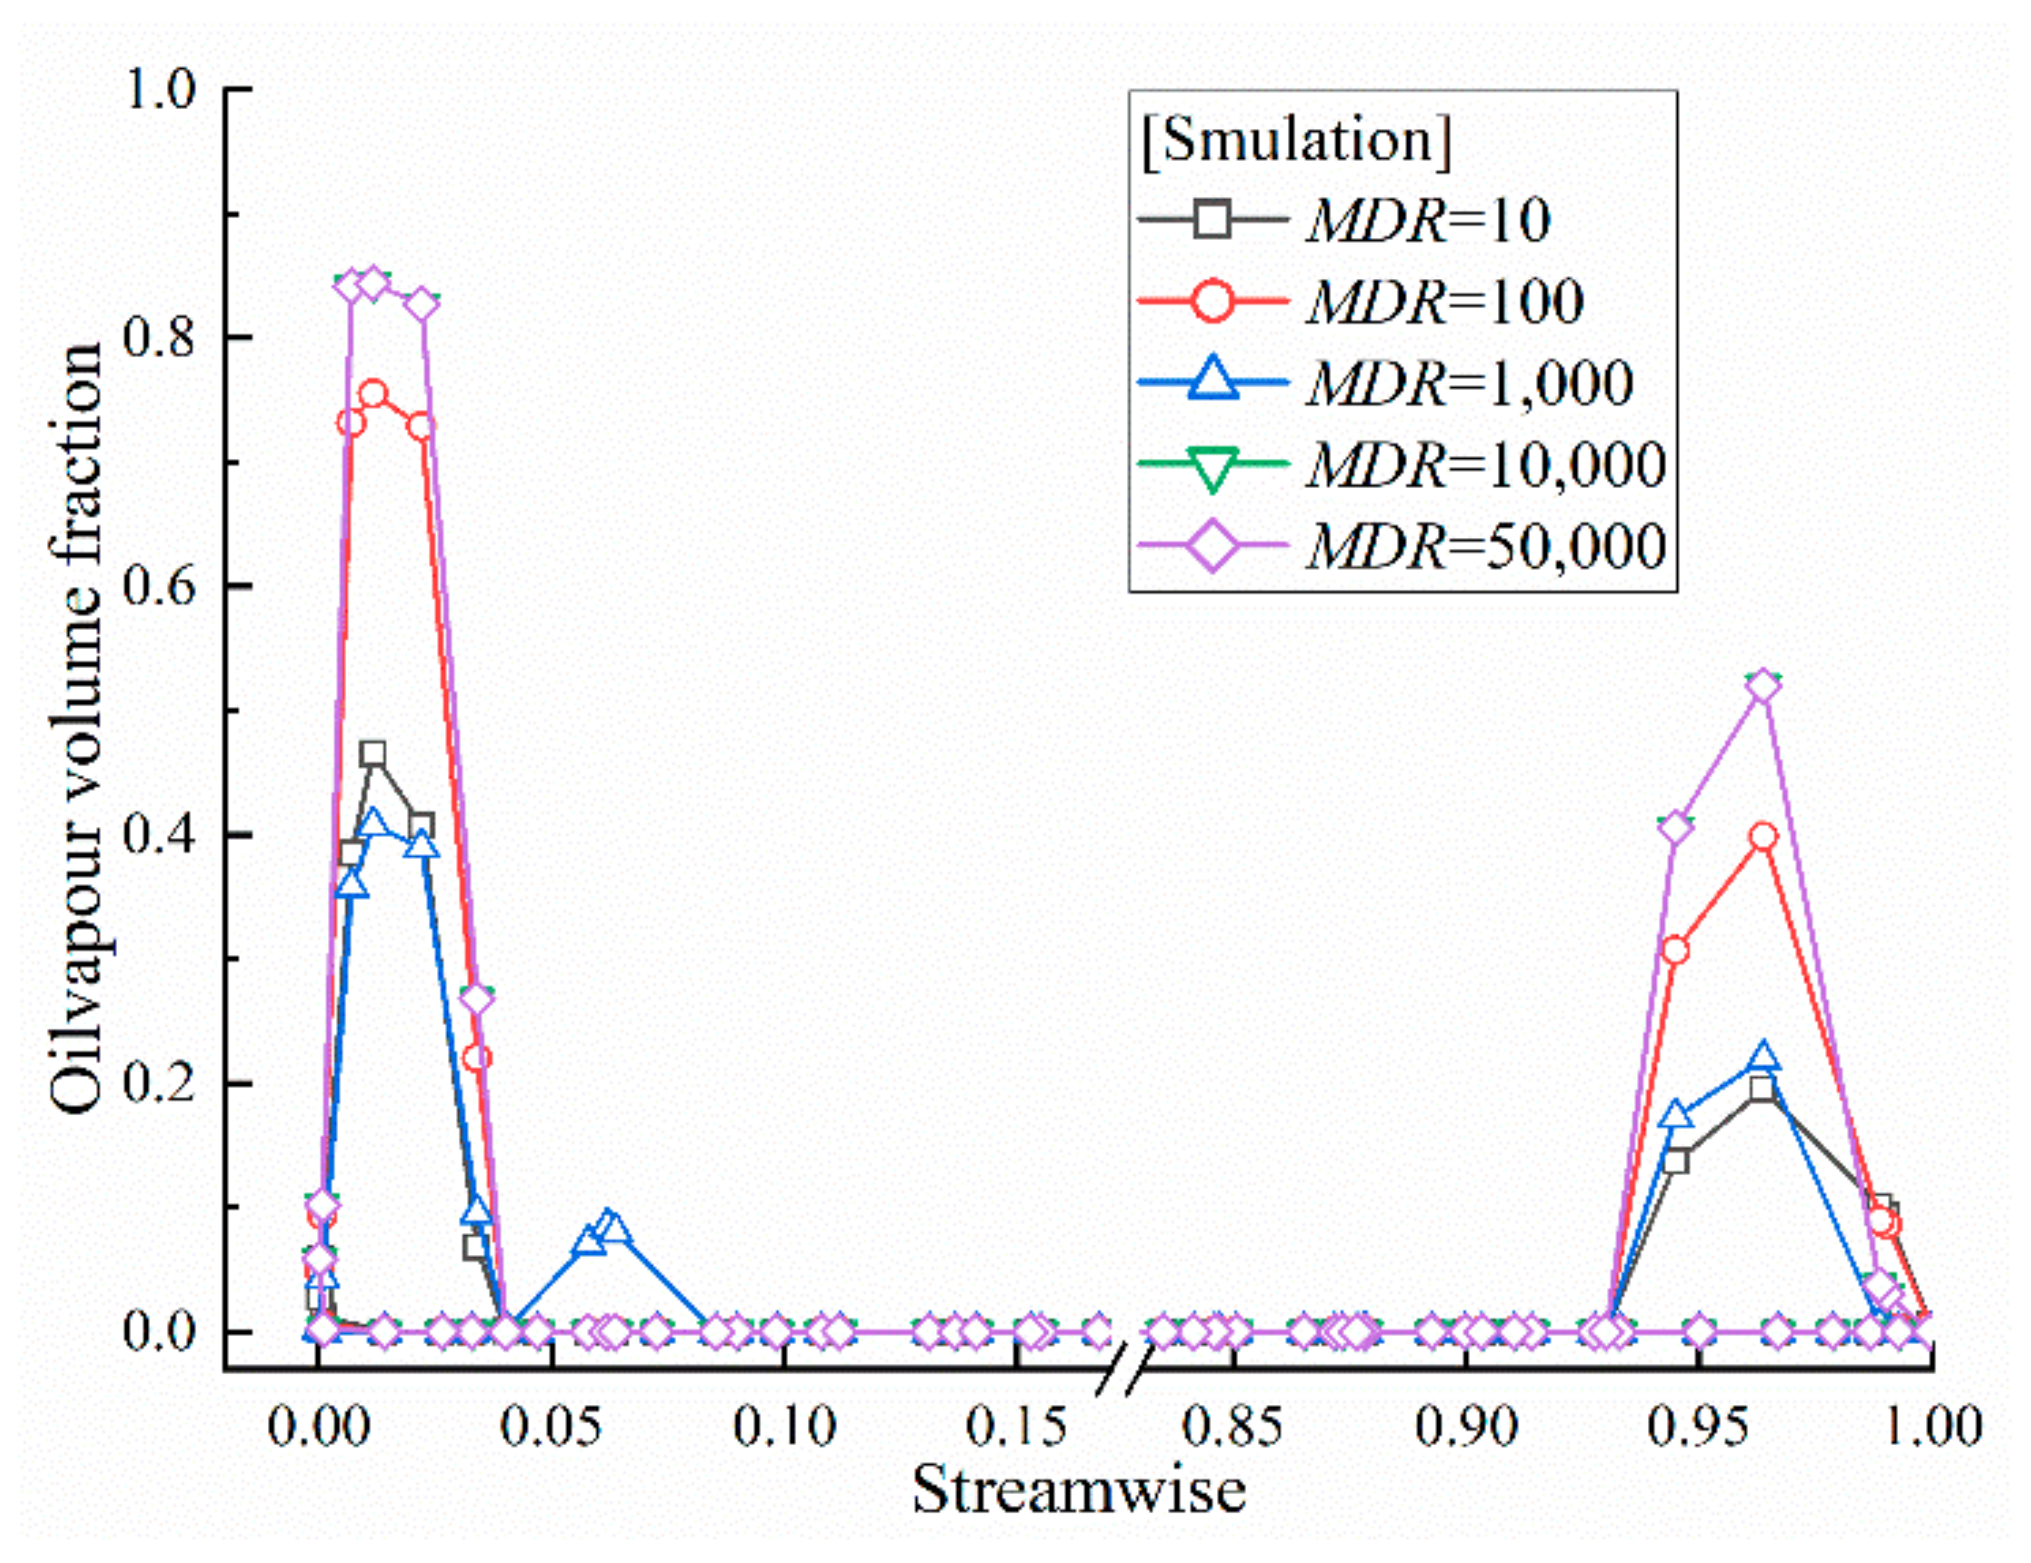
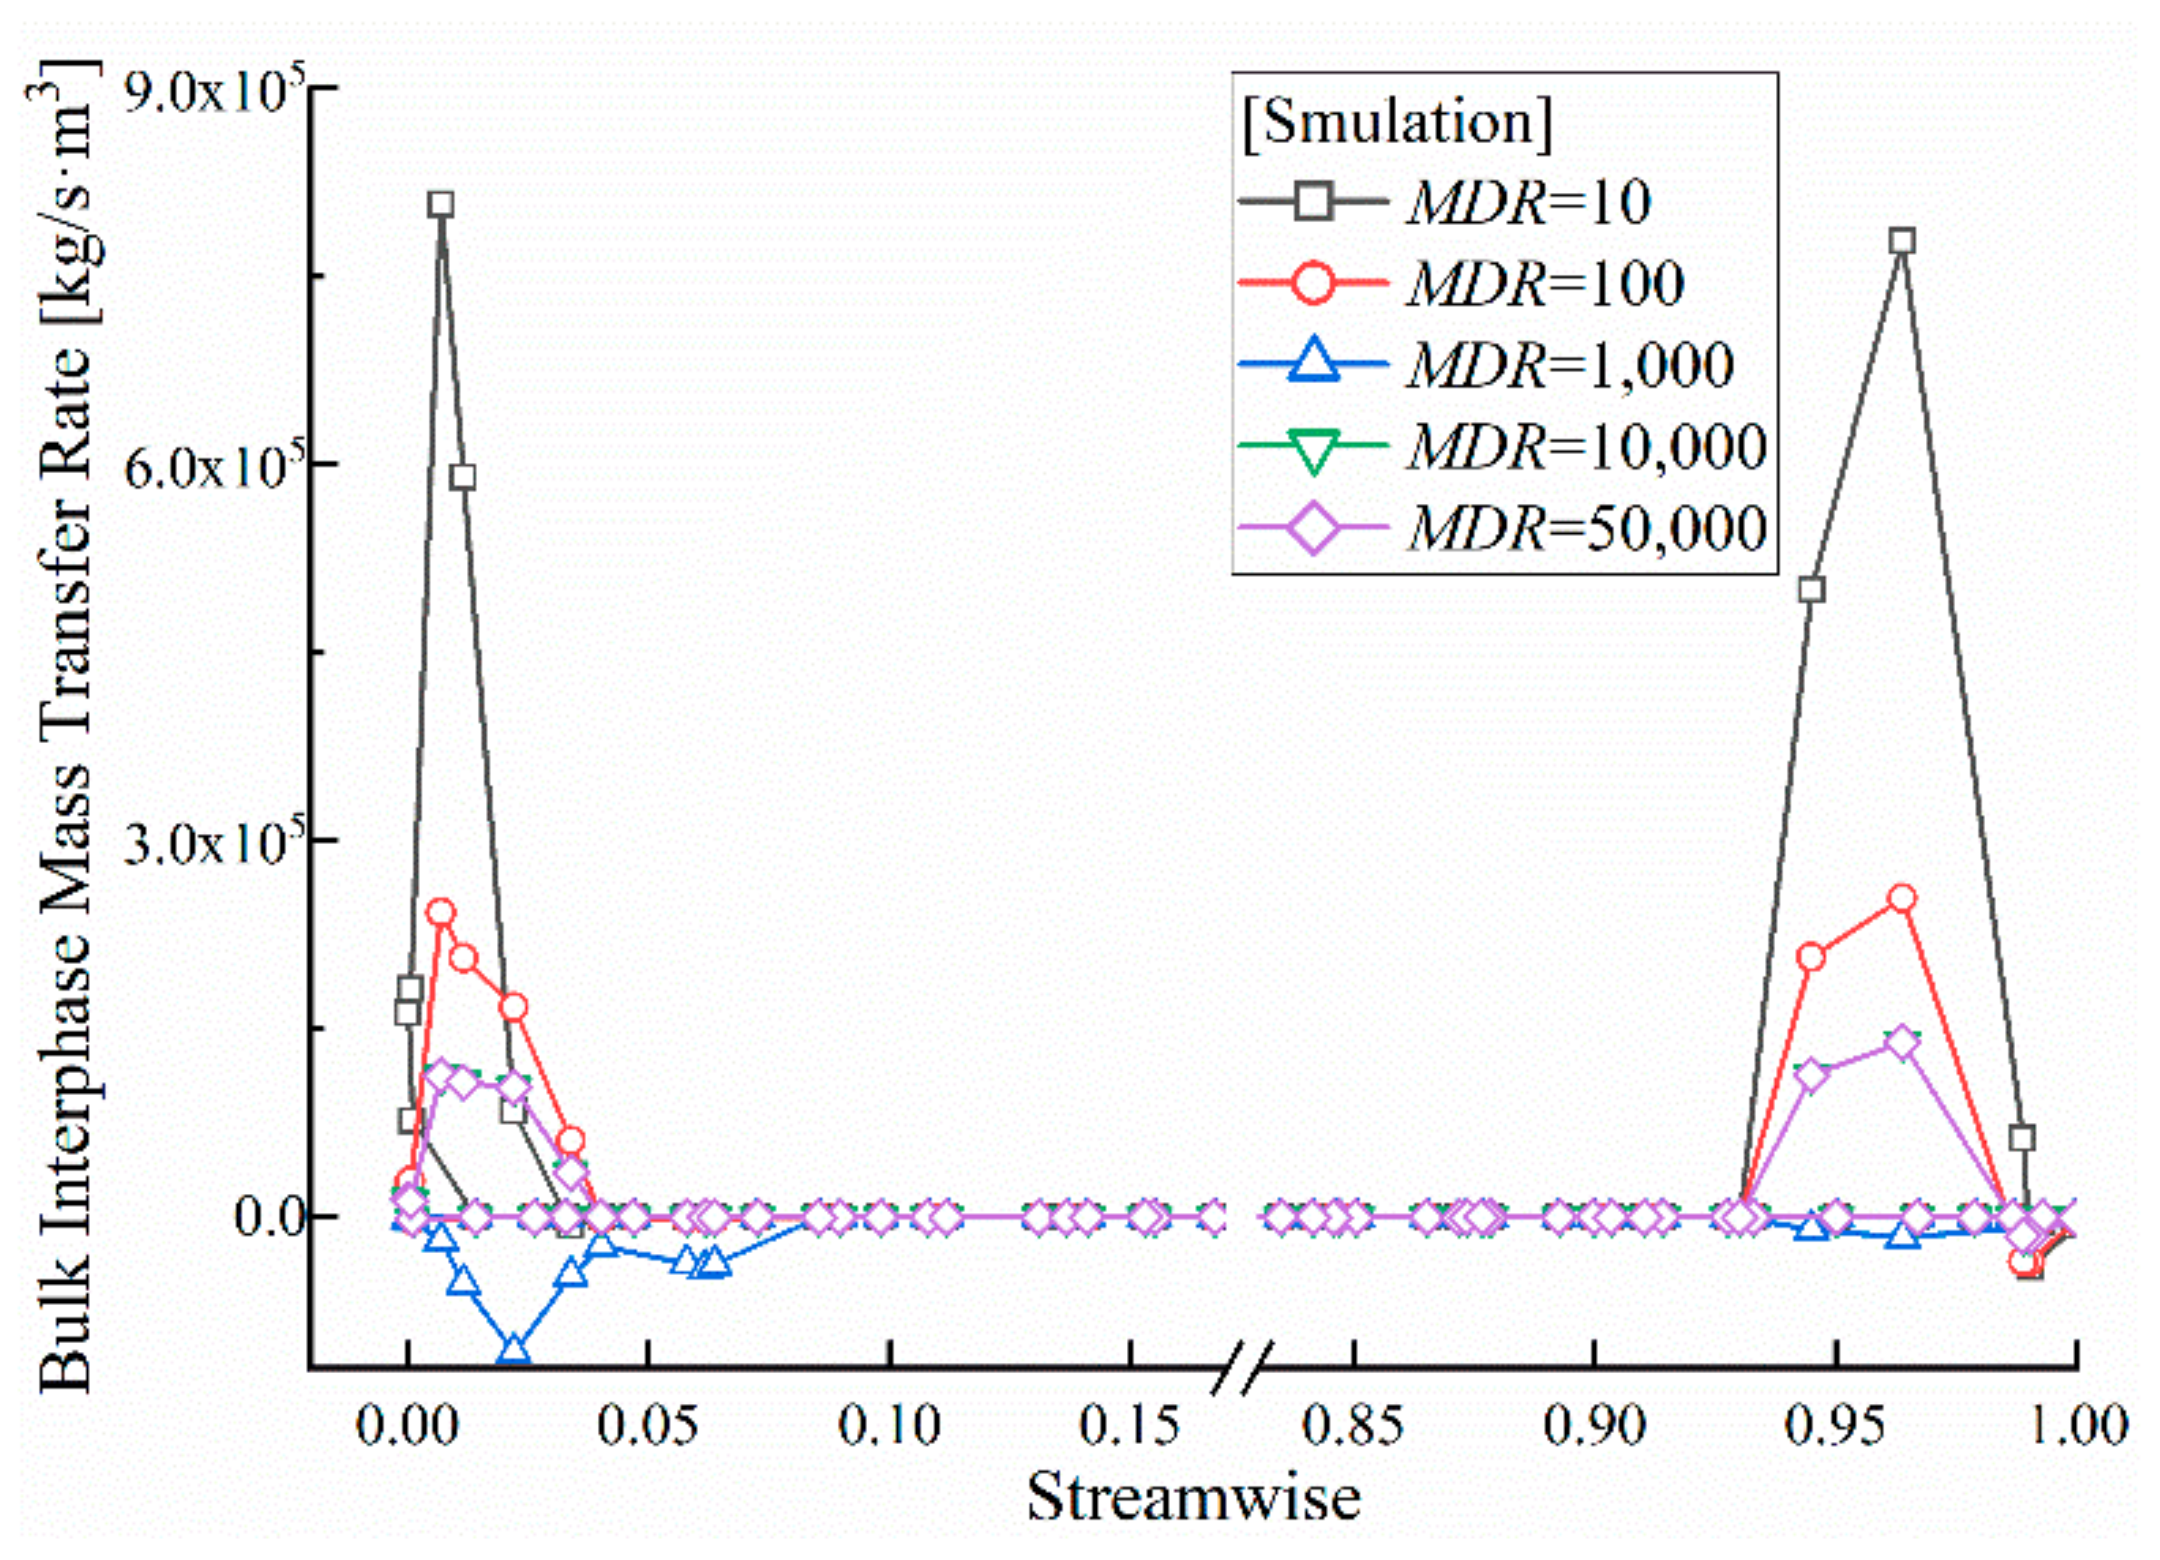
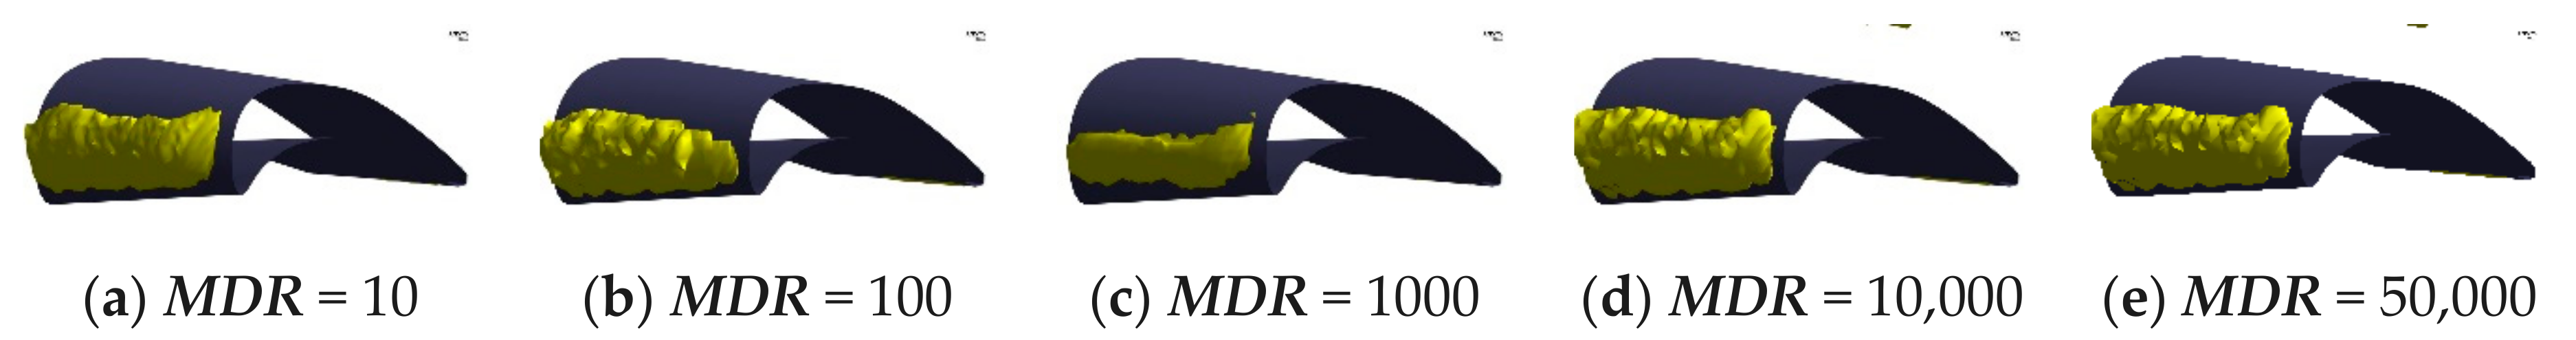
4.3.4. Maximum Density Ratio—MDR

The performance of torque converter under various MDR is shown in Figure 31. It is clear that maximum density ratio has a little influence on torque ratio; however, MDR has a pronounced influence on capacity constant and mass flow rate when MDR is less than 1000. With the increase of MDR, the capacity constant and mass flow rate of torque converter decrease; however, when MDR exceeds 1000, further increase in MDR will not induce significant variation in hydrodynamic performance.
The absolute pressure distribution diagram of the middle streamline on stator blade surface (Figure 32) shows that with the increase of MDR, the pressure on pressure surface decreases, but it has little change on suction surface, which leads to the reduction of mass flow rate and capacity constant. It is worth noting that the absolute pressure distribution remains unchanged when MDR is greater than 10,000.
Figure 33 and Figure 34 show the oil vapor volume fraction and the bulk interphase mass transfer rate on the middle streamline of stator blade under various MDR. The results show that the oil vapor volume fraction increases gradually with the increase of Fvap, while the mass transfer rate decreases with the increase of Fvap. There is little variation in both volume fraction and interphase mass transfer rate when MDR ≥ 10,000.
Figure 35 shows the 10% vapor volume fraction distribution in stator domain under various MDR. We ignored the trend error caused by blade selection and conclude that the increase of MDR leads to little change in the volume of oil vapor bubbles at the head of the stator blade.
We found out that the volume and the length of bubbles in the blade head did not change much with the increase of MDR; however, the oil vapor volume fraction increases gradually (Figure 36). The results reveal that the maximum density ratio has little effect on the volume and the distribution of bubbles, but it will affect the oil vapor content per unit volume, i.e., the vapor density. In conclusion, cavitation becomes more serious with the increase of MDR, it is worth mentioning that the calculation results will no longer change when MDR ≥ 10,000.

5. Cavitation Parameters Modification and Calculation

Based on the parameter study results and the properties of viscous oil that as the working medium of torque converter, we modified the parameters of cavitation model to improve the simulation accuracy, as shown in Table 4.
According to the properties of fluid, the density of hydraulic transmission oil and gas are 835.2 kg/m3 and 0.718 kg/m3 at 90 °C, and the dissolved and undissolved gas in the hydraulic oil promotes the cavitation process and increase the saturated vapor pressure. Therefore, we modified the relevant parameters that MDR = 1163 and Pv = 700 Pa.
The maximum influencing parameter—NVF—was modified to 5 × 10⁻⁵ to correct the over-prediction of cavitation by the original cavitation model parameters, which can significantly reduce the volume of cavitation bubbles and the oil vapor volume fraction. Besides, we modified RB to 2 × 10⁻⁵ m which can reduce the rapid growth and collapse of bubbles caused by the excessive initial bubble radius. Fvap was modified to 20 due to the vaporization degree and vaporization rate of viscous oil are less than that of water.
However, we did not modify Fcond and CRRF because our results show that these two parameters have little effect on the cavitation performance of torque converter.
We calculated the hydrodynamic performance of torque converter under cavitation working conditions using the modified parameters to verify the accuracy of the new cavitation model. Figure 37 shows the comparison of torque ratio, efficiency and capacity constant between original model, modified model, and test at various speed ratio under cavitating conditions, and the errors of turbine torque, torque ratio, efficiency, and capacity constant between modified cavitation model and test at various speed ratio under cavitating conditions as shown in Figure 38.
Through the comparison of calculation results before and after parameters modification, we can conclude that the results of modified cavitation model parameters are more consistent with the test, especially the capacity constant. The error of capacity constant was reduced from 6.7% to within 2% when SR < 0.4, and other performance results of torque converter maintain a higher accuracy. In conclusion, the modification of cavitation model can effectively improve the calculation accuracy of hydrodynamic torque converter cavitation performance.
In addition, we obtained the pressure data at different positions on stator blade through the micro pressure test inside hydraulic torque converter, as shown in Table 5. Compared with the internal flow field extracted from the CFD results, we found that the error between the calculated results and the test was within 8%, which further verified the accuracy of the modified cavitation model. It is worth noting that the average pressure on the suction surface of the stator blade is obviously less than the oil supply pressure, which is caused by cavitation that occurred at this position.

6. Conclusions

The present work investigated the hydrodynamic performance of torque converter and cavitation fluid field by establishing a full 3D steady-state CFD model, and the cavitation effect was also considered. A series of cavitation models were investigated and the influence of empirical parameters on the cavitation model were analyzed. The study made the following conclusions clear:
(1)
Cavitation occurred in a high power-weight ratio torque converter, especially under low SR operating conditions. It has a great change on the hydraulic performance of the torque converter. We should consider the cavitation processes in the analysis of the torque converter to obtain high-precision calculation results.
(2)
The seven parameters of the cavitation model have different effects on the degree of cavitation. NVF is the most important factor, Fvap and RB rank the second, MDR, CRRF, Pv, Fcond are among the least influential parameters. Changing the model parameters according to the actual conditions could improve the prediction accuracy of cavitation model.
(3)
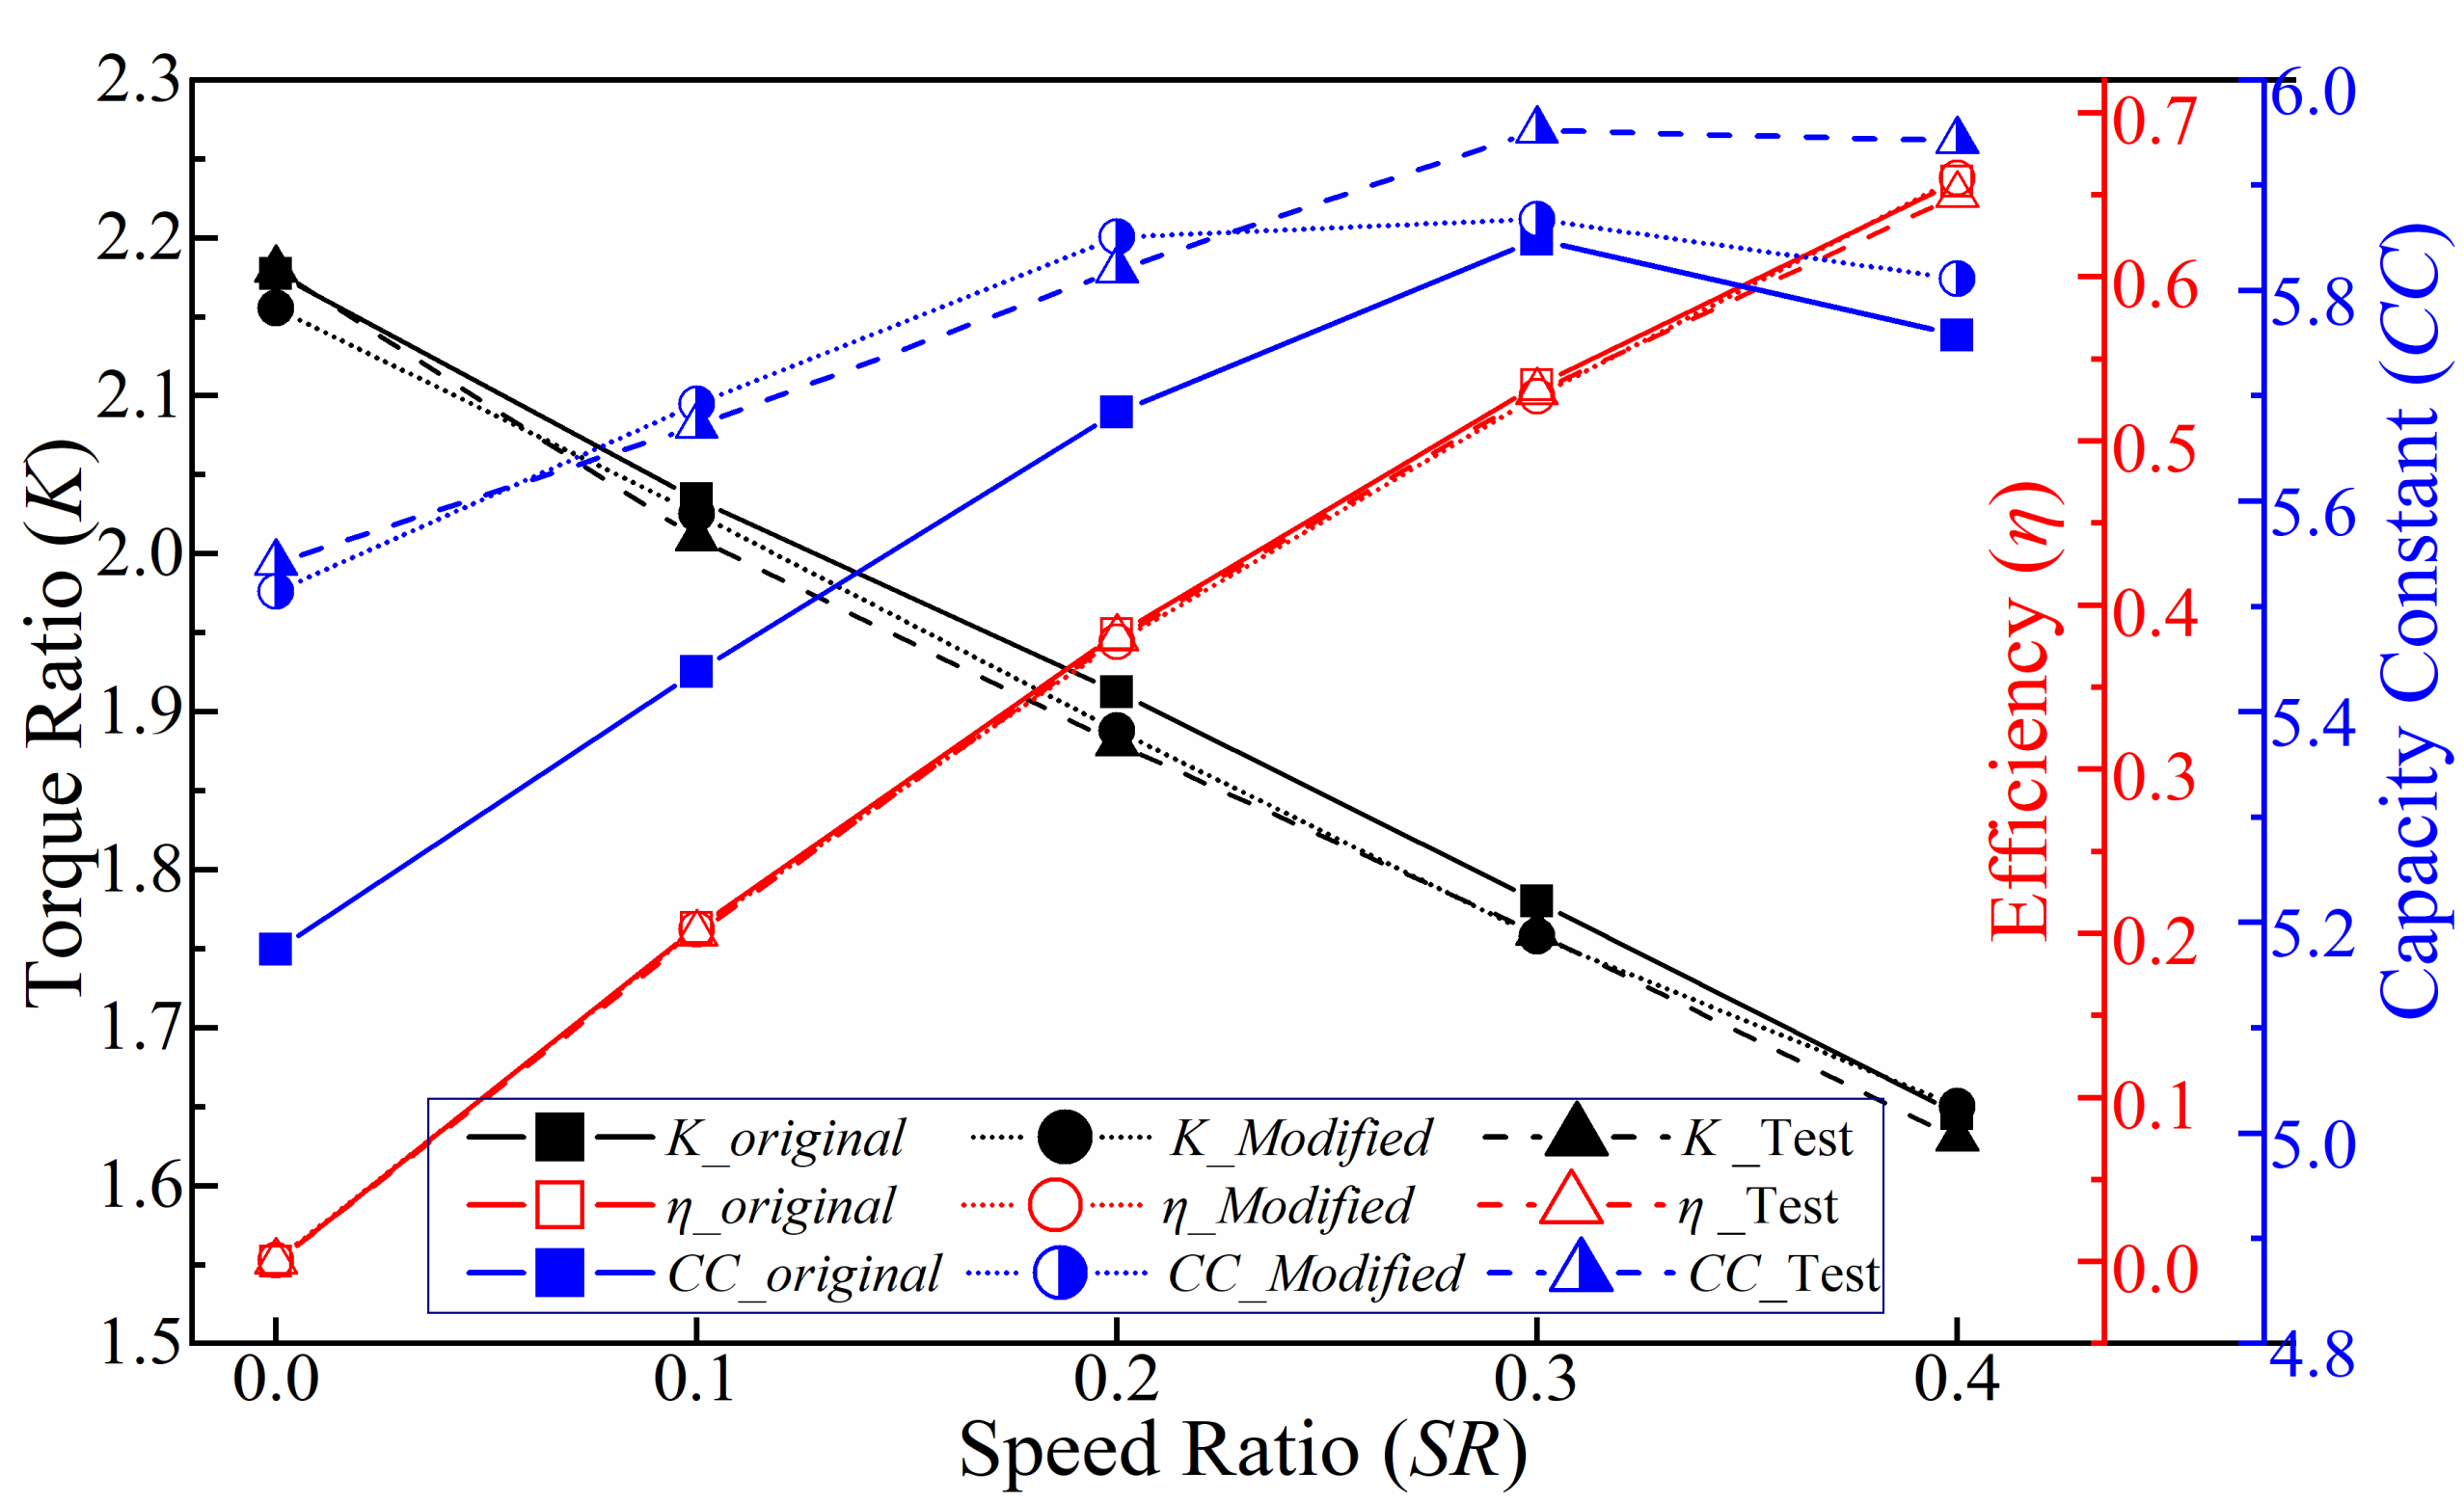
The parameters affect the cavitation hydrodynamic performance and cavitation behaviors in different ways. For instance, NVF and Fvap are the most influential factors to the capacity constant and mass flow rate of torque converter. However, all parameters have little influence on the stall torque ratio of the converter.
(4)
The cavitation flow field and bubble distributions in the torque converter are closely related to the cavitation model parameters. RB and NVF have great influence on the shape of the cavitation bubble, RB mainly affects the length and the thickness of bubbles, and NVF mainly affects the length. MDR and Fvap have little effect on the bubble shape, but RB has a great effect on the air content in the bubble.
(5)
For the base torque converter, the modified cavitation model improved the calculation accuracy under cavitation operating conditions.
It is worth noting that this paper only reveals the effects of a single parameter; however, interaction effects are possible between parameters. Further studies are required to comprehensively investigate the effects using more samples.
In our future work, we will consider the surface tension of viscous oil and further modify the cavitation model, pay more attention to the prediction of cavitation inception, study the transient cavitation behavior in the torque converter at higher speed by transient calculation and transient measurement technology.

Author Contributions

Conceptualization, M.G. and C.L.; Methodology, M.G. and C.L.; Software, M.G. and Z.K.; Validation, J.L. and M.G.; Formal analysis, M.G. and C.L.; Investigation, J.L.; Resources, W.W.; Data curation, M.G. and C.L.; Writing—original draft preparation, M.G., C.L., and W.W.; Writing—review and editing, Q.Y.; Visualization, M.G.; Supervision, C.L.; Project administration, Q.Y. and W.W.; Funding acquisition, C.L., Q.Y., and W.W. All authors have read and agreed to the published version of the manuscript.

Funding

This work has been funded by the National Natural Science Foundation of China (NSFC) through grant nos. 51475041 and 51805027, Beijing Institute of Technology Research Fund Program for young Scholars (3030011181804) and Vehicular Transmission Key Laboratory Fund.

Institutional Review Board Statement

Not applicable.

Informed Consent Statement

Not applicable.

Acknowledgments

The authors gratefully acknowledge the support of the above fundings and the authors also thank Beijing Institute of Technology and National Key Lab of Vehicular Transmission for supporting the research.

Conflicts of Interest

The authors declare no conflict of interest.

References

  1. Yan, Q.D.; Wei, W.; Liu, C.; Liu, S.C.; Li, J.; Liu, B.S. Torque Converter Modern Design Theory and Methodology. Chin. Hydraul. Pneum. 2015, 4, 1–8. [Google Scholar] [CrossRef]
  2. Zhao, L.L. The cavitation research of the flow field in the hydraulic torque converter based on CFD. Taiyuan Taiyuan Univ. Sci. Technol. 2016. [Google Scholar]
  3. Tseng, C.C. Modeling of Turbulent Cavitating Flows. Ph.D. Thesis, University of Michigan, Ann Arbor, MI, USA, 2010. [Google Scholar]
  4. Ding, H.; Visser, F.C.; Jiang, Y.; Furmanczyk, M. Demonstration and Validation of a 3D CFD Simulation Tool Predicting Pump Performance and Cavitation for Industrial Applications. J. Fluids Eng. Trans. ASME 2011, 133. [Google Scholar] [CrossRef]
  5. Anderson, C.L.; Zeng, L.; Sweger, P.O.; Narain, A. Experimental Investigation of Cavitation Signatures in an Automotive Torque Converter Using a Microwave Telemetry Technique. Int. J. Rotat. Mach. 2003, 9, 403–410. [Google Scholar] [CrossRef] [Green Version]
  6. Watanabe, S.; Otani, R.; Kunimoto, S.; Hara, Y.; Furukawa, A.; Yamaguchi, T. Vibration Characteristics due to Cavitation in Stator Element of Automotive Torque Converter at Stall Condition. In Proceedings of the ASME 2012 Fluids Engineering Summer Meeting (FEDSM2012), Rio Grande, Puerto Rico, USA, 8–12 July 2012. [Google Scholar] [CrossRef]
  7. Dong, Y.; Korivi, V.; Attibele, P.; Yuan, Y.Q. Torque converter CFD engineering part 2: Performance improvement through core leakage flow and cavitation control. SAE Paper 2002, 1, 0884. [Google Scholar] [CrossRef]
  8. Tsutsumi, K.; Watanabe, S.; Tsuda, S.; Yamaguchi, T. Cavitation simulation of automotive torque converter using a homogeneous cavitation model. Eur. J. Mech. B Fluid. 2017, 61, 263–270. [Google Scholar] [CrossRef] [Green Version]
  9. Hayata, R.; Tsutsumi, K.; Watanabe, S.; Tsuda, S.; Yamaguchi, T.; Yoshihide, M. Modeling of Gaseous Cavitation in Torque Converter. In Proceedings of the Japan Mechanical Engineering Congress, Fukuoka, Japan, 11–14 September 2016. [Google Scholar] [CrossRef]
  10. Ju, J.; Jang, J.; Choi, M.; Baek, J.H. Effects of cavitation on performance of automotive torque converter. Adv. Mech. Eng. 2016, 8. [Google Scholar] [CrossRef] [Green Version]
  11. Zhao, L.L.; Dong, Z.Q.; Lian, J.Y.; Zhao, F.Q. Analysis of Bubble Breakup Motion for Hydrodynamic Torque Converter. Hydraul. Pneum. Seal. 2016, 36, 1–4. [Google Scholar] [CrossRef]
  12. Liu, C.; Wei, W.; Yan, Q.D.; Weaver, B.K.; Wood, H.G. Influence of Stator Blade Geometry on Torque Converter Cavitation. ASME J. Fluid. Eng. 2018, 4, 140. [Google Scholar] [CrossRef]
  13. Liu, C.; Wei, W.; Yan, Q.D.; Weaver, B.K. Torque Converter Capacity Improvement through Cavitation Control by Design. ASME J. Fluid. Eng. 2017, 4, 139. [Google Scholar] [CrossRef]
  14. Kang, C.; Mao, N.; Zhang, G.F. Highly Confined Floes and Cavitation Phenomenon in a Hydraulic Retarder. J. Eng. Thermophys. 2017, 38, 2151–2158. [Google Scholar]
  15. Dong, L.; Xiao, J.W.; Ming, J.Y.; Liu, H.L. Numerical simulation and experimental study on cavitation behavior of hydraulic retarder model. J. Drain. Irrig. Mach. Eng. 2017, 35, 1–5. [Google Scholar] [CrossRef]
  16. Liu, C.; Guo, M.; Yan, Q.D.; Wei, W. Numerical Investigation on the Transient Cavitating Flow inside a Torque Converter. In Proceedings of the IEEE 8th International Conference on Fluid Power and Mechatronics (FPM), Wuhan, China, 10–13 April 2019; pp. 208–216. [Google Scholar] [CrossRef]
  17. Zhou, H.C.; Min, X.; Wu, Z.P.; Zhang, W.H. Analysis and optimization of the effect of cavitation model parameters on calculation of cavitation flow field. In Proceedings of the 14th China National hydrodynamics Conference, Nanjing, China, 23–25 September 2017; pp. 306–314. [Google Scholar]
  18. Morgut, M.; Nobile, E.; Bilu, I. Comparison of mass transfer models for the numerical prediction of sheet cavitation around a hydrofoil. Int. J. Multiph. Flow 2011, 37, 620–626. [Google Scholar] [CrossRef]
  19. Liu, H.L.; Wang, J.; Wang, Y.; Zhang, H.; Huang, H. Influence of the empirical coefficients of cavitation model on predicting cavitating flow in the centrifugal pump. Int. J. Nav. Architect. Ocean Eng. 2014, 6, 119–131. [Google Scholar] [CrossRef] [Green Version]
  20. Li, W.G. State-of-the-art and prospects in study on viscous oil cavitating flows. J. Drain. Irrig. Mech. Eng. 2015, 33, 1–9. [Google Scholar]
  21. Liu, H.L.; Liu, D.X.; Wang, Y.; Du, H.; Xu, H. Numerical research status and prospects of cavitating flow in a pump. Fluid. Mach. 2011, 39, 38–44. [Google Scholar] [CrossRef]
  22. Zwart, P.; Gerber, A.G.; Belamri, T. A two-phase flow model for predicting cavitation dynamics. In Proceedings of the ICMF 2004 International Conference on Multiphase Flow, Yokohama, Japan, 30 May–4 June 2004; pp. 1–11. [Google Scholar]
  23. Kunz, R.F.; Boger, D.A.; Stinebring, D.R.; Chyczewskia, T.S.; Lindaua, J.W.; Gibelinga, H.J.; Venkateswaranb, S.; Govindanc, T.R. A preconditioned Navier-Stokes method for two-phase flows with application to cavitation prediction. Comput. Fluid. 2000, 29, 849–875. [Google Scholar] [CrossRef]
  24. Schnerr, G.H.; Sauer, J. Physical and numerical modeling of unsteady cavitation dynamics. In Proceedings of the ICMF 2001 International Conference on Multiphase Flow, New Orleans, LA, USA, 27 May–1 June 2001; pp. 1–8. [Google Scholar]
  25. Singhal, A.K.; Athavle, M.M.; Li, H. Mathematical basis and validation of the full cavitation model. J. Fluid. Eng. 2002, 124, 617–624. [Google Scholar] [CrossRef]
  26. Xue, R.; Zhang, M.; Xu, Z.J.; Lin, L.L. Comparison and Study on Different Cavitation Models. Northwest Hydropower 2014, 02, 85–89. [Google Scholar]
  27. Mejri, I.; Bakir, F.; Rey, R.; Belamri, T. Comparison of computational results obtained from a homogeneous cavitation model with experimental investigations of three inducers. J. Fluid. Eng. 2006, 128, 1308–1323. [Google Scholar] [CrossRef]
  28. ANSYS Inc. Multiphase flow theory, Interphase mass transfer. In ANSYS CFX-Solver Theory Guide; ANSYS Inc.: Canonsburg, PA, USA, 2019; pp. 190–206. [Google Scholar]
  29. Liu, C.; Guo, M.; Yan, Q.D.; Wei, W.; Wood, H.G. Parametric Analysis and Optimization of Leaning Angle in Torque Converters. J. Fluid. Eng. 2020, 142. [Google Scholar] [CrossRef]
Figure 1. A basic model of hydraulic torque converter (YD315).
Applsci 11 03643 g001
Figure 2. Full 3D flow model of the torque converter.
Applsci 11 03643 g002
Figure 3. Mesh model and independence analysis results of torque converter.
Applsci 11 03643 g003
Figure 4. Flow chart for the torque converter cavitation calculation using CFD.
Applsci 11 03643 g004
Figure 5. Torque converter test cell and its components.
Applsci 11 03643 g005
Figure 6. Micro pressure test of internal flow field in torque converter.
Applsci 11 03643 g006
Figure 7. Comparison of torque ratio, efficiency, and capacity constant between no cavitation, cavitation, and test at various speed ratio under cavitating and non cavitating conditions.
Applsci 11 03643 g007
Figure 8. Error comparison of turbine torque, torque ratio, efficiency, and capacity constant between no cavitation and cavitation at various speed ratio under cavitating conditions.
Applsci 11 03643 g008
Figure 9. Influence degree of all cavitation parameters on capacity constant, torque ratio, and mass flow rate of torque converter at stall.
Applsci 11 03643 g009
Figure 10. Oil vapor volume fraction distribution near the stator blade of torque converter.
Applsci 11 03643 g010
Figure 11. Capacity constant, torque ratio, and mass flow rate of torque converter at stall under various nuclei volume fractions.
Applsci 11 03643 g011
Figure 12. Absolute pressure on stator blade at stall under various nuclei volume fractions.
Applsci 11 03643 g012
Figure 13. Oil vapor volume fraction on stator blade at stall under various nuclei volume fractions.
Applsci 11 03643 g013
Figure 14. Bulk interphase mass transfer rate on stator blade at stall under various nuclei volume fractions.
Applsci 11 03643 g014
Figure 15. The 10% vapor volume fraction distribution in stator domain at stall under various nuclei volume fractions.
Applsci 11 03643 g015
Figure 16. Oil vapor volume fraction distribution on stator blades at stall under various nuclei volume fractions.
Applsci 11 03643 g016
Figure 17. Oil vapor volume fraction distribution in stator domain at stall under various nuclei volume fraction.
Applsci 11 03643 g017
Figure 18. Capacity constant, torque ratio, and mass flow rate of torque converter at stall under various cavitation vaporization coefficients.
Applsci 11 03643 g018
Figure 19. Absolute pressure on stator blade at stall under various cavitation vaporization coefficients.
Applsci 11 03643 g019
Figure 20. Oil vapor volume fraction on stator blade at stall under various cavitation vaporization coefficients.
Applsci 11 03643 g020
Figure 21. Bulk interphase mass transfer rate on stator blade at stall under various cavitation vaporization coefficients.
Applsci 11 03643 g021
Figure 22. The 10% vapor volume fraction distribution in stator domain at stall under various cavitation vaporization coefficients.
Applsci 11 03643 g022
Figure 23. Oil vapor volume fraction distribution on stator blades at stall under various cavitation vaporization coefficients.
Applsci 11 03643 g023
Figure 24. The oilvapor volume fraction distribution in stator domain at stall under various cavitation vaporization coefficient.
Applsci 11 03643 g024
Figure 25. The capacity constant, torque ratio and mass flow rate of torque converter at stall under various mean radius.
Applsci 11 03643 g025
Figure 26. The absolute pressure on stator blade at stall under various mean radius.
Applsci 11 03643 g026
Figure 27. The oilvapor volume fraction on stator blade at stall under various mean radius.
Applsci 11 03643 g027
Figure 28. The bulk interphase mass transfer rate on stator blade at stall under various mean radius.
Applsci 11 03643 g028
Figure 29. The 10% vapor volume fraction distribution in stator domain at stall under various mean radius.
Applsci 11 03643 g029
Figure 30. The oilvapor volume fraction distribution in stator domain at stall under various mean radius.
Applsci 11 03643 g030
Figure 31. Capacity constant, torque ratio, and mass flow rate of torque converter at stall under various maximum density ratios.
Applsci 11 03643 g031
Figure 32. Absolute pressure on stator blade at stall under various maximum density ratios.
Applsci 11 03643 g032
Figure 33. Oil vapor volume fraction on stator blade at stall under various maximum densities.
Applsci 11 03643 g033
Figure 34. Bulk interphase mass transfer rate on stator blade at stall under various maximum density ratios.
Applsci 11 03643 g034
Figure 35. The 10% vapor volume fraction distribution in stator domain at stall under various maximum density ratios.
Applsci 11 03643 g035
Figure 36. Oil vapor volume fraction distribution in stator domain at stall under various maximum density ratios.
Applsci 11 03643 g036
Figure 37. Comparison of torque ratio, efficiency, and capacity constant between the original model and modified model and test at various speed ratios under cavitating conditions.
Applsci 11 03643 g037
Figure 38. Errors of turbine torque, torque ratio, efficiency, and capacity constant between modified cavitation model and test at various speed ratio under cavitating conditions.
Applsci 11 03643 g038
Table 1. Data of the mesh independence analysis.
OrderNumber of ElementsTorque Variation
PumpTurbineStatorTotalTP%TT%TS%
016139586633823057661583110000
021060830119857052730027867004.205.258.05
0324151703555930120199071731004.514.225.84
04753814843194482442091142996871.631.421.90
051244010053152503003070207585000.691.271.85
061654160066319903748490269220000.580.961.21
Table 2. Detailed setting of torque converter CFD model.
Analysis StepNo Cavitation INo Cavitation IICavitation IIICavitation IV
Analysis typeSteady-stateSteady-stateSteady-stateSteady-state
Advection schemeUpwindHigh resolutionHigh resolutionHigh resolution
Interface modelFrozen rotorFrozen rotorFrozen rotorFrozen rotor
Cavitation modelNoneNoneZwart modelZwart model
Cavitation parametersNoneNoneDefault valuesChanged values
Time step0.01 sAuto timescaleAuto timescaleAuto timescale
Step number400300400400
Convergence targetRMS 1 × 10⁻⁵RMS 1 × 10⁻⁵RMS 1 × 10⁻⁵RMS 1 × 10⁻⁵
Turbulence modelSSTSSTSSTSST
Fluid propertiesρl = 835.2 kg·m−3, μl = 1.46 × 10⁻² Pa·s
Vapor propertiesρv = 2.1 kg·m−3, μv = 1.2 × 10⁻⁵ Pa·s
Pump statusFixed at 2000 rpm
Turbine statusFixed at 0 rpm
Stator statusStationary
Boundary detailsNo-slip and smooth wall
Table 3. Different parameters of cavitation model.
ParameterDefinitionValue
Pv/PaSaturated Vapor Pressure 1010050010005000
FcondCavitation Condensation Coefficient0.00010.0050.010.050.2
FvapCavitation Vaporization Coefficient0.111050100
RB/mMean Radius7 × 10−82 × 10−72 × 10−62 × 10−52 × 10−4
MDRMaximum Density Ratio10100100010,00050,000
NVFNuclei Volume Fraction5 × 10−85 × 10−75 × 10−65 × 10−55 × 10−4
CRRFCavitation Rate under Relaxation Factor0.0010.0050.050.11
Table 4. Parameter modification on torque converter cavitation model.
ParameterPv/PaFcondFvapRB/mMDRNVFCRRF
Default Value1100.01502 × 10−610005 × 10−40.25
Modified Value7000.01202 × 10−511635 × 10−50.25
Table 5. Pressure data at different locations on stator blade.
Position on Stator BladeHead of Suction SurfaceHead of Pressure SurfaceTail of Pressure Surface
Simulation average pressure (Pa)16,3741,212,461639,934
Test average pressure (Pa)17,7631,298,350611,840
Error (%)−7.82−6.624.59
Publisher’s Note: MDPI stays neutral with regard to jurisdictional claims in published maps and institutional affiliations.

