Feasibility of the Quantitative Assessment Method for CT Quality Control in Phantom Image Evaluation
Abstract
1. Introduction
2. Materials and Methods
2.1. Equipment
2.2. Image Acquisition Parameters
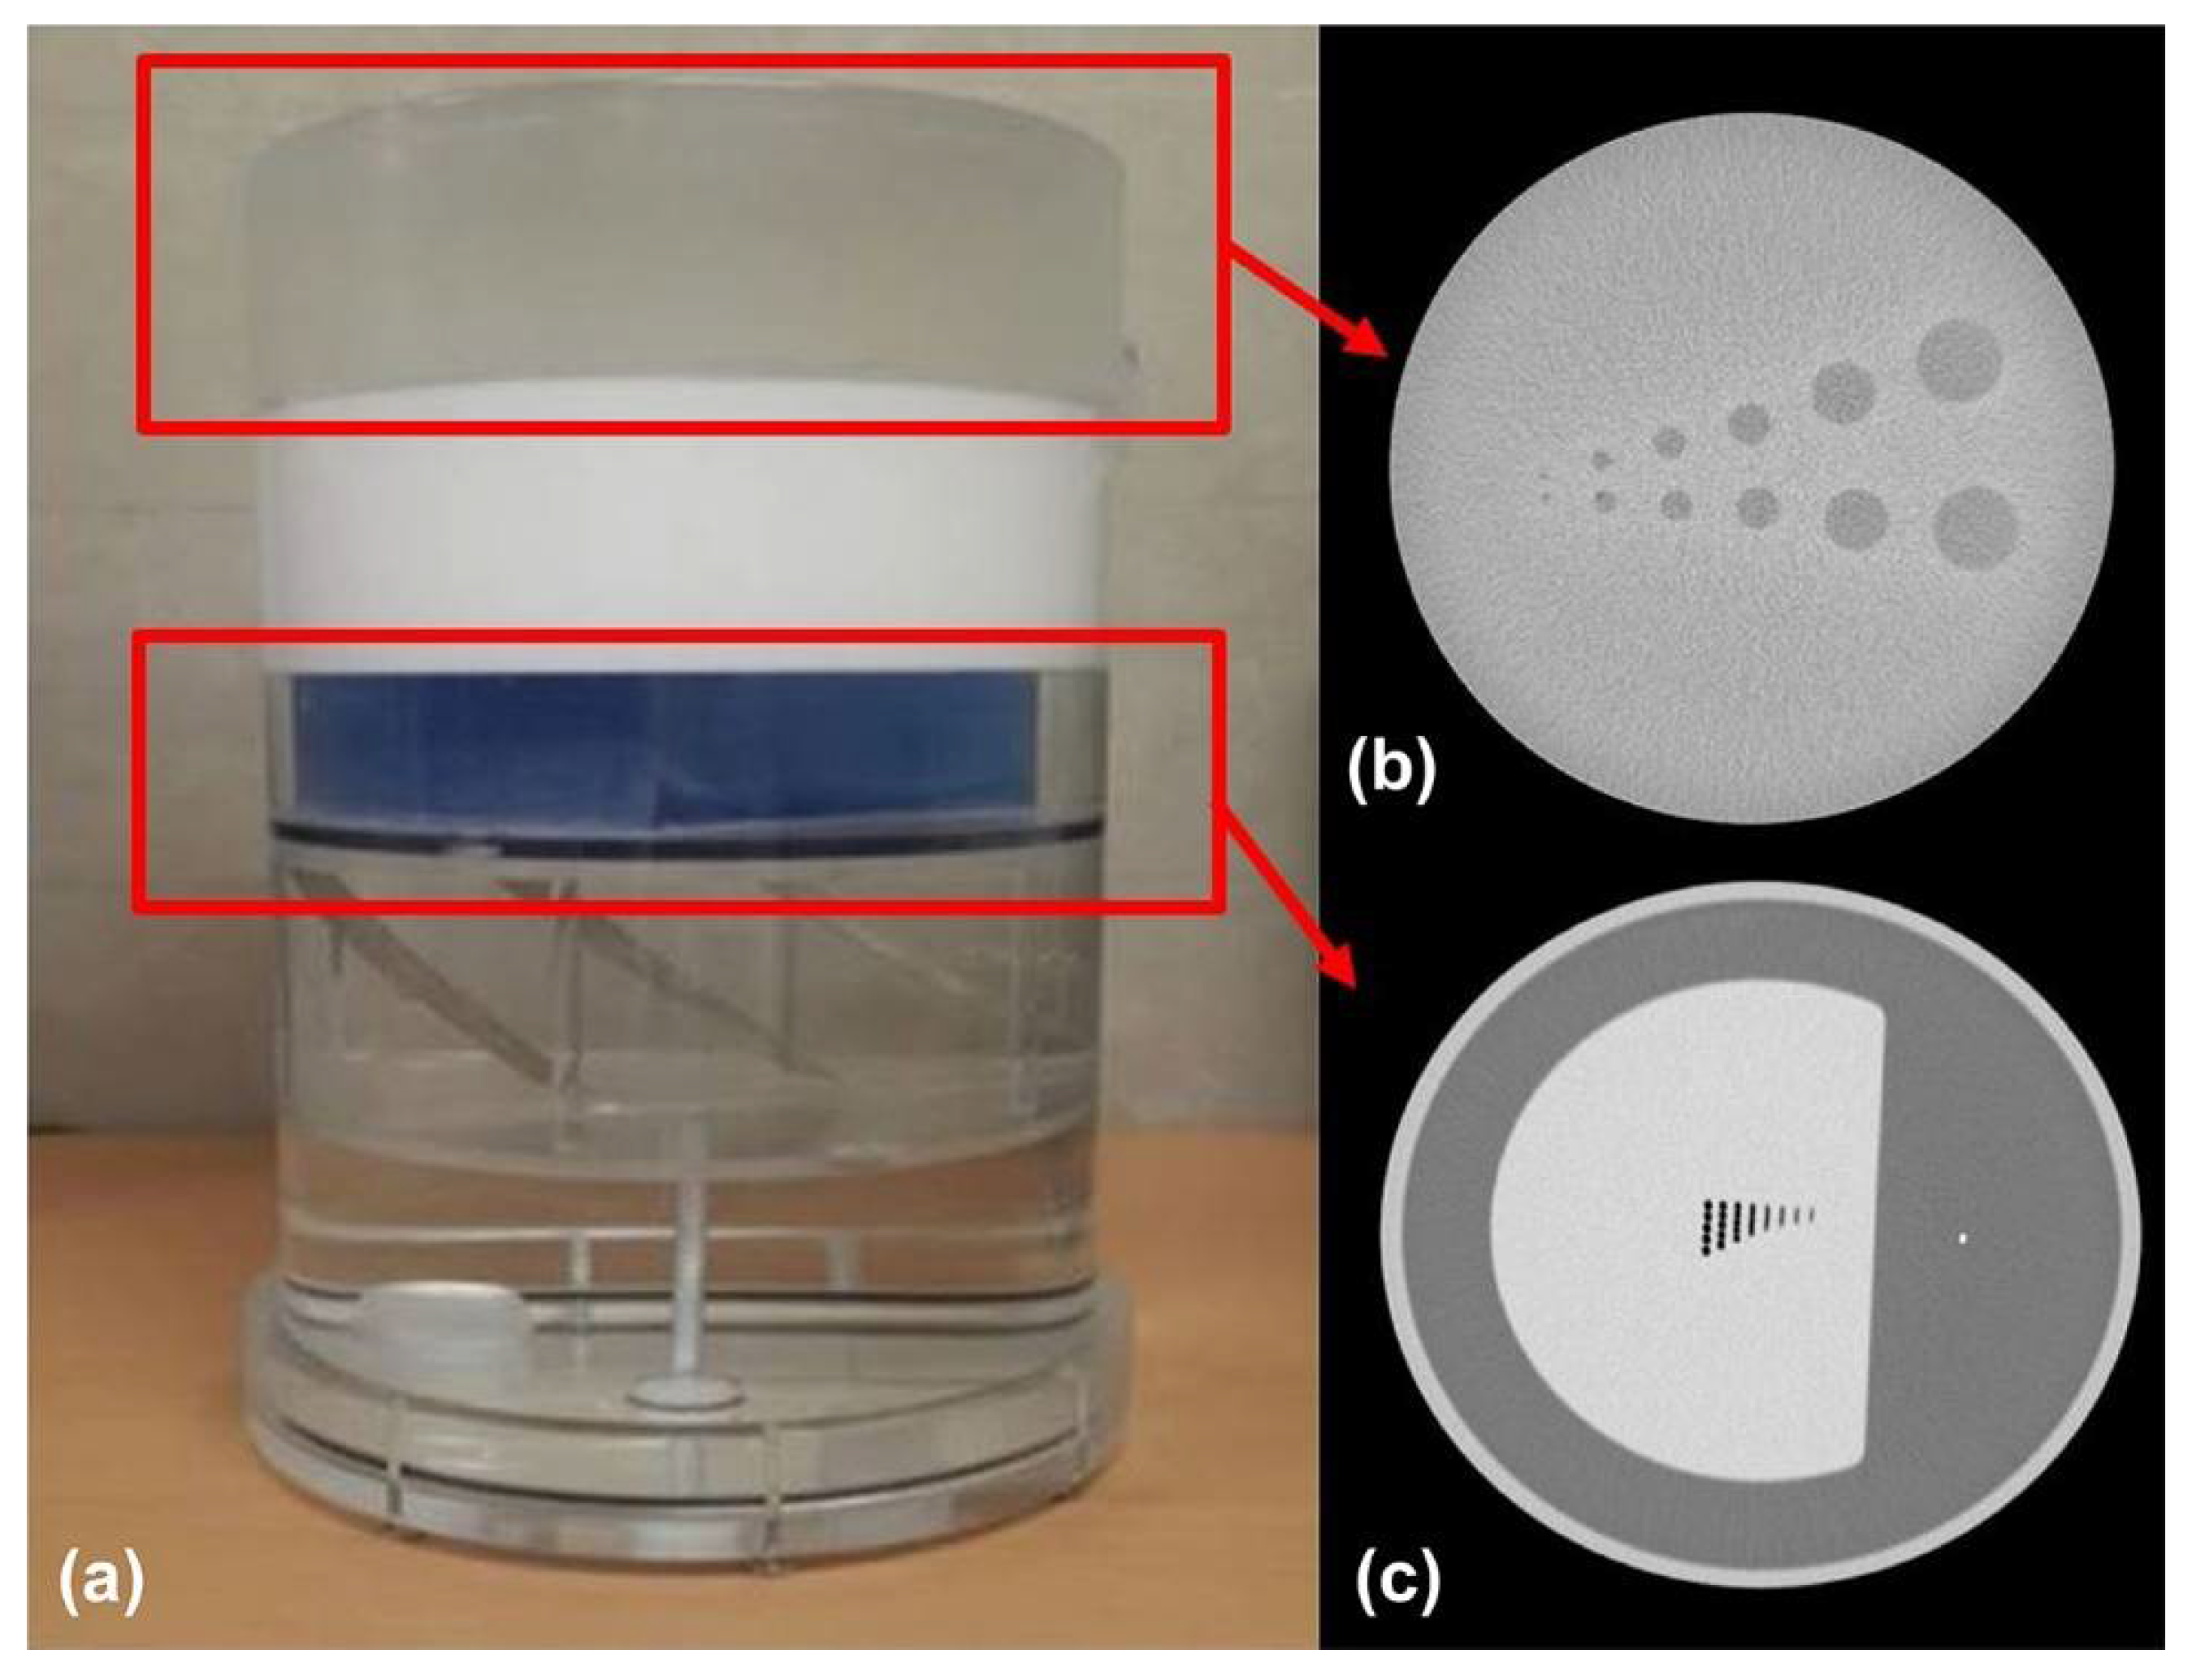
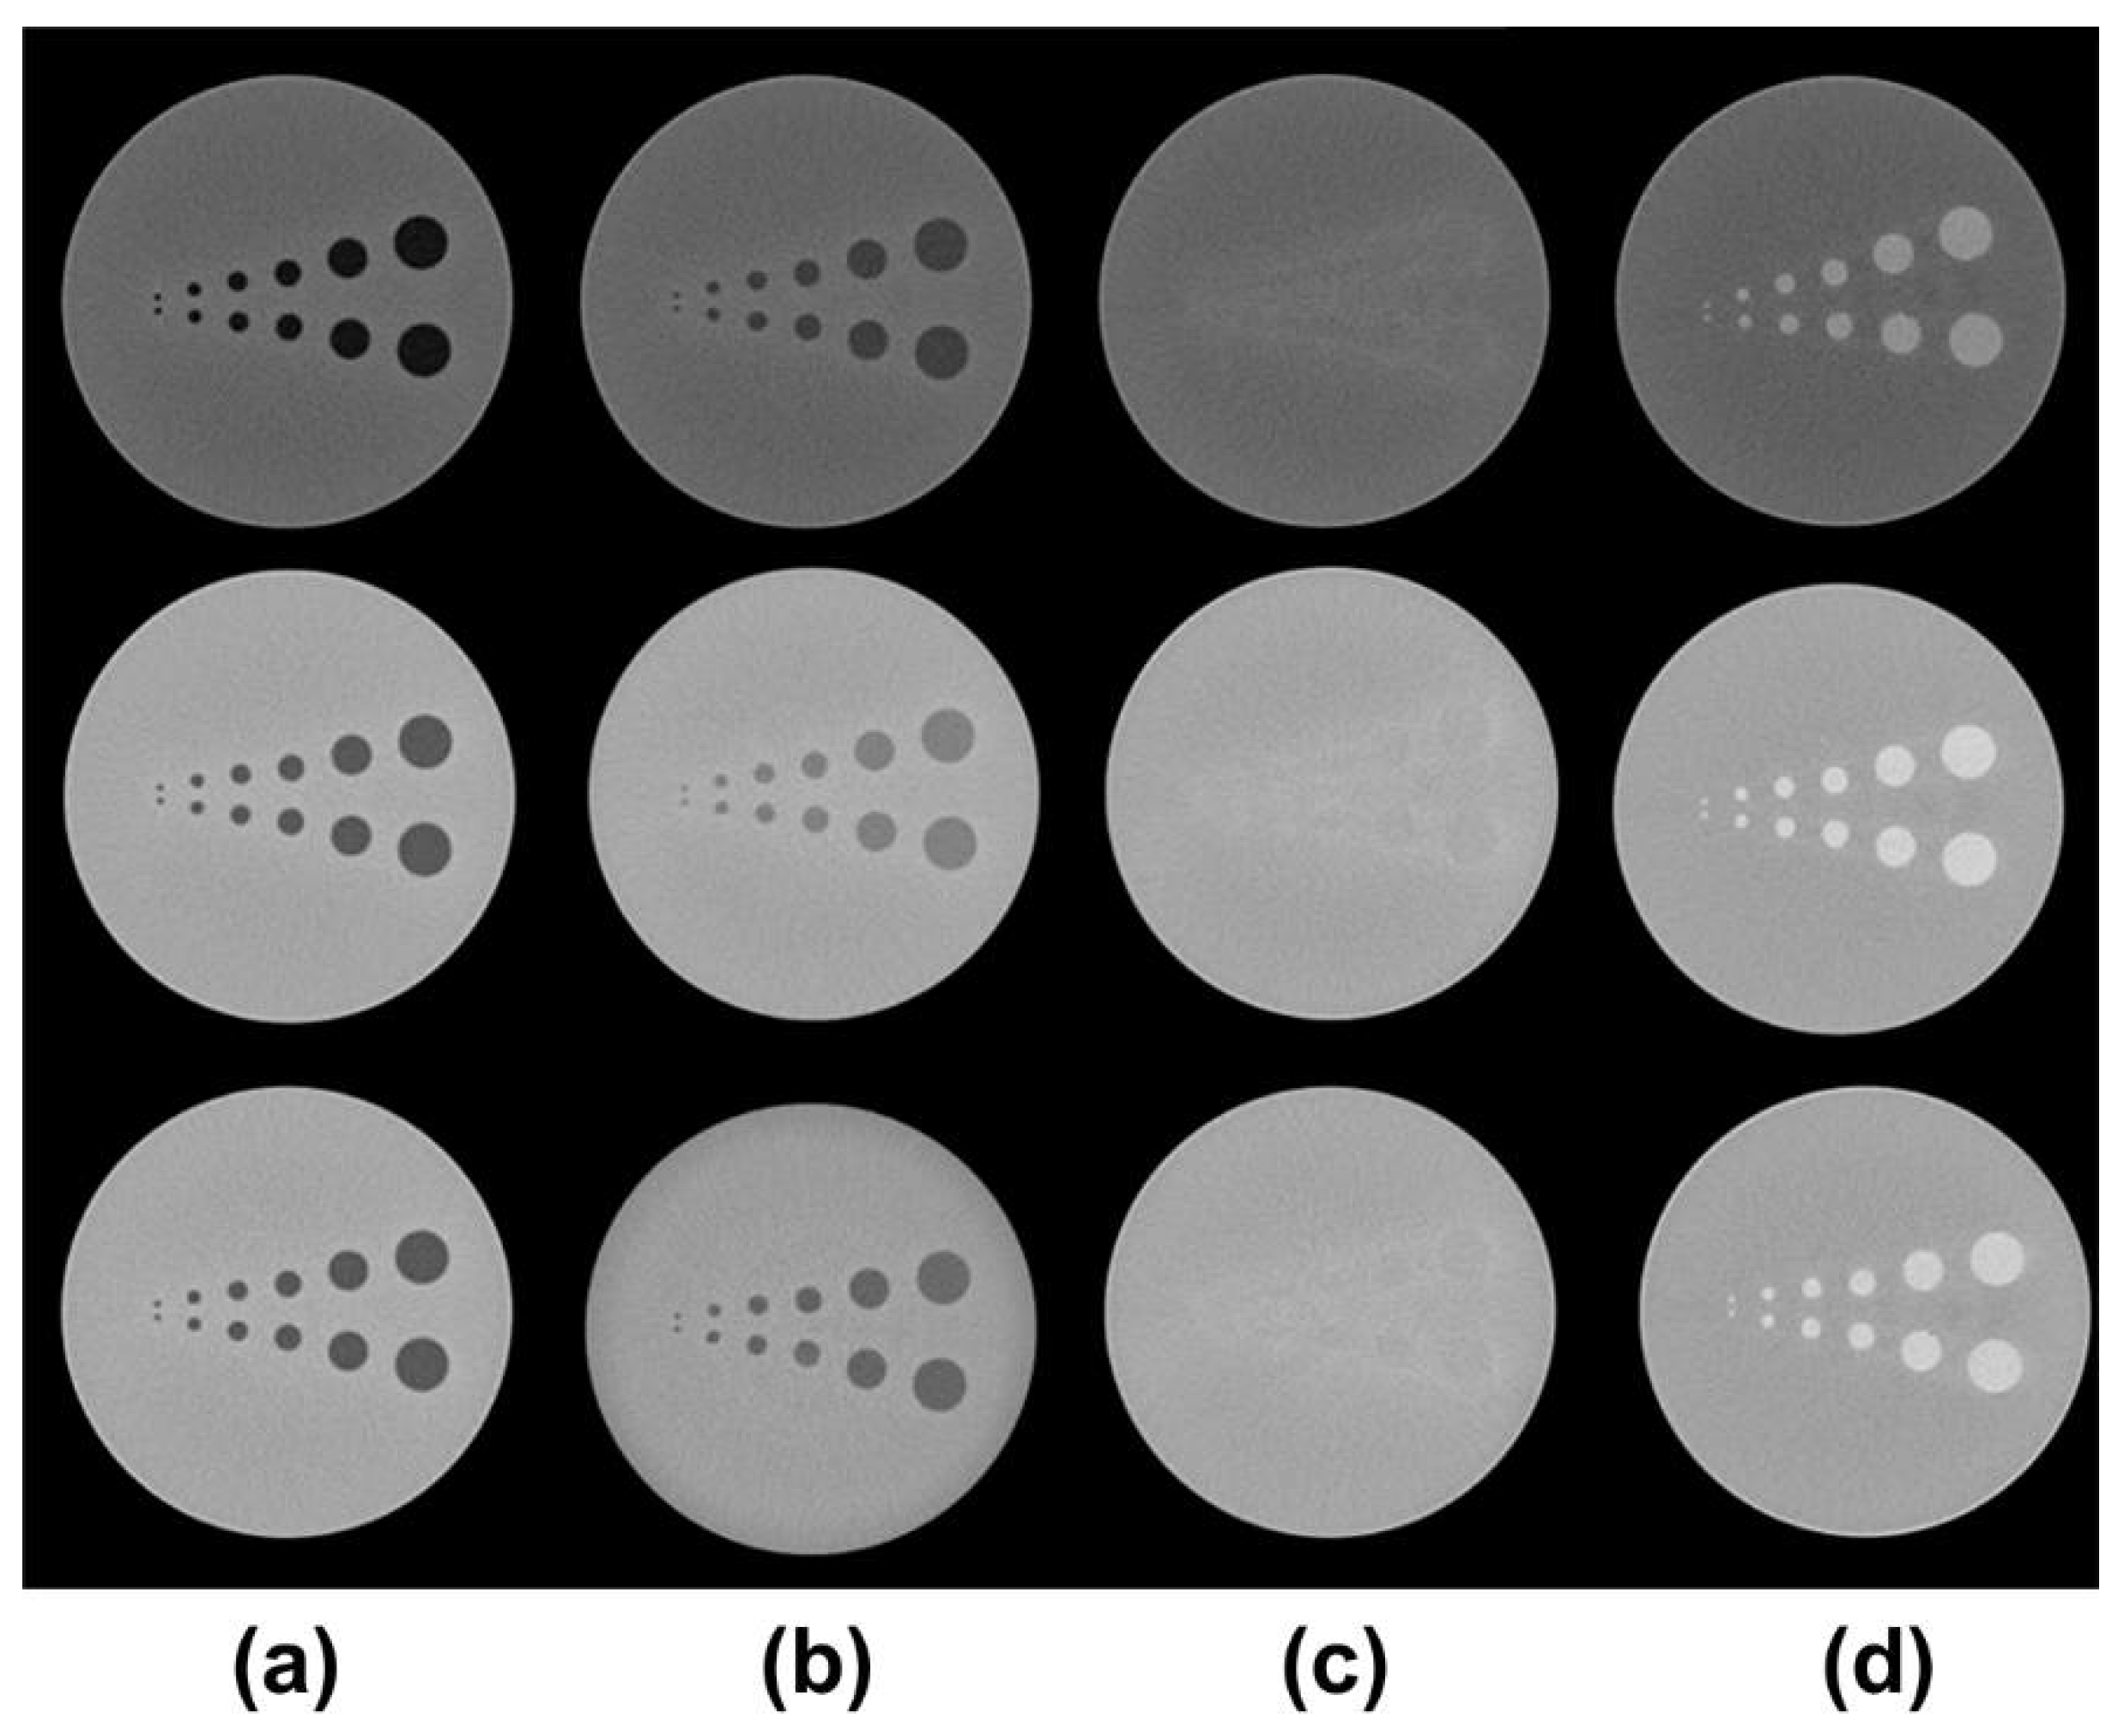
2.3. Acquisition Method of CR Images
2.4. Acquisition Method of SR Images
2.5. Quantitative Analysis
2.5.1. Texture Analysis (TA)
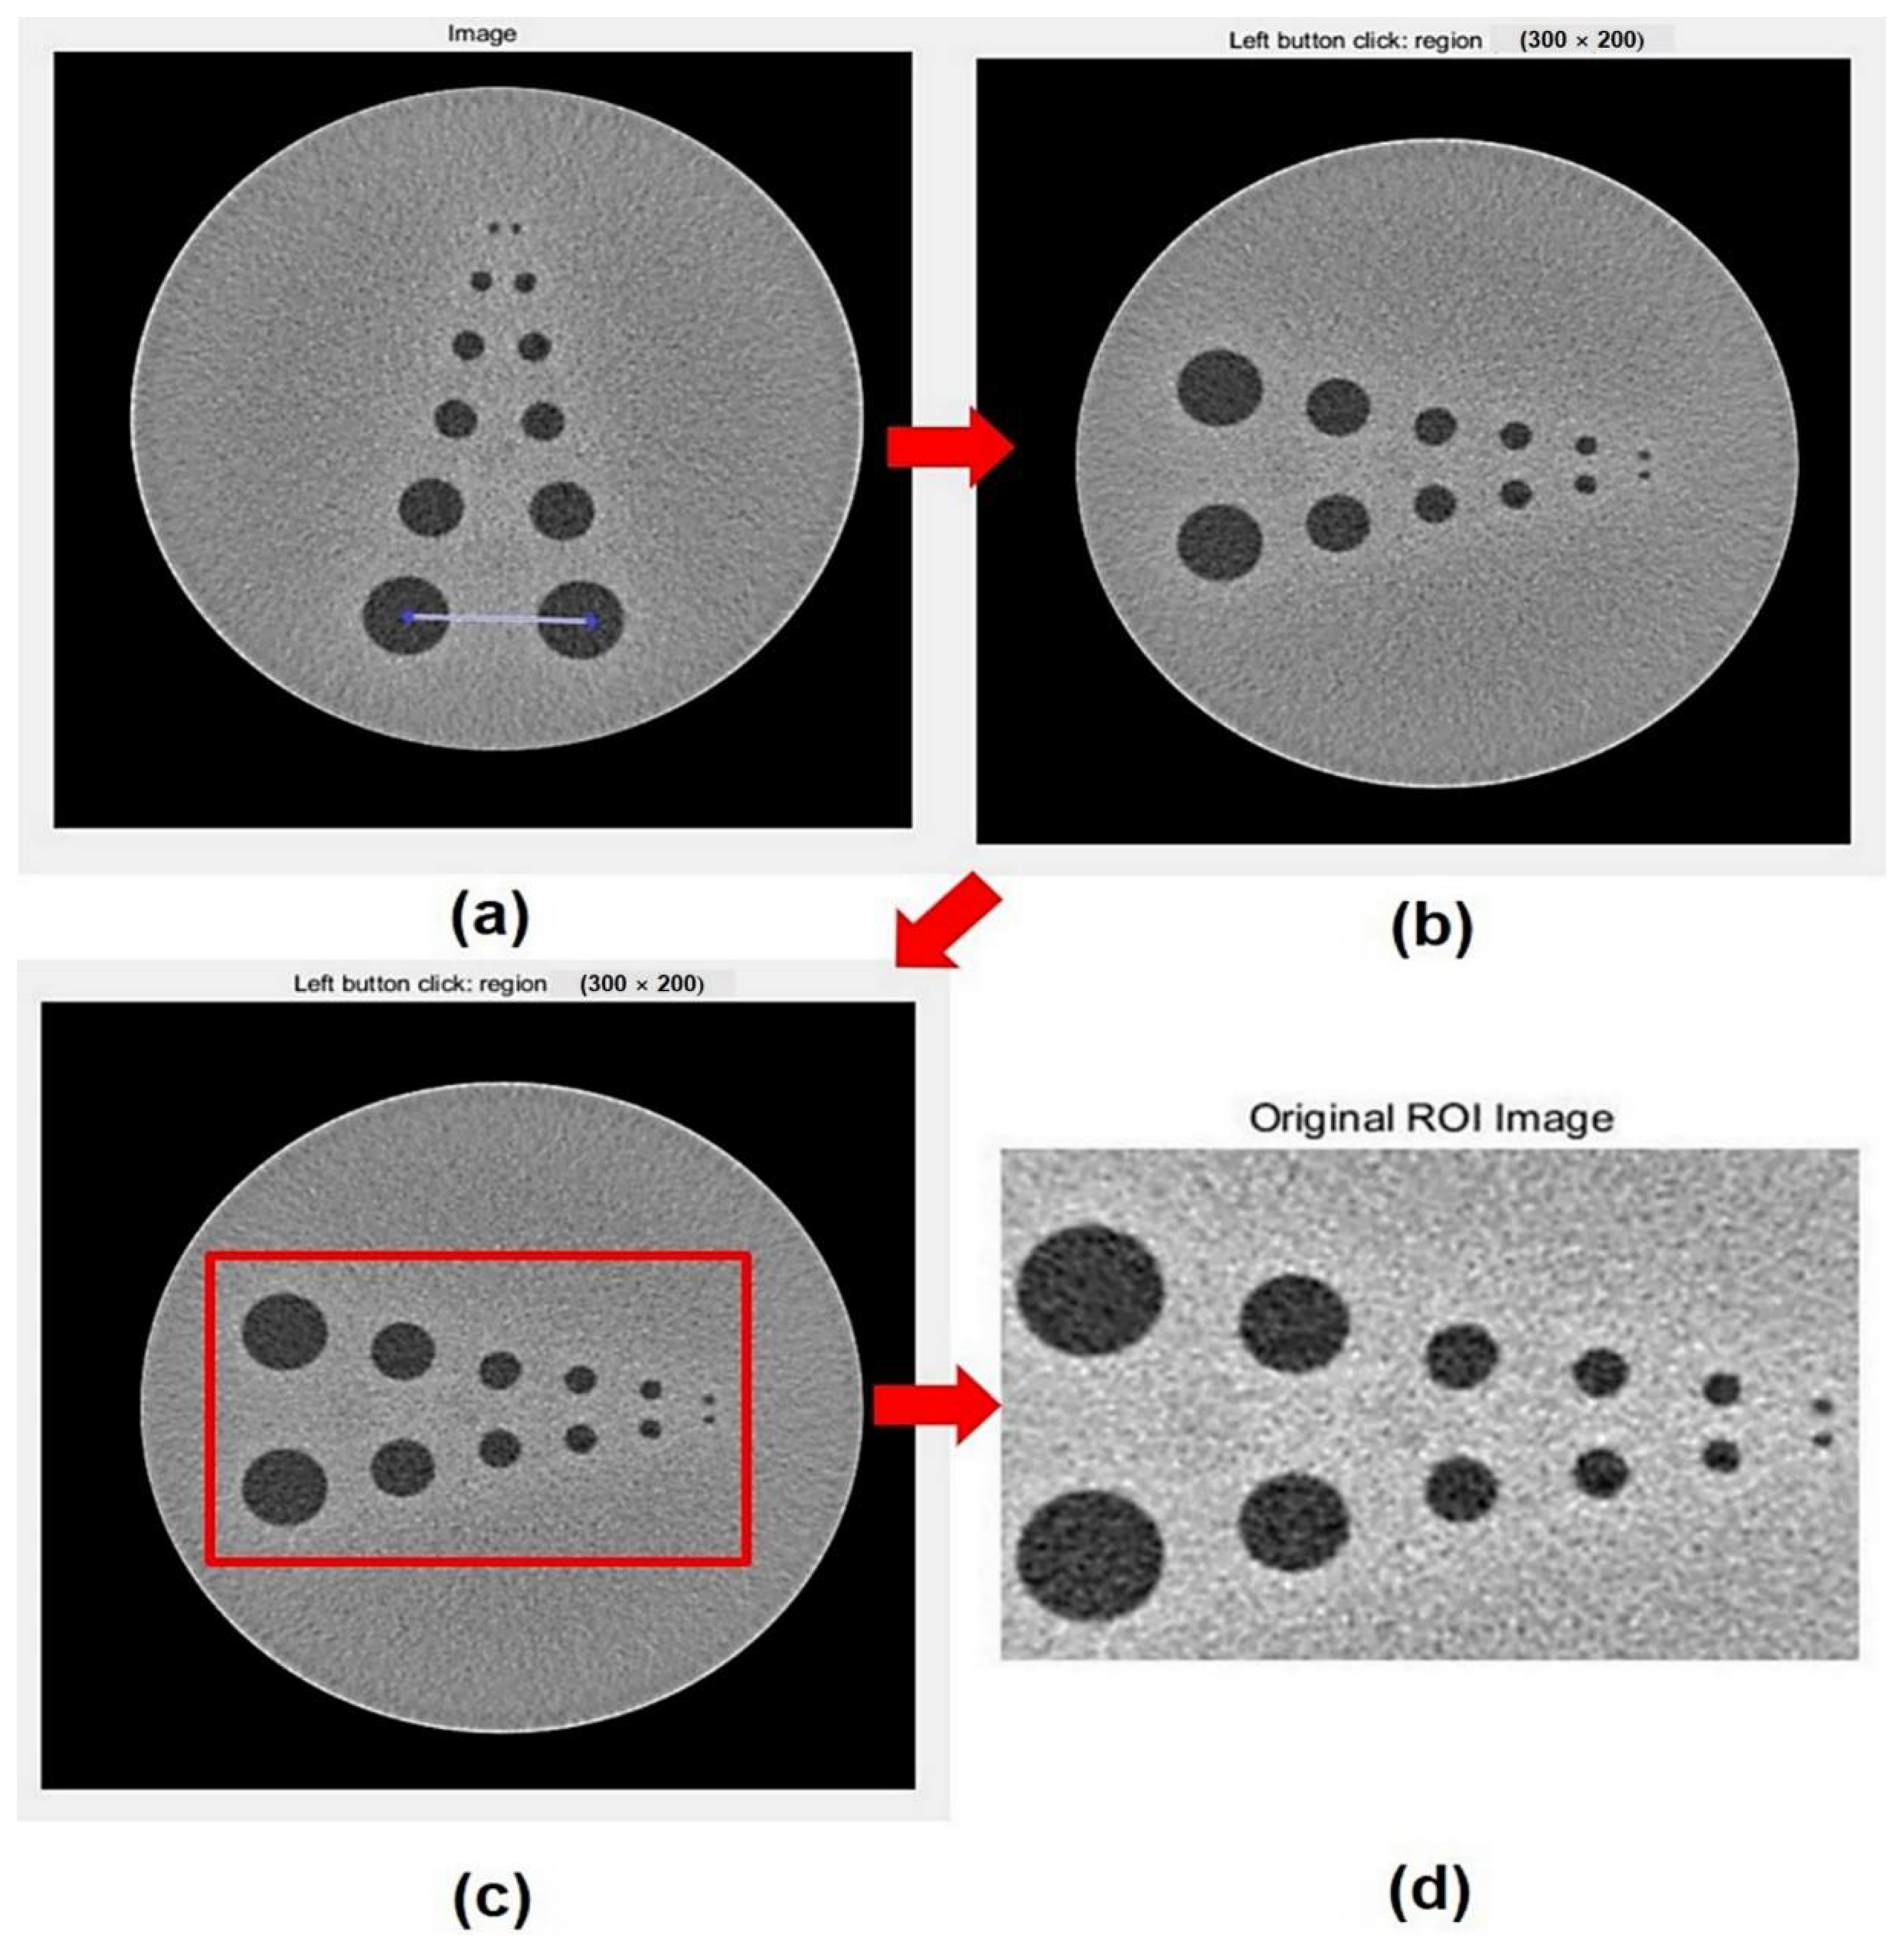
2.5.2. Analysis Method of Image CR
2.5.3. Analysis Method of Image SR
2.6. Statistical Analysis
3. Results
3.1. TA of CR
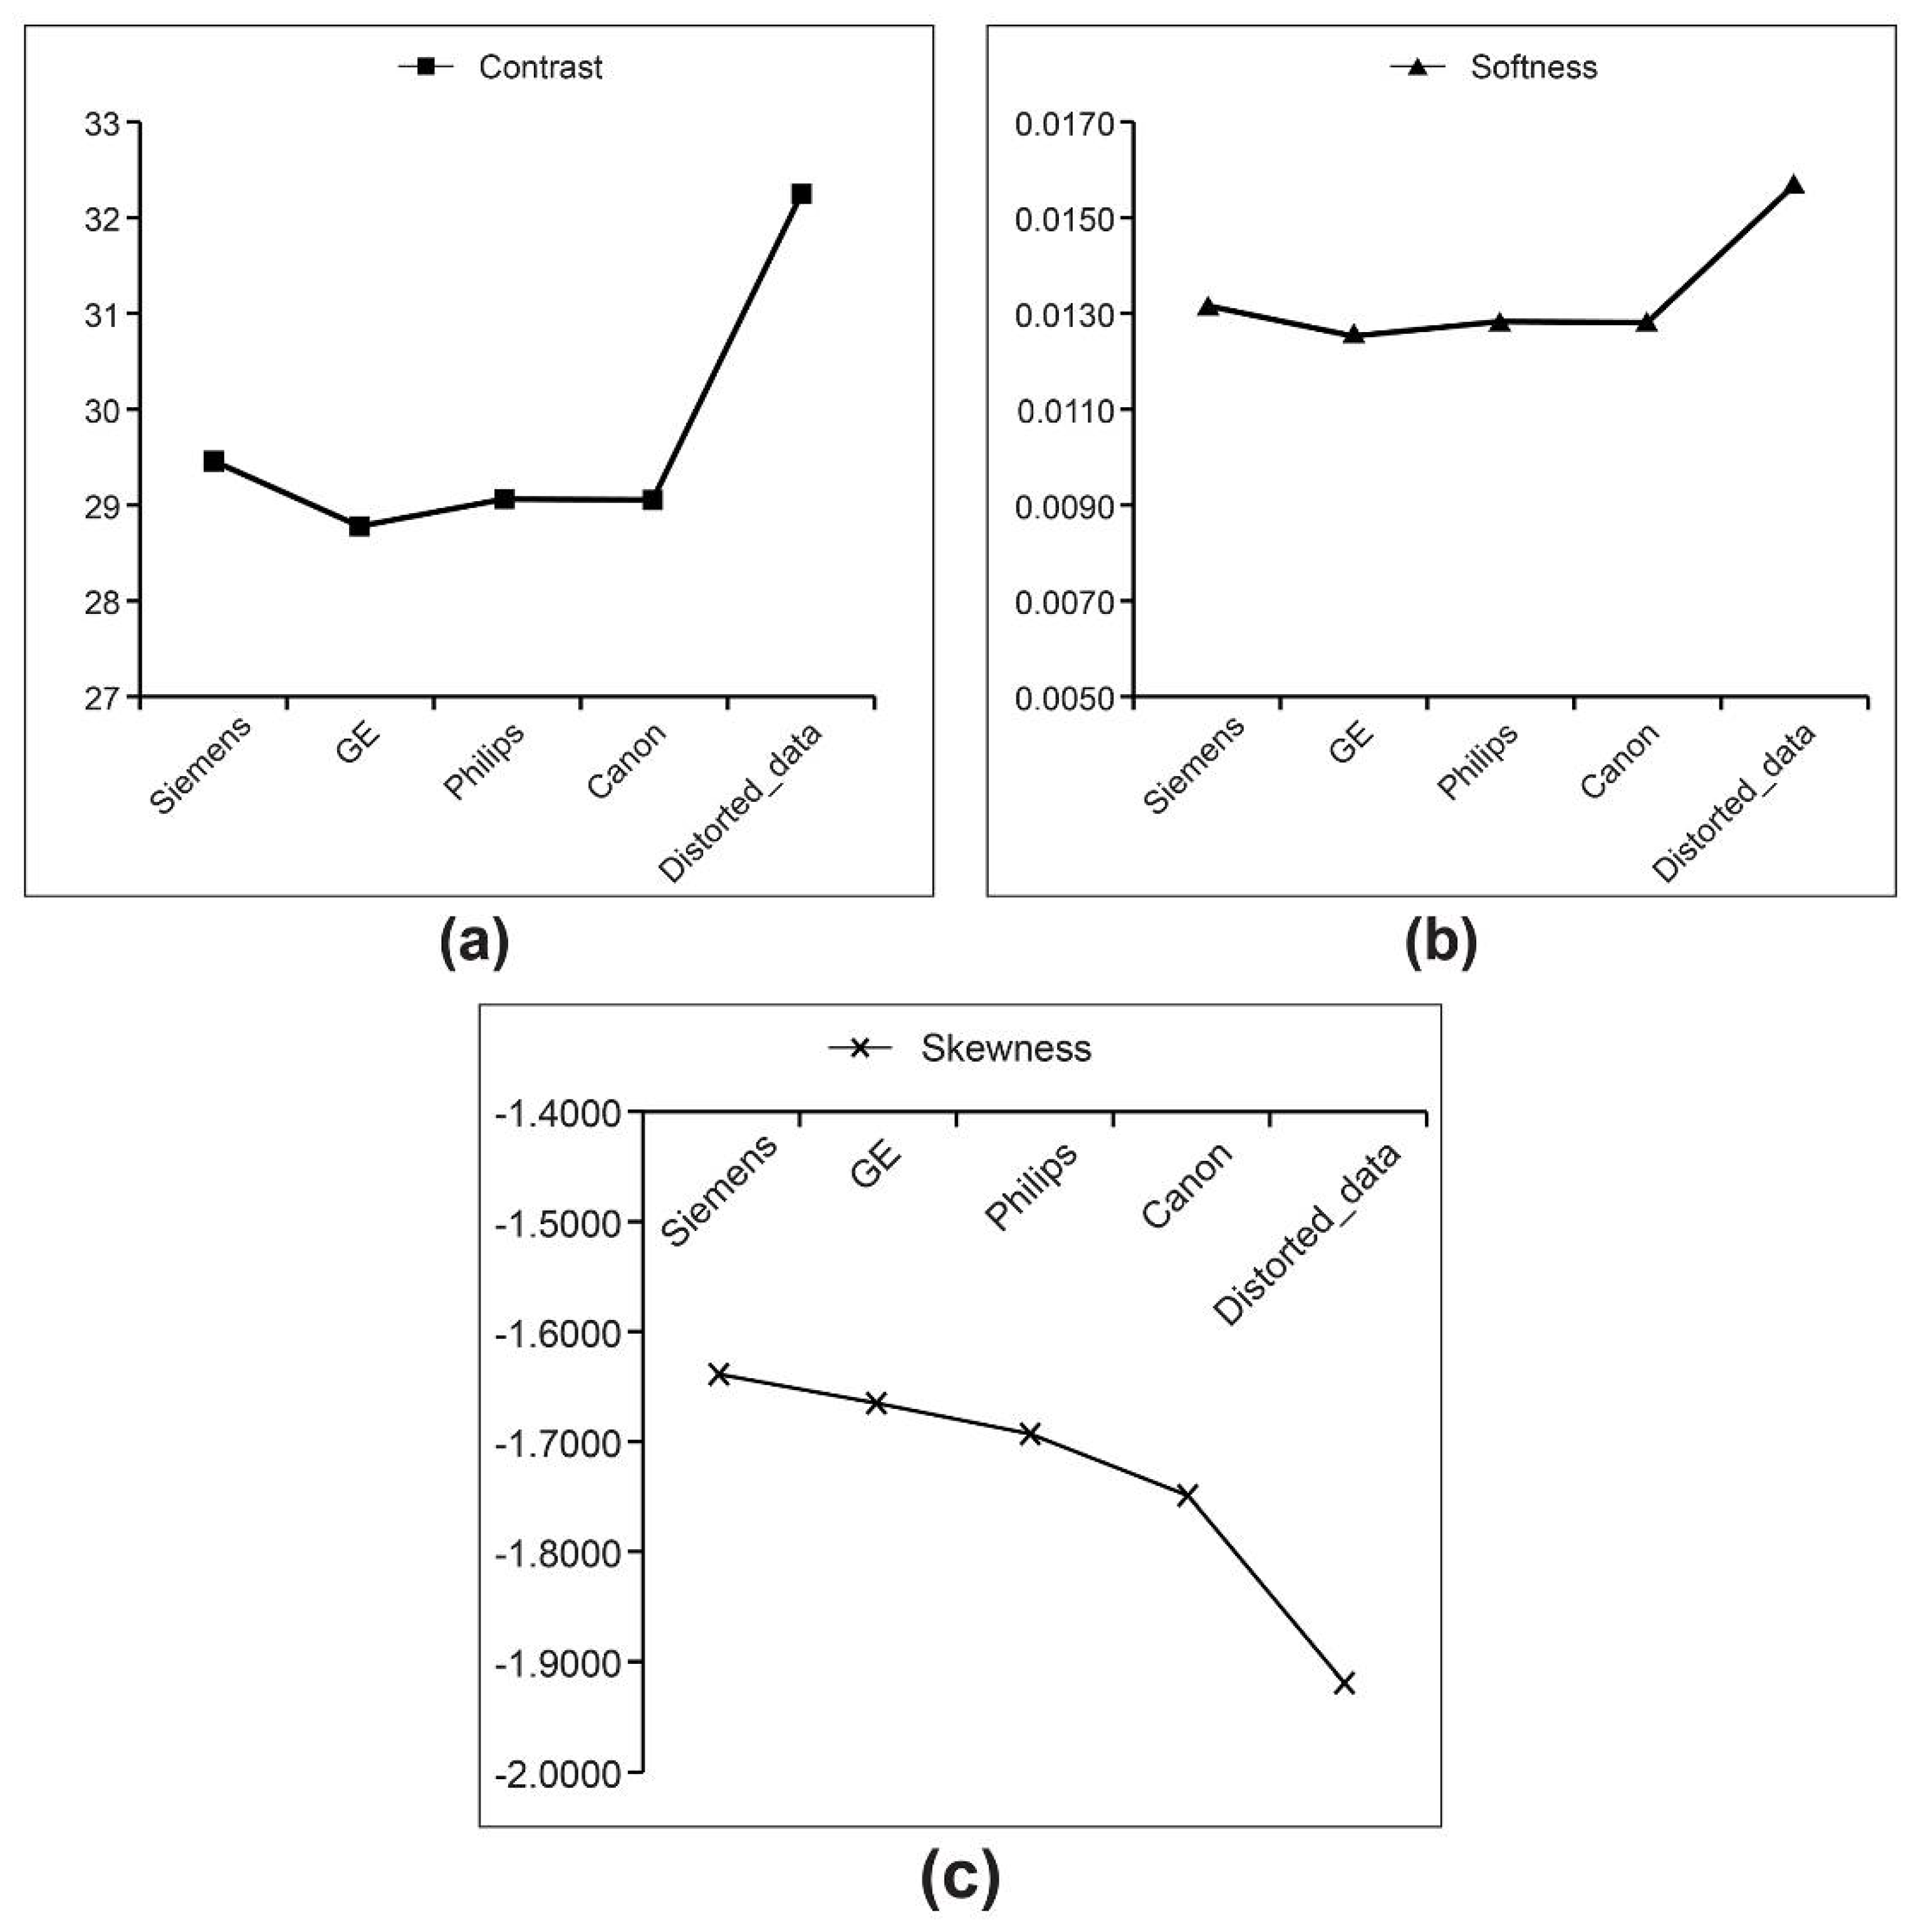
3.2. TA of SR
4. Discussion
5. Conclusions
Author Contributions
Funding
Institutional Review Board Statement
Informed Consent Statement
Data Availability Statement
Acknowledgments
Conflicts of Interest
References
- Zeng, G.L. Medical Image Reconstruction: A Conceptual Tutorial; Springer: Heidelberg, Germany, 2010; pp. 67–85. [Google Scholar]
- Jeong, J.E.; Lee, S.J. Performance comparison of ray-driven system models in model-based iterative reconstruction for transmission computed tomography. J. Biomed. Eng. Res. 2014, 35, 142–150. [Google Scholar] [CrossRef]
- Amis, E.S., Jr.; Butler, P.F.; Applegate, K.E.; Birnbaum, S.B.; Brateman, L.F.; Hevezi, J.M.; Mettler, F.A.; Morin, R.L.; Pentecost, M.J.; Smith, G.G.; et al. American College of Radiology white paper on radiation dose in medicine. J. Am. Coll. Radiol. 2007, 4, 272–284. [Google Scholar] [CrossRef]
- Do, K.H.; Sung, D.W. Strategies of computed tomography radiation dose reduction: Justification and optimization. J. Korean Med. Assoc. 2015, 58, 534–541. [Google Scholar] [CrossRef]
- Shefer, E.; Altman, A.; Behling, R.; Goshen, R.; Gregorian, L.; Roterman, Y.; Uman, I.; Wainer, N.; Yagil, Y.; Zarchin, O. State of the art of CT detectors and sources: A literature review. Curr. Radiol. Rep. 2013, 1, 76–91. [Google Scholar] [CrossRef]
- Geyer, L.L.; Glenn, G.R.; De Cecco, C.N.; Van Horn, M.; Canstein, C.; Silverman, J.R.; Krazinski, A.W.; Kemper, J.M.; Bucher, A.; Ebersberger, U.; et al. CT Evaluation of small-diameter coronary artery stents: Effect of an integrated circuit detector with iterative reconstruction. Radiology 2015, 276, 706–714. [Google Scholar] [CrossRef] [PubMed]
- Zhu, Z.; Zhao, X.M.; Zhao, Y.F.; Wang, X.Y.; Zhou, C.W. Feasibility study of using Gemstone Spectral Imaging (GSI) and adaptive statistical iterative reconstruction (ASIR) for reducing radiation and iodine contrast dose in abdominal CT patients with high BMI values. PLoS ONE 2015, 10, e0129201. [Google Scholar] [CrossRef]
- Kalra, M.K.; Maher, M.M.; Toth, T.L.; Hamberg, L.M.; Blake, M.A.; Shepard, J.A.; Saini, S. Strategies for CT radiation dose optimization. Radiology 2004, 230, 619–628. [Google Scholar] [CrossRef] [PubMed]
- Lee, K.; Lee, W.; Lee, J.; Lee, B.; Oh, G. Dose reduction and image quality assessment in MDCT using AEC (D-DOM & Z-DOM) and in-plane bismuth shielding. Radiat. Prot. Dosimetry 2010, 141, 162–167. [Google Scholar] [CrossRef] [PubMed]
- Gunn, M.L.D.; Kohr, J.R. State of the art: Technologies for computed tomography dose reduction. Emerg Radiol. 2010, 17, 209–218. [Google Scholar] [CrossRef]
- Brenner, D.J.; Hall, E.J. Computed tomography—An increasing source of radiation exposure. N. Engl. J. Med. 2007, 357, 2277–2284. [Google Scholar] [CrossRef] [PubMed]
- Larson, D.B.; Johnson, L.W.; Schnell, B.M.; Salisbury, S.R.; Forman, H.P. National trends in CT use in the emergency department: 1995–2007. Radiology 2011, 258, 164–173. [Google Scholar] [CrossRef]
- ICRP; Rehani, M.M.; Gupta, R.; Bartling, S.; Sharp, G.C.; Pauwels, R.; Berris, T.; Boon, J.M. Radiological protection in cone beam computed tomography (CBCT). ICRP publication 129. Ann. ICRP 2015, 44, 9–127. [Google Scholar] [CrossRef]
- Park, H.J.; Jung, S.E.; Lee, Y.J.; Cho, W.I.; Do, K.H.; Kim, S.H.; Na, D.G. Review of failed CT phantom image evaluations in 2005 and 2006 by the CT accreditation program of the korean institute for accreditation of medical image. Korean J. Radiol. 2008, 9, 354–363. [Google Scholar] [CrossRef]
- New Jersey Department of Environmental Protection. Compliance Guidance for Computed Tomography Quality Control, 2nd ed.; Bureau of X-ray Compliance: Trenton, NJ, USA. Available online: https://www.state.nj.us/dep/rpp/qa/qa_down/qaman.pdf (accessed on 19 December 2020).
- European Commission. Radiation protection N° 162: Criteria for Acceptability of Medical Radiological Equipment Used in Diagnostic Radiology, Nuclear Medicine and Radiotherapy. Quality Assurance Reference Centre for the European Commission 2012. Available online: https://ec.europa.eu/energy/sites/ener/files/documents/162.pdf (accessed on 28 March 2021).
- ACR Committee on CT Accreditation, 2017 Computed Tomography Quality Control Manual; American College of Radiology: Reston, VA, USA; Available online: https://www.acr.org/-/media/ACR/NOINDEX/QC-Manuals/CT_QCManual.pdf/ (accessed on 23 February 2021).
- Lee, K.B.; Cho, Y.B.; Jeong, H.K.; Nam, K.C.; Kim, H.C. The study on automatized quantitative assessment method of CT Image in quality control: Focusing on spatial and low contrast resolution. J. IEIE 2017, 54, 186–194. [Google Scholar] [CrossRef]
- Sharp, P.; Barber, D.C.; Brown, D.G.; Burgess, A.E.; Metz, C.E.; Myers, K.J.; Taylor, C.J.; Wagner, R.F.; Brooks, R.; Hill, C.R.; et al. ICRU Report 54. Medical imaging—the assessment of image quality. Rep. Int. Comm. Radiat. Units Meas. 1996, os28, 1–41. [Google Scholar] [CrossRef]
- Lee, K.B.; Goo, H.W. Quantitative image quality and histogram-based evaluations of an iterative reconstruction algorithm at low-to-ultralow radiation dose levels: A phantom study in chest CT. Korean J. Radiol. 2018, 19, 119–129. [Google Scholar] [CrossRef]
- Hodgdon, T.; McInnes, M.D.F.; Schieda, N.; Flood, T.A.; Lamb, L.; Thornhill, R.E. Can quantitative CT texture analysis be used to differentiate fat-poor renal angiomyolipoma from renal cell carcinoma on unenhanced CT images? Radiology 2015, 276, 787–796. [Google Scholar] [CrossRef] [PubMed]
- Wang, X.; Yuan, M.; Mi, H.; Suo, S.; Eteer, K.; Li, S.; Lu, Q.; Xu, J.; Hu, J. The feasibility of differentiating colorectal cancer from normal and inflammatory thickening colon wall using CT texture analysis. Sci. Rep. 2020, 10, 6346. [Google Scholar] [CrossRef] [PubMed]
- Ganeshan, B.; Miles, K.A. Quantifying tumour heterogeneity with CT. Cancer Imaging 2013, 13, 140–149. [Google Scholar] [CrossRef] [PubMed]
- Andersen, M.B.; Harders, S.W.; Ganeshan, B.; Thygesen, J.; Torp Madsen, H.H.; Rasmussen, F. CT texture analysis can help differentiate between malignant and benign lymph nodes in the mediastinum in patients suspected for lung cancer. Acta Radiol. 2016, 57, 669–676. [Google Scholar] [CrossRef]
- Bharati, M.H.; Liu, J.J.; MacGregor, J.F. Image texture analysis: Methods and comparisons. Chemom. Intell. Lab. Syst. 2004, 72, 57–71. [Google Scholar] [CrossRef]
- Di Cataldo, S.; Ficarra, E. Mining textural knowledge in biological images: Applications, methods and trends. Comput. Struct. Biotechnol. J. 2016, 15, 56–67. [Google Scholar] [CrossRef] [PubMed]
- Miles, K.A.; Ganeshan, B.; Hayball, M.P. CT texture analysis using the filtration-histogram method: What do the measurements mean? Cancer Imaging 2013, 13, 400–406. [Google Scholar] [CrossRef] [PubMed]
- Saiprasad, G.; Filliben, J.; Peskin, A.; Siegel, E.; Chen, J.; Trimble, C.; Yang, Z.; Christianson, O.; Samei, E.; Krupinski, E.; et al. Evaluation of low-contrast detectability of iterative reconstruction across multiple institutions, CT scanner manufacturers, and radiation exposure levels. Radiology 2015, 277, 124–133. [Google Scholar] [CrossRef] [PubMed]
- Srinivasan, G.N.; Shobha, G. Statistical texture analysis. Proc. World Acad. Sci. Eng. Technol. 2008, 36, 2070–3740. [Google Scholar]
- Bevk, M.; Kononenko, I. A Statistical approach to texture description of medical images: A preliminary study. In Proceedings of the 15th IEEE Symposium Computer-Based Medical Systems (CBMS 2002), Maribor, Slovenia, 4–7 June 2002; pp. 239–244. [Google Scholar] [CrossRef]
- Gonzalez, R.C.; Woods, R.E.; Eddins, S.L. Digital Image Processing Using MATLAB, 2nd ed.; Gatesmark Publishing: Knoxville, TN, USA, 2009; pp. 535–655. [Google Scholar]
- Abbasian Ardakani, A.A.; Gharbali, A.; Mohammadi, A. Application of texture analysis method for classification of benign and malignant thyroid nodules in ultrasound images. Iran. J. Cancer Prev. 2015, 8, 116–124. [Google Scholar] [CrossRef]
- Lee, J.; Im, I.; Yu, Y.; Park, H.; Kwak, B. Statistical techniques based computer-aided diagnosis (CAD) using texture feature analysis: Applied of cerebral infarction in computed tomography (CT) images. Biomed. Sci. Lett. 2012, 18, 399–405. [Google Scholar]
- Principal Components Analysis (PCA) Using SPSS Statistics. Available online: https://statistics.laerd.com/spss-tutorials/principal-components-analysis-pca-using-spss-statistics.php/ (accessed on 21 December 2020).
- Thilander-Klang, A.; Ledenius, K.; Hansson, J.; Sund, P.; Båth, M. Evaluation of subjective assessment of the low-contrast visibility in constancy control of computed tomography. Radiat. Prot. Dosim. 2010, 139, 449–454. [Google Scholar] [CrossRef]
- McCollough, C.H.; Bruesewitz, M.R.; McNitt-Gray, M.F.; Bush, K.; Ruckdeschel, T.; Payne, J.T.; Brink, J.A.; Zeman, R.K.; American College of Radiology. The phantom portion of the American College of Radiology (ACR) Computed Tomography (CT) accreditation program: Practical tips, artifact examples, and pitfalls to avoid. Med. Phys. 2004, 31, 2423–2442. [Google Scholar] [CrossRef]
- American College of Radiology. Computed Tomography Accreditation Program Phantom Testing Instructions. Available online: http://www.doza.ru/docs/med/phantom_testing_instruction.pdf (accessed on 20 December 2020).
- Boone, J.M.; Brink, J.A.; Huda, W.; Leitz, W.; McCollough, C.H.; McNitt-Gray, M.F.; Dawson, P.; Deluca, P.L.M.; Seltzer, S.M.; Brunberg, J.A.; et al. Radiation dose and image-quality assessment in computed tomography. J. ICRU 2012, 12, 9–149. [Google Scholar] [CrossRef]
- Gulliksrud, K.; Stokke, C.; Martinsen, A.C.T. How to measure CT image quality: Variations in CT-numbers, uniformity and low contrast resolution for a CT quality assurance phantom. Phys. Med. 2014, 30, 521–526. [Google Scholar] [CrossRef] [PubMed]


| Manufacturer | Model | Tube Voltage | Rotation Time | Slice Thickness | Convolution Kernel | Tube Current | CTDIvol |
|---|---|---|---|---|---|---|---|
| kVp | s | mm | mA | mGy | |||
| Siemens | Edge | 120 | 1 | 10 | B30f | 274 | 19.95 |
| AS+ | 300 | 19.92 | |||||
| AS | 300 | 19.92 | |||||
| GE | CT750 HD | Standard | 225 | 19.85 | |||
| VCT XTe | 235 | 19.9 | |||||
| Philips | IQon | B | 230 | 20 | |||
| Brilliance | 305 | 20 | |||||
| Canon | GENESIS | FC13 | 350 | 19.9 | |||
| Aquilion CX | 170 | 20 |
| Definition | Equation | Description | Characteristics |
|---|---|---|---|
| Brightness | Mean gray level (pixel value) of the image (equal to the mean value in the histogram) | ||
| Contrast | Variance from the mean value | ||
| Softness | Softness is a relative measure of image brightness | The softness index closer to 0 represents an image with more constant brightness | |
| Skewness | Degree of asymmetry of the histogram | If the histogram is symmetrical, the skewness index is 0. If high pixel values are located to the right or left from the mean value, the skewness is a positive or negative value | |
| Uniformity | Similarity of gray levels | Uniformity is at its highest when light and shade are distributed uniformly throughout the figure | |
| Randomness | Entropy | Randomness is at its lowest under the same conditions |
| MF | Model | CC | Brightness ‡ | Contrast ‡ | Softness ‡ | Skewness ‡ | Uniformity ‡ | Randomness ‡ |
|---|---|---|---|---|---|---|---|---|
| Siemens | AS | 0.02 | 127.65 ± 2.02 | 30.56 ± 1.60 | 0.0146 ± 0.0016 | 0.0024 ± 0.0125 | 0.0533 ± 0.0018 | 4.4426 ± 0.0453 |
| AS+ | 0.02 | 125.26 ± 4.65 | 30.53 ± 1.40 | 0.0141 ± 0.0013 | 0.0014 ± 0.0153 | 0.0568 ± 0.0022 | 4.3486 ± 0.0588 | |
| EDGE | 0.02 | 125.06 ± 5.16 | 30.58 ± 1.54 | 0.0142 ± 0.0014 | 0.0022 ± 0.0076 | 0.0573 ± 0.0011 | 4.3382 ± 0.0249 | |
| p-value * | 0.047 | 0.996 | 0.760 | 0.887 | <0.001 | <0.001 | ||
| GE | CT750HD | 0.015 | 159.79 ± 3.52 | 28.94 ± 1.11 | 0.0127 ± 0.0010 | −0.2475 ± 0.0344 | 0.0367 ± 0.0004 | 5.0469 ± 0.0111 |
| VCT XTe | 0.015 | 135.61 ± 2.79 | 29.91 ± 1.01 | 0.0136 ± 0.0009 | −0.0621 ± 0.0050 | 0.0419 ± 0.0007 | 4.8016 ± 0.0215 | |
| p-value † | <0.001 | 0.084 | 0.084 | <0.001 | <0.001 | <0.001 | ||
| Philips | IQon | 0.015 | 125.04 ± 3.01 | 28.73 ± 1.58 | 0.0122 ± 0.0013 | −0.0363 ± 0.0180 | 0.0362 ± 0.0004 | 5.0213 ± 0.0190 |
| Brilliance | 0.02 | 115.10 ± 5.44 | 30.04 ± 1.28 | 0.0145 ± 0.0016 | 0.2210 ± 0.0634 | 0.0388 ± 0.0012 | 4.9402 ± 0.0534 | |
| p-value † | <0.001 | 0.061 | 0.055 | <0.001 | <0.001 | <0.001 | ||
| Canon | GENESIS | 0.02 | 123.95 ± 2.69 | 28.83 ± 1.05 | 0.0126 ± 0.0009 | 0.0170 ± 0.0043 | 0.0425 ± 0.0002 | 4.7843 ± 0.0051 |
| Aquilion CX | 0.015 | 122.20 ± 2.98 | 28.99 ± 1.16 | 0.0130 ± 0.0009 | 0.0278 ± 0.0064 | 0.0368 ± 0.0002 | 4.9948 ± 0.0191 | |
| p-value † | 0.271 | 0.793 | 0.407 | <0.001 | <0.001 | <0.001 |
| MF | Brightness | Contrast | Softness | Skewness | Uniformity | Randomness |
|---|---|---|---|---|---|---|
| Siemens * | 235.24 ± 1.00 | 29.45 ± 0.43 | 0.0132 ± 0.0004 | −1.6360 ± 0.0705 | 0.1127 ± 0.0052 | 4.2739 ± 0.0540 |
| GE * | 241.08 ± 0.36 | 28.76 ± 0.45 | 0.0126 ± 0.0004 | −1.6606 ± 0.0765 | 0.1368 ± 0.0067 | 3.8993 ± 0.0441 |
| Philips * | 238.79 ± 0.84 | 29.08 ± 0.54 | 0.0128 ± 0.0005 | −1.6903 ± 0.0885 | 0.1046 ± 0.0038 | 4.2339 ± 0.0644 |
| Canon * | 238.80 ± 0.86 | 29.06 ± 0.47 | 0.0128 ± 0.0004 | −1.7464 ± 0.0826 | 0.0926 ± 0.0035 | 4.3578 ± 0.0447 |
| Distorted data † | 235.26 ± 2.09 | 31.72 ± 1.36 | 0.0153 ± 0.0013 | −1.8544 ± 0.1293 | 0.0882 ± 0.0107 | 4.5971 ± 0.1361 |
| p-value ‡ | <0.001 | <0.001 | <0.001 | <0.001 | <0.001 | <0.001 |
| MF | Models | Brightness | Contrast | Softness | Skewness | Uniformity | Randomness | |
|---|---|---|---|---|---|---|---|---|
| Ap | Siemens | AS | 234.51 ± 0.61 | 29.42 ± 0.27 | 0.0131 ± 0.0002 | −1.6252 ± 0.0457 | 0.1128 ± 0.0061 | 4.2796 ± 0.0548 |
| AS+ | 235.75 ± 1.27 | 29.66 ± 0.49 | 0.0134 ± 0.0004 | −1.6696 ± 0.0827 | 0.1146 ± 0.0060 | 4.2565 ± 0.0677 | ||
| EDGE | 235.36 ± 0.62 | 29.27 ± 0.44 | 0.0130 ± 0.0004 | −1.6117 ± 0.0711 | 0.1109 ± 0.0031 | 4.2863 ± 0.0396 | ||
| p-value * | 0.069 | 0.250 | 0.246 | 0.293 | 0.429 | 0.583 | ||
| GE | HD | 241.29 ± 0.20 | 28.85 ± 0.56 | 0.0126 ± 0.0005 | −1.6725 ± 0.0973 | 0.1407 ± 0.0056 | 3.8776 ± 0.0423 | |
| VCT | 240.87 ± 0.37 | 28.67 ± 0.32 | 0.0125 ± 0.0003 | −1.6487 ± 0.0537 | 0.1328 ± 0.0054 | 3.9210 ± 0.0365 | ||
| p-value † | 0.024 | 0.464 | 0.453 | 0.584 | 0.019 | 0.062 | ||
| Dist_B | Siemens | AS | 236.16 ± 0.57 | 32.18 ± 0.61 | 0.0157 ± 0.0006 | −1.8396 ± 0.0806 | 0.0913 ± 0.0082 | 4.5993 ± 0.1256 |
| AS+ | 232.50 ± 1.49 | 33.00 ± 1.16 | 0.0167 ± 0.0009 | −1.9409 ± 0.1219 | 0.0873 ± 0.0038 | 4.6718 ± 0.0658 | ||
| EDGE | 232.78 ± 0.88 | 32.54 ± 0.63 | 0.0160 ± 0.0061 | −1.9192 ± 0.0613 | 0.0901 ± 0.0028 | 4.6237 ± 0.0425 | ||
| p-value * | <0.001 | 0.600 | 0.590 | 0.121 | 0.400 | 0.296 | ||
| GE | HD | 237.81 ± 0.61 | 30.97 ± 0.44 | 0.0145 ± 0.0004 | −1.8032 ± 0.0498 | 0.1048 ± 0.0078 | 4.3761 ± 0.0793 | |
| VCT | 237.38 ± 0.84 | 31.71 ± 1.14 | 0.0152 ± 0.0011 | −1.8998 ± 0.1301 | 0.1004 ± 0.0036 | 4.4054 ± 0.04300 | ||
| p-value † | 0.291 | 0.145 | 0.142 | 0.105 | 0.206 | 0.411 | ||
| Dist_F | Siemens | AS | 234.59 ± 0.32 | 33.07 ± 1.72 | 0.0166 ± 0.0017 | −1.9463 ± 0.2338 | 0.0856 ± 0.0056 | 4.7064 ± 0.0893 |
| AS+ | 232.47 ± 1.61 | 32.76 ± 0.83 | 0.0162 ± 0.0008 | −1.9046 ± 0.0858 | 0.0891 ± 0.0027 | 4.6590 ± 0.0494 | ||
| EDGE | 232.60 ± 0.92 | 32.57 ± 0.76 | 0.0161 ± 0.0007 | −1.8752 ± 0.0876 | 0.0867 ± 0.0043 | 4.6740 ± 0.0685 | ||
| p-value * | 0.003 | 0.735 | 0.710 | 0.686 | 0.326 | 0.459 | ||
| GE | HD | 237.29 ± 0.68 | 32.15 ± 0.43 | 0.0157 ± 0.0004 | −1.9055 ± 0.0679 | 0.0984 ± 0.0063 | 4.4629 ± 0.1029 | |
| VCT | 236.53 ± 0.62 | 32.10 ± 0.77 | 0.0156 ± 0.0007 | −1.9431 ± 0.0995 | 0.1012 ± 0.0053 | 4.4468 ± 0.0970 | ||
| p-value † | 0.79 | 0.884 | 0.893 | 0.426 | 0.392 | 0.768 |
Publisher’s Note: MDPI stays neutral with regard to jurisdictional claims in published maps and institutional affiliations. |
© 2021 by the authors. Licensee MDPI, Basel, Switzerland. This article is an open access article distributed under the terms and conditions of the Creative Commons Attribution (CC BY) license (https://creativecommons.org/licenses/by/4.0/).
Share and Cite
Lee, K.B.; Nam, K.C.; Jang, J.S.; Kim, H.C. Feasibility of the Quantitative Assessment Method for CT Quality Control in Phantom Image Evaluation. Appl. Sci. 2021, 11, 3570. https://doi.org/10.3390/app11083570
Lee KB, Nam KC, Jang JS, Kim HC. Feasibility of the Quantitative Assessment Method for CT Quality Control in Phantom Image Evaluation. Applied Sciences. 2021; 11(8):3570. https://doi.org/10.3390/app11083570
Chicago/Turabian StyleLee, Ki Baek, Ki Chang Nam, Ji Sung Jang, and Ho Chul Kim. 2021. "Feasibility of the Quantitative Assessment Method for CT Quality Control in Phantom Image Evaluation" Applied Sciences 11, no. 8: 3570. https://doi.org/10.3390/app11083570
APA StyleLee, K. B., Nam, K. C., Jang, J. S., & Kim, H. C. (2021). Feasibility of the Quantitative Assessment Method for CT Quality Control in Phantom Image Evaluation. Applied Sciences, 11(8), 3570. https://doi.org/10.3390/app11083570


