Article

Development of a Component-Level Hydrogen Transport Model with OpenFOAM and Application to Tritium Transport Inside a DEMO HCPB Breeder

Karlsruhe Institute of Technology (KIT), P.O. Box 3640, D-76021 Karlsruhe, Germany
*
Author to whom correspondence should be addressed.
Appl. Sci. 2021, 11(8), 3481; https://doi.org/10.3390/app11083481
Submission received: 5 March 2021 / Revised: 26 March 2021 / Accepted: 29 March 2021 / Published: 13 April 2021
(This article belongs to the Special Issue Advances in Fusion Engineering and Design)

Abstract

:
This work continues the development of a numerical model to simulate transient tritium transport on the breeder zone (BZ) level for the EU helium-cooled pebble bed (HCPB) concept for DEMO. The basis of the model is the open-source field operation and manipulation framework, OpenFOAM. The key output quantities of the model are the tritium concentration in the purge gas and in the coolant and the tritium inventory inside the BZ structure. New model features are briefly summarized. As a first relevant application a simulation of tritium transport for a single pin out of the KIT HCPB design for DEMO is presented. A variety of scenarios investigates the impact of the permeation regime (diffusion-limited vs. surface-limited), of an additional hydrogen content of 300 Pa H2 in the purge gas, of the released species (HT vs. T2), and of the choice of species-specific rate constants (recombination constant of HT set twice as for H2 and T2). The results indicate that the released species plays a minor role for permeation. Both permeation and inventory show a considerable dependence on a possible hydrogen addition in the purge gas. An enhanced HT recombination constant reduces steel T inventories and, in the diffusion-limited case, also permeation significantly. Scenarios with 80 bar vs. 2 bar purge gas pressure indicate that purge gas volumetric flow is decisive for permeation.

1. Introduction

Tritium, as one of the two necessary fuels for the currently technically pursued D-T fusion process, will have to be produced inside the fusion plant blanket itself—e.g., starting from lithium making use of the fusion neutrons. For the so-called breeding of tritium, one European concept for DEMO, called the helium-cooled pebble bed (HCPB) uses a pebble bed of an advanced lithium ceramic breeder (ACB), namely Li4SiO4 with 35% mol Li2TiO3 [1,2]. A beryllide (Be12Ti) block is foreseen as neutron multiplier to gain the required breeding neutrons at suitable energies to breed tritium in the neighboring ACB bed. High-pressure helium serves as coolant; a separated stream of low-pressure helium, usually called the purge gas, is used to transport the bred tritium out of the breeder to the tritium extraction system (TES). Often, hydrogen is added to the purge gas to support tritium removal. A breeder blanket typically is built of several identical or at least very similar components. These components represent a practicable level for computational fluid dynamics (CFD) modeling.
The attenuation of nuclear interaction processes with increasing distance from the first wall (FW) and the cooling configuration will result in considerable temperature spreads, tritium generation profiles, and different grades of radiation damage to the structure material (Eurofer-97), as well as to the breeder ceramics (ACB), and neutron multiplier material (Be12Ti) inside a breeder zone (BZ). Transport parameters and tritium retention properties are known to depend considerably on these quantities.
The design of a BZ has to take into account these parameters with regard to the breeding efficiency and the self-sufficiency of the reactor with fuel. The tritium inventory in the components plays a role with regard to safety and decommissioning requirements.
The above conditions obviously ask for multiple physics capabilities when analyses are to be done. Multiphysics component-level simulations are done for several breeder concepts using different codes, e.g., for water-cooled lithium leads (WCLL) [3,4], water-cooled ceramic breeders (WCCB) [5], and helium-cooled ceramic reflectors (HCCR) [6]. For HCPB, several system-level analyses exist [7,8,9].
This work continues the development of a tritium transport model on the BZ level based on the open source CFD framework OpenFOAM [10]. The model is intended to become a direct support of the KIT HCPB design activities. As a first step in this work the model is applied to tritium transport inside a single pin of the KIT HCPB DEMO pin design.

2. OpenFOAM Tritium Transport Model Upgrades

Below, new model features and changes to the previous model as described in [10] are summarized. The current model cannot handle the not-permeating triatomic hydrogen species like tritiated water (HTO) yet. Therefore, the below simulations are restricted to diatomic species H2, HT, and T2.

2.1. Boundary Condition (BC)Formalism

In the first version, mass conservation for interface mass transfer was guaranteed by a source term formalism that deviated from the standard formulation of a region interface boundary condition (BC) in OpenFOAM. Practical consequences were, e.g., difficulties with parallelization. Therefore, the BC model was modified to a “fixed gradient” BC that represents the OpenFOAM equivalent of a von Neumann BC. The modified BC guarantees mass conservation also in inner iterations inside a time-step and on application of the BC on the second side of the interface patch.

2.2. Two Species BC Correlation

For two hydrogen species—A, B—the rate equations are:
J A = Δ s A ( C s , 0 _ A C s _ A )   =   ( C g _ A k T ) K d _ A C s , 0 _ A 2 K r _ A +   1 2 ( C g _ A B k T K d _ A B C s , 0 _ A C s , 0 _ B K r _ A B )
J B = Δ sB ( C s , 0 _ B C s _ B )   =   ( C g _ B k T ) K d _ B C s , 0 _ B 2 K r _ B +   1 2 ( C g _ AB k T K d _ A B C s , 0 _ A C s , 0 _ B K r _ AB )
Cs_A(B) solid species A (B) interface cell center concentration (atoms/m3)
Cs_0,A(B) solid species A (B) fluid to solid interface concentration (atoms/m3)
Cg_A(B) fluid species A2 (B2) interface cell center concentration (molecules/m3)
Cg_AB fluid species AB interface cell center concentration (molecules/m3)
Kd_A(B) dissociation rate constant of A2 (B2) (molecules/m2/Pa/s) = (molecules × s/kg/m)
Kr_A(B) recombination rate constant for A2 (B2) (m4/s/molecules)
Kd_AB dissociation rate constant of AB (molecules/m2/Pa/s)
Kr_AB recombination rate constant for AB (m4/s/molecules)
Δ sA ( B ) = D A ( B ) 2 L = diffusion   constant   of   species   A ( B )   in   solid   ( m 2 / s ) 2   ×   distance   from   solid   side   cell   center   to   interface   ( m ) (the factor of 2 takes into account molecules vs. atoms).
In the first version of the model, this system of two equations was transformed to a fourth order polynomial and solved for Cs_0,A(B) with a quartic solver [10]. However, the stability and accuracy of the results turned out to be unsatisfactory in practice. Therefore, Equations (1) and (2) are now iterated alternately by a Newton–Raphson formalism. In practice, the very first problem’s time-step will often require numerous iterations, especially for rate constants of large numeric values, which typically are used to simulate diffusion-limited cases. Nevertheless, this method turned out quite practicable in transients when the results for the species interface concentrations of the previous time-step served as initial values for the next step. The key advantage is that an external numeric solver for a system of equations is not required.
The updated two-species model had been verified with the TMAP [11] code in “ratedep” mode (similarly as in Section 5.2 of [10]). The results of OpenFOAM and TMAP were basically identical. It turned out that OpenFOAM can handle higher absolute numeric values of the rate constants in the first time-step than TMAP, which is a hint of the robustness of the OpenFOAM numerical model.

2.3. Porosity Model

Many CFD codes, including OpenFOAM, use porosity when the presence of two phases is to be simplified to a description in the frame of single-phase equations. In our case, helium purge flow through a ceramic breeder pebble bed is regarded as porous flow. Typical literature descriptions of porous flows, e.g., the terms of Darcy (slow/creep flow) or Forchheimer (basically this is the Darcy term + an inertia term) are based on the “apparent” velocity, i.e., a “Darcy velocity” vd and a “seepage velocity” v = vd/ε where ε is the fluid fraction or porosity. Seepage velocity and also the density are averaged data over the complete cell volume. OpenFOAM includes a model like this (to be activated by the “fvOptions” mechanism), too. Nevertheless, it is not suitable for our application for the following reasons:
1. As the seepage velocity v is not a physical speed, things happening at the begin of the porous zone will affect the end of the zone due to downstream advective transport only retarded by a factor of ε.
2. The total inventory of the purge gas—including a possible tritium inventory— will be overestimated by a factor of ε if the fluid density and the carried tritium concentrations are not corrected.
3. The tortuosity δ = effective   path cell   dimension quantifies the deviation from the straight path of a particle moving through, e.g., a packed bed. The true particle velocity is enhanced by a factor of the tortuosity δ; however, the direction of this particle velocity will be the flow direction only as a mean value (because the particles are forced to meander, e.g., around the pebbles). Another effect of this elongated meander path is that the fluid diffusivity—already reduced by the porosity factor of ε--will be additionally reduced by the inverse tortuosity factor of 1/δ.
A general solution of these porosity-related transport and inventory issues will require quite different transport equations and new variables. If, however, the porosity and tortuosity are assumed to be isotropic and constant inside a region, there is a quite simple and practicable solution.
The variable of the fluid concentration of hydrogen in each fluid region cell contains the actual hydrogen concentration in the fluid part of the porous fluid region cell and is no average value over the cell that contains a fluid and solid fraction. This way the system variables always contain the correct absolute concentration or partial pressure numeric values as they are required for the evaluation of key data like diffusion coefficients or interface transport. Obviously, this is achieved at the cost that the total region hydrogen species inventory is overestimated by a factor of the porosity ε. Furthermore, a tortuosity δ is introduced, which is set by default to δ = 1/ε (which is justified in this case because (1) the path elongation along a half-sphere circumference compared to its diameter as the hypothetical direct flow path is approximately Π/2 = 1/0.64 while (2) a typical packing factor of a bed of spherical pebbles is close to 0.64). These model presumptions require that:
  • all volumetric source terms for hydrogen have to be divided by a factor of ε.
  • the interface mass transfer has to be corrected by a factor of 1/ε on the fluid side.
  • advective transport enhances by a factor of 1/ε.
  • diffusive transport reduces by a factor of ε/δ.
Taking all this into account, porosity and tortuosity change the original fluid regions transport equation to:
c t Δ ( ε δ D c ) + ( v c / ε ) q / ε = 0
In summary, this simplified model will describe transients with diffusive and advective transport correctly. Concentration changes in the fluid from interface transfer to neighboring solid regions (i.e., permeation) or from volumetric sources (i.e., pebbles) will be correct. The total fluid region inventory needs to be corrected with the porosity factor of ε.
The porosity model includes also a solid fraction of (1−ε) with a solid hydrogen species concentration. As for the fluid part, numeric values are actual local values and need to be corrected by the volume fraction for inventory calculations.

2.4. Residence Time Release Model

The previously described porosity model is a prerequisite for the following release model. The release model simulates the release of tritium from the solid fraction (i.e., the pebble bed) to the fluid fraction (i.e., the purge gas) of the same cell of a porous fluid region.
The tritium concentration in the solid fraction is given by a simple residence time equation:
c t = Q c τ
The tritium concentration in the solid fraction is c, Q is a tritium source term due to neutronic radiation, and τ is the residence time—a quantity that usually is determined from tritium release experiments (e.g., EXOTIC [12]). Equation (4) contains no transport terms and may be either solved easily element by element or in the frame of the OpenFOAM equation formalism. We selected the latter option, though in this case the matrix formalism would not be required.
The release term c/τ has to appear in the fluid equation as an additional source term in Equation (3). A factor of (1−ε)/2ε takes into account the solid vs. fluid volume fractions and the factor two corrects for atoms vs. molecules in the case that release is done in the form of the pure species molecule T2. The model may alternatively release to the mixed-species molecule. In this case, the user has to make sure that enough of the second species (H2) is present to avoid negative concentrations (which is usually no issue for a H2-doped purge gas).

2.5. Integration of Model Upgrades

The patch region interface hydrogen species mass flow was made accessible as transient output data. Then, the above model changes and upgrades were tested and verified with simple TMAP cases. Furthermore, the code would also be able to simulate pulsed operation of a pebble bed source term. At this point there was enough confidence for a first meaningful application of the model to a realistic and relevant breeder zone simulation scenario with two hydrogen species.

3. DEMO HCPB Single Pin Simulation Setup

KIT proposes a HCPB design for DEMO with the breeder zone built up from pin-like components [1,2]. A single pin may be regarded as the smallest meaningful representative unit cell for tritium transport simulation inside the BZ. Due to the cylindrical symmetry of the pins a 2D model seems appropriate for this very first model approach with OpenFOAM.

3.1. HCPB Pin Design

The below description of a DEMO HCPB fuel pin is a brief selection from [1], where more details may be found. Figure 1 shows a HCPB fuel pin mounted in the BZ.

3.2. OpenFOAM Model

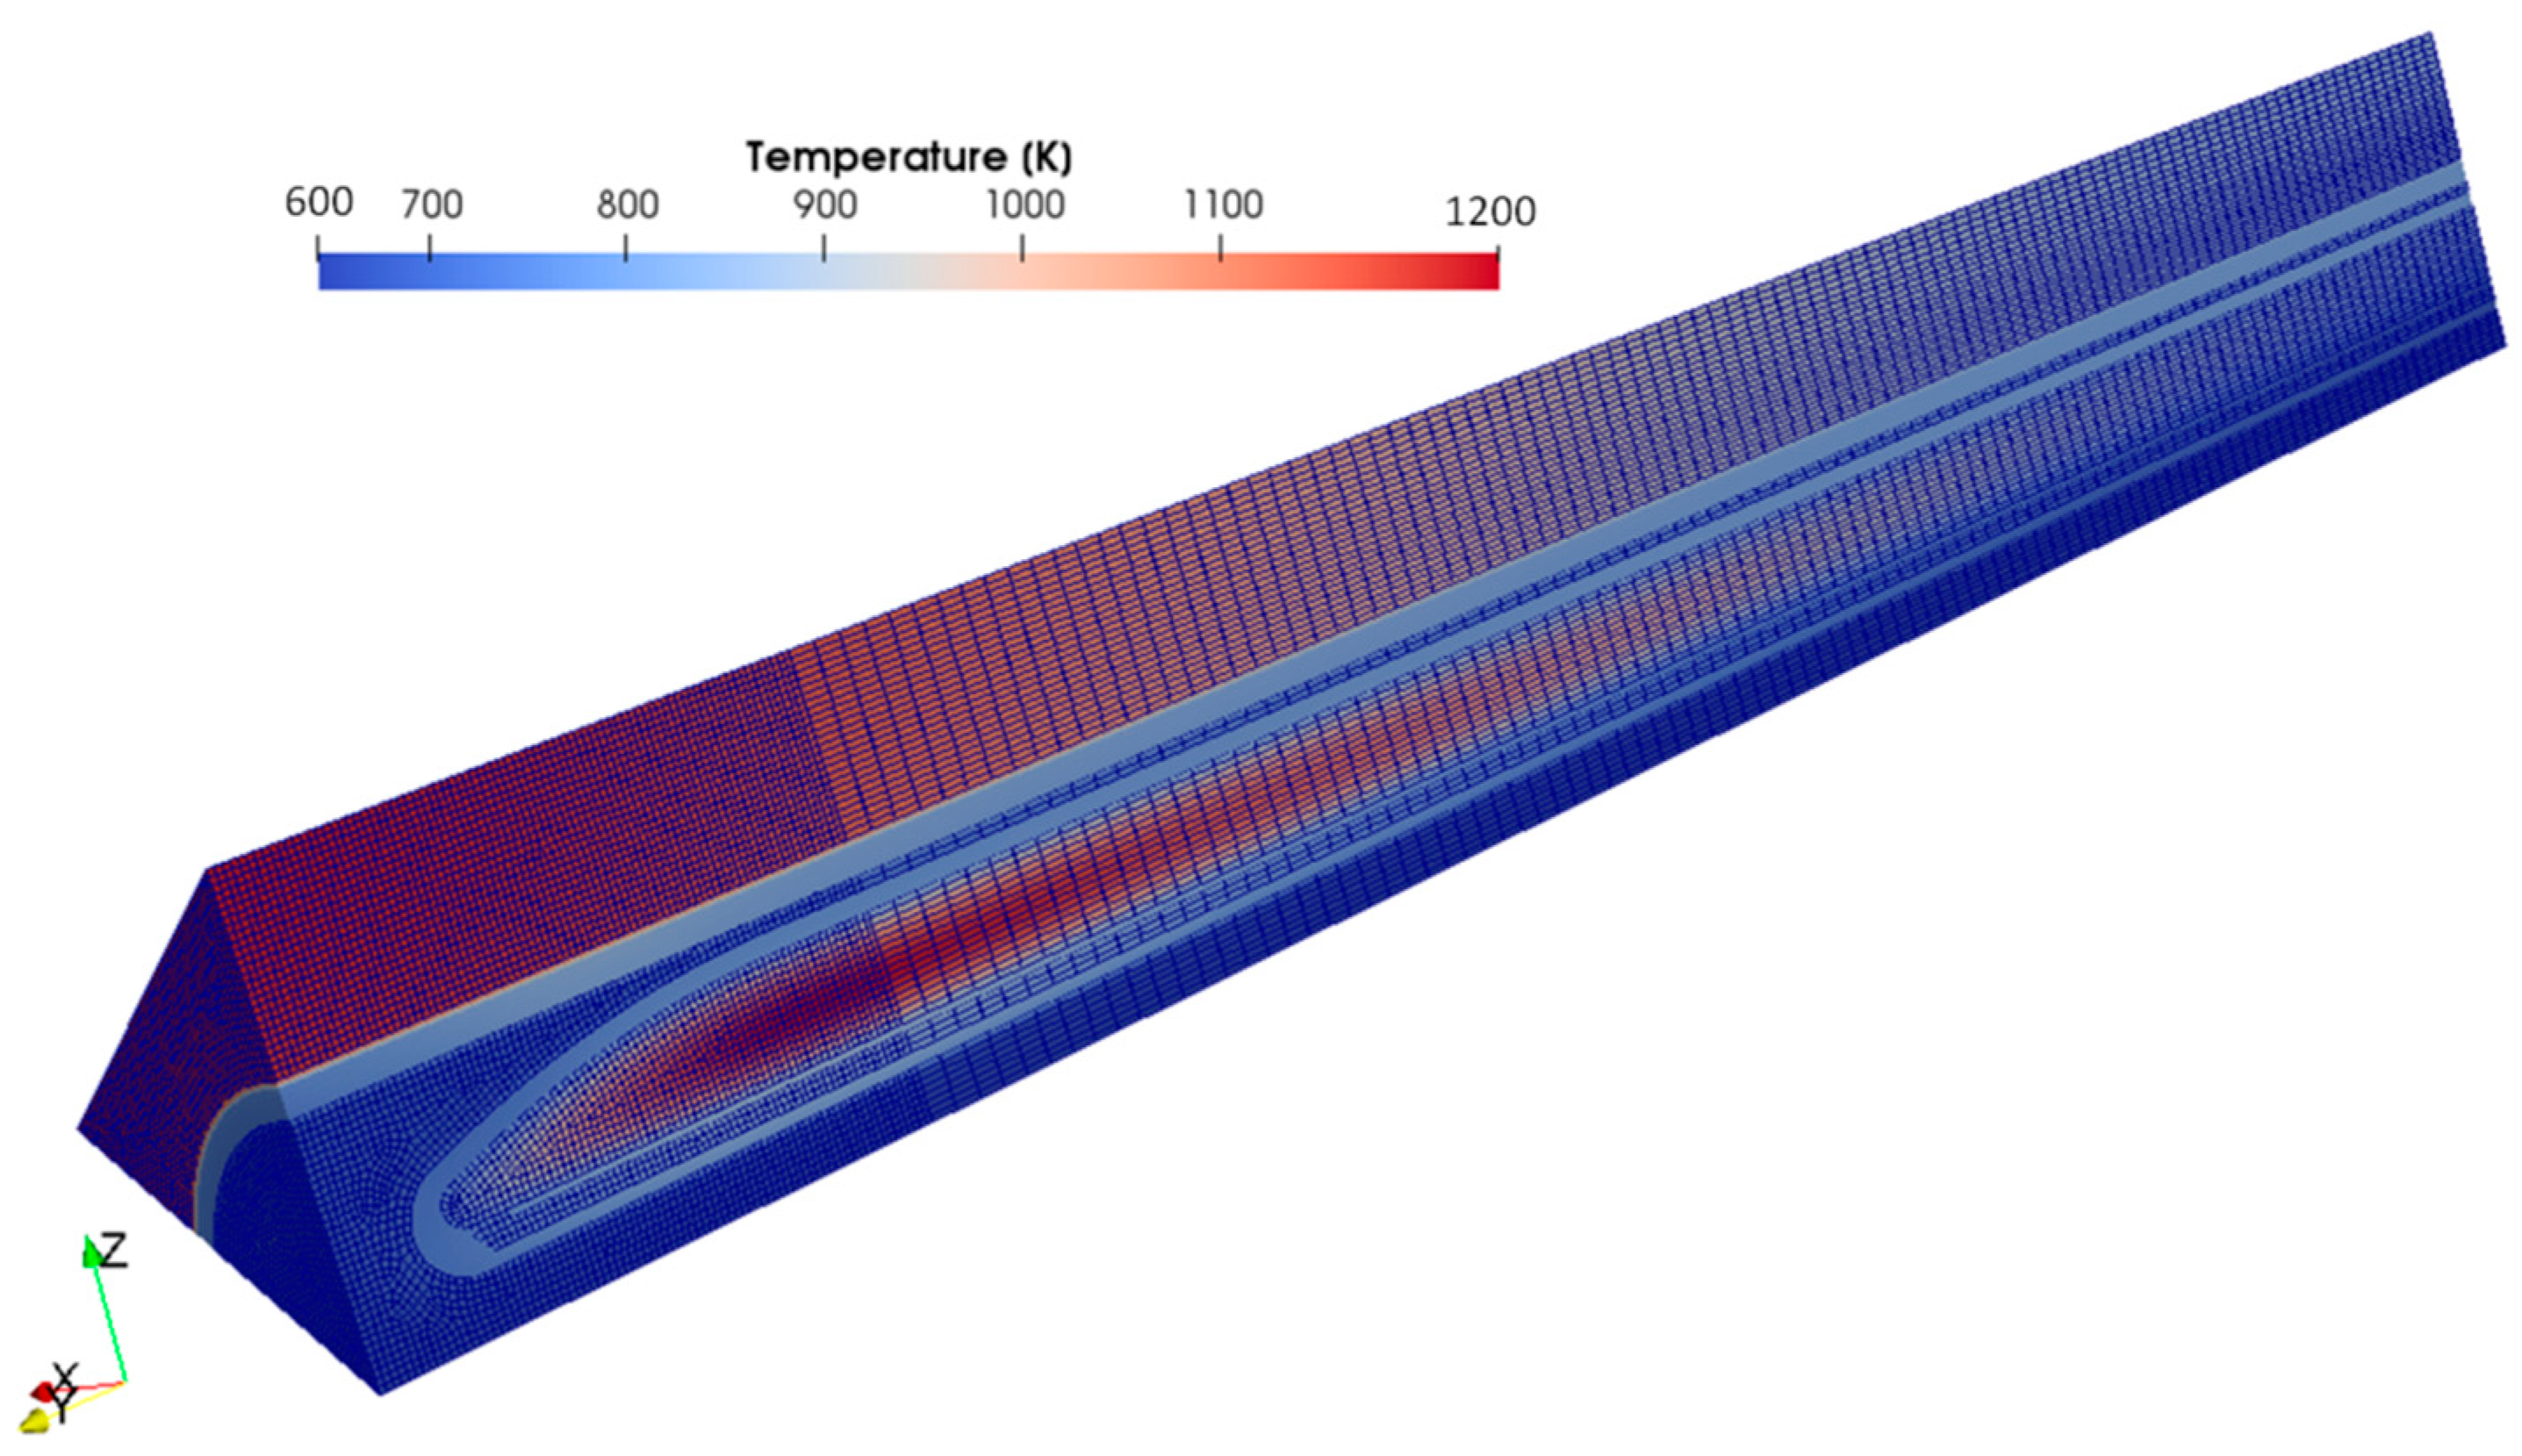
The OpenFOAM model was set up to calculate temperature, velocity, and tritium concentration fields consistently in a multiphysics simulation frame. On the other hand, existing results should be integrated as far as possible with regard to, e.g., validation questions. Therefore, the model uses the mesh as well as the temperature fields of the designers’ 3D CFD simulations, see Figure 2. However, the below OpenFOAM simulation is 2D and uses only a 1° slice of this mesh. The mesh had to be modified as it did not contain a breeder purge gas return channel. Import of the coolant velocity flow field (via the CGNS file format) to OpenFOAM basically worked, too; however, density and other data turned out incomplete in such a way that advective transport in OpenFOAM did not come out properly. Therefore, both the purge flow and the coolant flow fields are calculated first with OpenFOAM with the original thermal field as constant background field until steady state flow is achieved.
During the transient, the OpenFOAM flow fields and the original thermal field remain constant background fields, i.e., thermal and kinetic equations are switched off. Further simplifications are that (a) the neutron multiplier, and (b) the trapping are disregarded, and (c) no pulsed operation is taken into account (this allows interesting steady-state mass balances). The most interesting output quantities are tritium permeation to the coolant flow and tritium inventories in the structures.
Figure 3 shows the 2D OpenFOAM mesh with about 8000 cells. This (half) cross-section of a single pin also indicates the purge and coolant flow characteristics. Note that the actual shape of the breeder part “nose” towards the first wall side has meanwhile changed compared to Figure 1.
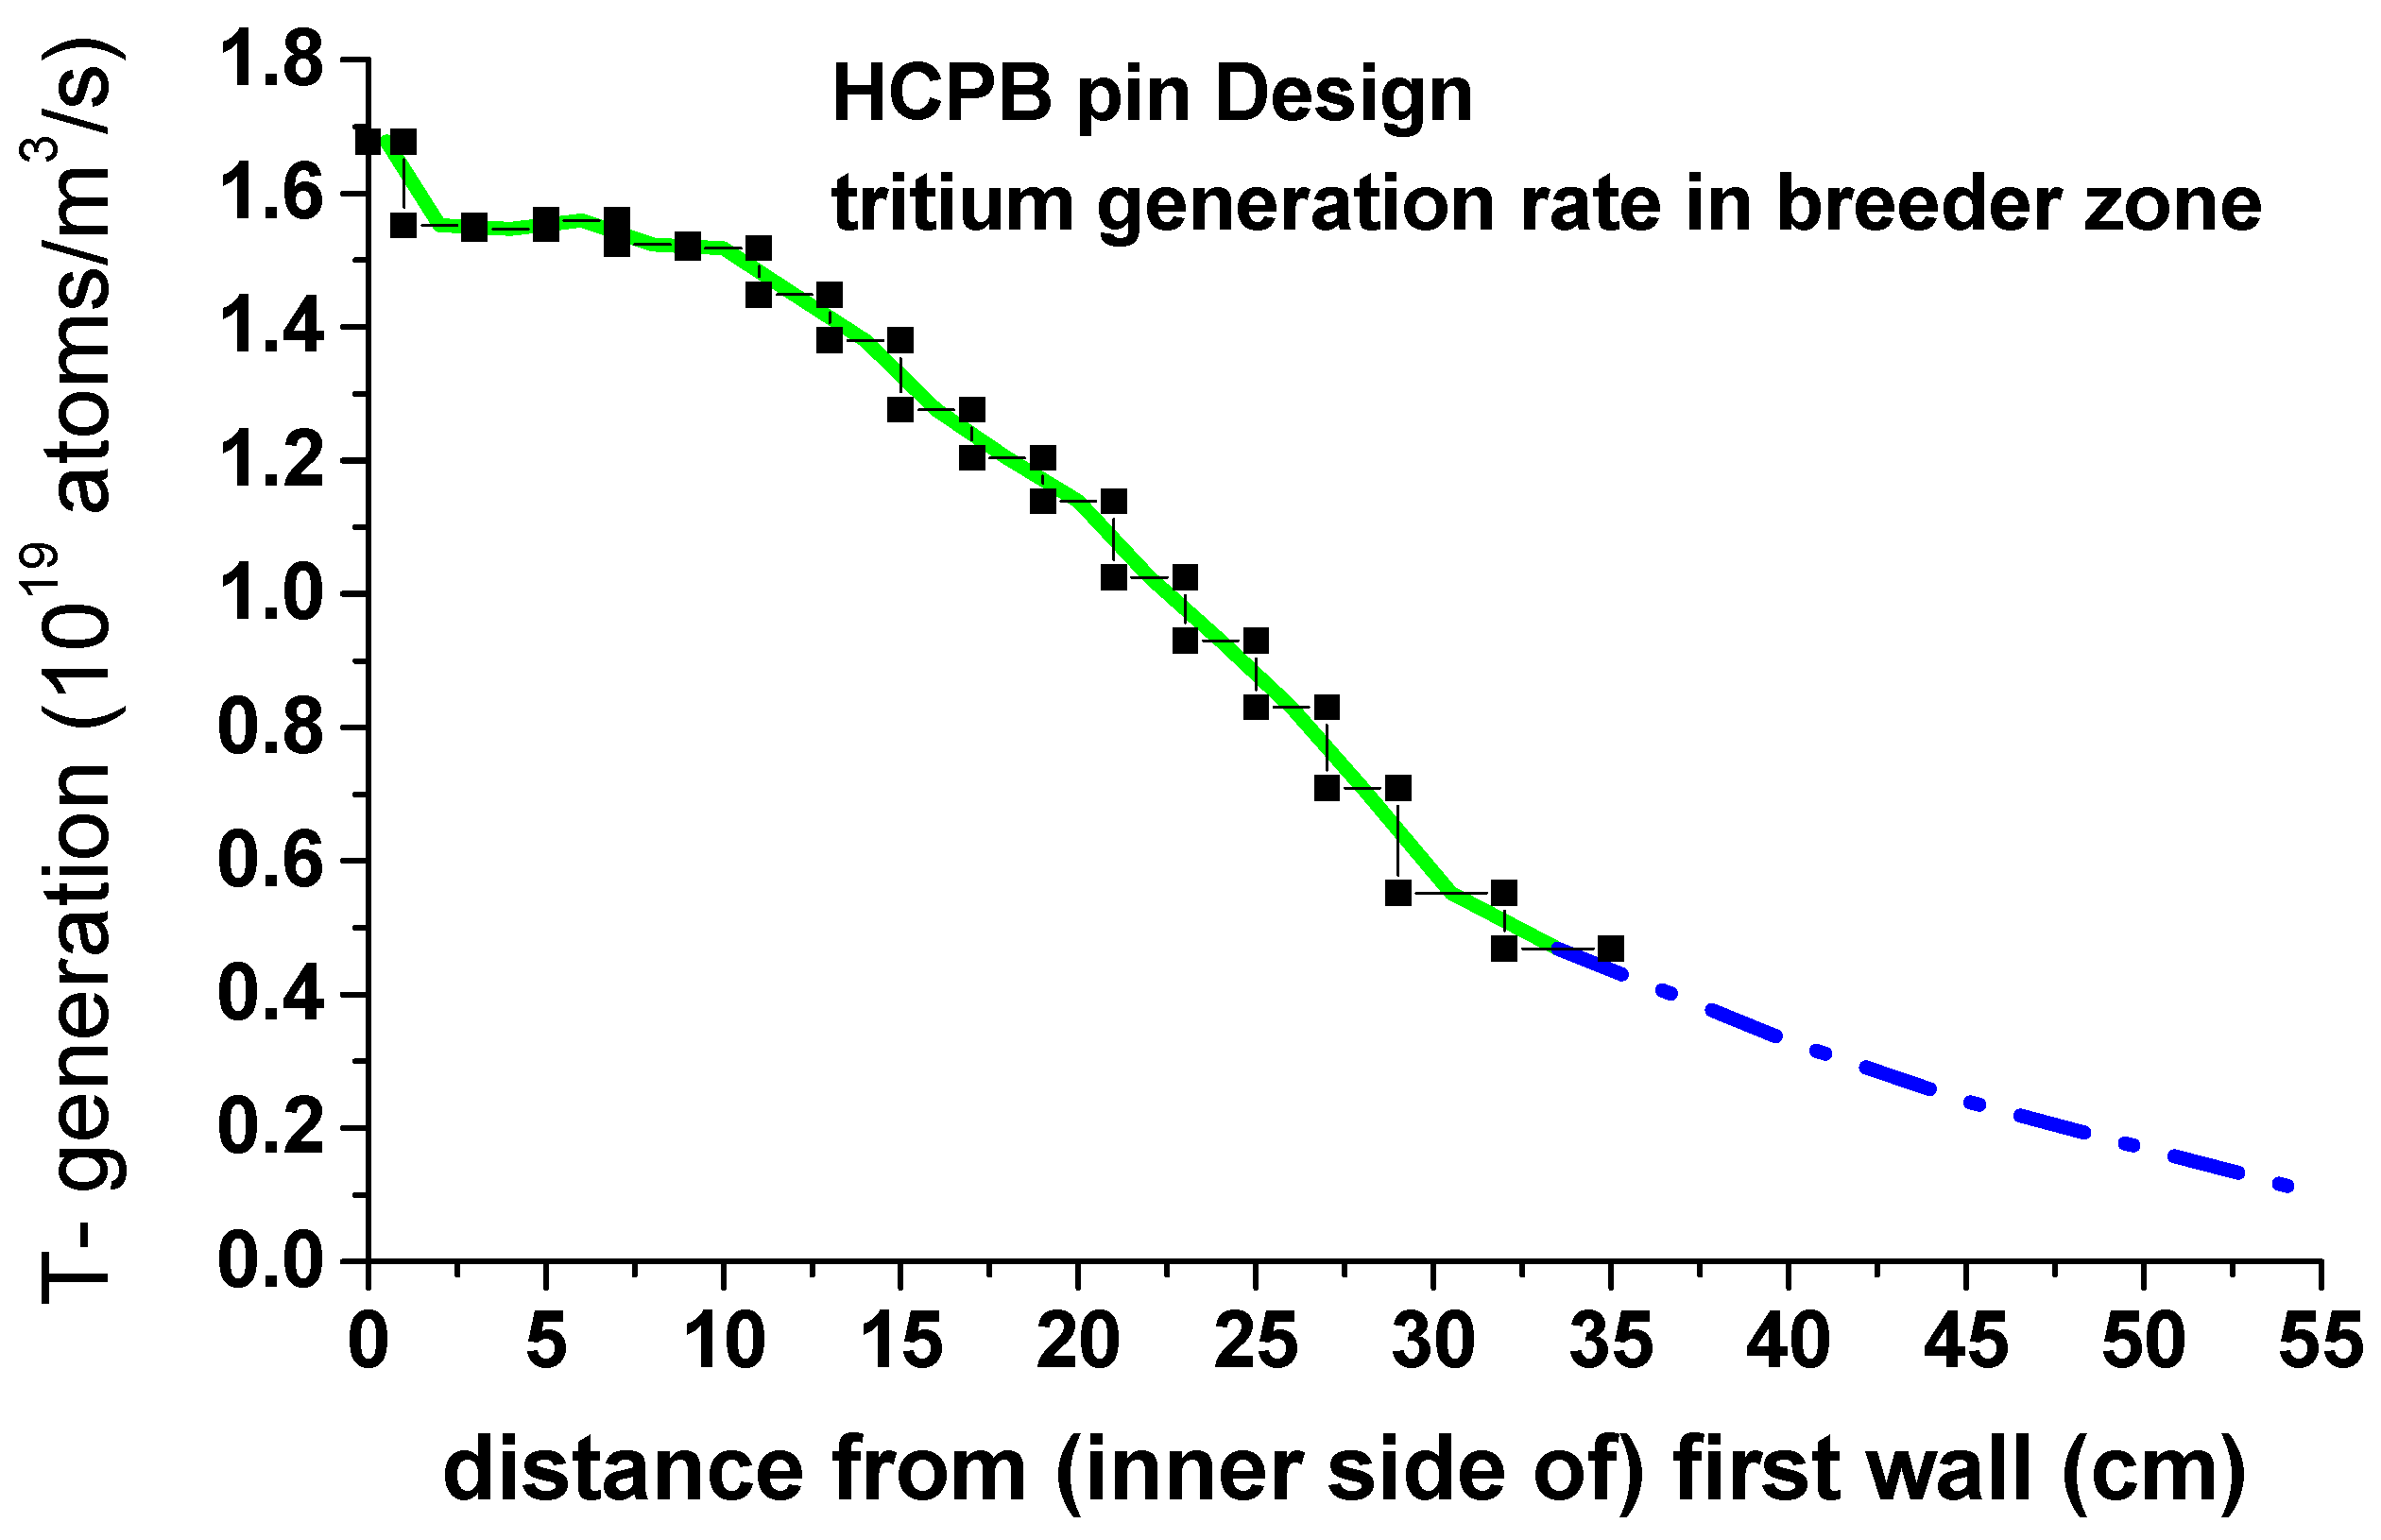
Figure 4 indicates the 1D tritium generation rate as expected from MCNP (Monte Carlo N-Particle code) calculations [13]. This 1D behavior is mapped to the breeder zone region. The corresponding total tritium generation rate for a single pin is 4.38 × 10⁻⁸ g/s, which would extrapolate to about 340 g/day for the entire DEMO reactor (disregarding the neutron multiplier contribution).
Table 1 summarizes the key numeric parameters used in the below simulations. The purge flow field is laminar flow through a porous media. The fvOptions mechanism of OpenFOAM is used to insert an explicit porosity source to the equations. An isotropic Darcy coefficient of 7 × 10⁶ m−2 was selected to receive a homogenous flow field over the breeder cross section. An average purge flow speed of 1 cm/s is assumed as a typical value.
The coolant flow field is simulated as turbulent flow using the RANS k-ω−SST model, which was also used by the designers [1]. Due to the considerable diffusivity of T in the coolant (about 2 × 10⁶ m2/s) the precise flow field is not that important. The coolant gas mass flow rate for a single pin is 2.4 × 10⁻² kg/s, i.e., about a factor of about 1 × 10⁴ higher than the purge gas mass flow rate (which explains why the purge gas typically is neglected in designers’ thermal analyses).
With regard to a leak-tolerant design for DEMO HCPB it is under discussion to raise the purge gas pressure level to the coolant gas pressure level of 80 bar. Therefore, additional simulations with 80 bar purge gas pressure are performed for a first estimate of consequences to permeation and inventories. Geometry and temperature fields are kept the same for comparability; however, this is not intended to suggest that the current DEMO HCPB breeder pin design is operable at 80 bar purge gas pressure, too.

4. OpenFOAM Simulation Results for a Single DEMO HCPB Fuel Pin

Pin geometry and temperature field are common in all simulations shown below. The numerous scenarios are distinguished by:
  • permeation regime (diffusion-limited vs. surface-limited)
  • single- vs. two-species scenarios
  • purge gas composition (with and without additional 300 Pa H2 in purge gas)
  • purge gas pressure (2 bar vs. 80 bar)
  • species-specific rate constants (different recombination constant for mixed species molecule HT)
Besides showing the impact of these parameters to tritium permeation inside a HCPB pin, the verification of the OpenFOAM two-species model vs. the single species model is also a topic of this work. In the scenarios, several interesting aspects of the interdependence of parameters and model assumptions are also highlighted. The most relevant information on tritium permeation and inventories for the different cases may be found summarized in a table in Section 5.
The simulations are performed with steady-state thermal and flow fields. As no pulsed operation is simulated, an asymptotic approach to a steady state is expected. These steady-state results are used to compare the different scenarios. For all scenarios, prerun simulations without tritium generation were carried out until the solid concentrations and outlet partial pressures did not change significantly any more. Note that these asymptotic steady states without tritium generation can differ for different scenarios. All the simulations below start from their corresponding asymptotic initial state when at t = 0, tritium generation in the breeder zone solid part is switched on. These simulations run until again an asymptotic steady state—but now with tritium generation switched on—is reached.

4.1. Diffusion-Limited Cases

The permeation regime typically distinguishes between the surface-limited case, where adsorption and recombination processes are decisive for the kinetics, and the diffusion-limited case, where surface processes are so fast that Sieverts equilibrium is always reached regardless of net mass flows and that diffusion in the solid is the limiting kinetic parameter. E.g., [17] provides a description and a synthesis of both permeation regimes. Section 4.1 investigates several diffusion-limited cases.

4.1.1. Low/No H2 System, Diffusion-Limited, Low H2 in Purge Gas, Single- vs. Two-Species Correlation

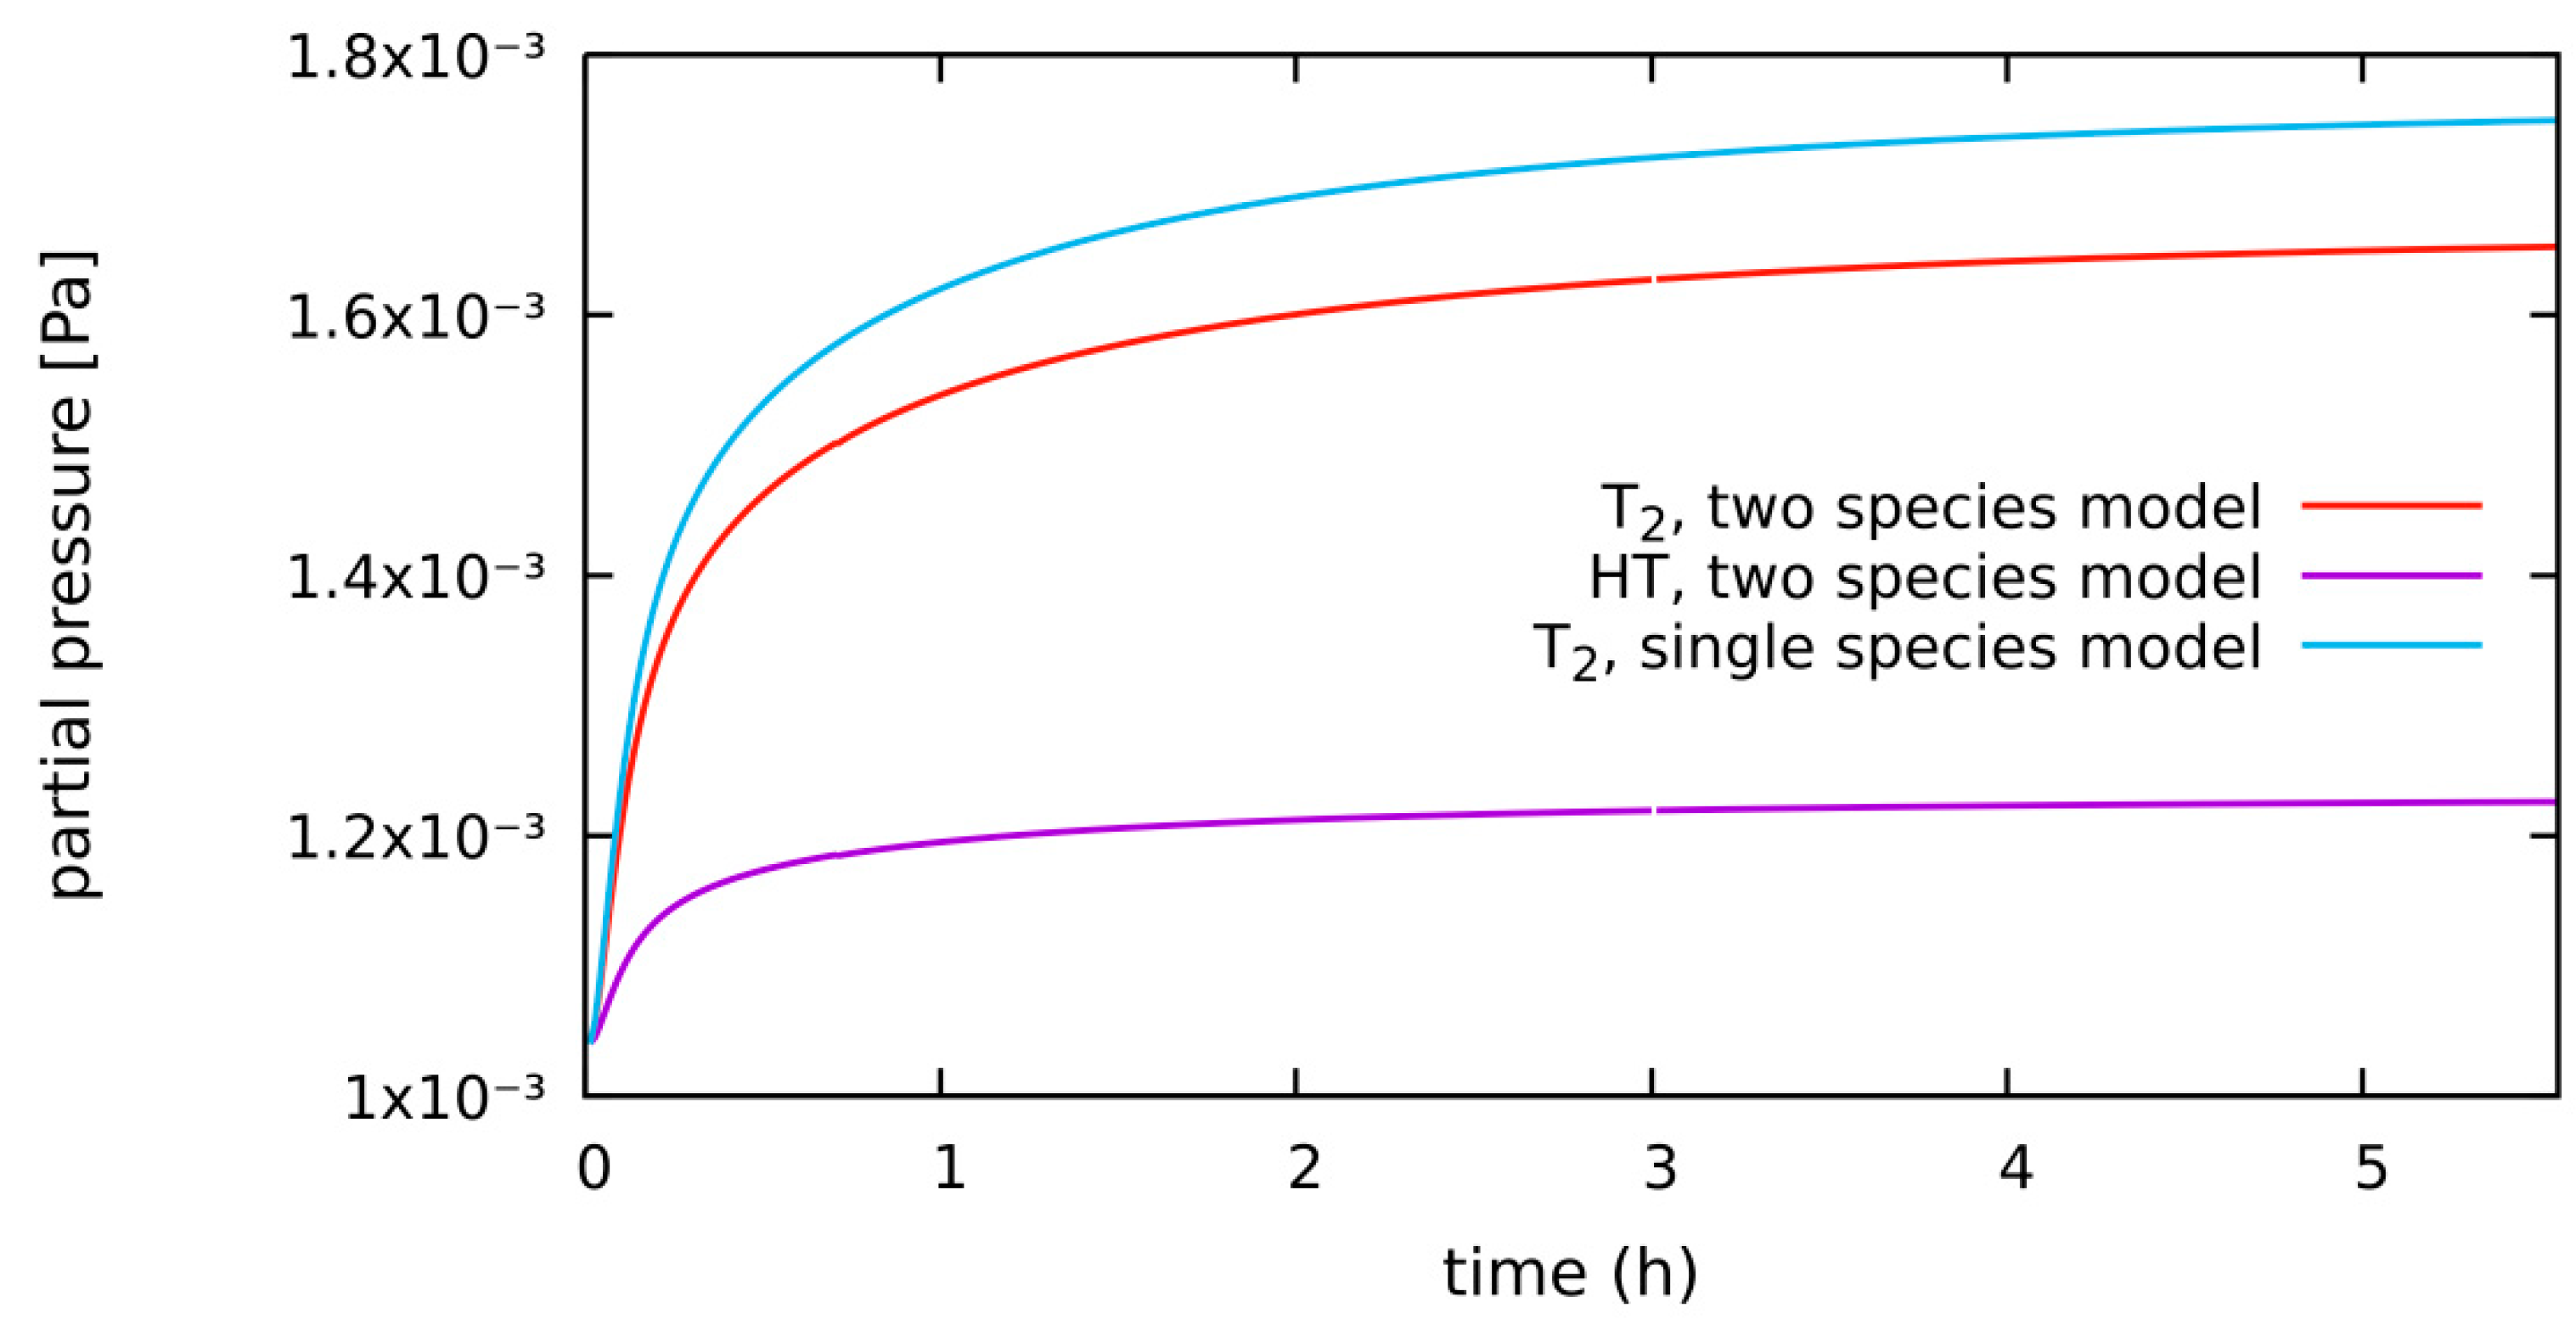
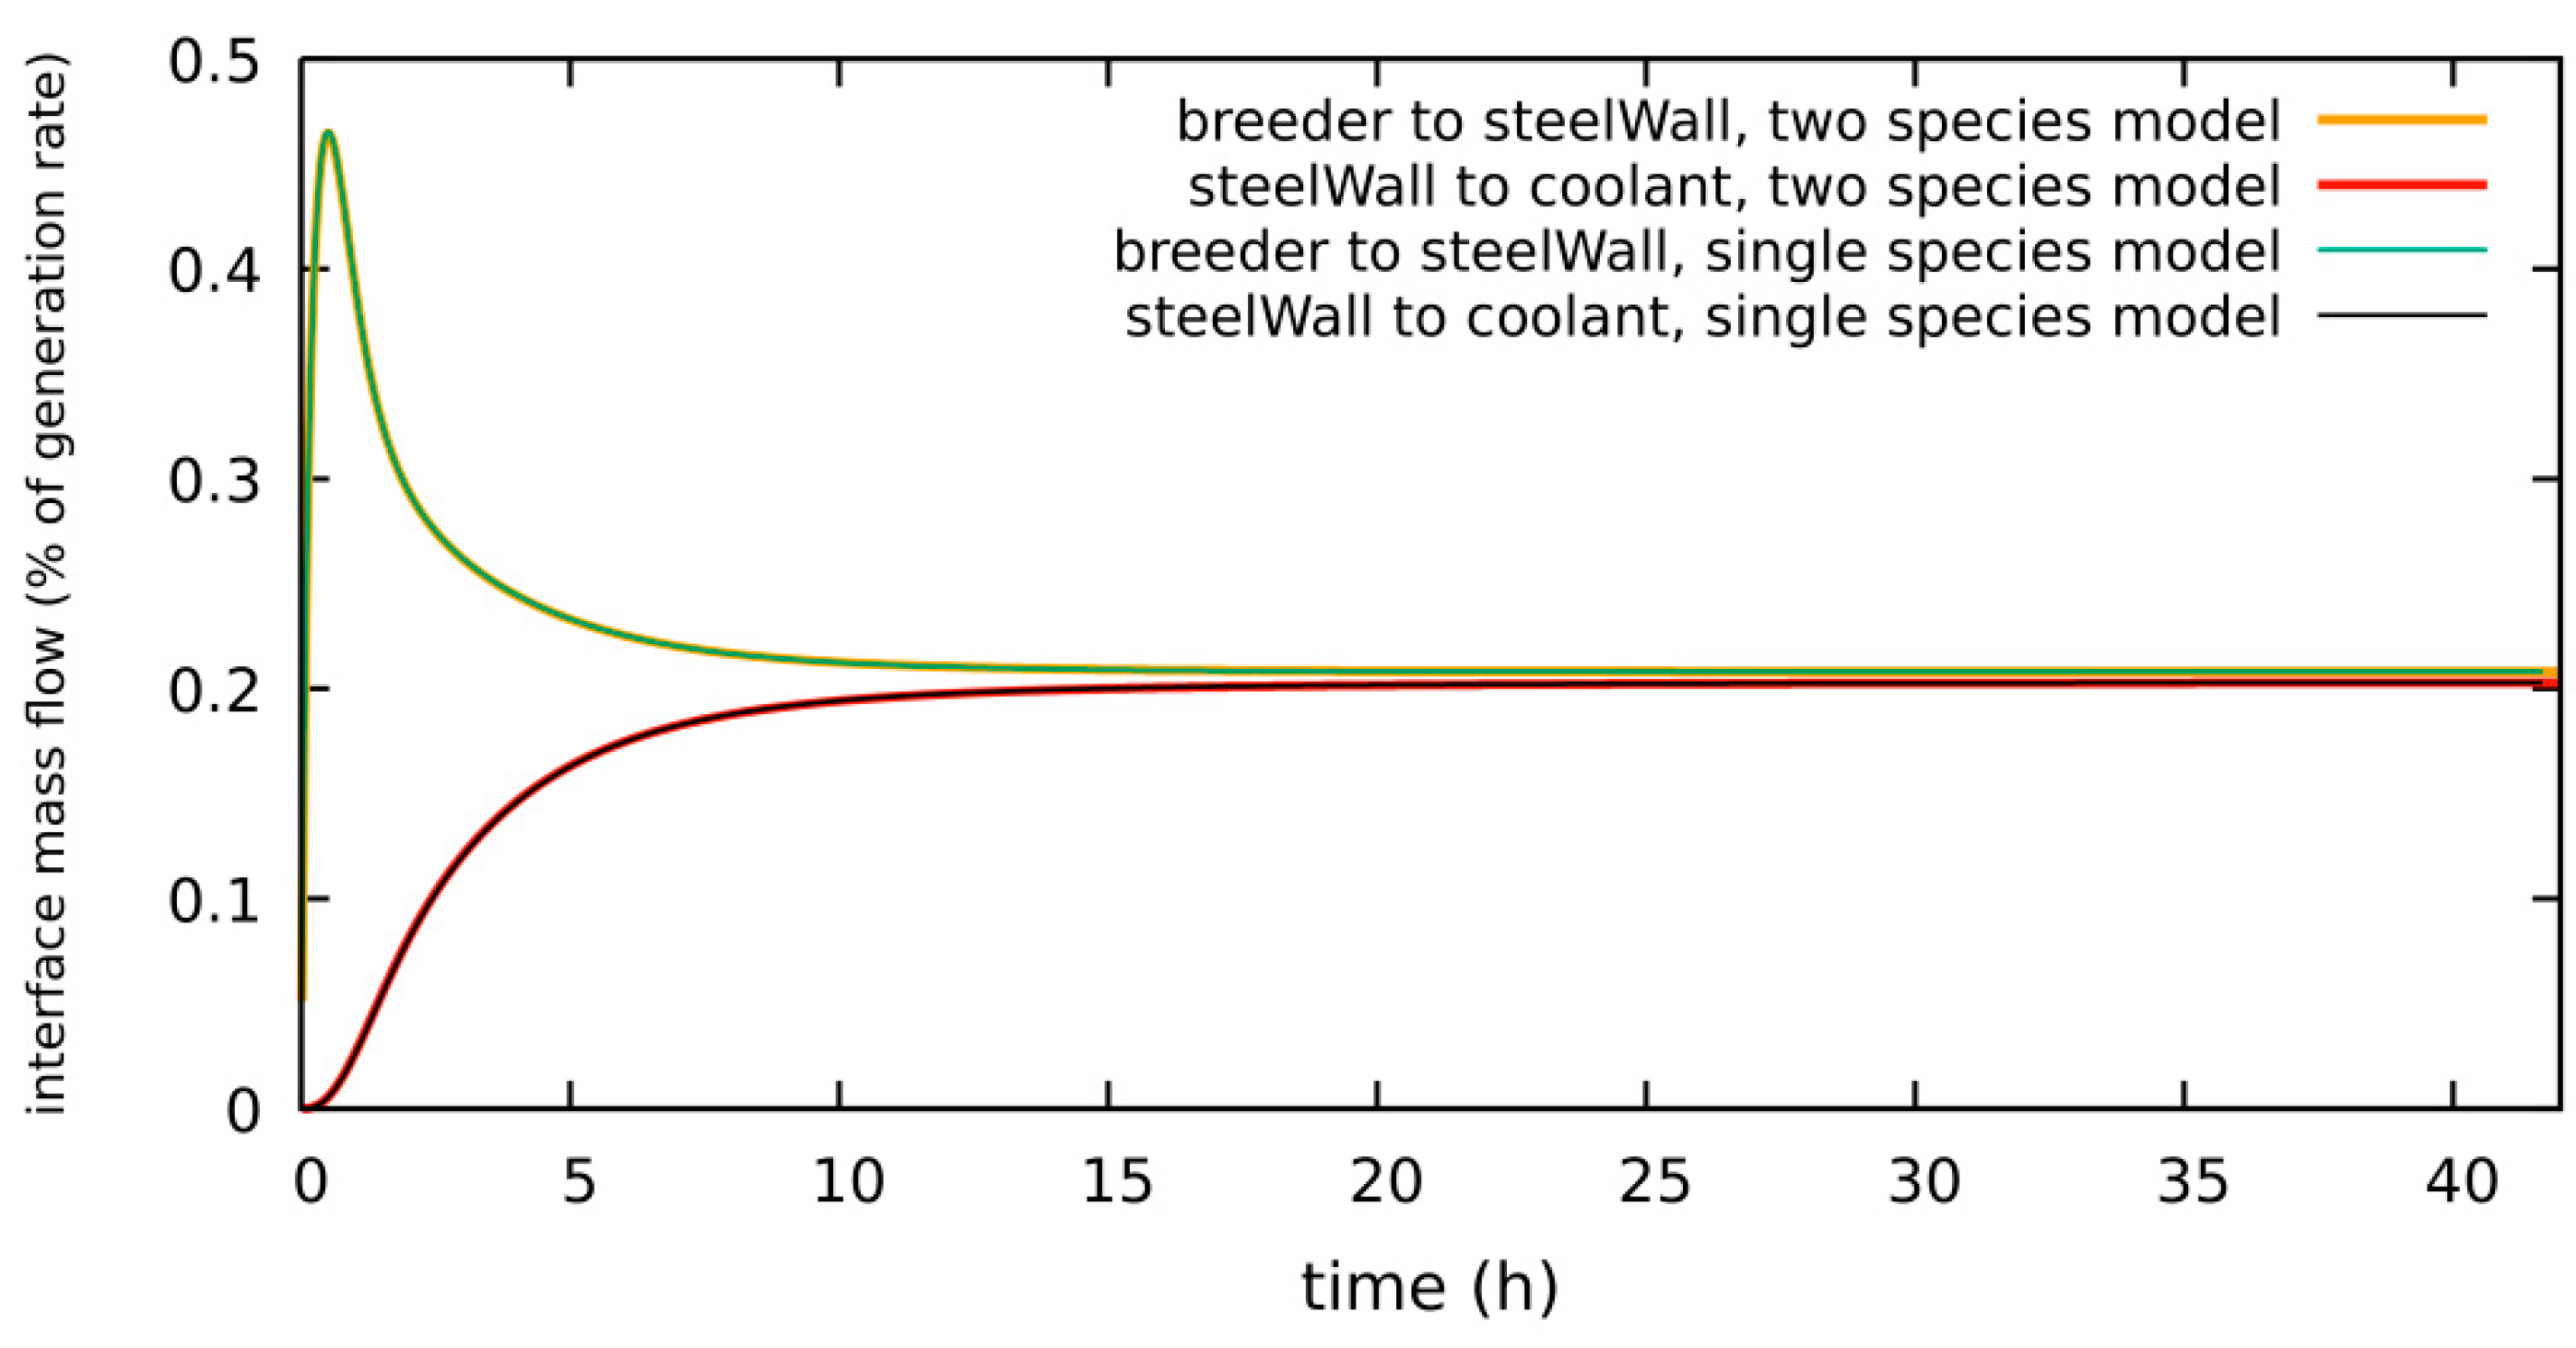
This simulation with no/1 × 10−3 Pa H2 in the purge gas compares the single-species vs. the two-species correlation in the diffusion-limited case. The presence of even only 1 × 10⁻³ Pa of H2 in purge gas and coolant already gives rise to a visible HT signal (via the corresponding Cs,0_H in the recombination flow JHT,reco = Cs,0_H Cs,0_T Kr_HT) in Figure 5. Quantitatively, the HT signal just compensates the difference between the respective T2 data for the single-species and two-species models. The HT result may be explained by the fact that 3D diffusion with strong thermal gradients is relevant and local Sieverts equilibrium differs over the surfaces of the pin.
In Figure 6 the transient mass flow over the patch interfaces is provided as a fraction of the total tritium generation rate in the ceramic breeder pebbles. The narrow peak in the upper/blue curve indicates that the previously tritium-free breeder steel wall is filled up quickly in the early phase. The bottom curve illustrates how the transfer to the coolant is retarded by tritium diffusion through the wall. Both curves approach each other with time to a steady-state permeation behavior, while a steady-state concentration gradient in the steel wall builds up. Regardless of the distribution of T between HT and T2, the patch interface flow rates for the single- and two-species correlations are so close that they would be indistinguishable in Figure 6. A steady state is approached after several hours and the tritium permeation rate to the coolant reaches about 5% of the tritium generation rate. The tritium inventory in the steel walls between breeder and coolant of a single pin reaches about 1.1 μg.

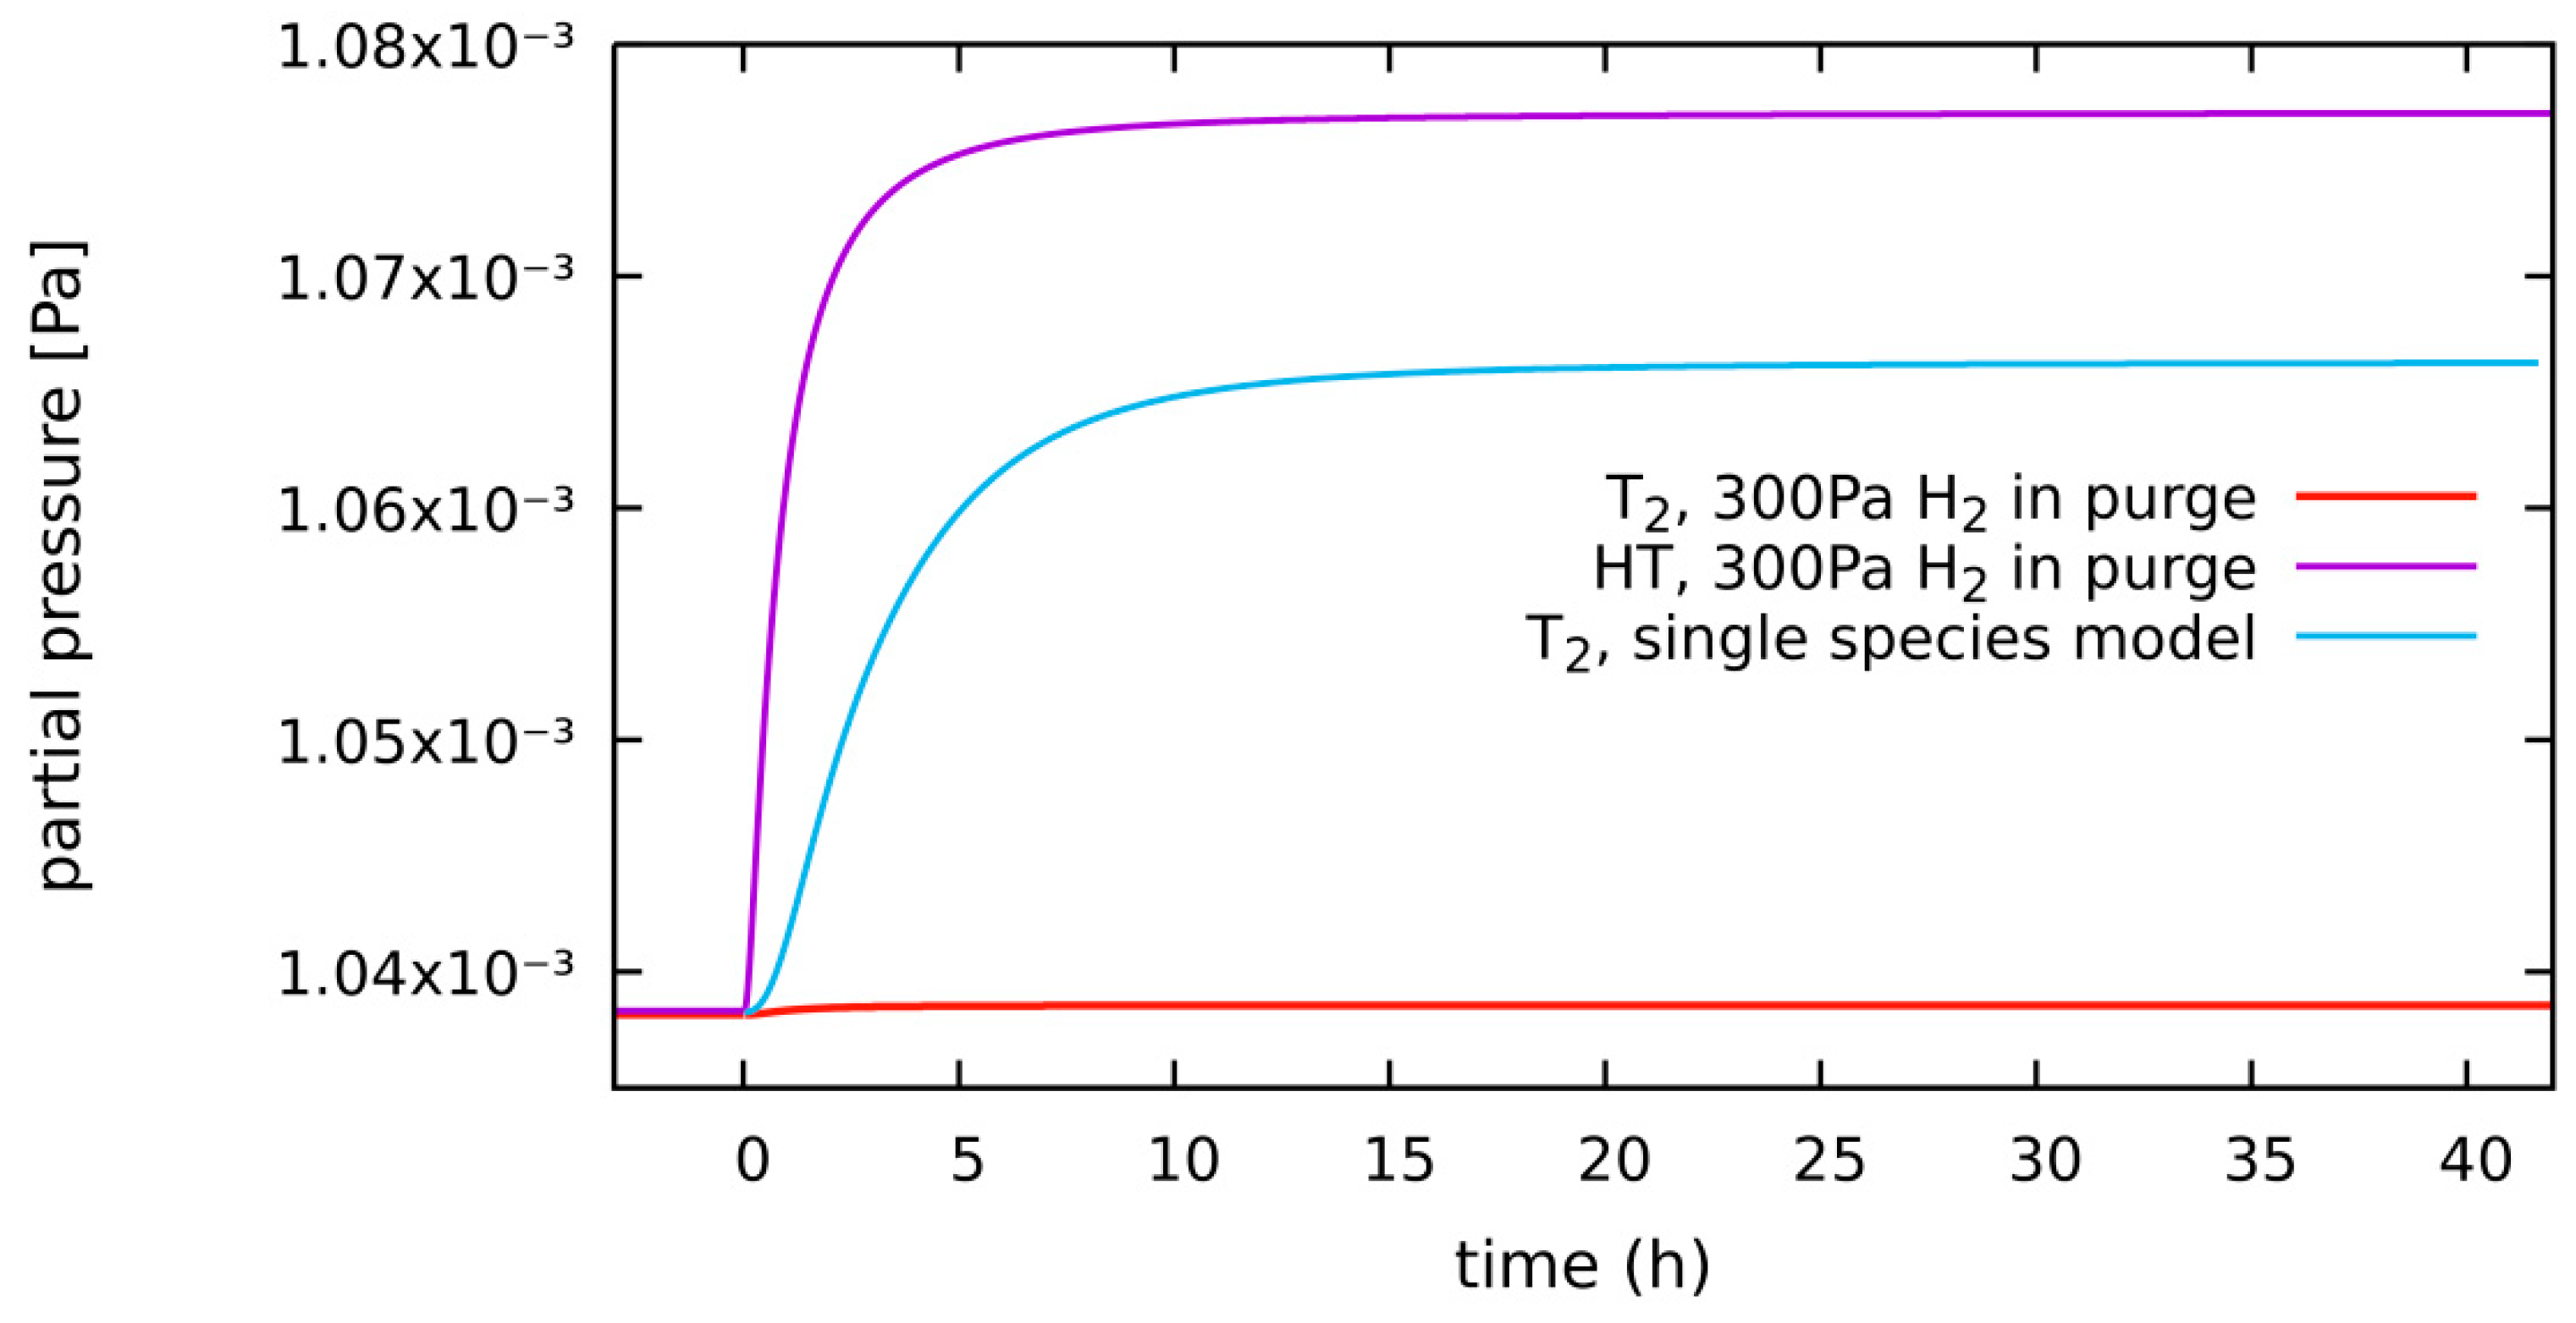
4.1.2. HT System, Diffusion-Limited, 300 Pa H2 in Purge Gas

Figure 7 shows diffusion-limited case results with 300 Pa H2 in the purge gas together with the previous low H2 content results. In the prerun before the start of tritium release, H-permeation from the purge gas to the (undoped) coolant already approached a steady state. The initial HT and T2 partial pressure levels (i.e., the prerun results) are very different. Quantitative permeation results are best read from the patch interface mass flows—see Figure 8. With 300Pa H2 in the purge gas, the permeation steady-state level is significantly lower and is approached faster than for 1 × 10⁻³ Pa H2. H co-permeation seems to reduce tritium permeation by close to an order of magnitude (to about 0.6% of the T-generation rate) in this case. The tritium inventories in the regions of a single pin approach steady-state levels of about 6.4 × 10⁻¹⁰ g in the coolant, 0.17 μg in the steel wall, and 0.1 mg in the ceramic breeder region. In summary about 10 g of tritium are expected to be present inside the entire DEMO reactor breeder zone (disregarding the neutron multiplier inventory).

4.1.3. HT System, Diffusion-Limited, 300 Pa H2 in Purge Gas, HT vs. T2 as the Released Species

In the diffusion-limited case, the purge gas outlet composition is mostly HT with very low T2, regardless of whether HT or T2 is released in the breeder zone in the presence of 300 Pa H2. However, Figure 9 shows that the local T2 concentrations in the breeder zone considerably depend on the released tritium species. Obviously, the high numeric values of rate constants imply an isotopic exchange downstream in the purge outlet channel where no pebbles are present and, therefore, no release takes place. In summary, permeation and wall inventories are not visibly affected from the local chemical form of tritium of HT vs. T2.

4.1.4. HT System, Diffusion-Limited, 300 Pa H2 in Purge, New “Low” Level: 1 × 10⁻⁴ Pa

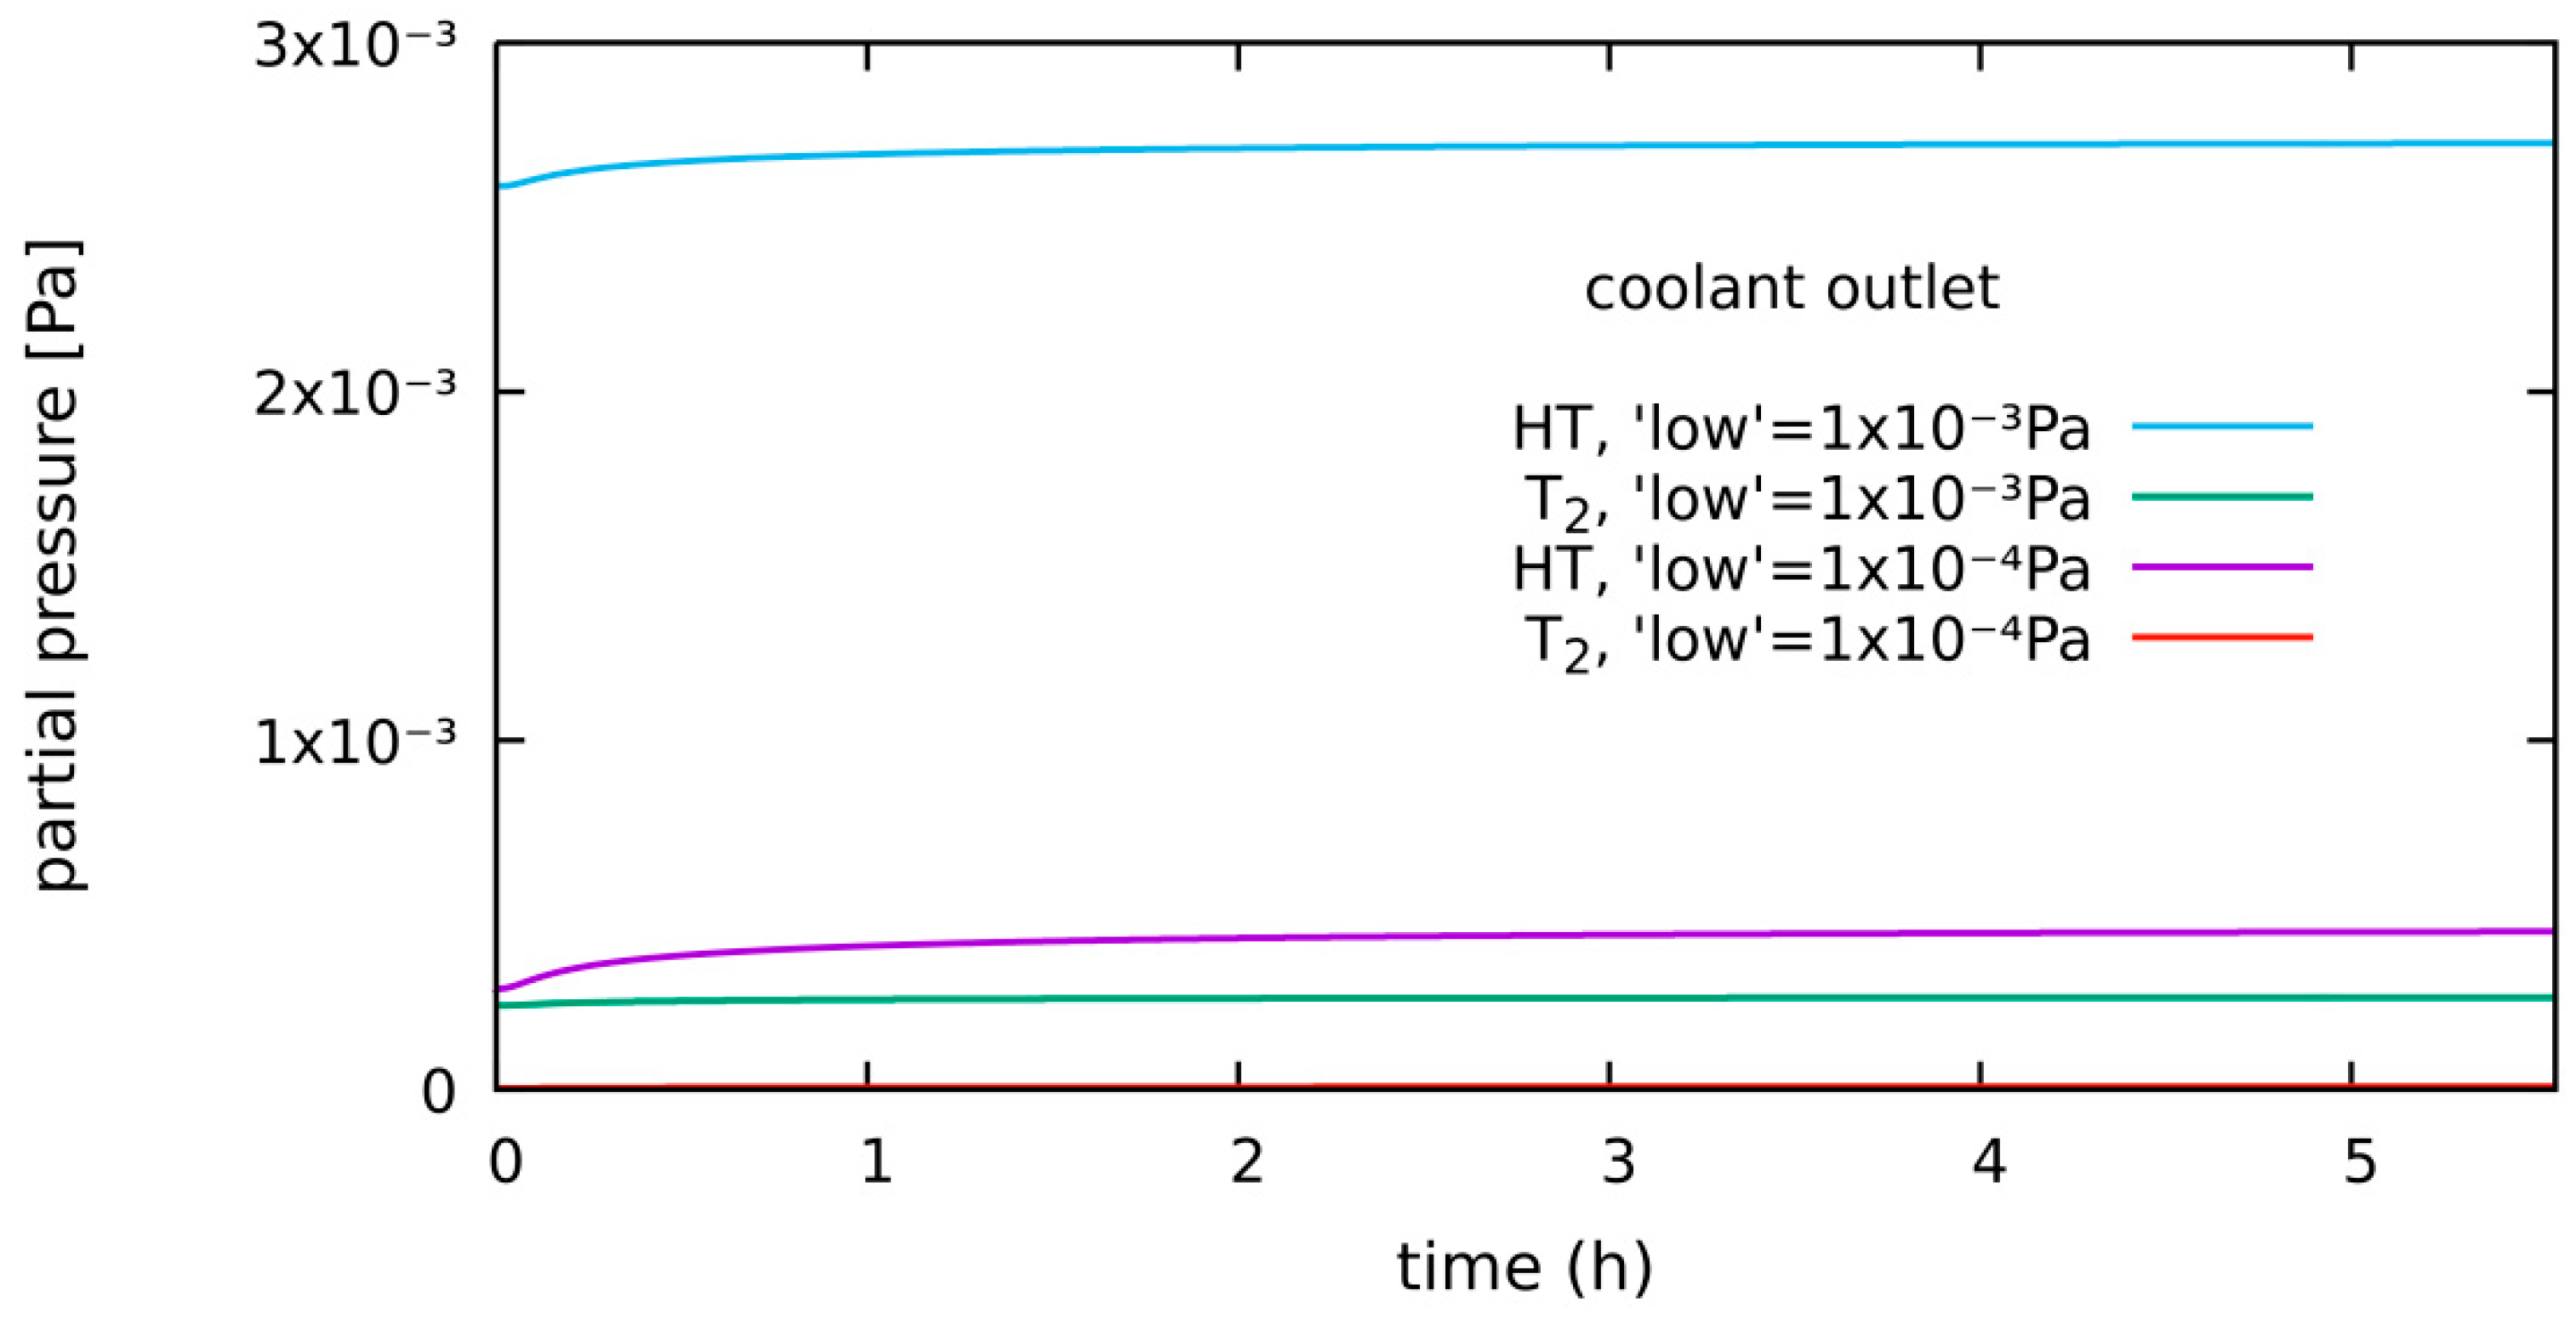
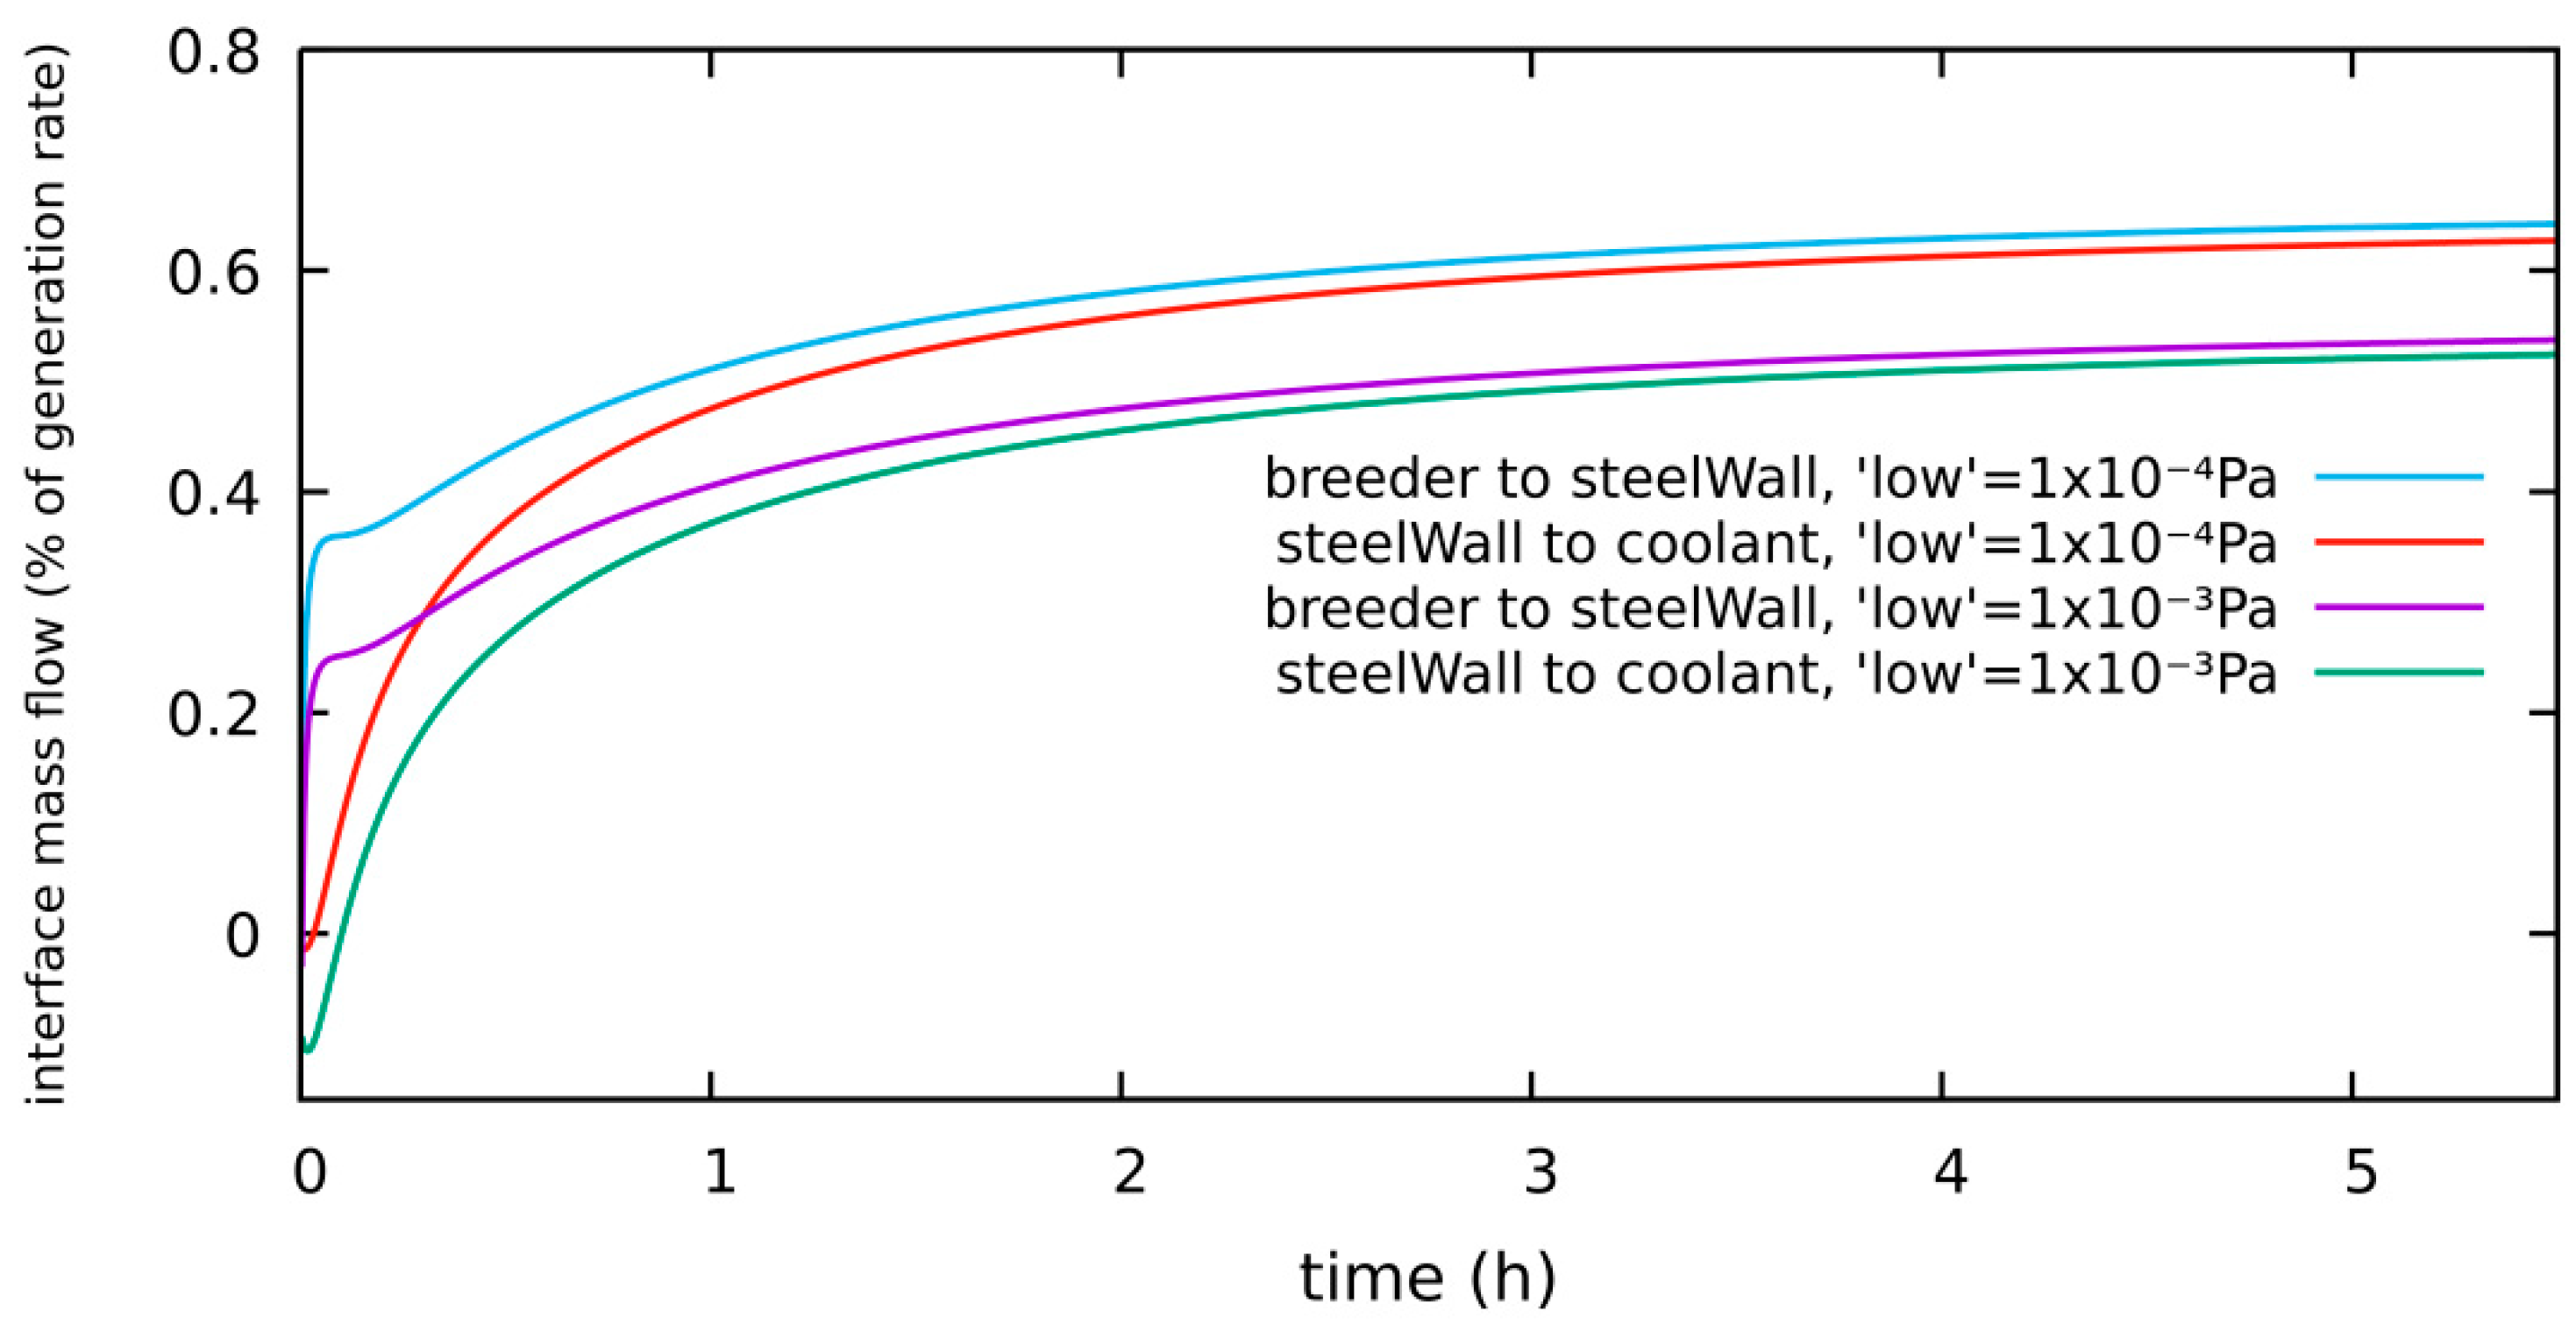
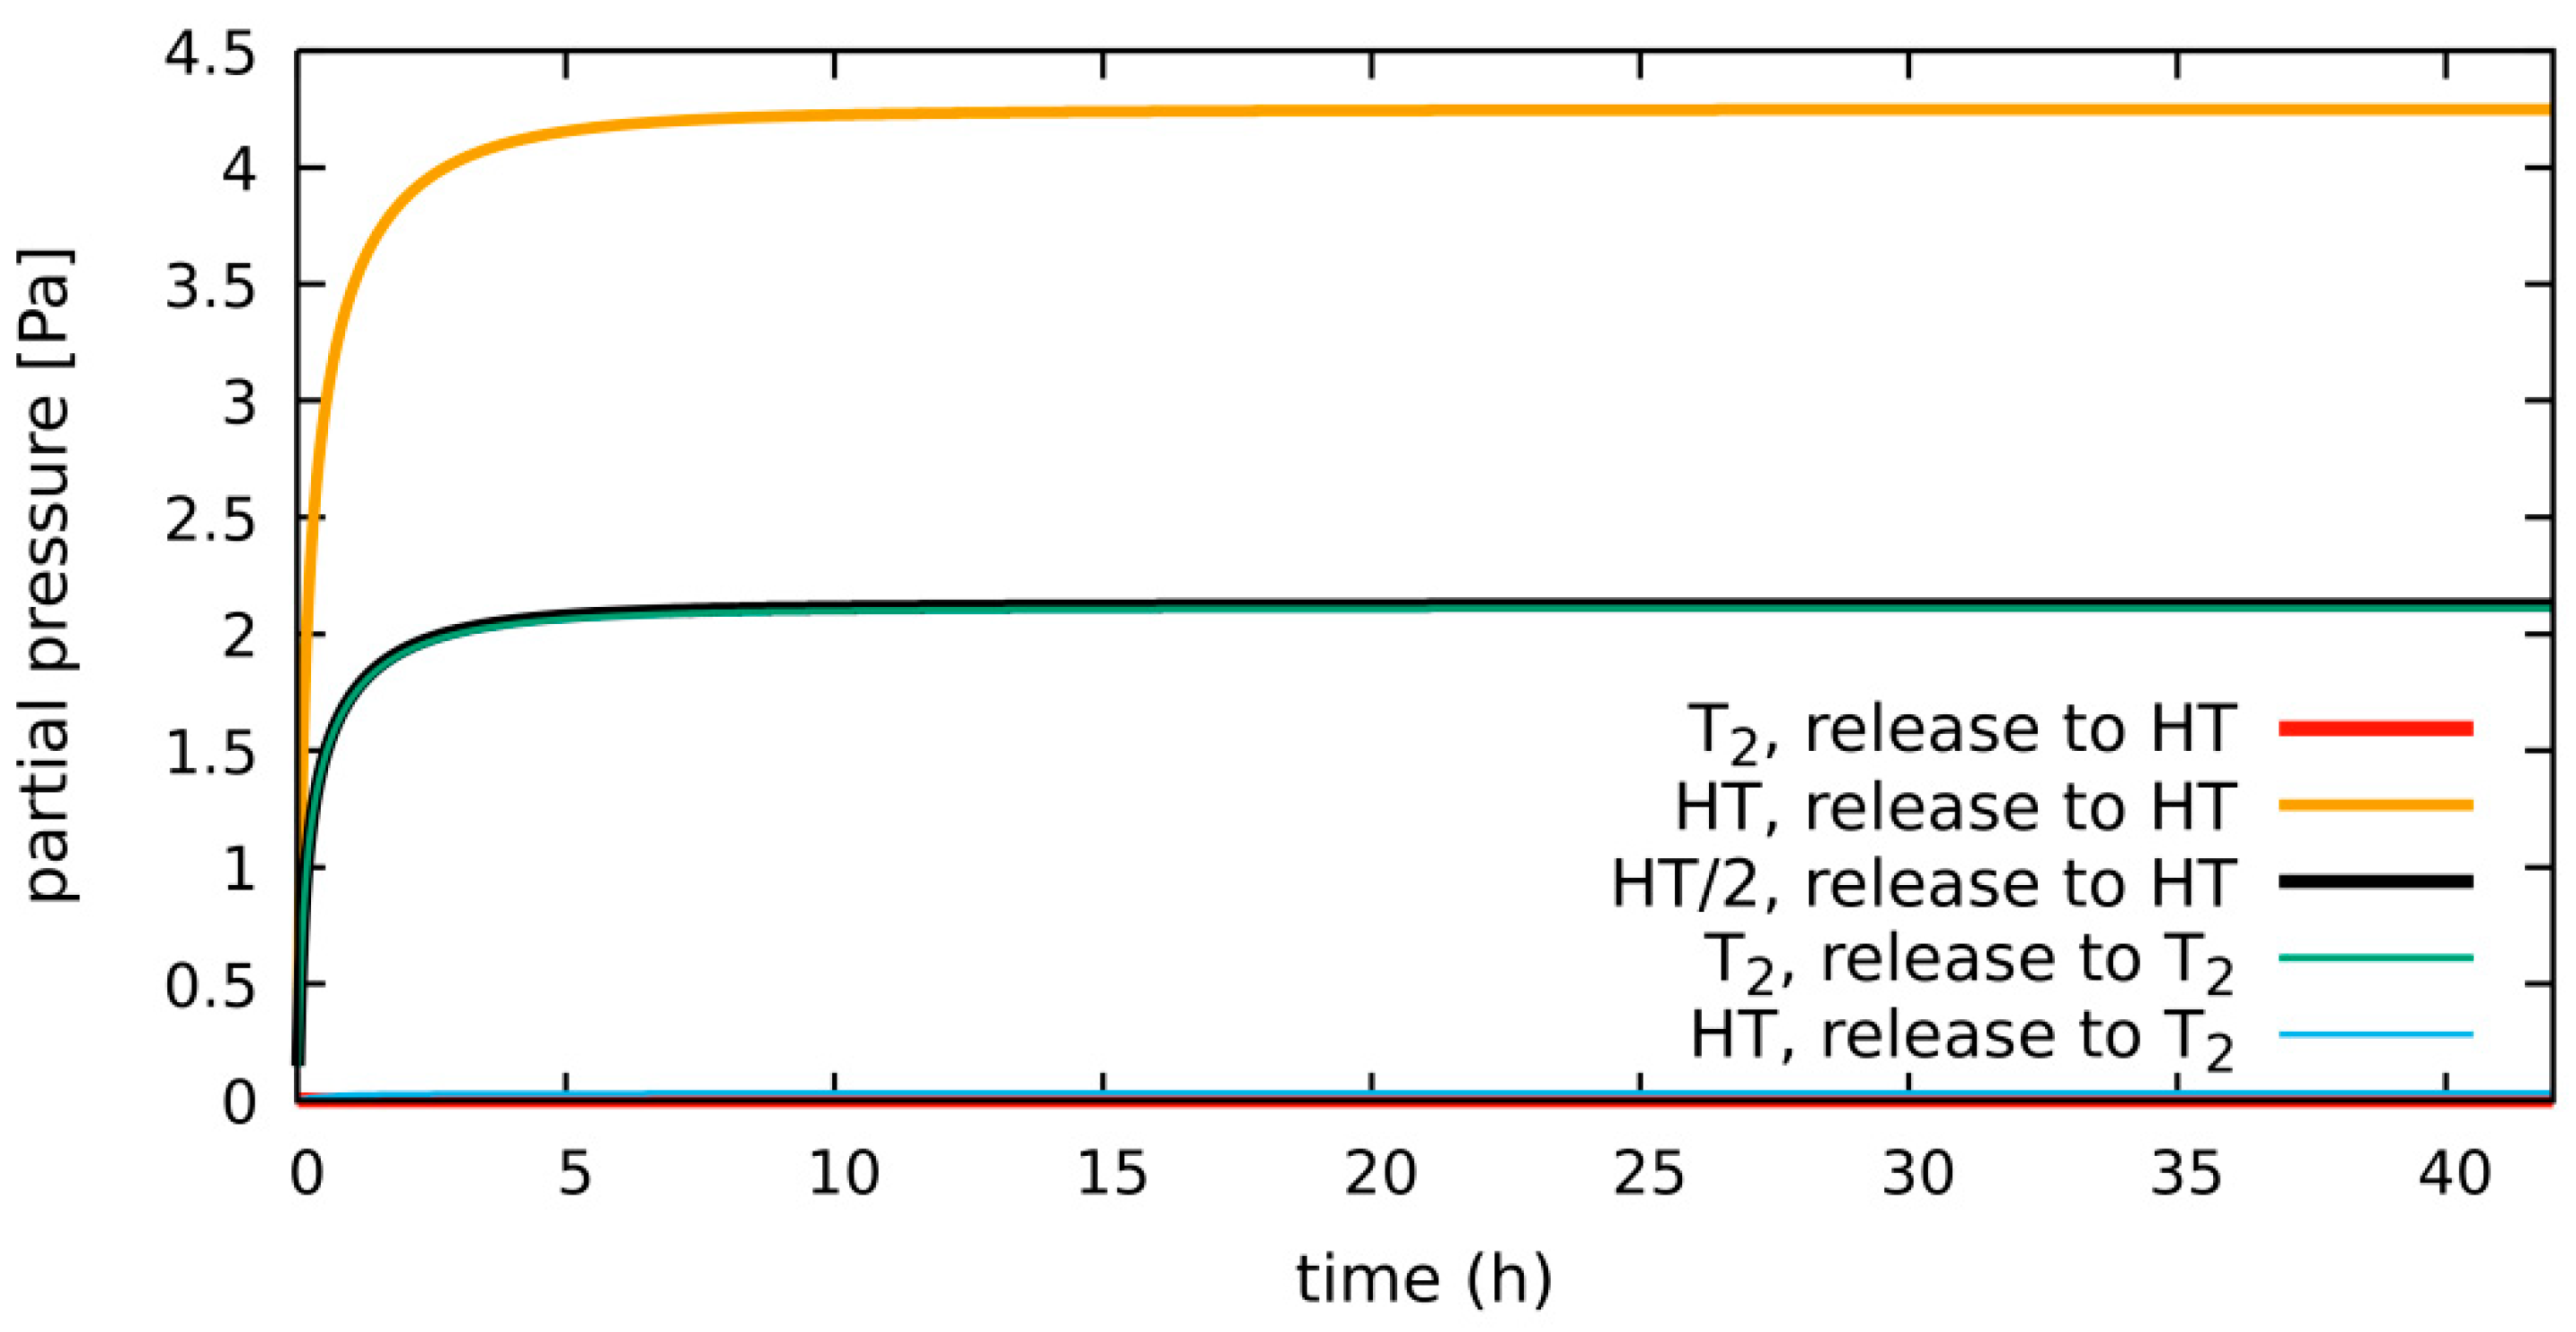
The prerun results for the initial (t = 0) coolant outlet partial pressures in Figure 7 differ considerably, while the subsequent increase during the transient with tritium release switched on is comparatively low. Due to the known high sensitivity of permeation to the counter pressure and the visible sign change from a small steady-state initial flow in opposite directions in the bottom curve in Figure 8, the simulation of Section 4.1.2 is repeated with a new initial “low” concentration of 1 × 10⁻⁴ Pa instead of 1 × 10⁻³ Pa for all H2, HT, and T2 species except the 300 Pa H2 at the purge gas inlet. Figure 10 shows that now (compared to Figure 7) all initial tritium-related partial (counter) pressures are well-below 1 × 10⁻³ Pa.
Figure 11 shows a visible counter pressure impact from the initial “low” level that makes permeation increase by about 20%. Nevertheless, this effect is still small compared to the hydrogen co-permeation effect from adding 300 Pa H2 to the purge gas indicated in Figure 8. The steel wall tritium inventory steady-state level reduces from about 0.17 μg to about 0.15 μg for lower counter-pressures.

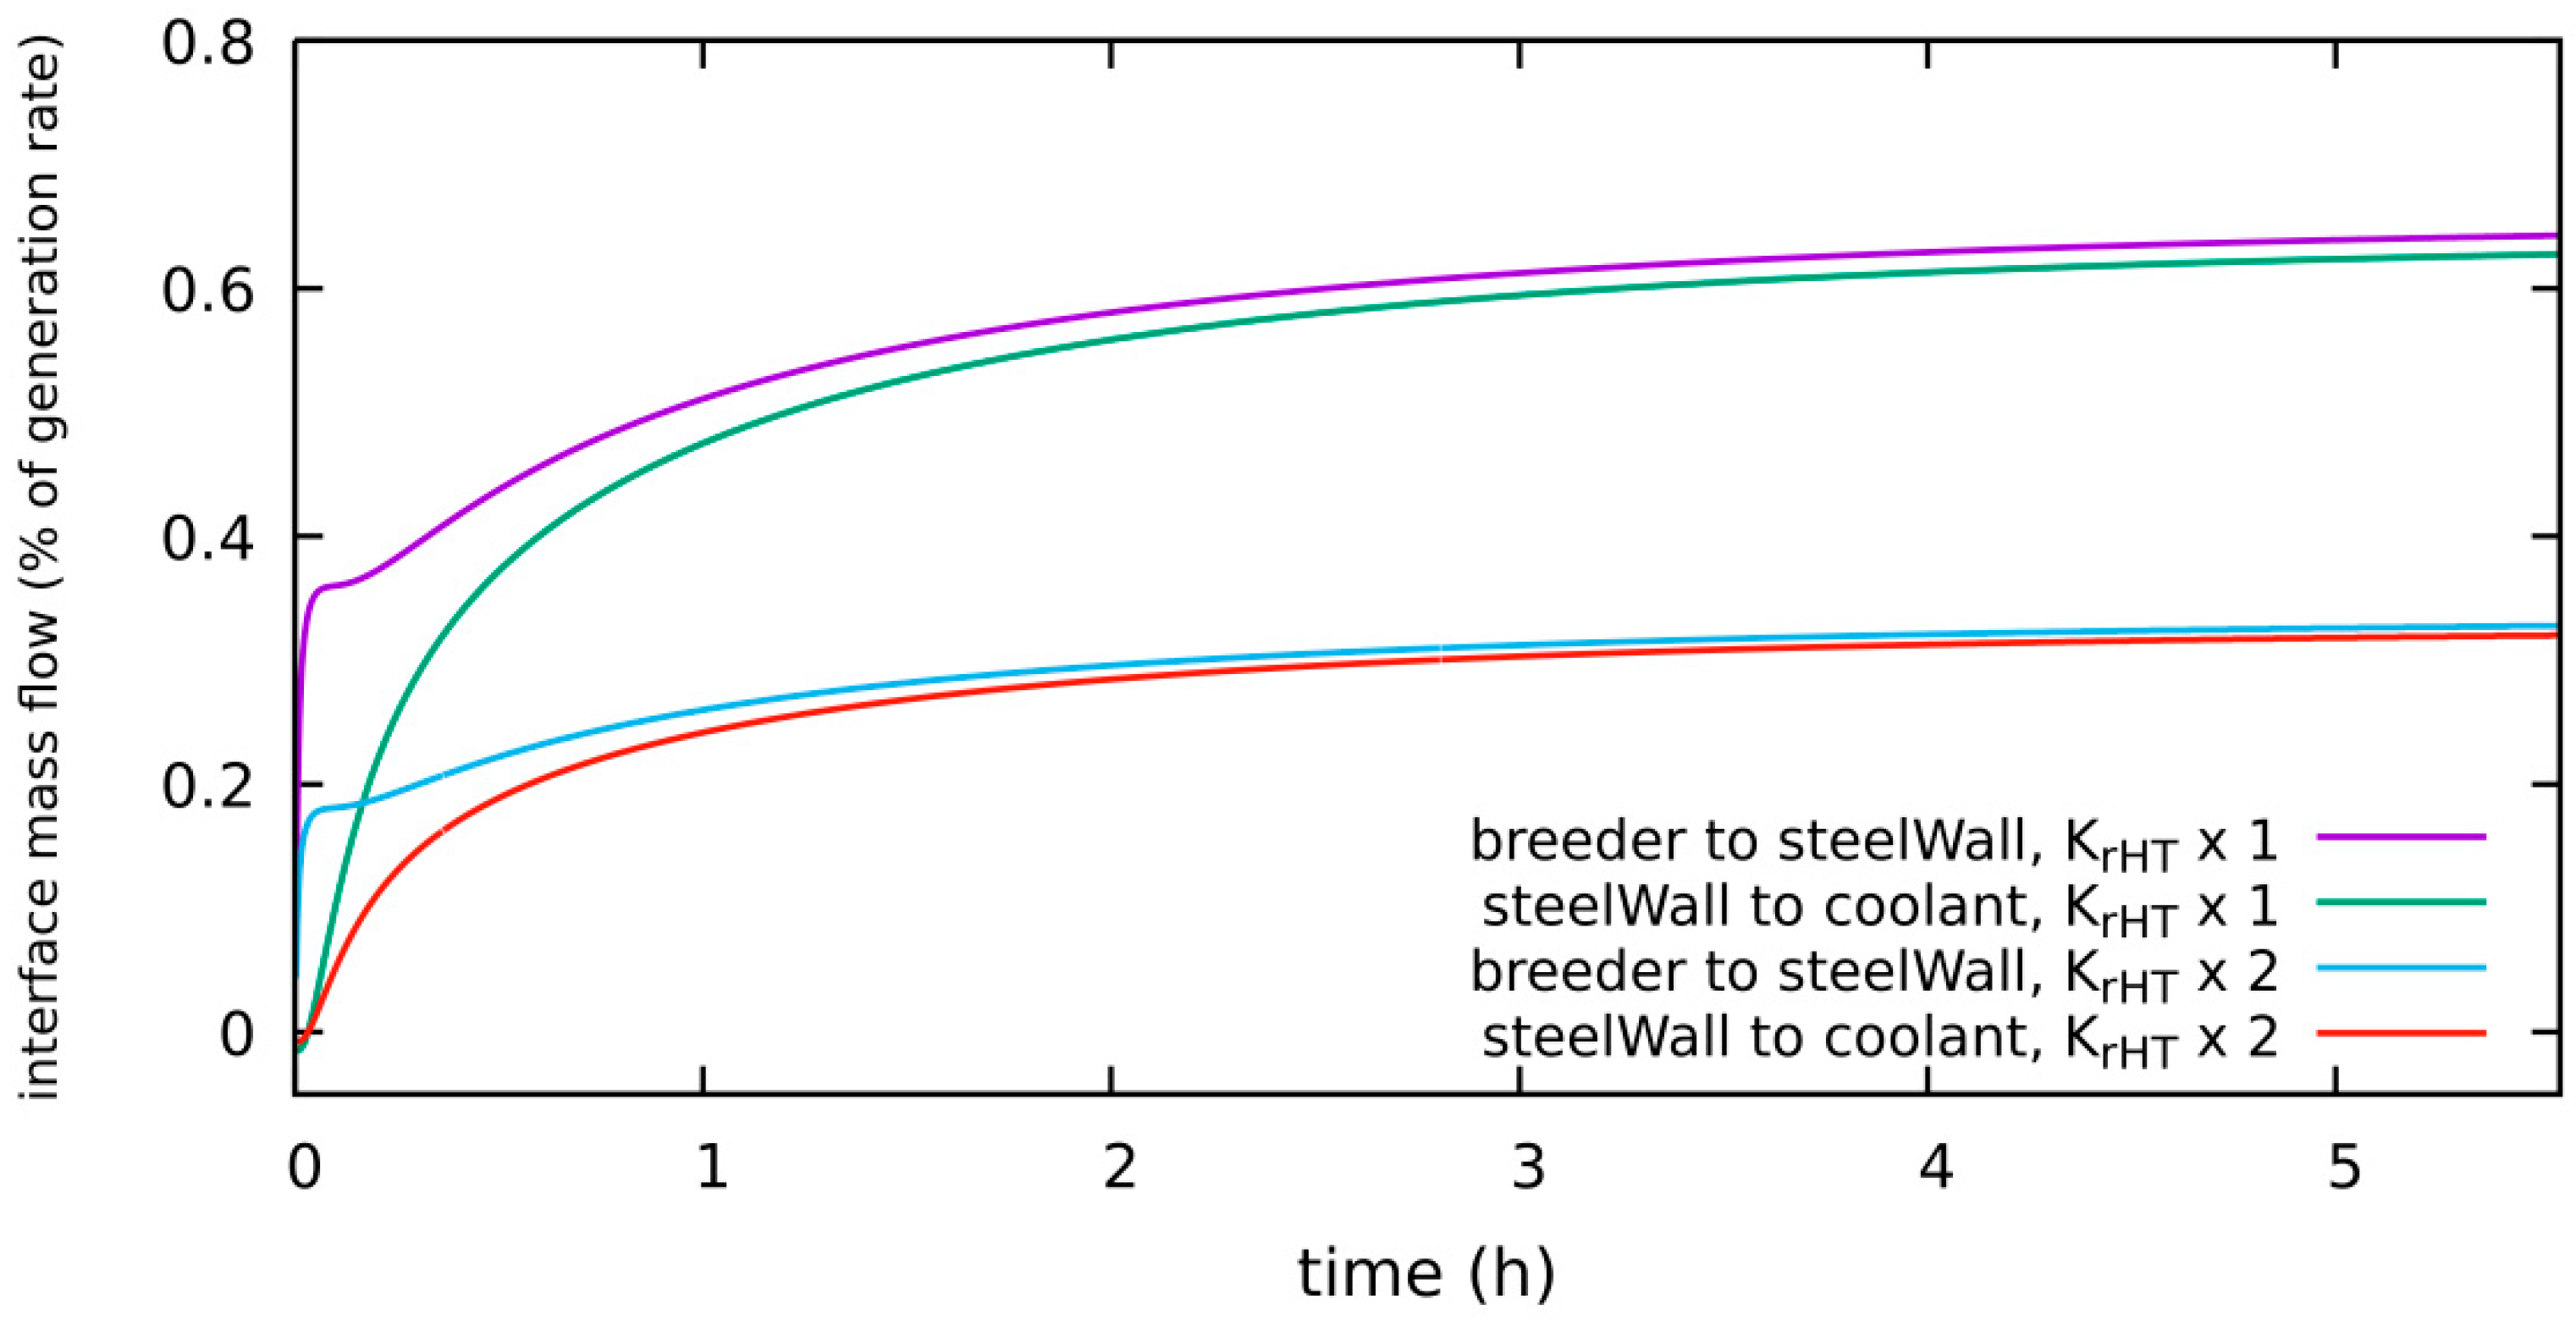
4.1.5. HT System, Diffusion-Limited, 300 Pa H2 in Purge Gas, New “Low” Level: 1 × 10⁻⁴ Pa, Kr_HT × 2

According to [11] the equilibrium composition of the reaction 1 2 H 2 + 1 2 T 2 H T under some simplifying assumptions is characterized by an equilibrium constant K = C H T C H 2 C T 2 = 2 .
One may set up a simple scenario of arbitrary mixtures of H2, HT, and T2 in a volume with contact to a surface. At the surface hydrogen reactions, according to the right sides of Equations (1) and (2), take place. After some time, species’ partial pressures reach a steady state independent of the initial distribution of H and T over the species, i.e., something like “equilibration” takes place. If all species’ rate constants are taken as equal (as has been done above), the asymptotic result could be described as an equilibrium with an equilibrium constant of K = 1. By trying this out, one finds that with all species’ rate constants equal, except when the H-T recombination constant Kr_HT is multiplied by two, the equilibrium composition for K = 2 is received. However, there are several other parameter sets of rate-constant ratios that provide the same result. According to [11], the mixed-molecule HT formation by hopping processes should be twice as probable as the formation of pure molecules H2 and T2, respectively; which, however is still no proof to prefer this set of parameters. Such proof would be possible, e.g., from the direct measurement of H and T interface concentrations.
A scenario with Kr_HT × 2 was set up as an example case to investigate the sensitivity of permeation and inventories on possible species-specific differences of the rate constants.
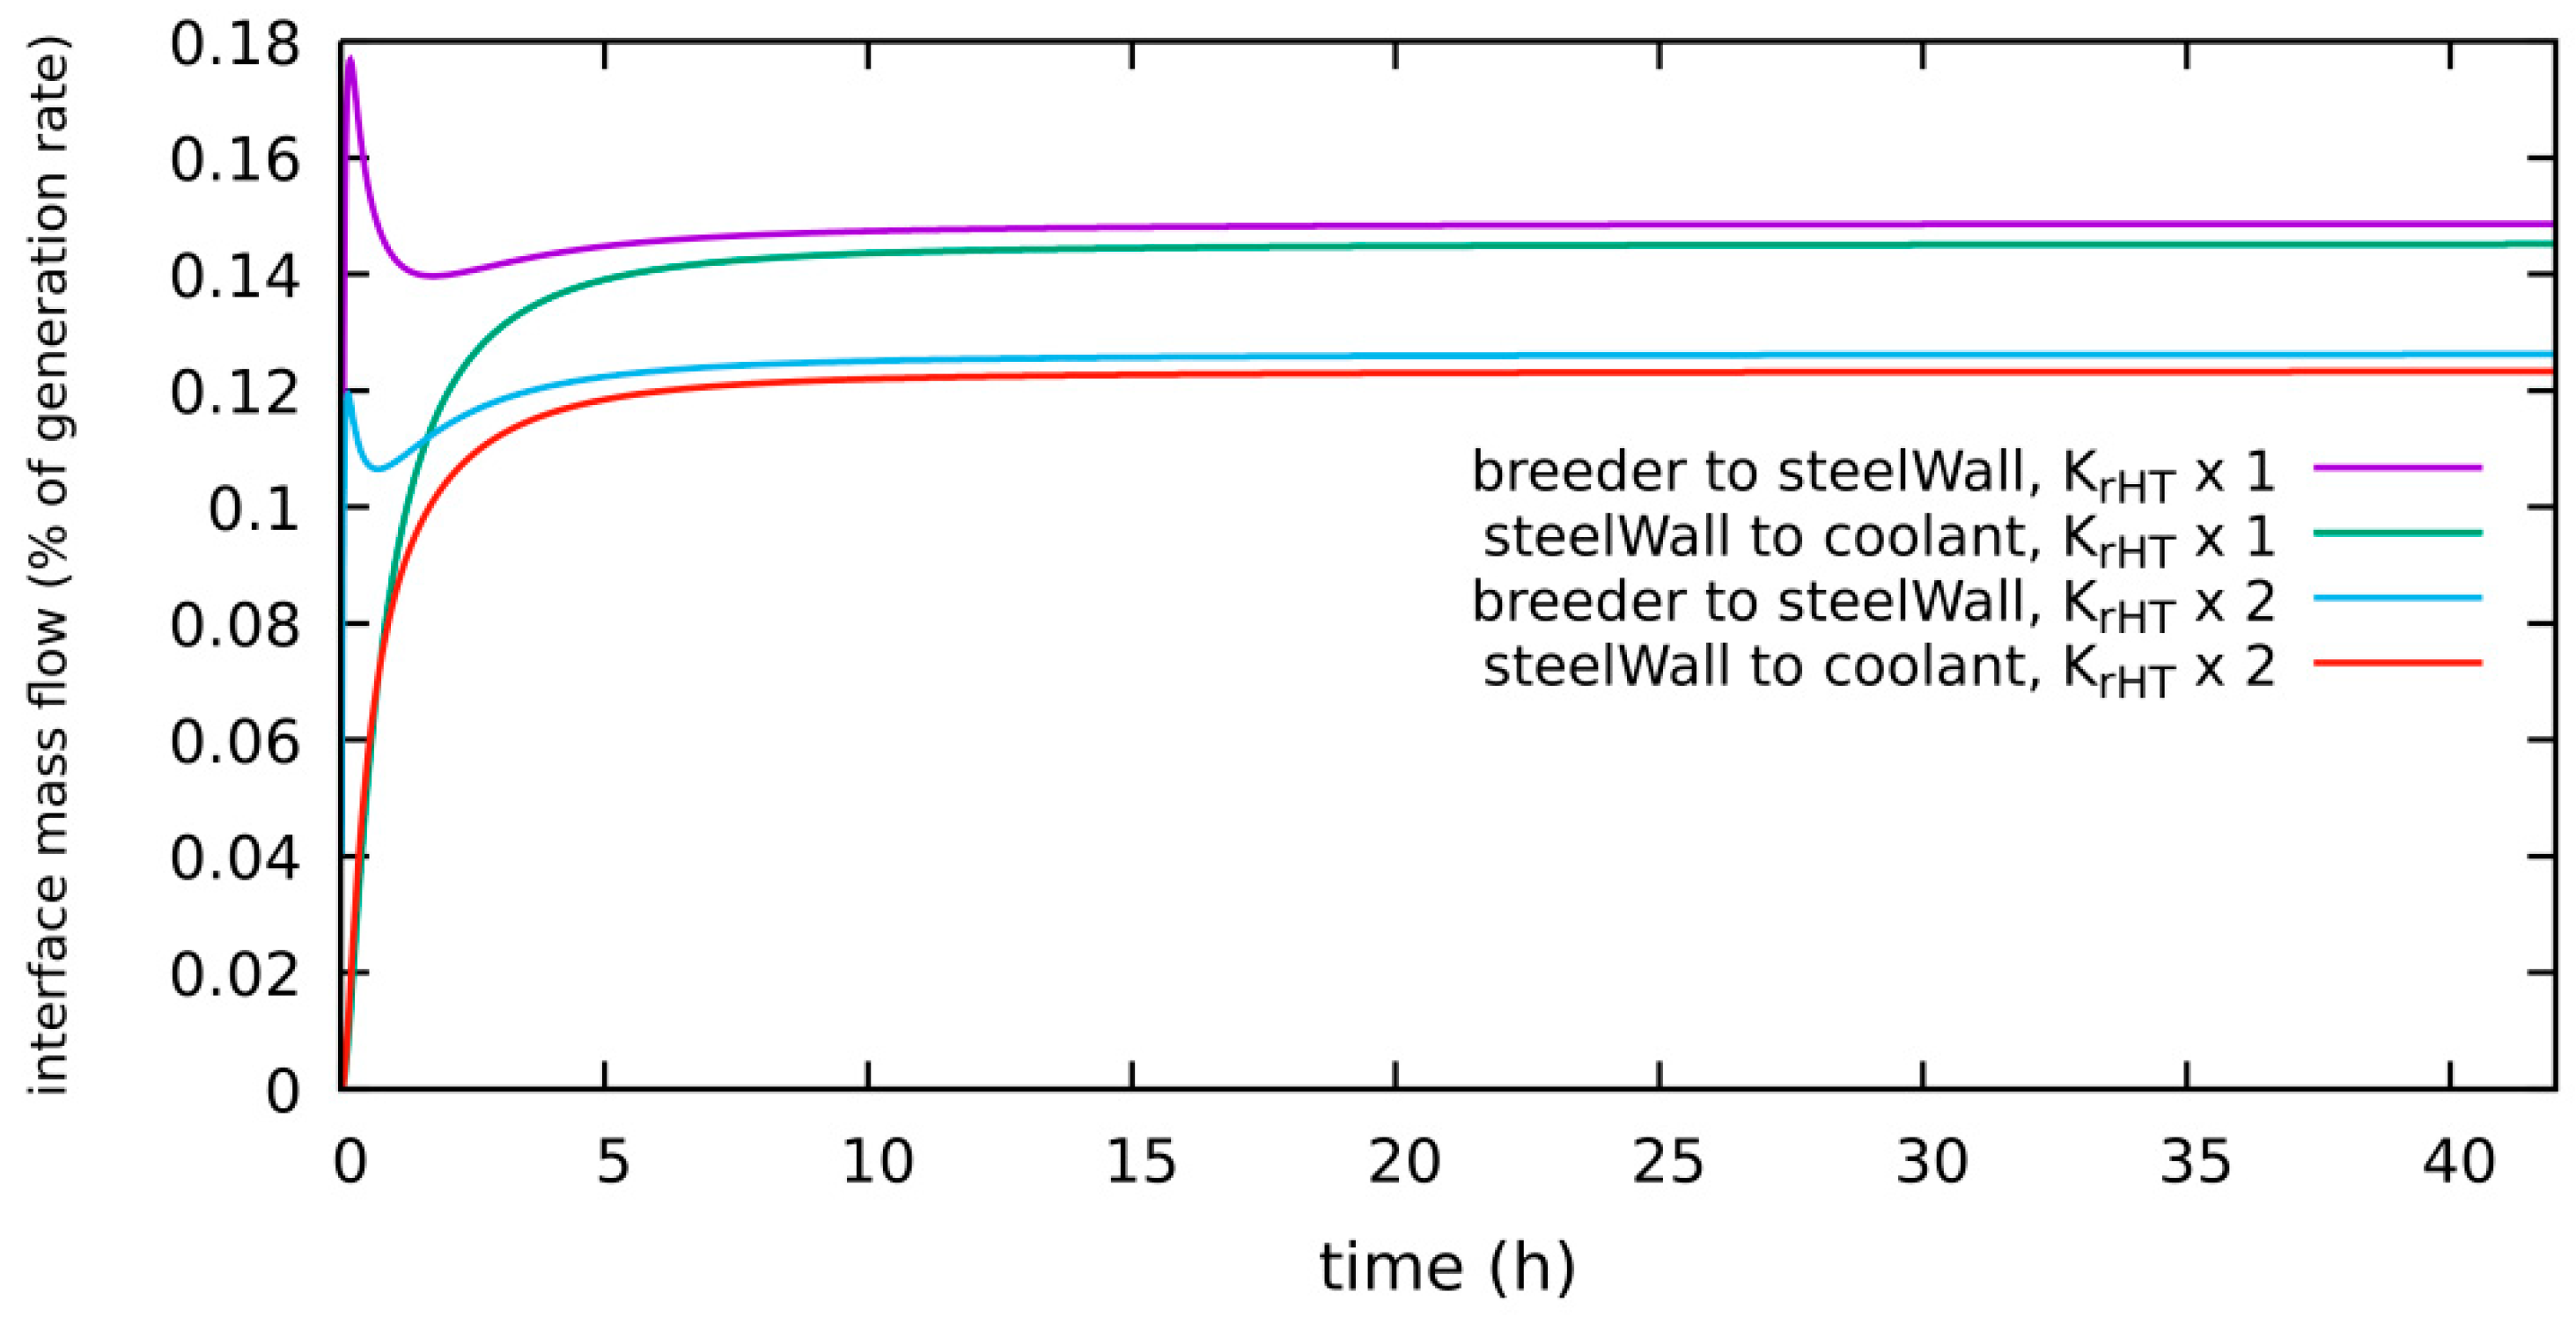
Figure 12 indicates that this choice of the rate constants (K = 2) in the diffusion-limited case reduces tritium permeation by about a factor of two compared to all species’ rate constants being equal (K = 1), respectively. Similarly, the tritium inventory in the steel wall between breeder zone and coolant channel reduces from about 0.15 μg to about 0.075 μg for each pin.

4.1.6. Purge Gas 80 Bar with Equal Mass Flow, Diffusion-Limited

This simulation investigates the consequences with regard to permeation if the purge gas mass flow for 80 bar would be kept the same as for 2 bar. It compares directly to the case and conditions in Section 4.1.1. The volumetric purge gas flow per pin reduces by a factor of 40 from 2.2 × 10⁻⁵ m3/s to 5.5 × 10⁻⁷ m3/s. Figure 13 shows that the purge gas outlet tritium partial pressure increases from about 2 Pa to about 57 Pa due to the now significantly lower purge gas flow speed. Note the visible delay of the initial raise of the outlet pressure signal.
Figure 14 shows that permeation to the coolant increases significantly up to a level of about 30% of the total generated tritium. The tritium inventory in the steel wall between breeder zone and coolant channel rises to a level of about 6.6 μg/pin.

4.1.7. Purge Gas 80 Bar with Equal Volumetric Flow, Diffusion-Limited

In this simulation, the 80-bar purge gas volumetric flow is the same as in the original 2-bar scenario in Section 4.1.1 (2.2 × 10⁻⁵ m3). Therefore, the mass flow is enhanced by a factor of about 40 from 2.75 × 10⁻⁶ kg/s to 1.1 × 10⁻⁴ kg/s. The purge gas tritium partial pressure is basically the same again as for 2 bar (not shown, both are very close to the green curve in Figure 20 in Section 4.2.3 below). Figure 15 compares permeation to the coolant with equal volumetric purge gas flow for 2 vs. 80 bar. Obviously, the results are very similar (4.85% vs. 5%), which indicates that purge gas speed is the decisive quantity with regard to permeation issues. The tritium inventory in the steel wall between breeder zone and coolant channel rises to a quite similar level as for the 2-bar case of about 1.1 μg/pin.

4.2. Surface-Limited Cases

Section 4.2 investigates several surface-limited cases. Most cases compare directly to the diffusion-limited cases of the previous Section 4.1.

4.2.1. No/Low H2 System, Surface-Limited, No/Low H2 in Purge Gas, Single- vs. Two- Species Correlation

This simulation is set up with no (which actually means 1 × 10⁻³ Pa) H2 in the purge gas. It serves as a verification scenario for the new two-species model, too. Figure 16 shows the HT and T2 partial pressures at the coolant gas outlet over time. After tritium release to the breeder is switched on at t = 0 s, permeation achieves 90% of the steady-state level value within about 10 hours. The partial pressure of T2 rises very similarly for the single- and two-species correlations as expected. In contrast to the corresponding diffusion-limited case (shown in Section 4.1.1), there is only a small peak in the HT-signal. Formally the recombination flow JHT,reco = Cs,0_H Cs,0_T Kr_HT rises together with a rising tritium concentration Cs,0_T in the coolant wall compared to the previous steady state without tritium generation. This means that temporarily some H is removed out of the wall until a new, H–T equilibrium state with lower Cs,0_H is reached and the peak in HT (or JHT,reco) vanishes again. It was verified that the HT peak does not appear when the rate constants for HT, Kr/d_HT, are reduced to a value close to zero.
The steady-state permeation level shown in Figure 17 reflects about 0.2% of the total tritium generation rate. The results of the single-species and two-species models obviously match. The tritium inventory in the steel wall between breeder and coolant approaches a steady state value of 1.52 μg/pin.

4.2.2. HT System, Surface-Limited, 300 Pa H2 in Purge Gas

In the next simulation, the purge gas contains 300 Pa H2. In the prerun before the start of tritium release, this H-permeation from the purge gas to the (undoped) coolant had already reached a steady state. Figure 18 compares the results with 1 × 10⁻³ Pa H2 and 300 Pa H2 in the purge gas. Now the dominant species in the coolant is HT while the T2 partial pressure rises only very slightly. HT obviously contributes lower than twice the T2 contribution in both the single-species and the 1 × 10⁻³ Pa H2 two-species cases.
Again, the quantitative result may be read better from the patch mass flows, see Figure 19. Compared to the low hydrogen purge gas case, now (1) the steady state tritium permeation level is about 25% lower and (2) is achieved significantly faster.
The transient tritium inventory in the steel wall that separates breeder and coolant approaches a steady-state value of 0.19 μg/pin. All observations might be compiled together with the following description: the mixed-molecule species (which is negligible in the low H2 case) opens an additional dissociation + recombination path in parallel that basically should already accelerate surface exchange processes. Moreover, the H2, HT, and H concentrations enter the rate equations of this path. In the 300Pa H2 purge gas scenario, these concentrations are significantly higher than the T2 and T concentrations. Therefore, from the rate equations, significantly lower tritium levels are expected in the solid wall (asymptotic level now is 0.19 μg/pin while it was 1.52 μg/pin with 1 × 10⁻³ Pa H2) that overcompensate for the possibly higher recombination rate on the coolant side of the wall. In summary, the key finding is that co-permeation of a major species (H) reduces wall inventory as well as permeation flow of the minor species (T).

4.2.3. HT System, Surface-Limited, 300 Pa H2 in Purge Gas, HT vs. T2 as the Released Species

So far, the release of tritium from the pebble bed had been done to T2 exclusively, even in the 300 Pa H2 case. In an additional simulation, the same amount of tritium was released to the purge gas with 300 Pa H2 exclusively as HT. Unlike in the corresponding diffusion-limited Section 4.1.3 where high rate-constants had already equalized the purge gas outlet composition, the released species in this simulation at the purge gas outlet had twice the partial pressure of T2 as HT, but close to zero T2 were found. The transient behavior is not visibly affected—see Figure 20. Steel inventories and coolant gas results can hardly be distinguished from the corresponding above results in Section 4.2.2 (and therefore they are not shown here). Probably this is a consequence of all species’ rate constants being taken as equal.

4.2.4. HT System, Surface-Limited, 300 Pa H2 in Purge Gas, Kr_HT × 2

For completeness, the enhanced recombination constant scenario (Section 4.1.5) is also simulated for the surface-limited case. Figure 21 shows that permeation is reduced by about 15% with the enhanced HT recombination rate constant. The inventory in the steel wall between the breeder zone and the coolant channel reduces by a factor of about two from about 0.19 μg/pin to about 0.095 μg/pin.

4.2.5. Purge Gas 80 Bar with Equal Mass Flow, Surface-Limited

This simulation result may help to estimate how much more pumping power is required for an 80-bar purge gas system in practice with regard to permeation to the coolant. Figure 22 shows that the expected asymptotic permeation rate is a factor of about 30 higher than for the corresponding 2-bar scenario with equal purge gas mass flow (Section 4.2.1). Compared to the corresponding diffusion-limited regime case (Section 4.1.6) permeation reduces to about 6%, i.e., to a factor of 5 lower. The expected inventory in the steel wall between the breeder zone and the coolant channel is 9.5 μg/pin. This is the highest value of all simulations in this study.

5. Summary

The OpenFOAM model was upgraded until the first meaningful 2D simulations of a (simplified) DEMO HCPB pin were possible. The results for cases that had been simulated with the single-species and the two-species correlations did show close to perfect coincidence. Different permeation regimes (diffusion-limited vs. surface-limited), different purge gas hydrogen preloads (1 × 10⁻⁴ Pa/1 × 10−3 Pa/300 Pa), two purge gas pressures (2 bar and 80 bar) and species-dependent rate constants were investigated. Table 2 summarizes the above results with regard to tritium permeation and pin steel wall tritium inventories.
In H-T co-permeation scenarios, the results showed a visible sensitivity already on partial pressures of 1 × 10⁻³ Pa of the minor species, as well as on species-specific rate constants. While one cannot extract a general rule for the tritium inventories in the steel walls, the highest tritium permeation rates are found for the diffusion-limited cases and those with low hydrogen content in the purge gas. In practice, however, the release of the (not-permeating) species HTO will play a considerable role; and perfect, clean surfaces and the absence of additional H in purge gas seem unrealistic operation conditions. This means that the above results come close to worst-case scenarios with regard to permeation, and probably significantly overestimate permeation in technical practice. Additional simulations investigated a purge gas pressure level raised to the coolant gas pressure level of 80 bar with regard to a leak-tolerant design. These results—although probably also an overestimation—suggest that the current HCPB pin design and operating concept should be reviewed with regard to tritium permeation to the coolant.

Author Contributions

Writing—original draft preparation, V.P.; writing—review and editing, F.A., C.K., D.K., G.S. and A.v.d.W.; project administration, F.A. All authors have read and agreed to the published version of the manuscript.

Funding

This research received no external funding.

Acknowledgments

This work has been carried out within the framework of the EUROfusion Consortium and has received funding from the Euratom research and training programme 2014–2018 and 2019–2020 under grant agreement No 633053. The views and opinions expressed herein do not necessarily reflect those of the European Commission.

Conflicts of Interest

The authors declare no conflict of interest. The funders had no role in the design of the study; in the collection, analyses, or interpretation of data; in the writing of the manuscript, or in the decision to publish the results.

References

  1. Zhou, G.; Kang, Q.; Hernández, F.A.; D’Amico, S.; Kiss, B. Thermal hydraulics activities for consolidating HCPB breeding blanket of the European DEMO. Nucl. Fusion 2020, 60, 096008. [Google Scholar] [CrossRef]
  2. Hernández, F.A.; Pereslavtsev, P.; Zhou, G.; Kang, Q.; D’Amico, S.; Neuberger, H.; Boccaccini, L.V.; Kiss, B.; Nádasi, G.; Maqueda, L.; et al. Consolidated design of the HCPB Breeding Blanket for the pre-Conceptual Design Phase of the EU DEMO and harmonization with the ITER HCPB TBM program. Fusion Eng. Des. 2020, 157, 111614. [Google Scholar] [CrossRef]
  3. Alberghi, C.; Candido, L.; Testoni, R.; Utili, M.; Zucchetti, M. Magneto-convective effect on tritium transport at breeder unit level for the WCLL breeding blanket of DEMO. Fusion Eng. Des. 2020, 160, 111996. [Google Scholar] [CrossRef]
  4. Candido, L.; Testoni, R.; Utili, M.; Zucchetti, M. Tritium transport model at breeder unit level for WCLL breeding blanket. Fusion Eng. Des. 2019, 146, 1207–1210. [Google Scholar] [CrossRef]
  5. Zhao, X.; Ni, M.; Nie, B.; Zhang, B.; Chen, L.; Huang, K.; Liu, S. 3D tritium transport analysis for WCCB blanket based on COMSOL. Fusion Eng. Des. 2020, 151, 111405. [Google Scholar] [CrossRef]
  6. Ying, A.; Zhang, H.; Merrill, B.; Ahn, M.-Y.; Cho, S. Breeding blanket system design implications on tritium transport and permeation with high tritium ion implantation: A MATLAB/Simulink, COMSOL integrated dynamic tritium transport model for HCCR TBS. Fusion Eng. Des. 2018, 136, 1153–1160. [Google Scholar] [CrossRef]
  7. Carella, E.; Moreno, C.; Urgorri, F.R.; Rapisarda, D.; Ibarra, A. Tritium modelling in HCPB breeder blanket at a system level. Fusion Eng. Des. 2017, 124, 687–691. [Google Scholar] [CrossRef]
  8. Pan, L.; Chen, H.; Zeng, Q. Tritium transport analysis of HCPB blanket for CFETR. Fusion Eng. Des. 2016, 113, 82–86. [Google Scholar] [CrossRef]
  9. Franza, F.; Boccaccini, L.V.; Demange, D.; Ciampichetti, A.; Zucchetti, M. Tritium Transport Issues for Helium-Cooled Breeding Blankets. IEEE Trans. Plasma Sci. 2014, 42, 1951–1957. [Google Scholar] [CrossRef]
  10. Pasler, V.; Arbeiter, F.; Klein, C.; Klimenko, D.; Schlindwein, G.; von der Weth, A. Development and verification of a component-level hydrogen transport model for a DEMO-like HCPB breeder unit with OpenFOAM. Fusion Eng. Des. 2018, 127, 249–258. [Google Scholar] [CrossRef]
  11. Ambrosek, J.; Longhurst, G.R. Verification and Validation of TMAP 7; INEEL/EXT-04-01657; Idaho National Laboratory: Idaho Falls, ID, USA, 2004. [Google Scholar]
  12. Kwast, H.; Conrad, R.; May, R.; Casadio, S.; Roux, N.; Werle, H. The behaviour of ceramic breeder materials with respect to tritium release and pellet/pebble mechanical integrity. J. Nucl. Mater. 1994, 212–215, 1010–1014. [Google Scholar] [CrossRef]
  13. Pereslavtsev, P.; Hernández, F.A.; Zhou, G.; Lu, L.; Wegmann, C.; Fischer, U. Nuclear analyses of solid breeder blanket options for DEMO: Status, challenges and outlook. Fusion Eng. Des. 2019, 146, 563–567. [Google Scholar] [CrossRef] [Green Version]
  14. Franza, F.; Boccaccini, L.; Ciampichetti, A.; Zucchetti, M. Tritium transport analysis in HCPB DEMO blanket with the FUS-TPC code. Fusion Eng. Des. 2013, 88, 2444–2447. [Google Scholar] [CrossRef]
  15. Esteban, G.; Peña, A.; Urra, I.; Legarda, F.; Riccardi, B. Hydrogen transport and trapping in EUROFER’97. J. Nucl. Mater. 2007, 367–370, 473–477. [Google Scholar] [CrossRef]
  16. Esteban, G.; Perujo, A.; Sedano, L.; Mancinelli, B. The surface rate constants of deuterium in the reduced activating martensitic steel OPTIFER-IVb. J. Nucl. Mater. 2000, 282, 89–96. [Google Scholar] [CrossRef]
  17. Tosti, S. “Membranes and Membrane Reactors for Tritium Separation”, namely pages 209 ff. In Tritium in Fusion; Tosti, S., Ghirelli, N., Eds.; Nova Science Publishers Inc.: Hauppauge, NY, USA, 2013; ISBN 978-1-62417-270-0. [Google Scholar]
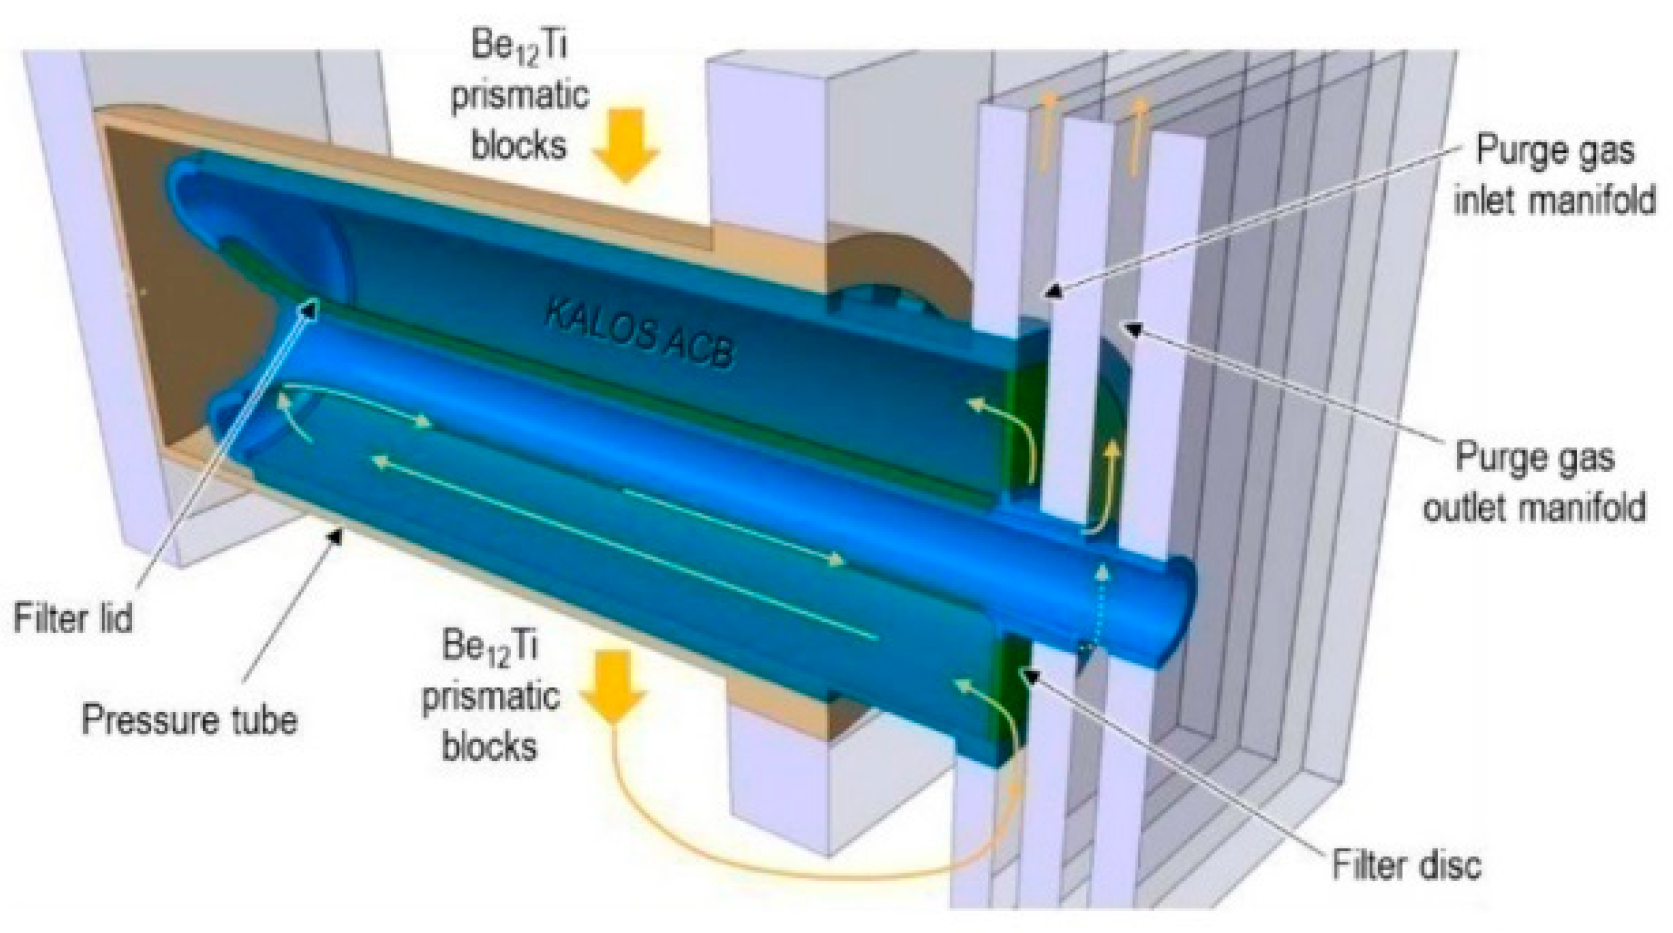
Figure 1. DEMO helium-cooled pebble bed (HCPB) fuel pin with purge gas loop.
Applsci 11 03481 g001
Figure 2. 3D temperature field in a 60° sector of a DEMO HCPB fuel pin [1].
Applsci 11 03481 g002
Figure 3. 2D OpenFOAM mesh with boundary conditions (BCs) of helium purge and coolant flow fields.
Applsci 11 03481 g003
Figure 4. 1D tritium generation rate from MCNP calculations [13]. Green: interpolated data for inboard pin; blue: extrapolated data for outboard pin.
Applsci 11 03481 g004
Figure 5. Transient T2 and HT partial pressure at coolant outlet for single- vs. two-species model with no/1 × 10−3 Pa H2 in the purge gas.
Applsci 11 03481 g005
Figure 6. Transient tritium flow through patch interfaces breeder to and from steel and steel to and from coolant for single- vs. two-species model with no/1 × 10−3 Pa H2 in the purge gas.
Applsci 11 03481 g006
Figure 7. Transient T2 and HT partial pressure at coolant outlet for 1 × 10⁻³ Pa vs. 300 Pa H2 in the purge gas.
Applsci 11 03481 g007
Figure 8. Transient tritium flow through patch interfaces breeder to and from steel, and steel to and from coolant for 1 × 10⁻³ Pa vs. 300 Pa H2 in the purge gas.
Applsci 11 03481 g008
Figure 9. T2 in breeder purge gas at 20,000 s problem time for T2 vs. HT release from pebbles.
Applsci 11 03481 g009
Figure 10. Transient T2 and HT partial pressure at coolant outlet for 300 Pa H2 in purge gas for 1 × 10⁻⁴ Pa vs. 1 × 10⁻³ Pa taken as low level in inlet BCs.
Applsci 11 03481 g010
Figure 11. Transient tritium flow through patch interfaces breeder to and from steel, and steel to and from coolant for 1 × 10⁻⁴ Pa vs. 1 × 10⁻³ taken as low level in inlet BCs.
Applsci 11 03481 g011
Figure 12. Transient tritium flow through patch interfaces breeder to and from steel, and steel to and from coolant for K = 1 vs. K = 2.
Applsci 11 03481 g012
Figure 13. Transient T2 partial pressure at purge gas channel outlet for 2-bar vs. 80-bar purge gas pressure at equal mass flow.
Applsci 11 03481 g013
Figure 14. Transient tritium flow through patch interfaces breeder to and from steel, and steel to and from coolant for 2-bar vs. 80-bar purge gas pressure at equal mass flow.
Applsci 11 03481 g014
Figure 15. Transient tritium flow through patch interfaces breeder to and from, steel, and steel to and from coolant for 2-bar vs. 80-bar purge gas pressure at equal volumetric flow.
Applsci 11 03481 g015
Figure 16. Transient T2 and HT partial pressures for single- vs. two-species model.
Applsci 11 03481 g016
Figure 17. Transient tritium flow through patch interfaces breeder to and from steel, and steel to and from coolant for surface-limited conditions. The results of the single- and two-species models obviously match.
Applsci 11 03481 g017
Figure 18. Transient T2 and HT partial pressures at coolant outlet for 300 Pa H2 in purge gas compared to T2 in a single-species system (without H).
Applsci 11 03481 g018
Figure 19. Transient tritium flow through patch interfaces breeder to and from steel, and steel to and fromcoolant for surface- limited conditions for 1 × 10⁻³ Pa vs. 300 Pa H2 in purge gas.
Applsci 11 03481 g019
Figure 20. T2 and HT partial pressures at the purge gas outlet for T2 vs. HT release from pebbles.
Applsci 11 03481 g020
Figure 21. Transient tritium flow through patch interfaces breeder to and from steel, and steel to and from coolant for K = 1 vs. K = 2.
Applsci 11 03481 g021
Figure 22. Transient tritium flow through patch interfaces breeder to and from steel, and steel to and from coolant for 2-bar vs. 80-bar purge gas pressure at equal mass flow.
Applsci 11 03481 g022
Table 1. OpenFOAM simulation parameters.
Hydrogen SpeciesH, T, H2, T2, HT
operating temperatureimported CFX temperature field [1]
pebble bed porosity (void fraction)0.36
coolant80 bar He, inlet speed 20 m/s,
pin coolant mass flow = 2.405 × 10⁻² kg/s
purge gas2 bar He, inlet speed 1 cm/s
pin purge gas mass flow = 2.75 × 10⁻⁶ kg/s
isotropic Darcy parameter for porous flow in flow equations = 7 × 10 6 m−2
H2, HT, T2 purge + coolant inlet BC and initial conditions1 × 10−3 Pa (sometimes named “no/low” H2 content in text)
H+T initial concentration in steel/EUROFER before prerun4.4 × 10 19 atoms/m3 (Sieverts equilibrium for around 800K vs. 1 × 10⁻³ Pa T2 for EUROFER)
tritium generation rate1D-MCNP simulation (figure 3.4) [13]
tritium residence time [14] τ ( T )   =   4.608   ×   10 2   exp ( 9729 T ) ( s ) (note that this is not yet ACB but still Li4OSi4 pebbles data!)
H+T Sieverts constant [15] K S   =   0.0225   exp ( 15.1   kJ / mol R T ) ( mol m 3 Pa )
H+T rate constants [16] in surface- limited cases K d   or   σ K 1   =   2.998   ×   10 8 exp ( 29.3 kJ / mol R T )   ( mol m 2 s Pa ) ;   K r   or   σ K 2 = σ K 1 / K S 2
H+T rate constants in diffusion- limited casesSurface-limited rate constants × 105 with same Ks
tritium diffusion coefficient [15] D   = 4.57   ×   10 7 3 exp ( 22.3 kJ / mol R T ) ( m 2 s )
Table 2. Summary of permeation rates (% of T generation rate) and steel tritium inventories (μg/single pin) results for all cases of this study.
Permeation RegimePurge GasPermeation to CoolantPin Wall T InventoryCase/SectionComment
diffusion-limited1 × 10−3 Pa H2 2 bar He5% of g.r.1.1 gSection 4.1.1single- vs. two-species model verification
diffusion-limited300 Pa H2 2 bar He0.55% of g.r.0.17 gSection 4.1.2 (Section 4.1.3)Section 4.1.3: T2 vs. HT release
diffusion-limited300 Pa H2
2 bar He
0.64% of g.r.0.15 gSection 4.1.4low level = 1 × 10⁻⁴ Pa
diffusion-limited300 Pa H2
2 bar He
0.32% of g.r.0.075 gSection 4.1.5Kr_HT × 2,
low level = 1 × 10⁻⁴ Pa
diffusion-limited1 × 10−3 Pa H2 80 bar He30% of g.r.6.6 gSection 4.1.6equal mass flow like 2 bar Section 4.1.1
diffusion-limited1 × 10−3 Pa H2 80 bar He4.85% of g.r.1.1 gSection 4.1.7equal volumetric flow like 2 bar Section 4.1.1
surface-limited1 × 10−3 Pa H2 2 bar He0.2% of g.r.0.15 gSection 4.2.1single- vs. two-species model verification
surface-limited300 Pa H2
2 bar He
0.15% of g.r.0.19 gSection 4.2.2 (Section 4.2.3)Section 4.2.3: T2 vs. HT release
surface-limited300 Pa H2
2 bar He
0.12% of g.r.0.095 gSection 4.2.4Kr_HT × 2
surface-limited1 × 10−3 Pa H2 80 bar He6% of g.r.9.5 gSection 4.2.5equal mass flow like 2 bar Section 4.2.1
Publisher’s Note: MDPI stays neutral with regard to jurisdictional claims in published maps and institutional affiliations.