
Estimation of Pressuremeter Modulus and Limit Pressure in Weathered Granite Based on the SPT-N Value and Chemical Weathering Index: A Case Study in South Korea


Abstract
1. Introduction
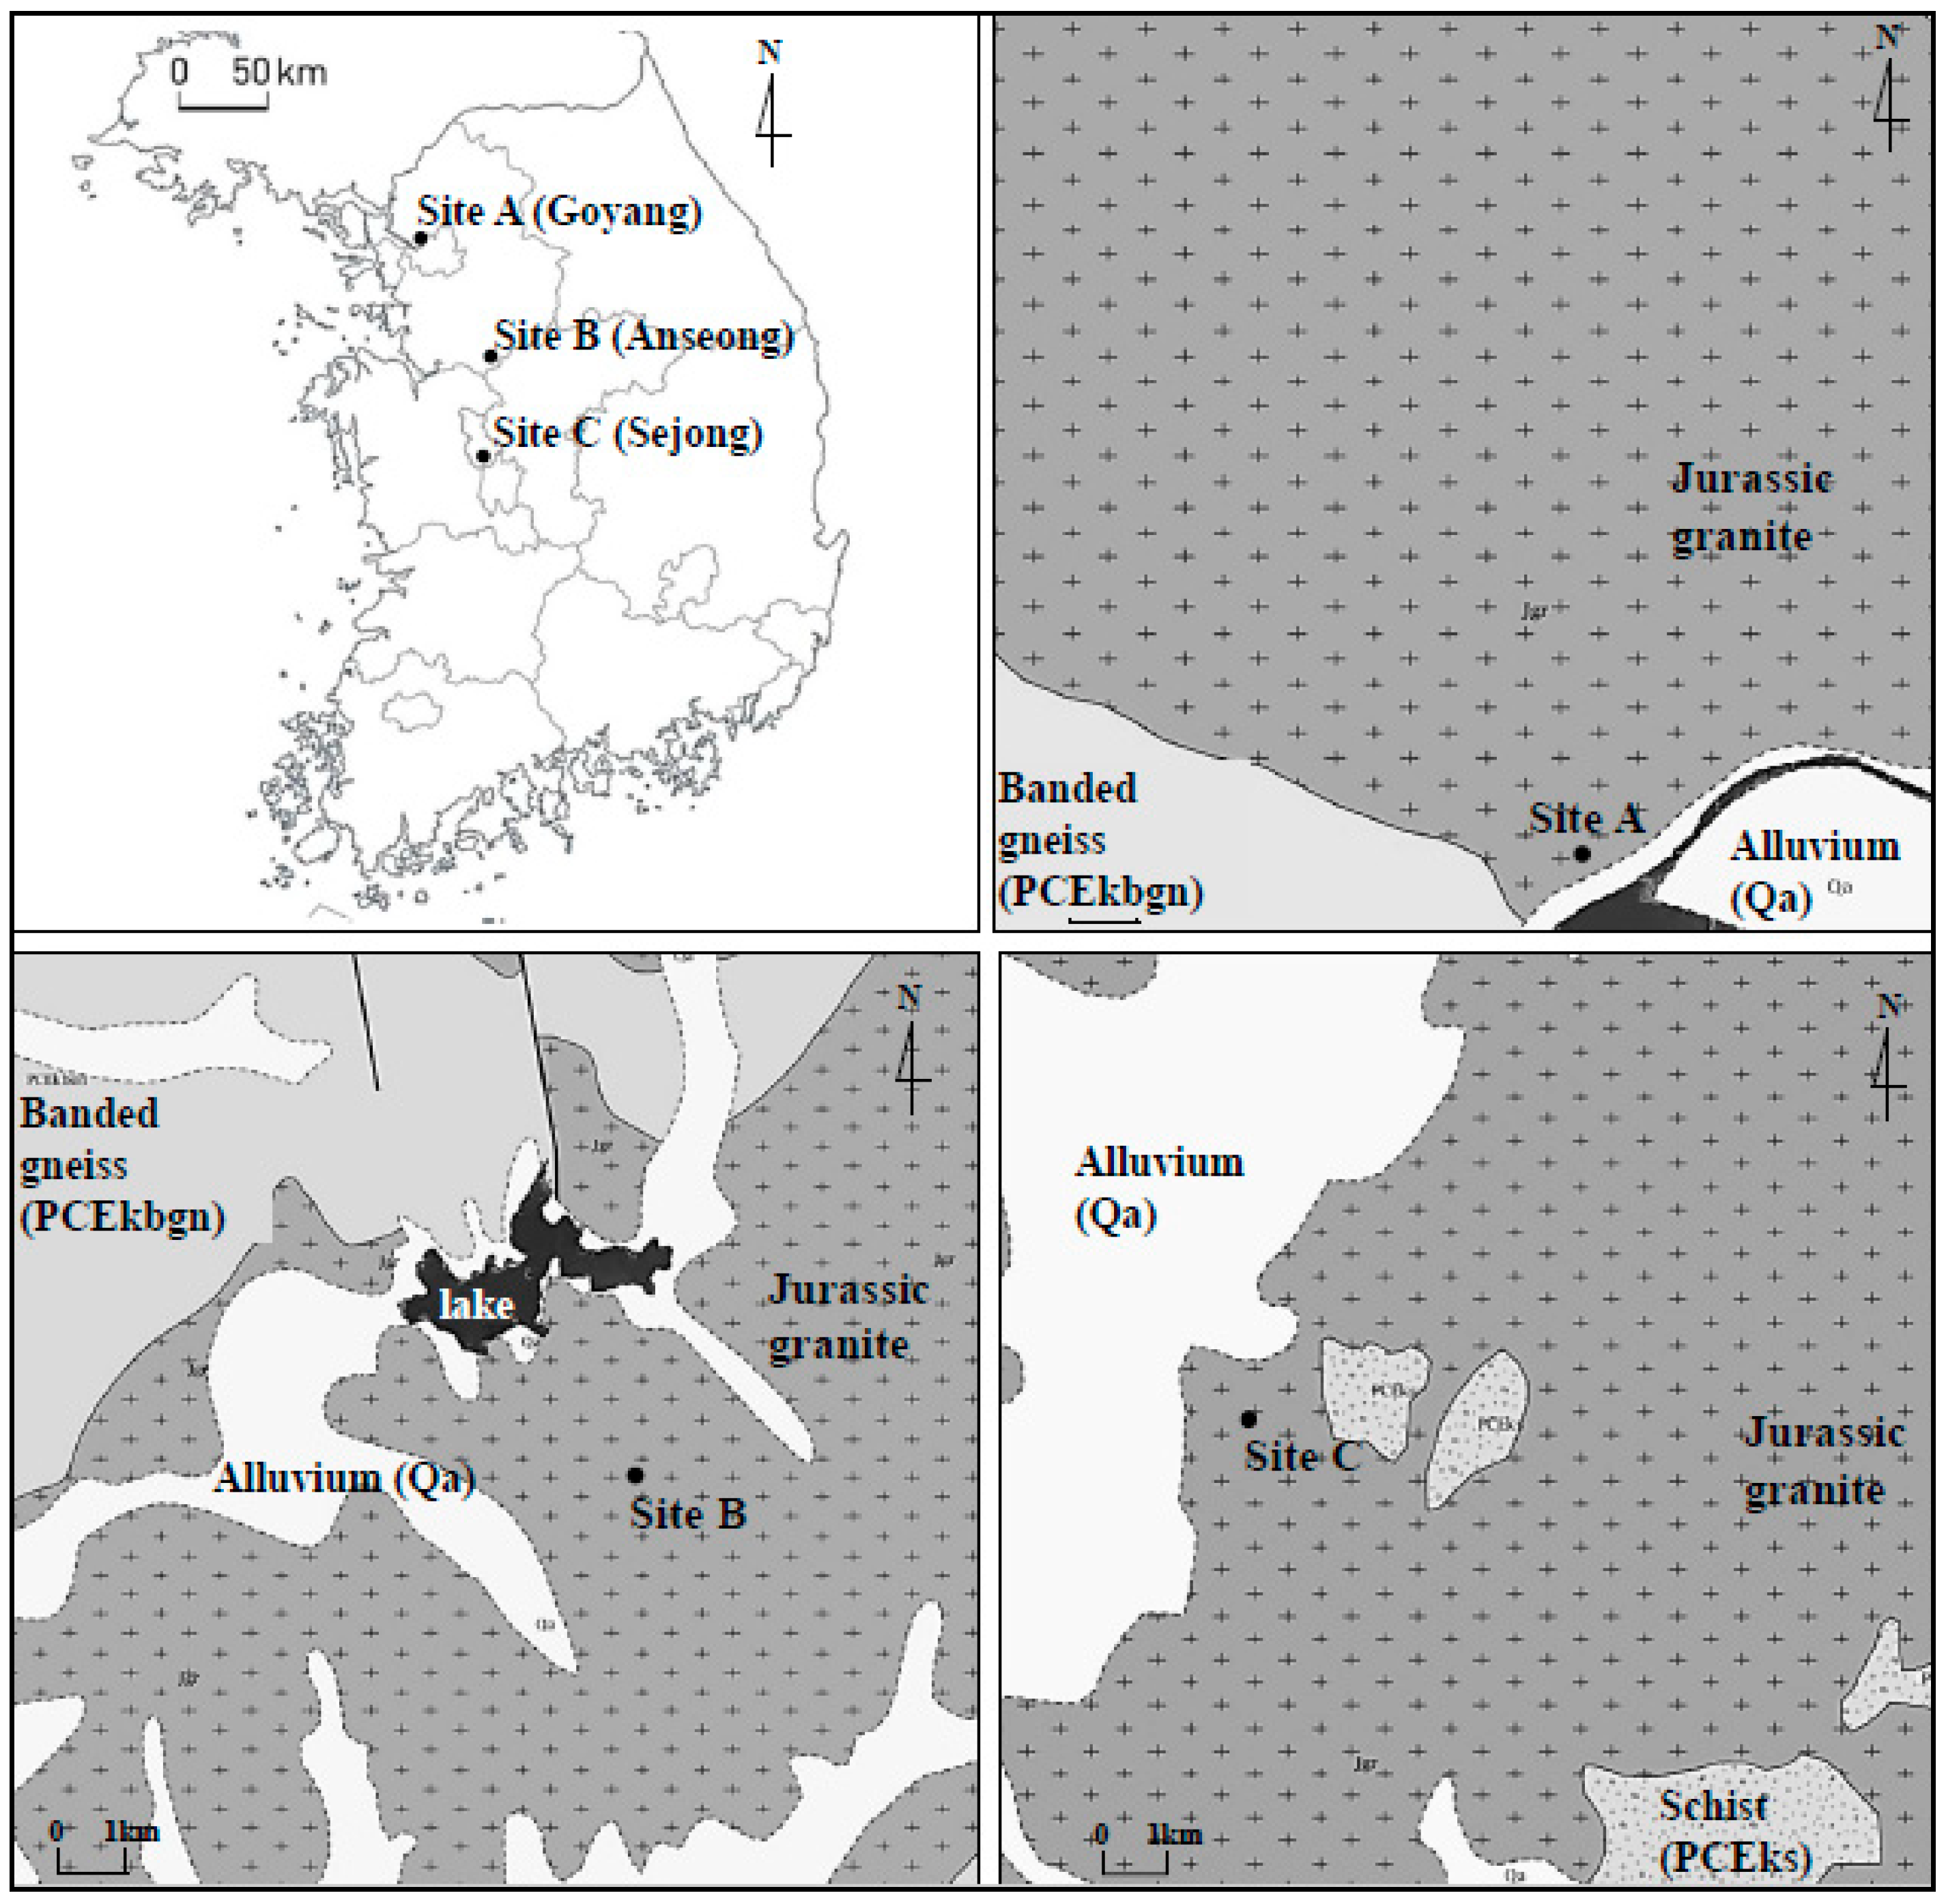
2. Study Area
3. Methodology
3.1. SPT and PMT
3.2. Geochemical Analysis for Determination of Chemical Weathering Index
4. Analysis
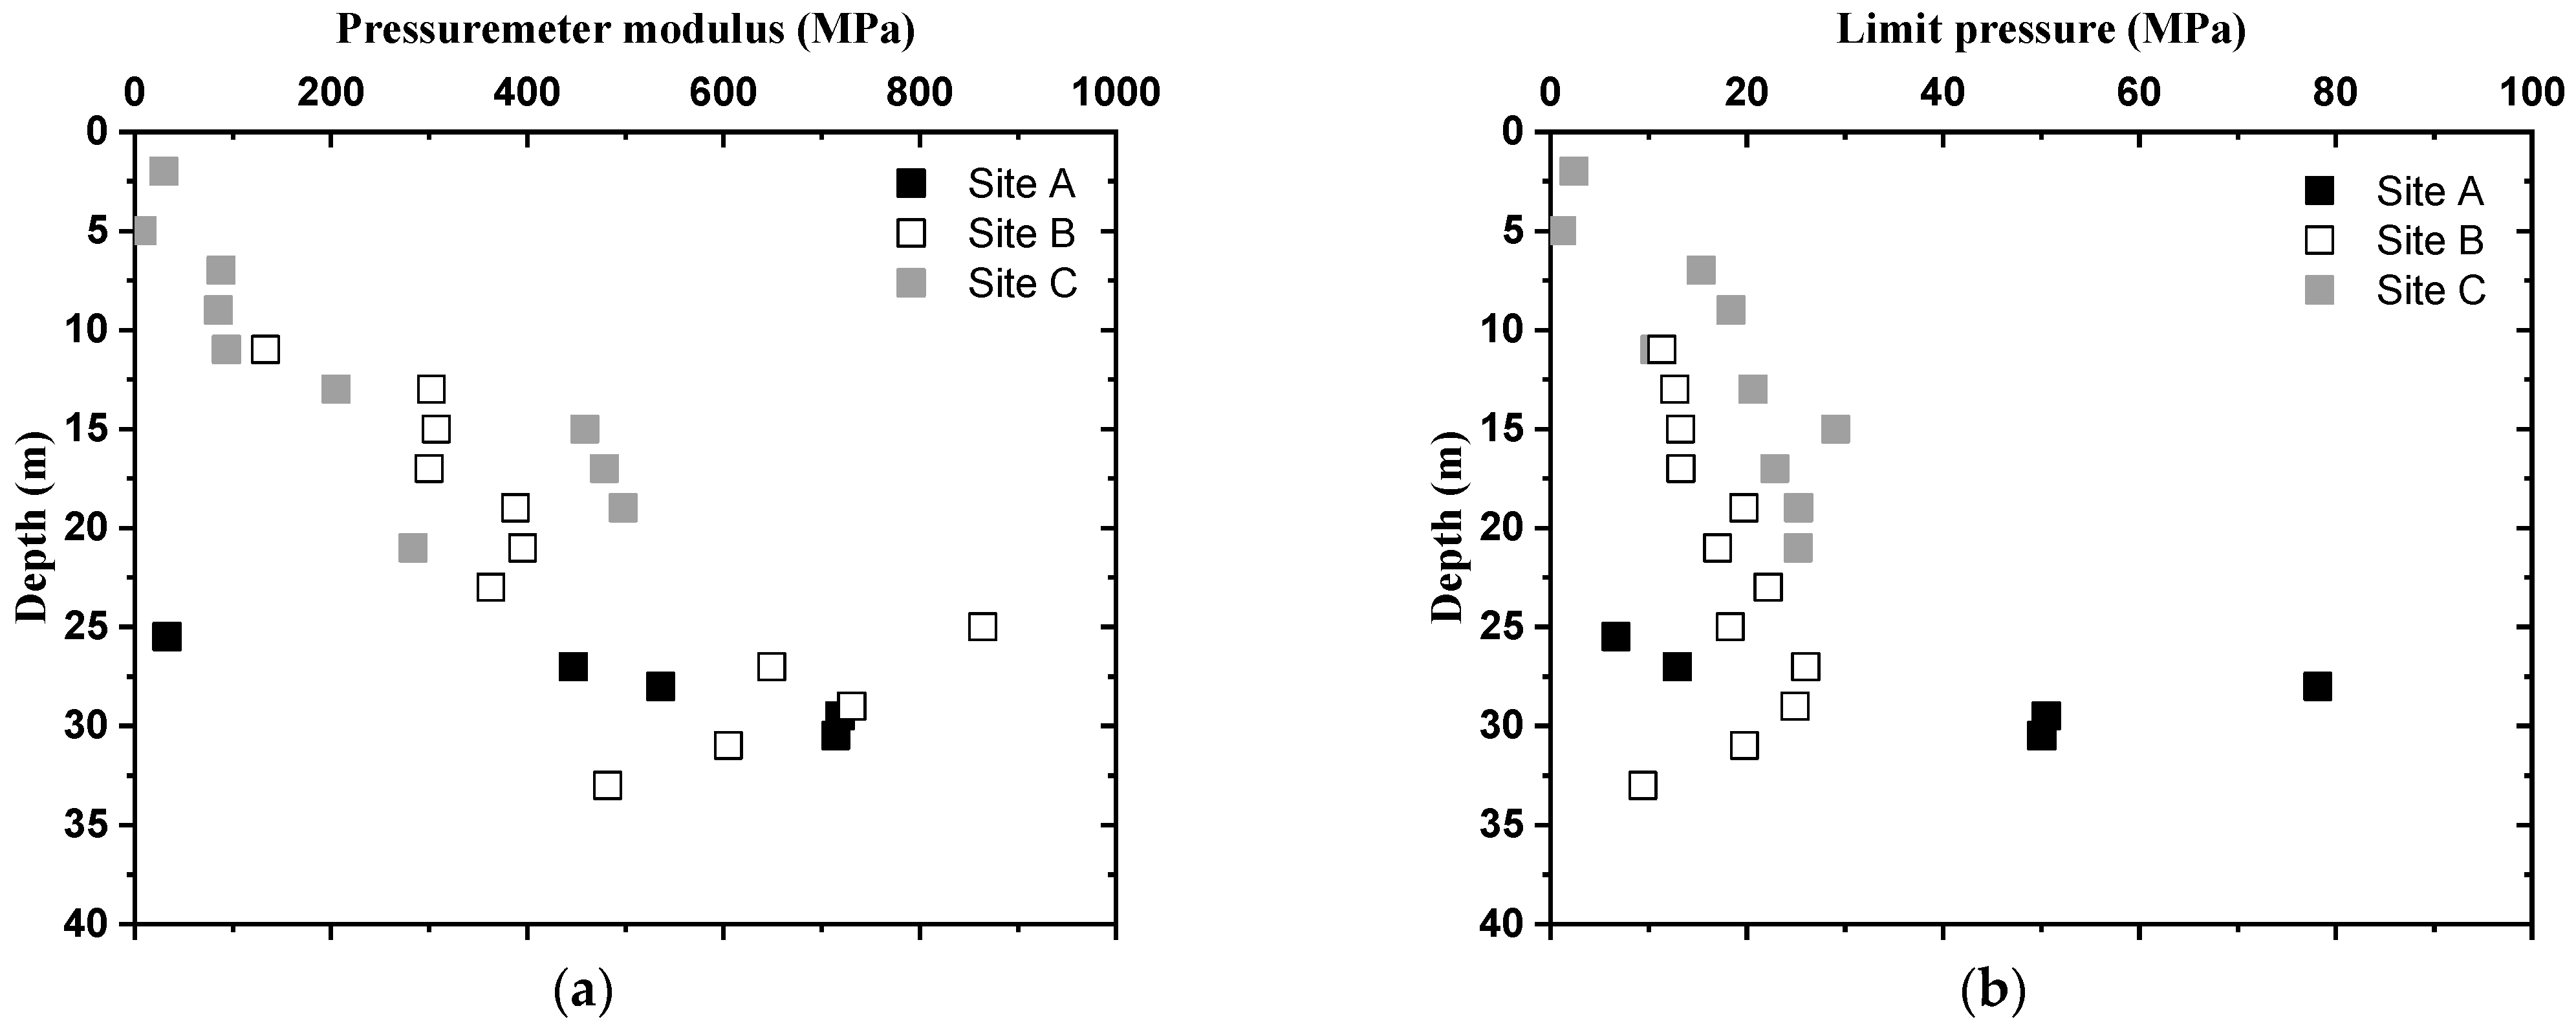
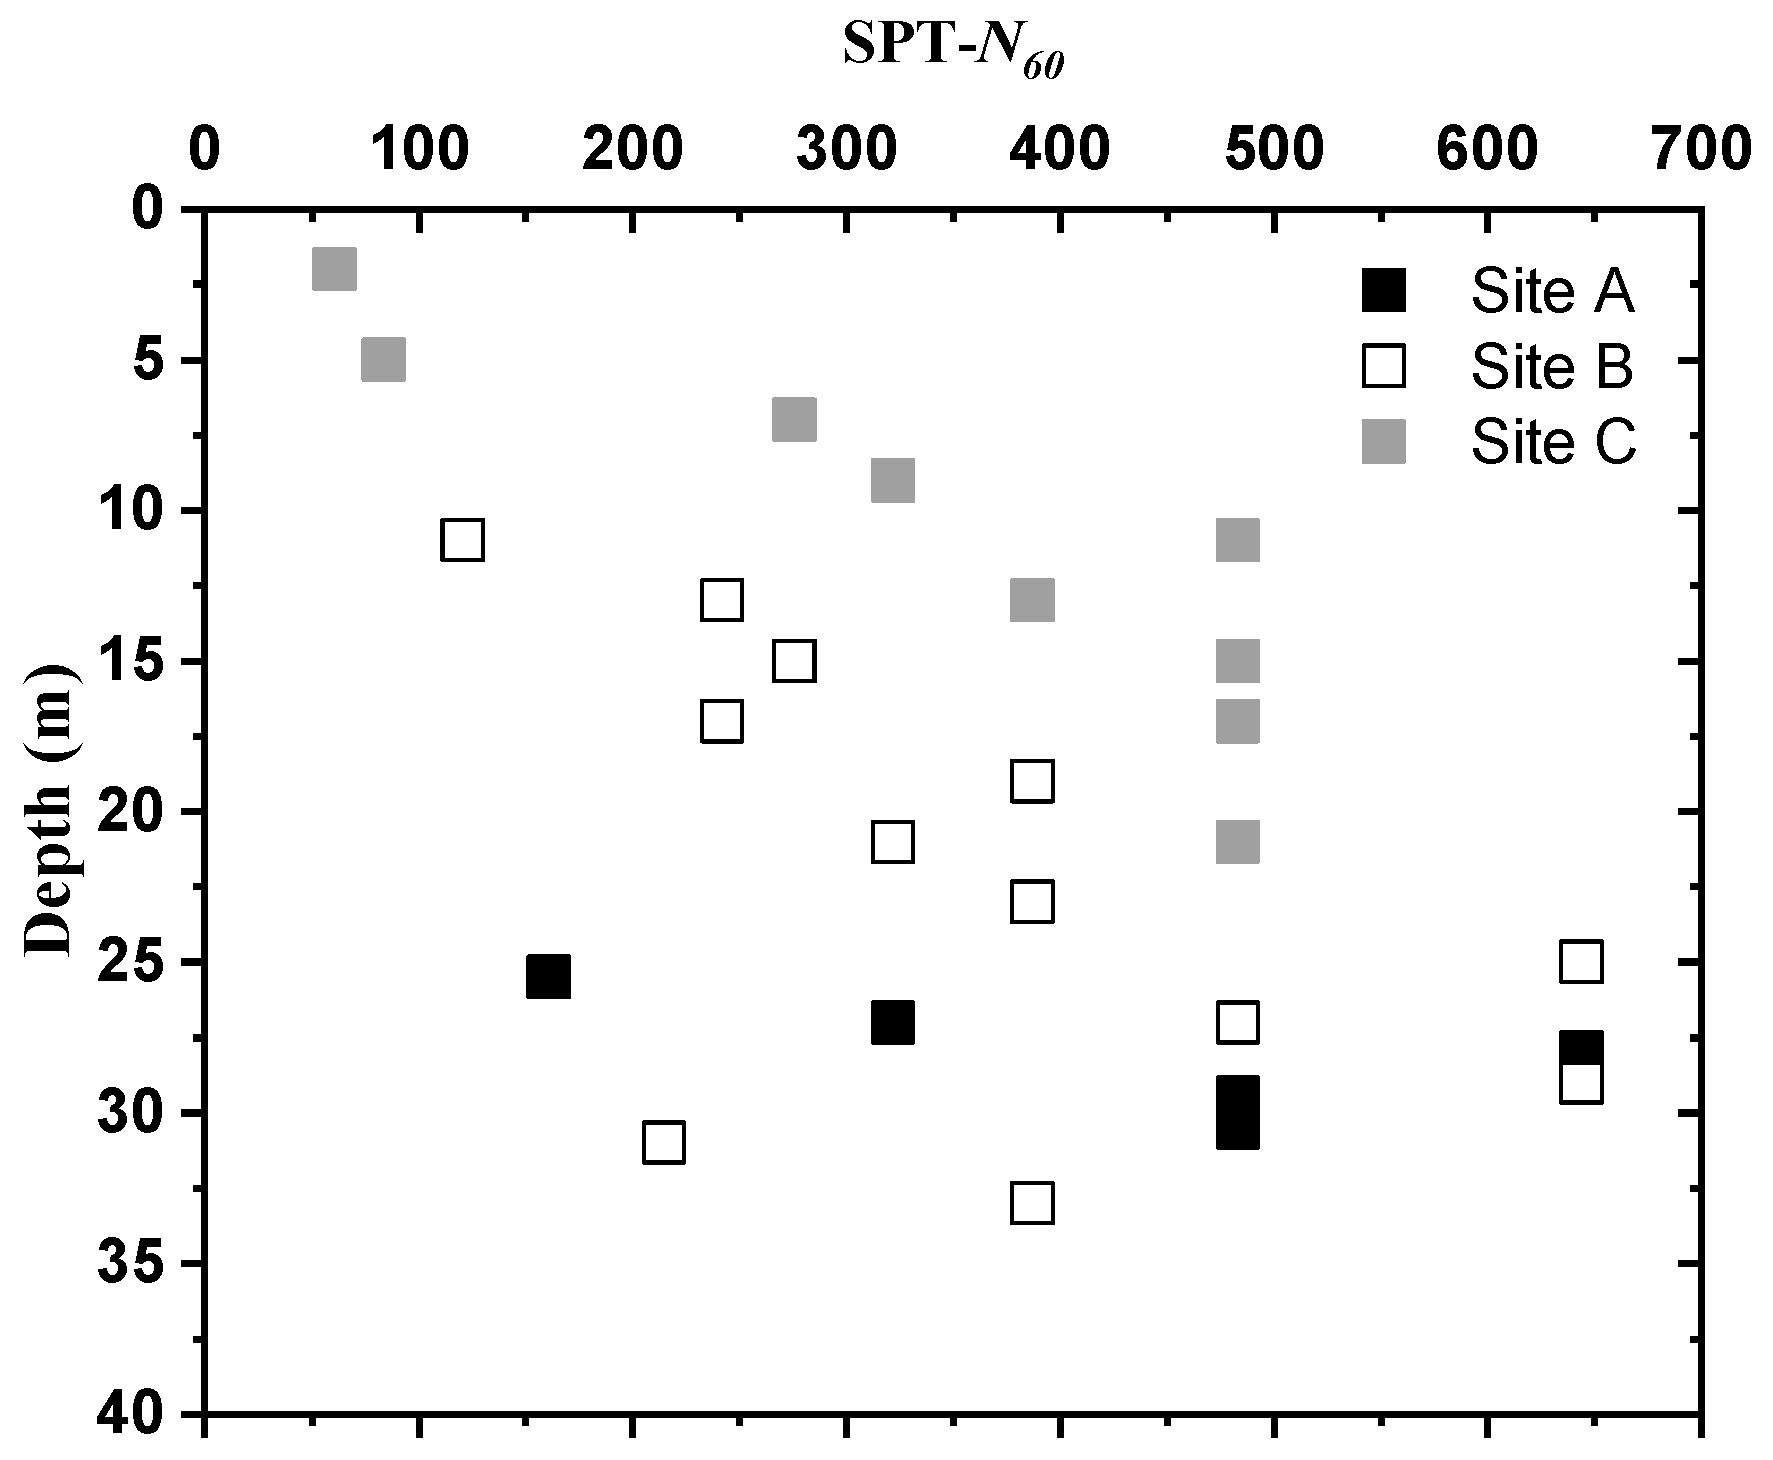
4.1. Test Data
4.2. Nonlinear Multiple Regression Analysis
- (1)
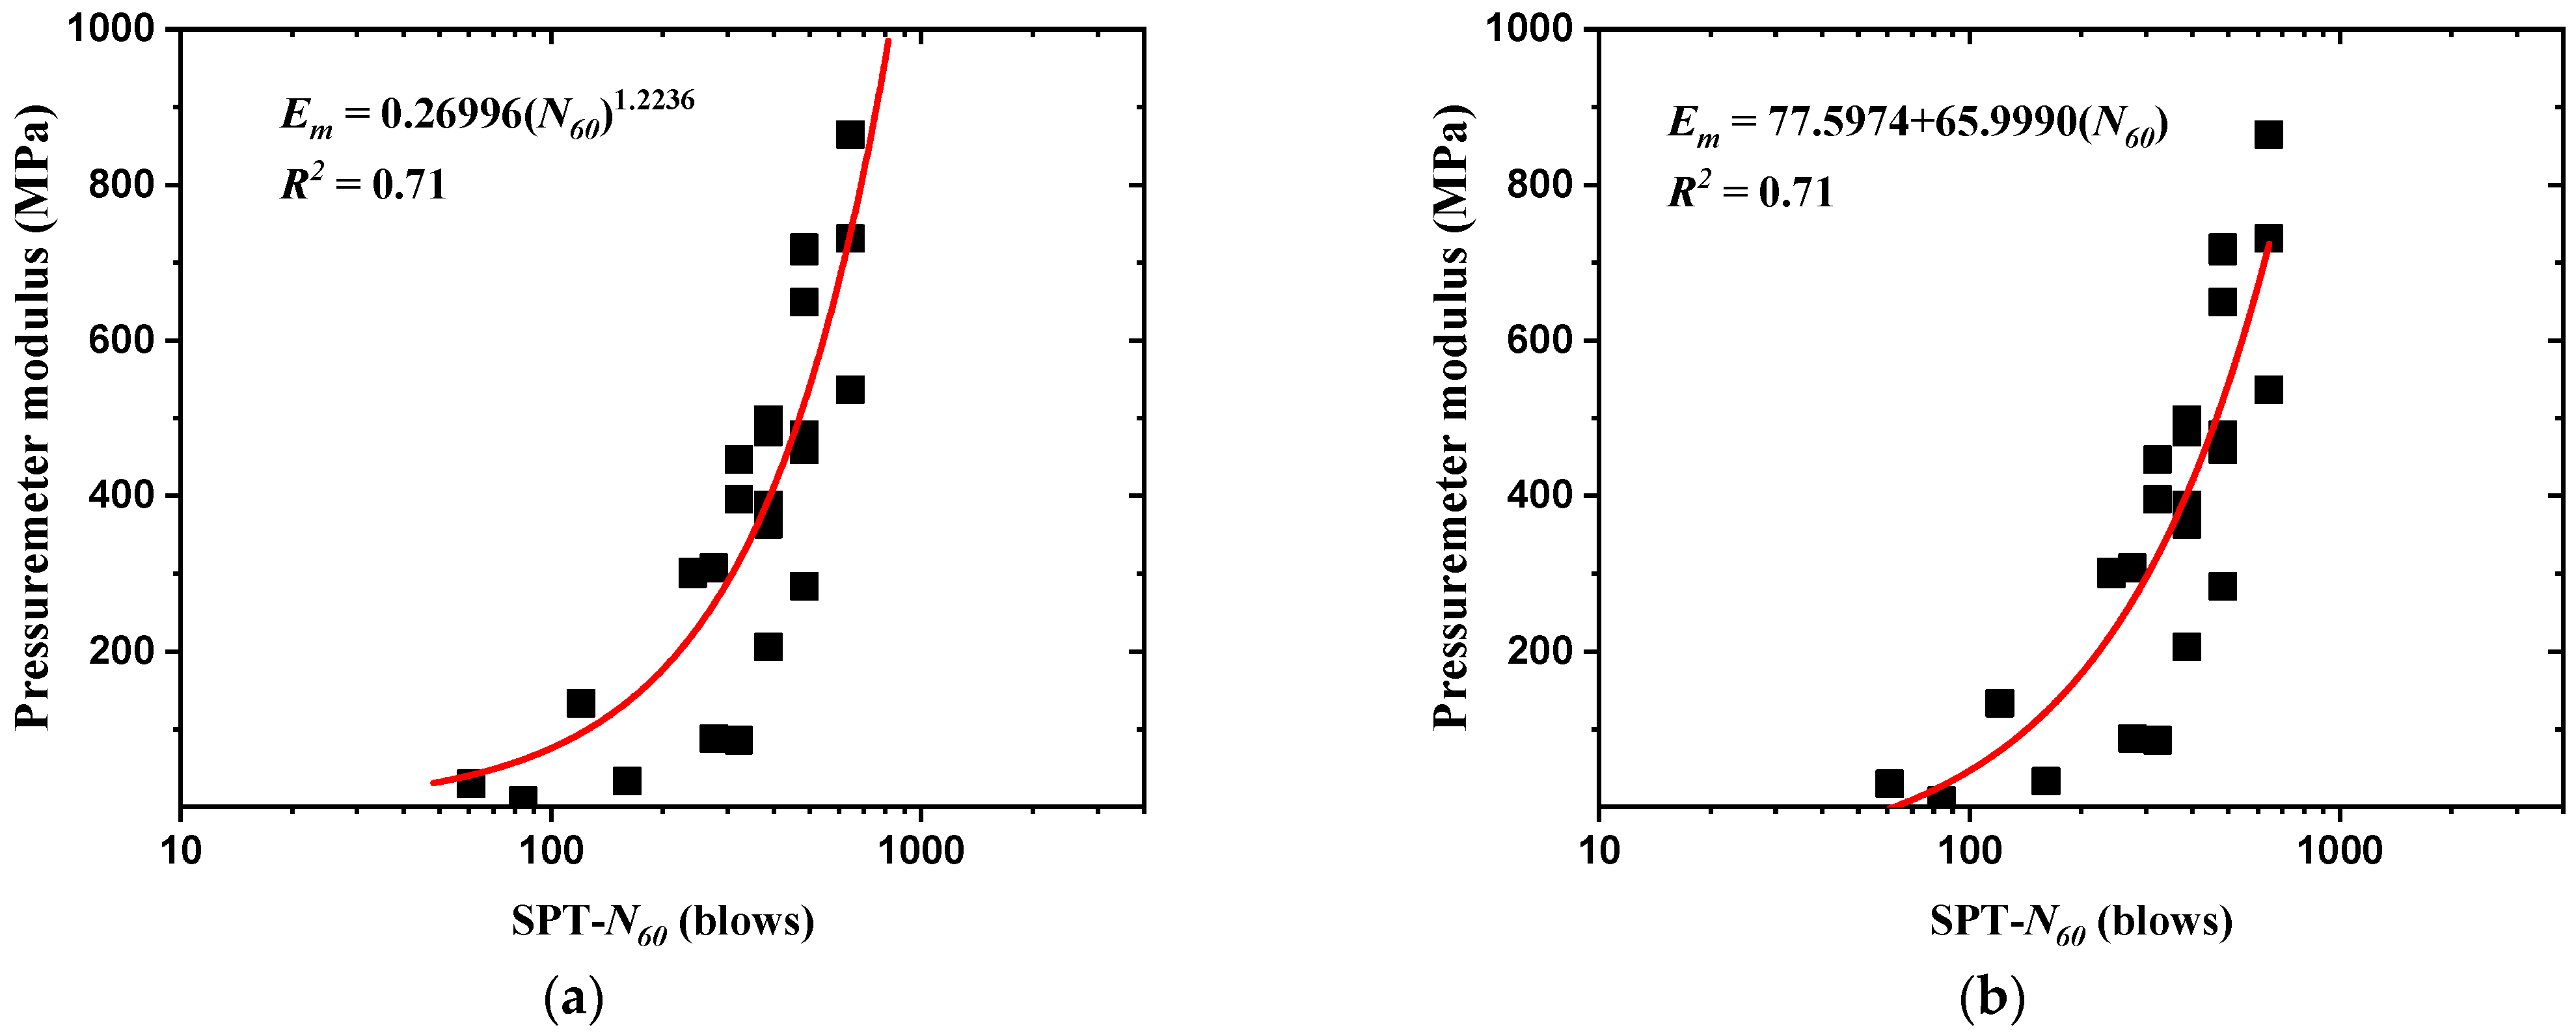
- Deduction of the relationships between Em and SPT-N60 and between PL and SPT-N60 by simple regression analyses;
- (2)
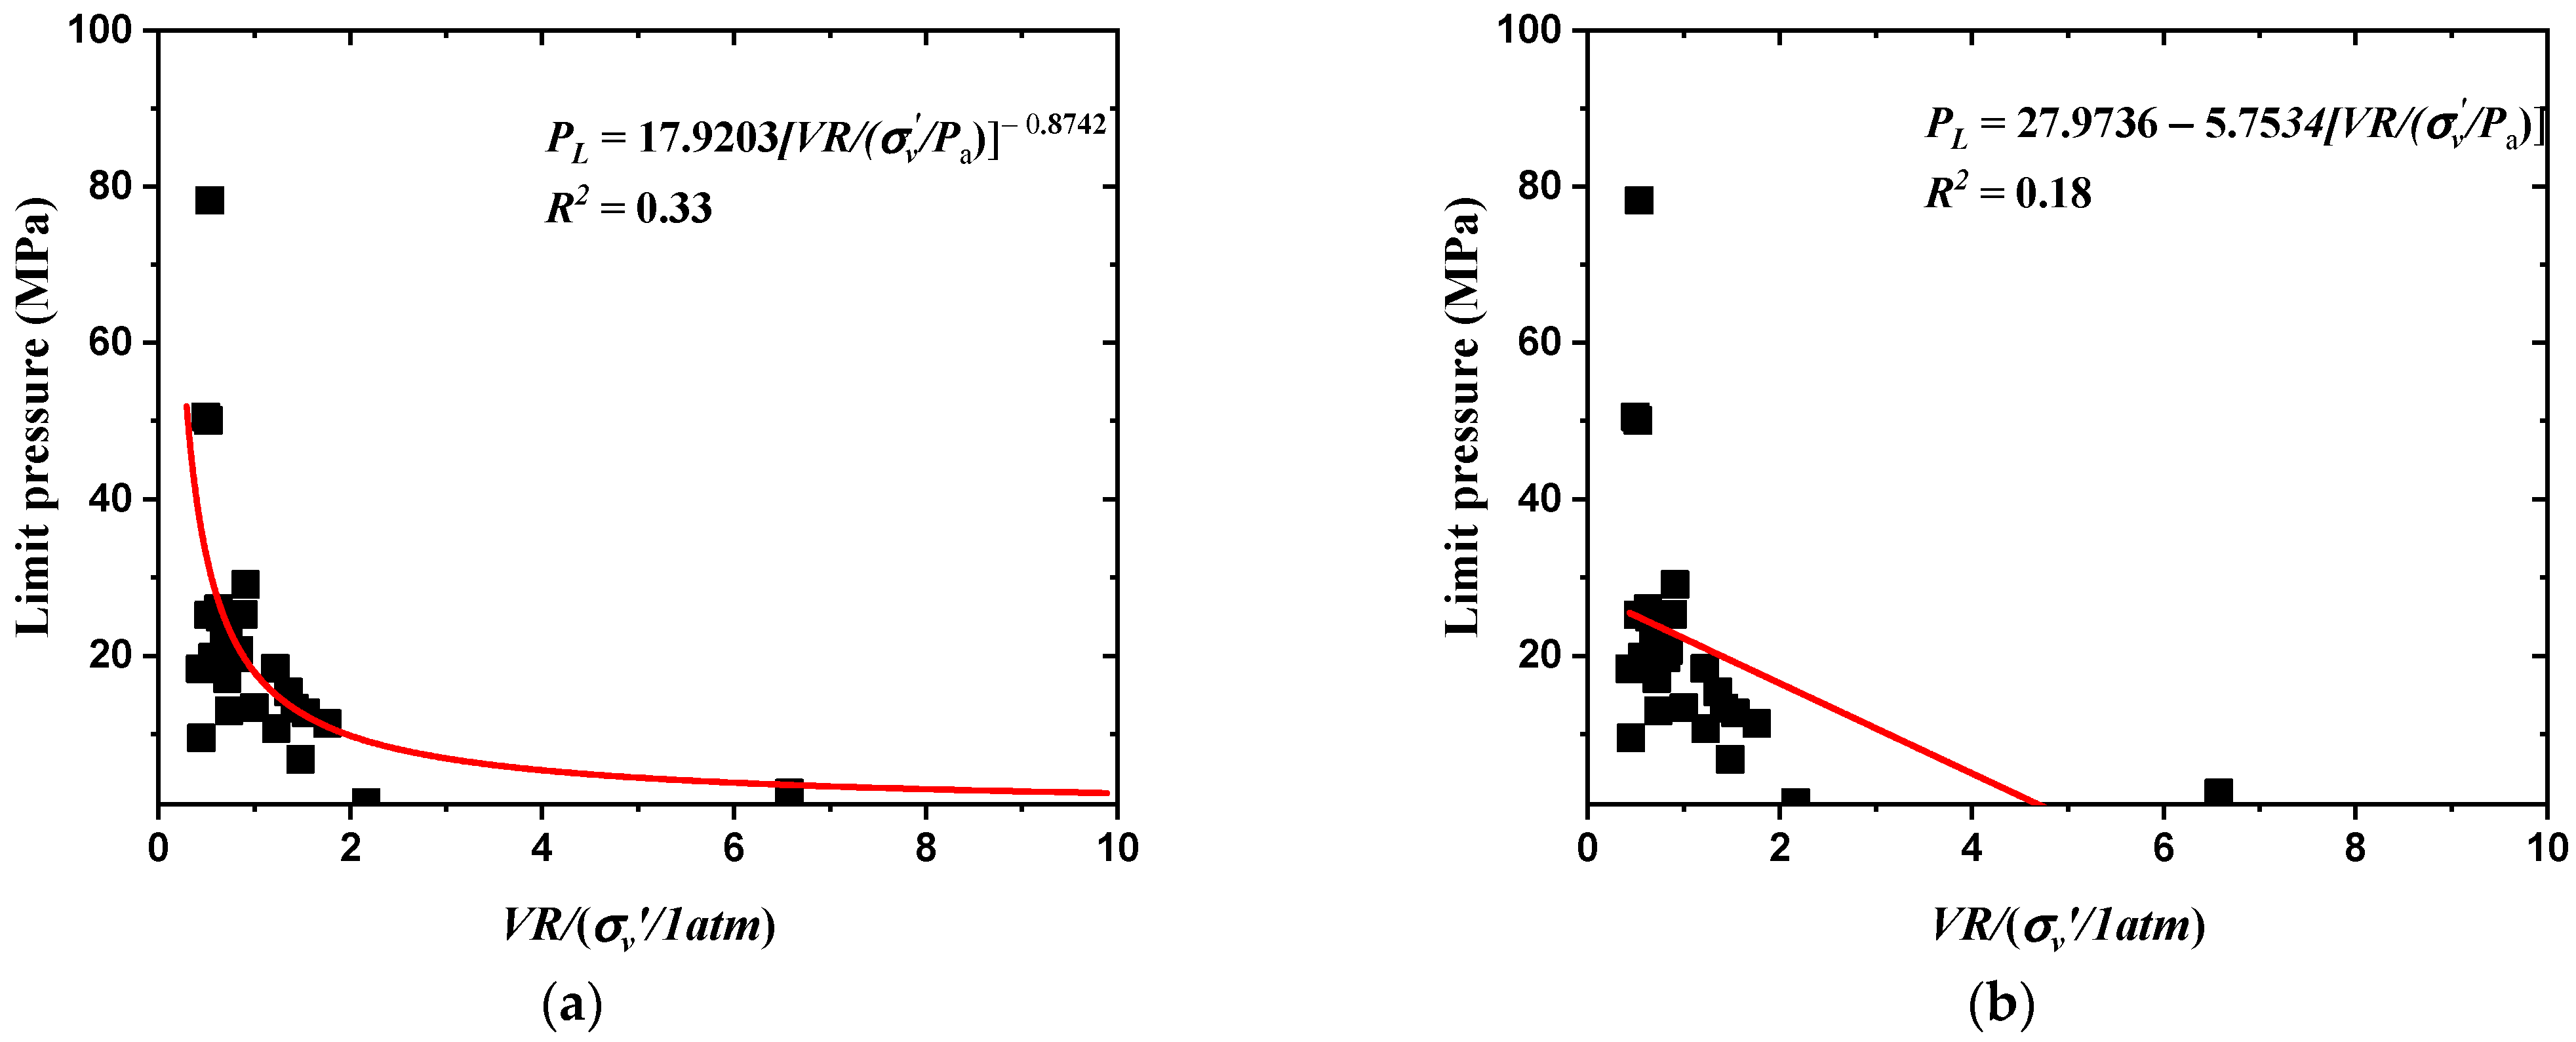
- Deduction of the relationships between Em and normalized VR and between PL and normalized VR by simple regression analyses;
- (3)
- Nonlinear multiple regression analysis using the relationships deduced in steps (1) and (2) above.
5. Conclusions
- (1)
- The relationships between the PMT and SPT-N60 results were derived by simple regression analyses, which revealed that Em tended to increase with increasing SPT-N60. Relatively high correlations were observed when both an allometric model and linear model were utilized, as represented by R2 of 0.71. The correlations were lower for PL, as represented by the R2 values of 0.44 and 0.43 for the two models, respectively, revealing no significant difference.
- (2)
- The chemical weathering index that has been rarely considered in previous studies was used to evaluate the PMT results. The normalized VR with vertical effective stress revealed a relatively good correlation with Em (R2 = 0.67). Therefore, it is useful as a simple method for the estimation of Em of weathered granite in preliminary site characterization.
- (3)
- Nonlinear multiple regression analyses were conducted by combining the allometric models that produced improved correlations between Em, PL, SPT-N60, and normalized VR. The obtained equations of Em and PL had better R2 values (0.76 and 0.46, respectively) than the equations obtained by simple regression in other studies. Even though the obtained slight increase in the coefficient of determination was lower than expected, this study is meaningful in that it is possible to obtain improved prediction of the Em and PL values of weathered granite by additionally considering VR, which is a chemical weathering index that represents the physical properties of weathered granite.
- (4)
- Empirical equations suggested in other studies were based on a single variable (i.e., SPT-N60) and can thus be only used to estimate either Em or PL for a particular SPT-N60. However, the empirical equations proposed in this paper utilize an additional variable VR can thus predict the Em and PL by considering both the degree of weathering and SPT-N60. To determine the engineering properties of geo-materials, this study proposes the Em and PL equations for use in geotechnical surveys of weathered granite in South Korea.
Author Contributions
Funding
Institutional Review Board Statement
Informed Consent Statement
Data Availability Statement
Conflicts of Interest
References
- Clayton, C.R.I.; Matthews, M.C.; Simons, N. Site Investigation; Blackwell Science: London, UK, 1995. [Google Scholar]
- Bolton Seed, H.; Tokimatsu, K.; Harder, L.F.; Chung, R.M. Influence of SPT procedures in soil liquefaction resistance evaluations. J. Geotech. Eng. 1985, 111, 1425–1445. [Google Scholar] [CrossRef]
- Meyerhof, G. Penetration tests and bearing capacity of cohesionless soils. J. Soil Mech. Found. Div. 1956, 82, 1–19. [Google Scholar] [CrossRef]
- Terzaghi, K.; Peck, R. Soil Mechanics in Engineering Practice; John Wiley & Sons, Ltd.: New York, NY, USA, 1948. [Google Scholar]
- Benoît, J.; Howie, J.A. A View of Pressuremeter Testing in North America. Soils Rocks 2014, 37, 211–231. [Google Scholar]
- Chiang, Y.; Ho, Y. Pressuremeter method for foundation in Hongkong. In Proceedings of the Sixth Southeast Asian Conference on Soil Engineering, Taipei, Taiwan, 19–23 May 1980; pp. 31–42. [Google Scholar]
- Yagiz, S.; Akyol, A.E.; Sen, A.G. Relationship between the standard penetration test and the pressuremeter test on sandy silty clays: A case study from Denizli. Bull. Eng. Geol. Environ. 2008, 67, 405–410. [Google Scholar] [CrossRef]
- Bozbey, I.; Togrol, E. Correlation of standard penetration test and pressuremeter data: A case study from Istanbul, Turkey. Bull. Eng. Geol. Environ. 2010, 69, 505–515. [Google Scholar] [CrossRef]
- Cheshomi, A.; Ghodrati, M. Estimating Menard pressuremeter modulus and limit pressure from SPT in silty sand and silty clay soils. A case study in Mashhad, Iran. Geomech. Geoengin. 2015, 10, 194–202. [Google Scholar] [CrossRef]
- Udagedara, D.T.; Oguchi, C.T.; Gunatilake, A.A.J.K. Combination of chemical indices and physical properties in the assessment of weathering grades of sillimanite-garnet gneiss in tropical environment. Bull. Eng. Geol. Environ. 2017, 76, 145–157. [Google Scholar] [CrossRef]
- Rigopoulos, I.; Tsikouras, B.; Pomonis, P.; Hatzipanagiotou, K. Assessment of the engineering behavior of ultramafic and mafic rocks using chemical indices. Eng. Geol. 2015, 196, 222–237. [Google Scholar] [CrossRef]
- Irfan, T.Y. Mineralogy, fabric properties and classification of weathered granites in Hong Kong. Q. J. Eng. Geol. Hydrogeol. 1996, 29, 5–35. [Google Scholar] [CrossRef]
- Chiu, C.F.; Ng, C.W.W. Relationships between chemical weathering indices and physical and mechanical properties of decomposed granite. Eng. Geol. 2014, 179, 76–89. [Google Scholar] [CrossRef]
- Kim, S.; Park, H.-D. The relationship between physical and chemical weathering indices of granites around Seoul, Korea. Bull. Eng. Geol. Environ. 2003, 62, 207–212. [Google Scholar] [CrossRef]
- ASTM D1586 Standard Test Method for Standard Penetration Test (SPT) and Split-Barrel Sampling of Soils. 2011. Available online: www.astm.org (accessed on 26 June 2018). [CrossRef]
- Dasaka, S.M.; Zhang, L.M. Spatial variability of in situ weathered soil. Geotechnique 2012, 62, 375–384. [Google Scholar] [CrossRef]
- Suzuki, Y.; Goto, S.; Hatanaka, M.; Tokimatsu, K. Correlation between strengths and penetration resistances for gravelly soils. Soils Found. 1993, 33, 92–101. [Google Scholar] [CrossRef]
- Sun, C.G.; Kim, B.H.; Park, K.H.; Chung, C.K. Geotechnical comparison of weathering degree and shear wave velocity in the decomposed granite layer in Hongseong, South Korea. Environ. Earth Sci. 2015, 74, 6901–6917. [Google Scholar] [CrossRef]
- ASTM D4719 StandardTest Methods for Prebored Pressuremeter Testing in Soils. 2007. Available online: www.astm.org (accessed on 26 June 2018).
- Reiche, P. Graphic representation of chemical weathering. SEPM J. Sediment. Res. 1943, 13, 58–68. [Google Scholar] [CrossRef]
- Ruxton, B.P. Measures of the degree of chemical weathering of rocks. J. Geol. 1968, 76, 518–527. [Google Scholar] [CrossRef]
- Vogel, D.E. Precambrian weathering in acid metavolcanic rocks from the superior province, Villebon Township, South-Central Québec. Can. J. Earth Sci. 1975, 12, 2080–2085. [Google Scholar] [CrossRef]
- Nesbitt, H.W. Mobility and fractionation of rare earth elements during weathering of a granodiorite. Nature 1979, 279, 206–210. [Google Scholar] [CrossRef]
- Vogt, T. Geology and petrography of the Sulitjel field (Sulitjelmafeltets geologi og petrografi). Nor. Geol. Surv. 1927, 121, 1–560. [Google Scholar]
- Lee, S.-H. Estimation of Geotechnical Properties on Highly and Completely Weathered Granite Using Chemical Weathering Index. Ph.D. Thesis, Seoul National University, Seoul, Korea, 2020. [Google Scholar]
- Price, J.R.; Velbel, M.A. Chemical weathering indices applied to weathering profiles developed on heterogeneous felsic metamorphic parent rocks. Chem. Geol. 2003, 202, 397–416. [Google Scholar] [CrossRef]
- Ban, J.-D.; Moon, S.-W.; Lee, S.-W.; Lee, J.-G.; Seo, Y.-S. Physical and chemical weathering indices for biotite granite and granitic weathered soil in Gyeongju. J. Eng. Geol. 2017, 27, 451–462. [Google Scholar]
- Arel, E.; Tugrul, A. Weathering and its relation to geomechanical properties of Cavusbasi granitic rocks in Northwestern Turkey. Bull. Eng. Geol. Environ. 2001, 60, 123–133. [Google Scholar] [CrossRef]


| No. | Em (MPa) | PL (MPa) | SPT-N60 (Blows) | VR | Normalized VR * |
|---|---|---|---|---|---|
| 1 | 29.9 | 2.4 | 61 | 2.185 | 6.580 |
| 2 | 7.8 | 1.2 | 84 | 1.799 | 2.167 |
| 3 | 133.4 | 11.3 | 121 | 3.568 | 1.763 |
| 4 | 33.4 | 6.7 | 161 | 3.785 | 1.486 |
| 5 | 604.8 | 19.8 | 215 | 2.539 | 0.570 |
| 6 | 302.4 | 12.6 | 242 | 3.480 | 1.542 |
| 7 | 300.3 | 13.3 | 242 | 2.725 | 1.000 |
| 8 | 88.3 | 15.4 | 276 | 1.605 | 1.359 |
| 9 | 307.6 | 13.3 | 276 | 3.536 | 1.420 |
| 10 | 446.7 | 12.9 | 322 | 2.127 | 0.739 |
| 11 | 85.7 | 18.4 | 322 | 1.676 | 1.220 |
| 12 | 395.4 | 17.0 | 322 | 2.316 | 0.719 |
| 13 | 205.5 | 20.6 | 387 | 1.505 | 0.843 |
| 14 | 498.1 | 25.3 | 387 | 2.159 | 0.886 |
| 15 | 388.1 | 19.7 | 387 | 2.441 | 0.821 |
| 16 | 363.2 | 22.2 | 387 | 2.362 | 0.681 |
| 17 | 481.9 | 9.4 | 387 | 2.118 | 0.450 |
| 18 | 718.9 | 50.5 | 483 | 1.594 | 0.496 |
| 19 | 714.3 | 50.1 | 483 | 1.762 | 0.526 |
| 20 | 94.0 | 10.6 | 483 | 1.937 | 1.228 |
| 21 | 458.7 | 29.1 | 483 | 1.824 | 0.911 |
| 22 | 478.6 | 22.9 | 483 | 1.625 | 0.732 |
| 23 | 283.7 | 25.2 | 483 | 1.405 | 0.529 |
| 24 | 649.2 | 26.0 | 483 | 2.497 | 0.631 |
| 25 | 536.3 | 78.2 | 644 | 1.655 | 0.537 |
| 26 | 864.2 | 18.3 | 644 | 1.620 | 0.436 |
| 27 | 730.9 | 24.9 | 644 | 2.729 | 0.648 |
| Geo-Material | Empirical Equations | Researchers | |
|---|---|---|---|
| Em | PL | ||
| weathered granite | Em (MPa) = 0.5832(N60)0.9687 | PL (MPa) = 0.1668(N60)0.7307 | Chiang and Ho [6] * |
| sandy soil | Em (MPa) = 1.33(N60)0.77 | PL (MPa) = 0.33(N60)0.51 | Bozbey and Togrol [8] |
| silty sand | Em/Pa (MPa) = 9.8N60 − 94.3 ** | PL/Pa = N60 − 20.8 ** | Cheshomi and Ghodrati [9] |
Publisher’s Note: MDPI stays neutral with regard to jurisdictional claims in published maps and institutional affiliations. |
© 2021 by the authors. Licensee MDPI, Basel, Switzerland. This article is an open access article distributed under the terms and conditions of the Creative Commons Attribution (CC BY) license (https://creativecommons.org/licenses/by/4.0/).
Share and Cite
Lee, S.-H.; Kwak, T.-Y.; Park, K.-H. Estimation of Pressuremeter Modulus and Limit Pressure in Weathered Granite Based on the SPT-N Value and Chemical Weathering Index: A Case Study in South Korea. Appl. Sci. 2021, 11, 3411. https://doi.org/10.3390/app11083411
Lee S-H, Kwak T-Y, Park K-H. Estimation of Pressuremeter Modulus and Limit Pressure in Weathered Granite Based on the SPT-N Value and Chemical Weathering Index: A Case Study in South Korea. Applied Sciences. 2021; 11(8):3411. https://doi.org/10.3390/app11083411
Chicago/Turabian StyleLee, Seung-Hwan, Tae-Young Kwak, and Ka-Hyun Park. 2021. "Estimation of Pressuremeter Modulus and Limit Pressure in Weathered Granite Based on the SPT-N Value and Chemical Weathering Index: A Case Study in South Korea" Applied Sciences 11, no. 8: 3411. https://doi.org/10.3390/app11083411
APA StyleLee, S.-H., Kwak, T.-Y., & Park, K.-H. (2021). Estimation of Pressuremeter Modulus and Limit Pressure in Weathered Granite Based on the SPT-N Value and Chemical Weathering Index: A Case Study in South Korea. Applied Sciences, 11(8), 3411. https://doi.org/10.3390/app11083411