Article

Solid–Liquid Interface Temperature Measurement of Evaporating Droplet Using Thermoresponsive Polymer Aqueous Solution

1
School of Mechanical Engineering, Chung-Ang University, Seoul 06974, Korea
2
Research Institute, Golden Engineering Co. Ltd., Seoul 05836, Korea
3
Mechanical Engineering-Engineering Mechanics, Michigan Technological University, Houghton, MI 49931, USA
4
Department of Intelligent Energy and Industry, Chung-Ang University, Seoul 06974, Korea
*
Authors to whom correspondence should be addressed.
Appl. Sci. 2021, 11(8), 3379; https://doi.org/10.3390/app11083379
Submission received: 16 March 2021 / Revised: 6 April 2021 / Accepted: 7 April 2021 / Published: 9 April 2021
(This article belongs to the Section Mechanical Engineering)

Abstract

:
The present study aims to measure the solid–liquid interface temperature of an evaporating droplet on a heated surface using a thermoresponsive polymer. Poly(N-isopropylacrylamide) (pNIPAM) was used owing to its sensitive optical and mechanical properties to the temperature. We also measured the refractive index variation of the pNIPAM solution by using the surface plasmon resonance imaging (SPRi). In particular, the present study proposed a new method to measure the solid–liquid interface temperature using the correlation among reflectance, refractive index, and temperature. It was found that the reflectance of a pNIPAM solution decreased after the droplet deposition. The solid–liquid interface temperature, estimated from the reflectance, showed a lower value at the center of the droplet, and it gradually increased along the radial direction. The lowest temperature at the contact line region is present because of the maximum evaporative cooling. Moreover, the solid–liquid interface temperature deviation increased with the surface temperature, which means solid–liquid interface temperature should be considered at high temperature to predict the evaporation flux of the droplet accurately.

1. Introduction

Droplet evaporation is a ubiquitous phenomenon in nature, and it has the advantage of transferring larger thermal energy than usual convective-cooling techniques. This phenomenon is widely applied to numerous applications, including spray cooling, surface coating, and heat pipe [1]. Many studies have been conducted to estimate the evaporation flux of the droplet, assuming that vapor diffusion to the ambient air is the only transport mechanism [2,3]. For quasi-steady condition, the evaporation flux has non-uniform distribution along with the liquid–air interface of the sessile droplet [4,5]. Hu and Larson [6] investigated the evaporating sessile droplet with experiments, analytic theory, and numerical method. They reported that the quasi-steady assumption was valid for the evaporation of sessile droplets by comparing the numerical results and the experimental measurements. The diffusion-limited evaporation model was considered for the droplet evaporation on the heated substrate by applying vapor concentration with the function of temperature [7,8]. Sobac and Brutin [9] investigated the effect of surface temperature on evaporating droplets with hydrophilic and hydrophobic cases. They assumed isothermal conditions for the solid substrate, which located the droplet. The theoretical model successfully matched the experimental results for hydrophilic and hydrophobic cases at low substrate temperatures.
As the droplet evaporates, it causes temperature variations at the solid substrate and along with the liquid–air interface of the droplet. The heat transfer occurs by the conduction through the solid substrate, latent heat absorption at the liquid–air interface, internal flow of the droplet, and convection of surrounding air [10]. The absorption of the latent heat of the droplet cooled its interface temperature, called evaporative cooling, and retrained evaporation [11]. The heat conduction from the solid substrate to the droplet is complicated because the temperature profiles along the solid–liquid interface are changing as the droplet evaporates. Further, the thermal conductivity of the substrate significantly affected the evaporation of droplets [12]. Lopes et al. [13] investigated the effect of substrate thermal properties on the evaporating droplet and showed that the higher thermal conductivity of the substrate accelerated the evaporation. The thermal conductivity of the substrate was more significant for the strong evaporative cooling [14]. Thus, the thermal fields should be considered, which affected the evolution of the evaporating droplet.
Many studies measured the solid-liquid and liquid–air interface temperature of the droplet [15,16,17]. To the best of our knowledge, most of the research was focused on the liquid–air interface temperature of the droplet, not the solid–liquid interface temperature. Fabien et al. [18] measured the liquid–air interface temperature of the droplet for the heated substrate. They calculated the evaporation flux along with the droplet interface for different substrate temperatures by using the diffusion-limited model and interface temperature of the droplet from experiments, but the solid–liquid interface temperature was constant at the entire region. The substrate temperature distribution has been measured using thermochromic liquid crystals (TLC) [19] and Infrared (IR) thermography [17]. The thermochromic liquid crystals had low-temperature sensitivity, and IR thermography was significantly affected by the background (measurement conditions). IR thermography should also be calibrated under different measurement conditions, especially ambient conditions [20]. Temperature measurement errors calibrated under ambient temperatures (5–25 °C) were about ±1 °C [21], which is inadequate to measure the interface temperature of the droplet. Gibbons et al. [22] measured the temperature beneath the hydrophilic and superhydrophobic droplet with the IR thermography. However, the captured thermal image had relatively low spatial resolutions.
Most of the investigations focused on the evaporation characteristics of the droplet without concerning the distribution of solid–liquid interface temperature. It is important to measure the interface temperature, which has a significant role in the droplet evaporation process. The sensitivity to measure the droplet interface temperature should also be enhanced to analyze the droplet evaporation phenomenon accurately. This paper develops a novel method to measure the interface temperature of a sessile droplet using thermoresponsive polymer and a surface plasmon resonance imaging (SPRi) technique. Poly(N-isopropylacrylamide) (pNIPAM) is a thermoresponsive polymer that shows phase transitions at a low critical solution temperature (LCST) [23]. The phase transition is a reversible process with coil structures below the LCST and globule structures above the LCST [24]. Its physical properties and refractive index are also changed according to the temperature [25]. Particularly, we focus on the refractive index variation of thermoresponsive polymer depending on the temperature. Refractive index changes can be sensitively detected using the SPRi technique that is a promising method in sensing applications.

2. Experimental Approach

2.1. Experimental Setup

Surface plasmon resonance (SPR) is a physical process where the electrons in the metal surface layer are excited by the incident light under a total internal reflection (TIR) condition. It is a sensitive, nonintrusive, and real-time detection tool to visualize the refractive index variation. It is known as a sensitive technique to detect the refractive index on the order of 10−5 [26]. Kretschmann configuration has been widely used for SPRi. The index-matching liquid layer is used to optically couple the prism with a gold film-coated glass substrate. Moreover, the reflectance can be predicted theoretically from the Fresnel equation for the p-polarized light in a four-layer SPRi system [27].
R = | r 1 + r 2 exp ( 2 i k 2 d 2 ) + [ r 1 r 2 + exp ( 2 i k 2 d 2 ) ] r 3 exp ( 2 i k 3 d 3 ) 1 + r 1 r 2 exp ( 2 i k 2 d 2 ) + [ r 2 + r 1 exp ( 2 i k 2 d 2 ) ] r 3 exp ( 2 i k 3 d 3 ) | 2
where, ri indicates the reflection coefficient between the i-th and (i + 1)-th layer, ki represents the waver vector, and di refers to the thickness of the i-th medium. Subscripts 1, 2, and 3 indicate prism, the gold film, and the test medium, respectively. The reflected light from the metal surface has the lowest intensity at the SPR angle, which changes only by the refractive index of the test medium with a fixed configuration of the prism, gold film thickness, and wavelength. By conducting the angular modulation (AM) process, the refractive index can be estimated based on the SPR angle.
Figure 1a shows the SPRi experimental setup. Light irradiated from the LED light source (SugarCuBeTM Ultra LED Illuminators, Nathaniel Group, Inc.) is converted from a diverging light beam to a parallel light through the collimation lens array. A bandpass filter (632 ± 5 nm, Edmund Optics) and a polarizer (Edmund Optics) are installed to convert the light into a single wavelength and p-polarized light. Mirror mounted on the rotation stage controls the incidence angle of the light to the dove prism (BK7 glass). Gold film (47 nm) is coated on a thin coverslip (0.5 mm) with a titanium adhesion layer (3 nm). A CCD camera (XImea) and CMOS camera (JENOPTIK) are used to detect the reflected light and visualize the droplet shape. Details of the calibration method for measuring reflectance based on the intensity of SPR images are explained in the previous studies [28,29]. Figure 1b depicts a multi-layer film structure to measure the solid–liquid interface temperature of the droplet. The pNIPAM solution (5.4 μL) is sealed by insulation tape attached to the gold films to prevent vaporization of the pNIPAM solution. The de-ionized (DI) water droplet (1 μL) is deposited on the gold film located on the pNIPAM solution. Experiments are repeated three times for different surface temperature cases. The surface temperature is controlled using a heating plate from 27 to 29 °C, and the relative humidity is 10 ± 3% at room temperature.
To develop the temperature measurement method, we purchase pNIPAM with a number-average molecular weight of 30,000 g mol−1 from Sigma-Aldrich. The pNIPAM aqueous solution is prepared with the following processes. The pNIPAM and de-ionized (DI) water are filled into a vial located on the microbalance (AND Co., LTD., Tokyo, Japan) to measure the exact quantities. After shaking the pNIPAM aqueous solutions an hour, it is kept in the fridge for a few days for the total dissolution [24]. At a concentration below 10 wt%, pNIPAM solution shows a small variation of refractive index depending on the temperature. On the other hand, the refractive index variations of the pNIPAM solution are too large above the 10 wt% that cannot be estimated with the current experimental setup. Thus, the pNIPAM solution with 10 wt% is used through the temperature sensitivity test with different concentrations.

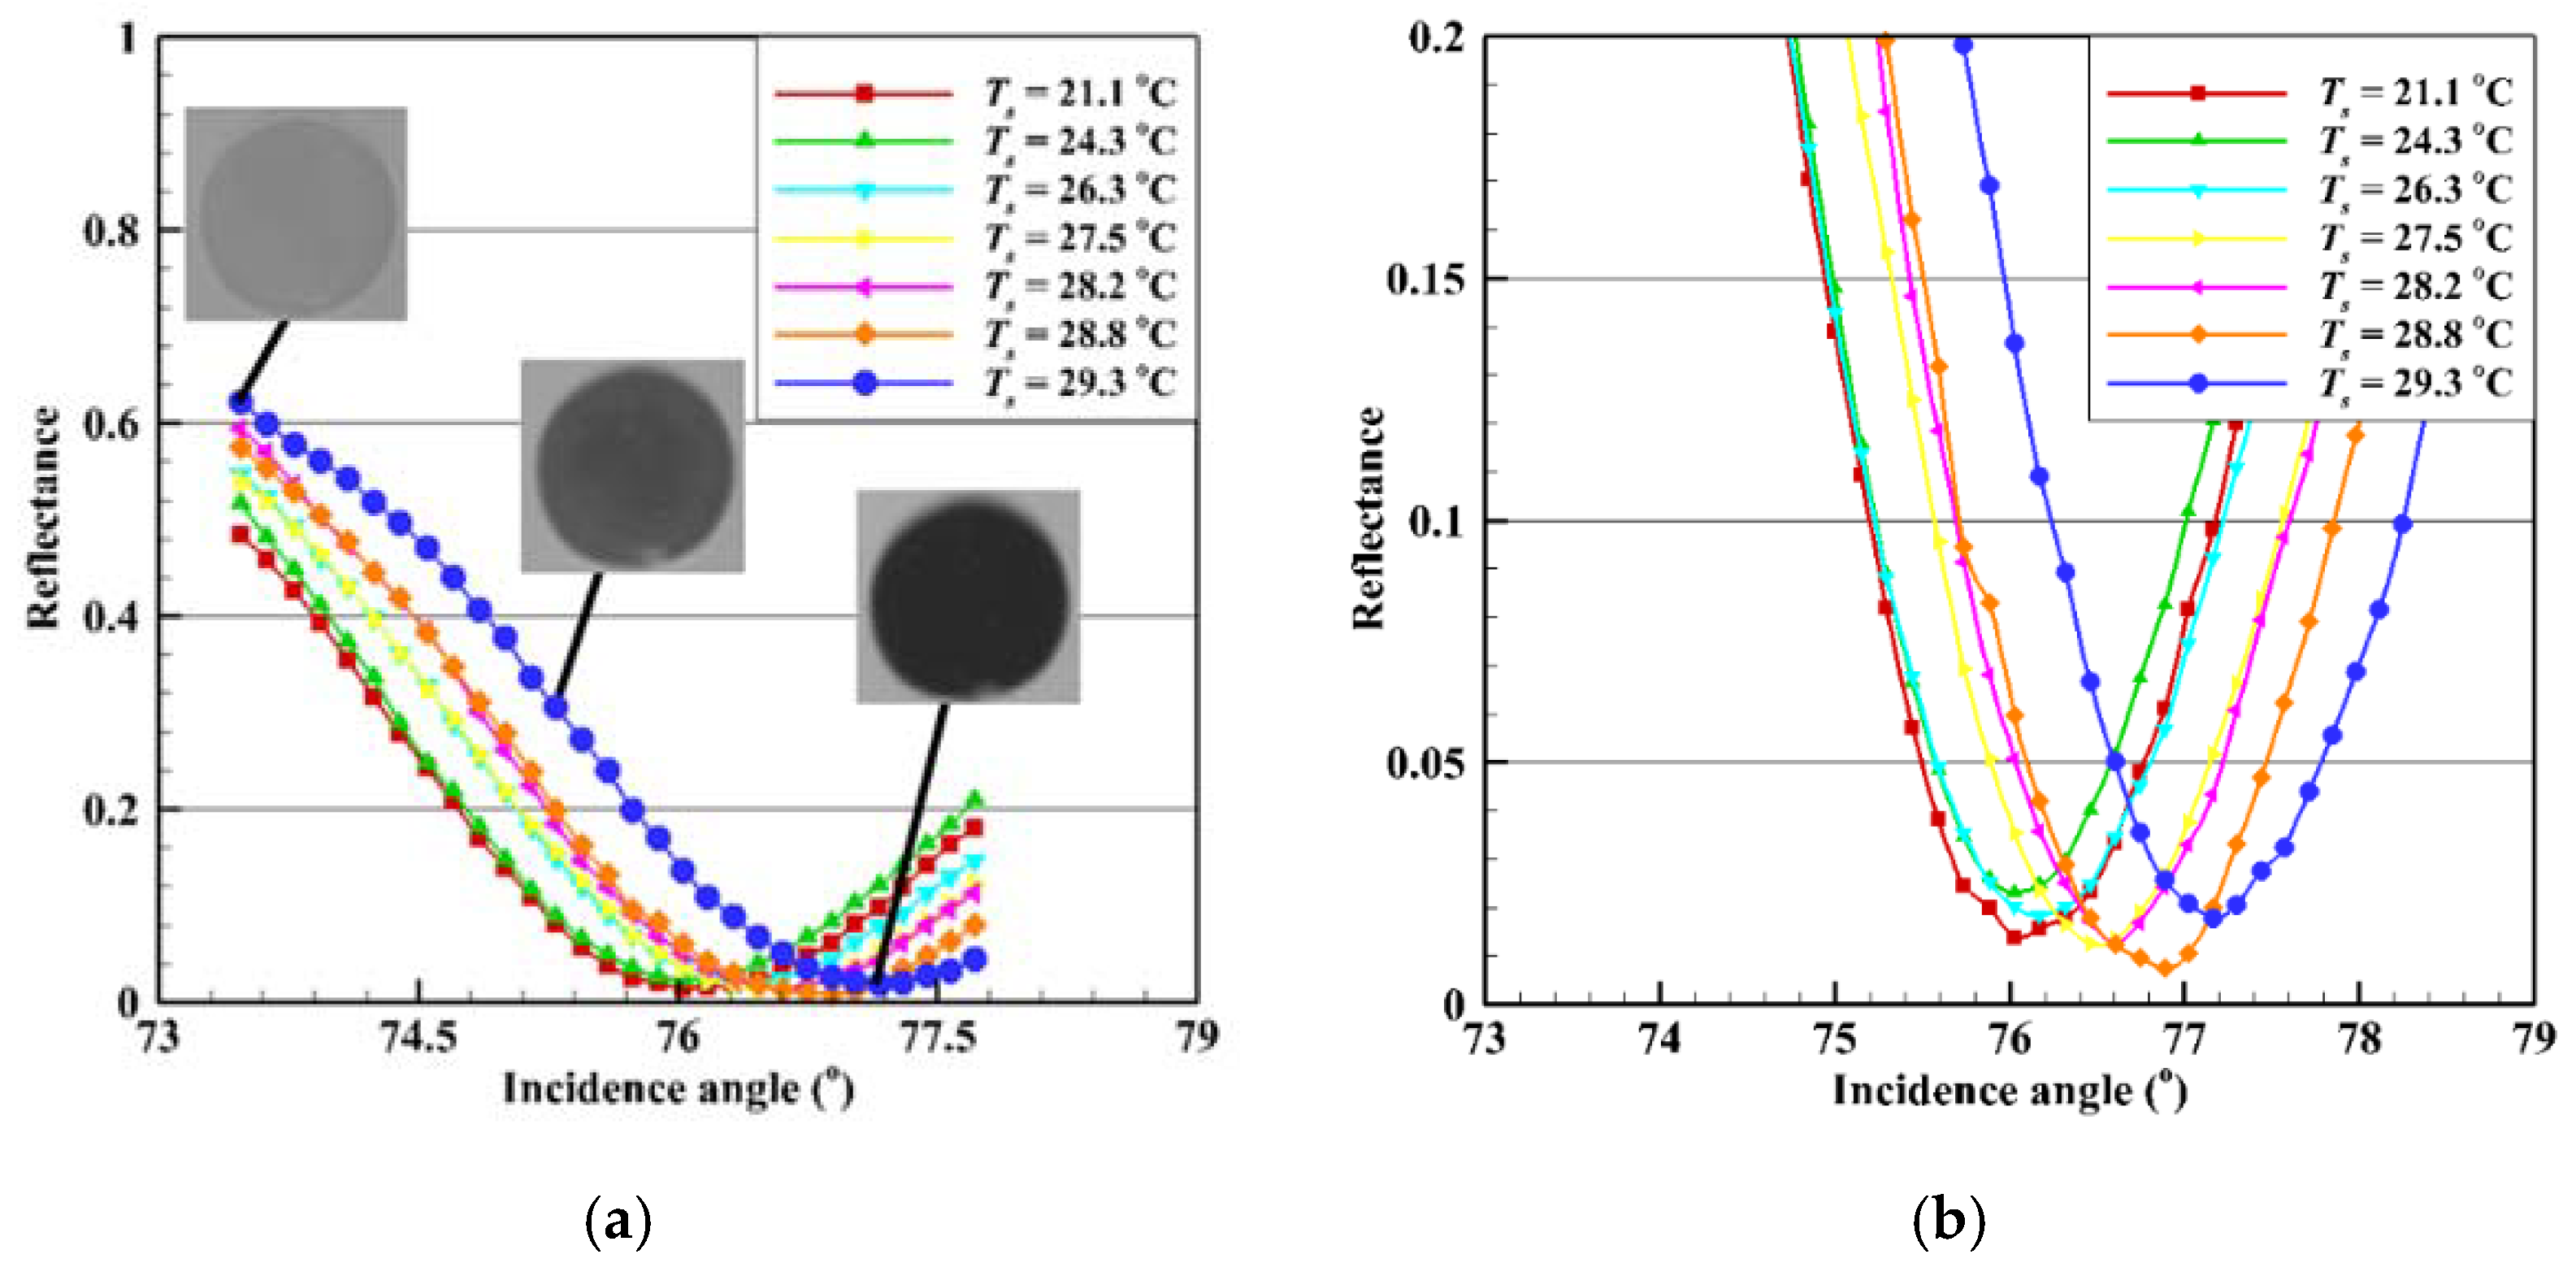
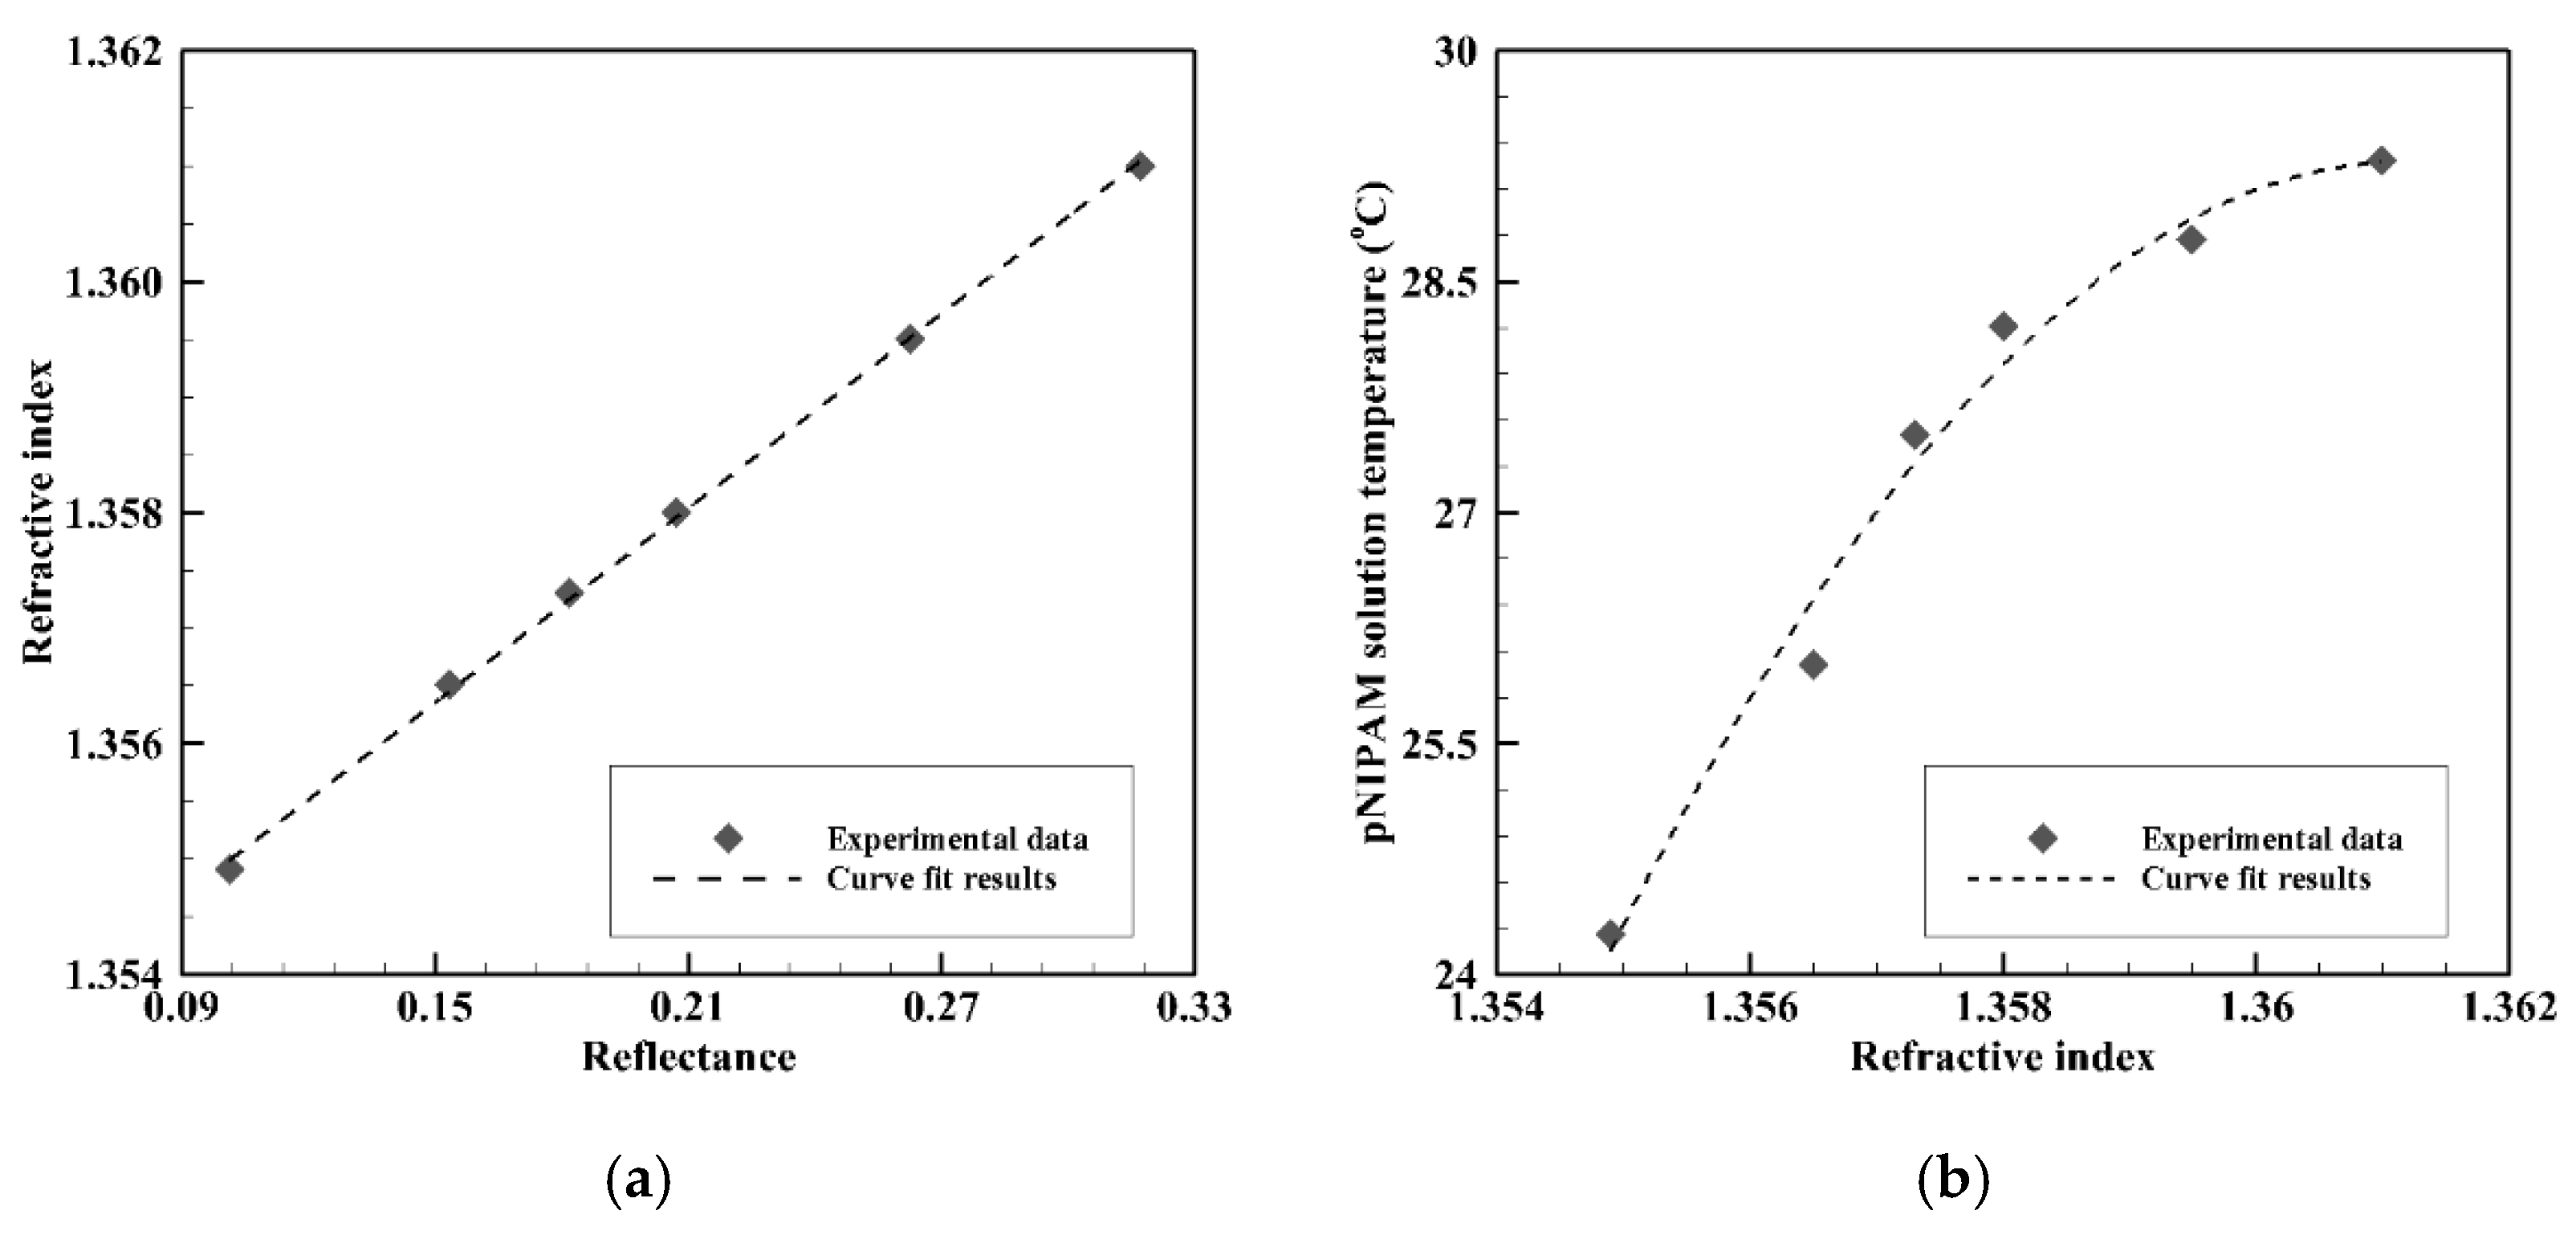
2.2. Development of Temperature Measurement Method Using pNIPAM Solution

A temperature measurement method is developed based on the refractive index of a pNIPAM solution measured by SPRi, particularly the angular modulation. The refractive index of the pNIPAM solution is estimated by finding the SPR angle with a fixed condition of the prism, gold film thickness, and wavelength. The temperature of the gold film, Ts, is controlled using a heating plate, and the thermocouple is attached to the gold film to measure the temperature. Figure 2 depicts reflectance curves of the pNIPAM solution with different surface temperatures. The reflectance decreases with the increase of the incidence angle, and it shows a minimum at the SPR angle. Interestingly, the SPR angles for temperatures of 21.1 ± 0.2 °C and 24.3 ± 0.2 °C are the same, which means temperature measurements are not meaningful due to no corresponding reflectance variations at given incidence angles. Moreover, the reflectance curves shift to the right with an increase of temperature, as in Figure 2a,b. The refractive indices corresponding to each temperature are listed in Table 1. The refractive index increases with the temperature of the pNIPAM solution showing the same tendency with Kuckling et al. [23]. The refractive index of the pNIPAM solution drastically increases when the temperature is higher than 29.3 °C near the LCST. However, it is impossible to predict the SPR angle near the LCST through the reflectance curve in the present experimental setup. This is because the reflectance is indistinguishable at a higher refractive index with a different incident angle. Thus, the reflectance of the pNIPAM solution is measured with a temperature range of 24.3 °C to 29.3 °C.
A correlation between reflectance and refractive index at a specific incidence angle is derived based on reflectance results obtained by converting intensities of experimental images. Figure 3 shows the relation between the reflectance, refractive index, and temperature of the pNIPAM solution when the incidence angle of the light to the gold film is 75°. The curve fitted equations are obtained from experimental results as follows:
n p = 0.02806 R + 1.352
T = 2.39621 × 10 5 + 3.52117 × 10 5 n p 1.29341 × 10 5 n p 2
where np is the refractive index of a pNIPAM solution, R is reflectance, and T is the temperature of a pNIPAM solution. From the experimental images using the SPRi system, the calibrated reflectance of the pNIPAM solution is obtained, and subsequently, the temperature distribution is calculated from Equations (2) and (3).

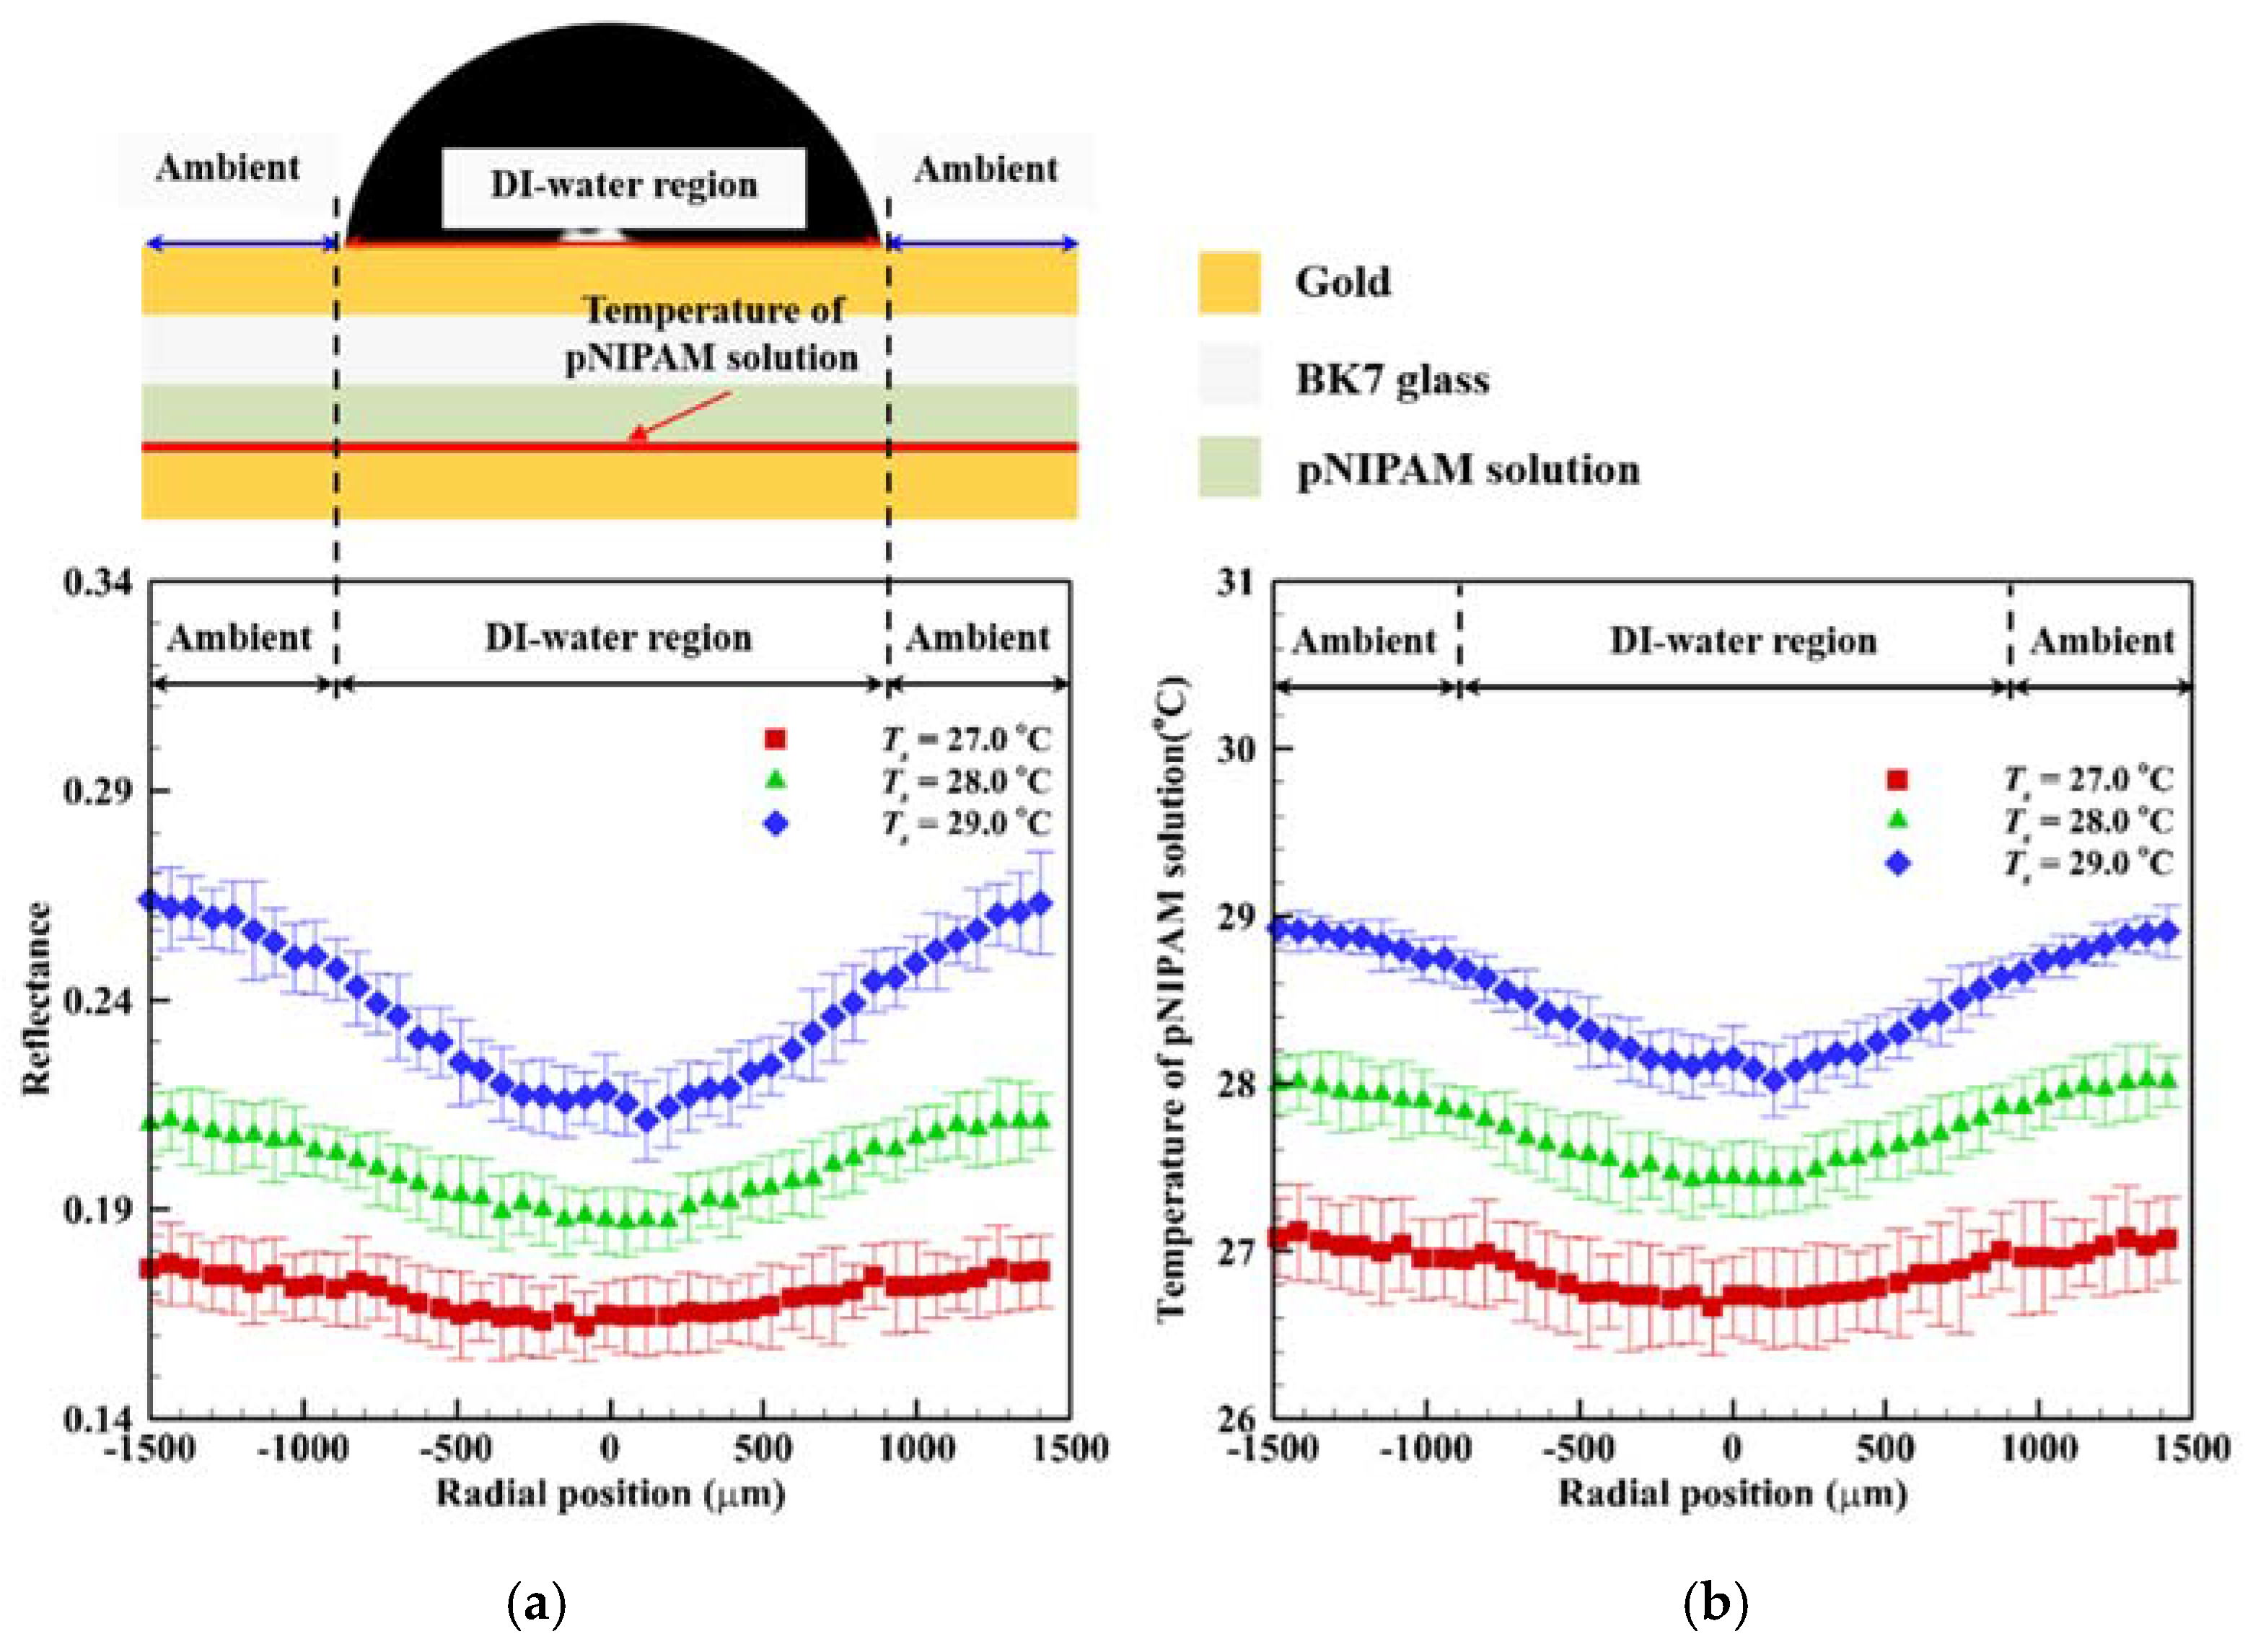
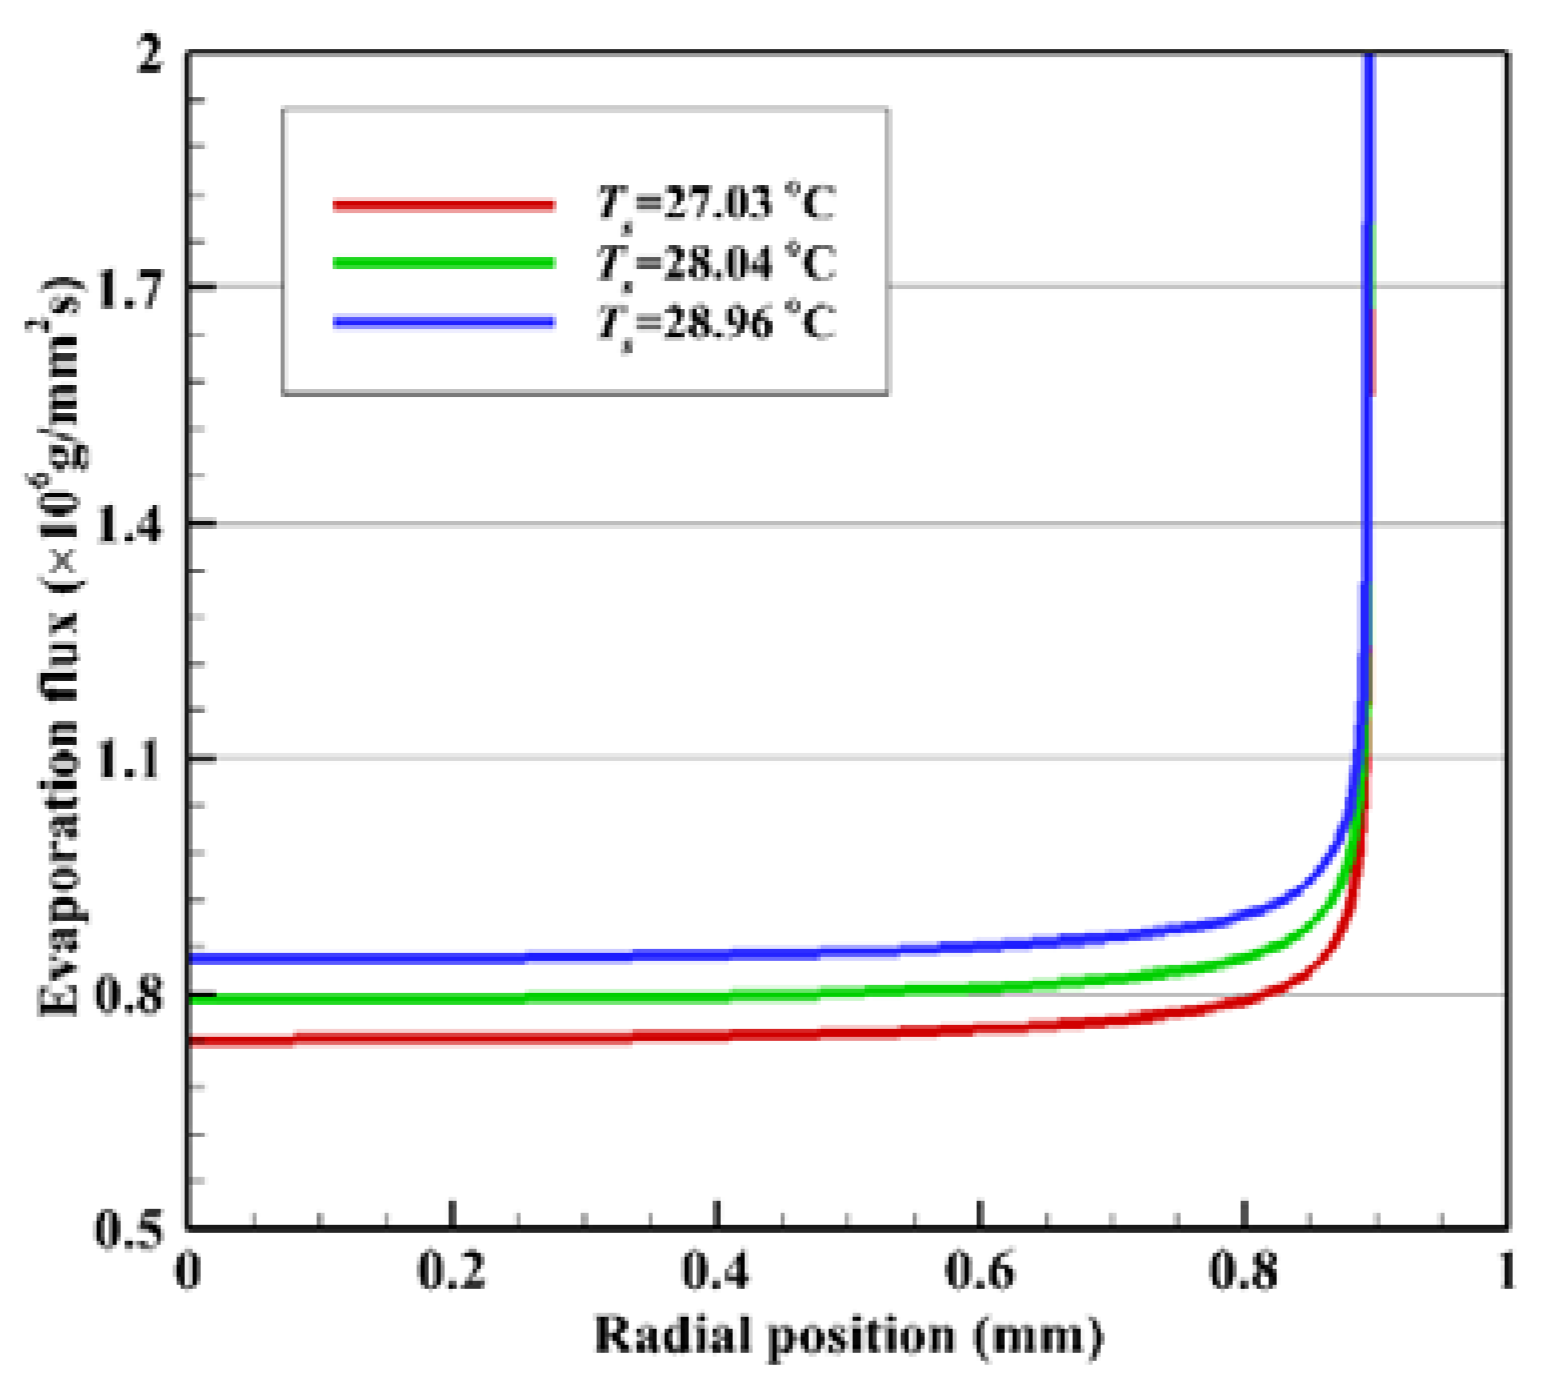
3. Results and Discussion

The temperature measurement method using the pNIPAM solution should be evaluated by comparing it with the thermocouple data. The gold film temperature is adjusted with 4 cases using a heating plate (case 1: 26 °C, case 2: 27 °C, case 3: 28 °C, and case 4: 29 °C). As shown in Figure 4, the gold film temperature is measured using the thermocouple and pNIPAM solution measurement method. T1,TC is the gold film temperature measured by the thermocouple, and T1,p is the gold film temperature estimated by the measurement method using pNIPAM solution. The pNIPAM solution temperature is averaged over the area within the red dotted circle in Figure 4. The present method is validated with the maximum difference of 0.14 °C for case 3, which lies within the measurement uncertainty range of the thermocouple.
DI-water droplet (22 °C, 1 μL) is deposited on the second gold film above the pNIPAM layer to examine the solid–liquid interface temperature (see Figure 1b). The incidence angle of the light is fixed at 75°. Figure 5 shows the side view of the droplet and the corresponding SPR image at the surface temperature, Ts, of 29.0 °C. The contact diameter of the droplets, Dw, is 1.79 ± 0.1 mm, and the contact angle is 77.3 ± 1.5°. In the SPR image, the dark color is the pNIPAM solution, and the bright color is ambient. The lower the temperature, the lower the reflectance of the pNIPAM solution showing a relatively dark color. The magnified region of the blue dotted area is depicted in Figure 5c. The SPR image has a dark color at the center of the droplet due to the decrease of the temperature, and it gradually brightens toward the contact line region.
Temperature distributions over a pNIPAM solution are estimated through the reflectance obtained by the corresponding SPR intensity. Figure 6a shows the reflectance of the pNIPAM solution along with line AB (in Figure 5c) right after a droplet deposition. The initial reflectance of the pNIPAM solution before the droplet deposition is about 0.1746, 0.2106, and 0.2680 for the surface temperature, Ts, of 27.0, 28.0, and 29.0 °C, respectively. A DI-water is located at −895 μm to 895 μm with a diameter of 1790 μm; a minimum reflectance is observed near the center (r = 0 μm) for all cases. Reflectance varies relatively large for the surface temperature of 29.0 °C. However, other cases have a small change of reflectance at the location of the droplet because the refractive index of the pNIPAM solution drastically deviates with the increase of the temperature, as in Figure 3b. The temperature of the pNIPAM solution, T1,p, is obtained by using Equations (2) and (3). A measurable temperature range is 24.3 °C through 29.3 °C considering the thermo-sensitivity of pNIPAM under the present experimental setup. The lowest temperature of pNIPAM solution is observed at the center of the droplet for all cases—the temperature increases toward the contact line of the droplet. As the surface temperature decreases, the variation of the pNIPAM solution temperature decreases. Moreover, the pNIPAM solution temperature is lower than the surface temperature at the outer region of the droplet due to the heat transfer through the transverse direction of the multi-layer.
The solid–liquid interface temperature of the droplet is estimated by solving the one-dimension heat conduction problem with the pNIPAM solution temperature as a boundary condition. We assume that all energy required for evaporation at the interface is conducted through the droplet from the heated substrate. The convection within the droplet is neglected [18,30]. The conductive heat transfer along the multi-layer, including a droplet and pNIPAM solution, is written as
q c o n d ( r ) = T 1 , P ( r ) T 4 ( r ) i = 1 3 δ i ( r ) λ i
where δ is the layer thickness, and λ is the thermal conductivity. Subscripts 1, 2, 3, 4 denote interface between each of the multi-layer films as in Figure 1b. The evaporative heat flux, qev (W/m2), along the interface is defined as [31]
q e v ( r , T s ) = Δ H v a p J ( r , T s )
J t h e o ( r , T s ) = D ( c s a t ( T s ) c ( T a ) φ ) R C R f ( θ )
f ( θ ) = [ 1 2 sin θ + 2 ( cosh α + cos θ c ) 3 / 2 × 0 cosh θ c τ cosh π τ tanh [ ( π θ c ) τ ] P 1 / 2 + i τ ( cosh α ) τ d τ ]
where ΔHvap is the latent heat of vaporization (2264.705 kJ/kg), Jtheo (kg/m2s) is the theoretically estimated local evaporation flux of the droplet, D is diffusivity (26.1 mm2/s), csat is a saturated vapor concentration depending on the temperature, φ is the relative humidity (10%), RCR is the droplet contact radius (0.895 mm), r is the radial coordinate described as r = RCR·sinh α/(cosh α + cos θ), θc is the contact angle of the droplet (77.27°), τ is the integral constant, α is the toroidal coordinate, and p1/2 + iτ is the Legendre function of the first kind. Figure 7 shows the evaporation flux of the droplet considering the surface temperature by calculating Equation (6). The evaporation flux increases along with the radial position. It shows the infinite value at the contact line region, which is physically unrealistic because the droplet evaporates with finite evaporation flux. Kim et al. [28] suggested a new model to calculate the evaporation rate of the droplet with the finite evaporation flux at the contact line region. They visualized the evaporating thin film (ETF) of the DI-water droplet at the contact line region and measured the width and thickness of the ETF. The quantitatively measured width of the ETF was 8.414 μm. However, there are no experimental results of the ETF depending on the surface temperature. The present study uses the results of Kim et al. [28] taking a cutoff length of 8.414 μm to solve the singularity problem and adapts the finite averaged evaporation flux at the contact line region expressed as
J a v g = 0 2 π R C R l R C R J ( r ) r d r d φ l π ( 2 R C R l )
where Javg is the averaged evaporation flux, and l is the width of the ETF. This approach is also adopted for the binary mixture droplet by Jeong et al. [32]. The theoretical results of evaporation flux and averaged evaporation flux at the contact line region are used as the boundary condition to calculate the solid–liquid interface temperature of the droplet.
The solid–liquid interface temperature, T4, of the droplet is calculated with energy balance (qcond = qev) at the liquid–air interface.
T 4 ( r , T s ) = [ T 1 , P ( r , T s ) Δ H v a p J t h e o ( r , T s ) i = 1 3 δ i ( r , T s ) k i , 0 < r < R C R l T 1 , P ( r , T s ) Δ H v a p J a v g ( r , T s ) i = 1 3 δ i ( r , T s ) k i , R C R l < r < R C R
Figure 8 depicts the predicted temperature distribution of the solid–liquid interface. It has a lower value than the temperature of the pNIPAM solution due to the evaporative cooling and heat losses. The solid–liquid interface temperature shows a lower value at the center of the droplet and gradually increases along the radial direction. This is because the droplet thickness is maximum at the center of the droplet, which means the increase of thermal resistance, causing a decrease of temperature. On the other hand, the droplet thickness becomes thinner toward the contact line region with lower thermal resistance. Therefore, the temperature increases from the center of the droplet to the radial direction. However, the minimum temperature is observed at the contact line region of the droplet. As a matter of fact, the evaporation flux is the maximum at the contact line region, which means the evaporative cooling also maximum, causing a lowering of the temperature. Many studies calculated the evaporation flux using the energy balance (qcond = qev) with the assumption of isothermal at a solid surface [18,30,33]. It is valid for low surface temperatures. However, the deviation of the solid–liquid interface temperature is increased with the surface temperature, as shown in Figure 8. The maximum deviations of the solid–liquid interface temperature along the radial direction are 0.41 °C, 0.44 °C, and 0.47 °C for Ts = 27.0 °C, 28.0 °C, and 29.0 °C, respectively. Thus, the solid–liquid interface temperature should be considered to calculate the evaporation flux for the higher surface temperature accurately.

4. Conclusions

The present study proposed a novel method to measure the temperature using the pNIPAM solution and SPRi technique, and the solid–liquid interface temperature of the droplet was predicted by calculating the heat conduction problem with the measured temperature using pNIPAM solution. The refractive index of the pNIPAM solution was measured through the angular modulation of the SPRi system, and the curve-fitted relations between the reflectance and temperature were obtained. We successfully measured the temperature distribution of the pNIPAM solution with a range of 24.3 °C < T < 29.3 °C using the SPRi technique. The temperature measurement method using the pNIPAM solution was evaluated by comparing the temperature results with the thermocouple data. It showed a good agreement with a small difference within the uncertainty range of the thermocouple. The present study also predicted the solid–liquid interface temperature of the droplet deposited on the gold film. The reflectance of the pNIPAM solution decreased after the deposition of the droplet, and it showed minimum values at the center of the droplet. The temperature distribution was also obtained using the curve fitted relations and reflectance. Based on the temperature of the pNIPAM solution, the one-dimensional heat conduction problem was calculated to estimate the solid–liquid interface temperature. The DI-water droplet had a lower temperature distribution at the center. It increased along the radial direction due to the decrease of thermal resistance corresponding to the droplet thickness. However, the temperature decreased near the contact line region owing to the maximum evaporative cooling. The variation of solid–liquid interface temperature increased with the surface temperature. Thus, the solid–liquid interface temperature should be considered to accurately predict the evaporation flux of the droplet for the high surface temperature.

Author Contributions

Conceptualization, H.J.L., C.K.C. and S.H.L.; methodology H.J.L. and C.H.J.; investigation, D.Y.K.; visualization H.J.L.; formal analysis, H.J.L. and S.H.L.; writing—original draft preparation, H.J.L.; writing—review and editing, C.K.C. and S.H.L. All authors have read and agreed to the published version of the manuscript.

Funding

This work was supported by the National Research Foundation of Korea (NRF) grant funded by the Korea government (MSIT) (No.NRF-2021R1A2C3014510 and No.NRF-2020R1A4A4078930).

Conflicts of Interest

The authors declare no conflict of interest.

References

  1. Mampallil, D.; Eral, H.B. A review on suppression and utilization of the coffee-ring effect. Adv. Colloid Interface Sci. 2018, 252, 38–54. [Google Scholar] [CrossRef] [PubMed]
  2. Popov, Y.O. Evaporative deposition patterns: Spatial dimensions of the deposit. Phys. Rev. E 2005, 71, 036313. [Google Scholar] [CrossRef] [PubMed] [Green Version]
  3. Moon, J.H.; Lee, S.M.; Choi, C.K.; Lee, S.H. Modeling of the evaporation rate of liquid droplets on anodized heated surfaces. Int. Commun. Heat Mass Transf. 2018, 98, 209–215. [Google Scholar] [CrossRef]
  4. Dash, S.; Garimella, S.V. Droplet evaporation dynamics on a superhydrophobic surface with negligible hysteresis. Langmuir 2013, 29, 10785–10795. [Google Scholar] [CrossRef] [PubMed]
  5. Stauber, J.M.; Wilson, S.K.; Duffy, B.R.; Sefiane, K. Evaporation of droplets on strongly hydrophobic substrates. Langmuir 2015, 31, 3653–3660. [Google Scholar] [CrossRef]
  6. Hu, H.; Larson, R.G. Evaporation of a sessile droplet on a substrate. J. Phys. Chem. B 2002, 106, 1334–1344. [Google Scholar] [CrossRef]
  7. Girard, F.; Antoni, M.; Faure, S.; Steinchen, A. Influence of heating temperature and relative humidity in the evaporation of pinned droplets. Colloids Surf. A Physicochem. Eng. Asp. 2008, 323, 36–49. [Google Scholar] [CrossRef]
  8. Dash, S.; Garimella, S.V. Droplet evaporation on heated hydrophobic and superhydrophobic surfaces. Phys. Rev. E 2014, 89, 042402. [Google Scholar] [CrossRef] [Green Version]
  9. Sobac, B.; Brutin, D. Thermal effects of the substrate on water droplet evaporation. Phys. Rev. E 2012, 86, 021602. [Google Scholar] [CrossRef] [Green Version]
  10. Erbil, H.Y. Evaporation of pure liquid sessile and spherical suspended drops: A Review. Adv. Colloid Interface Sci. 2012, 170, 67–86. [Google Scholar] [CrossRef]
  11. Xu, X.; Ma, L. Analysis of the effects of evaporative cooling on the evaporation of liquid droplets using a combined field approach. Sci. Rep. 2015, 5, 8614. [Google Scholar] [CrossRef] [Green Version]
  12. Ristenpart, W.D.; Kim, P.G.; Domingues, C.; Wan, J.; Stone, H.A. Influence of substrate conductivity on circulation reversal in evaporating drops. Phys. Rev. Lett. 2007, 99, 234502. [Google Scholar] [CrossRef] [PubMed] [Green Version]
  13. Lopes, M.C.; Bonaccurso, E.; Gambaryan-Roisman, T.; Stephan, P. Influence of the substrate thermal properties on sessile droplet evaporation: Effect of transient heat transport. Colloids Surf. A Physicochem. Eng. Asp. 2013, 432, 64–70. [Google Scholar] [CrossRef]
  14. Wang, Y.; Ma, L.; Xu, X.; Luo, J. Combined effects of underlying substrate and evaporative cooling on the evaporation of sessile liquid droplets. Soft Matter 2015, 11, 5632–5640. [Google Scholar] [CrossRef] [Green Version]
  15. Saha, A.; Kumar, R.; Basu, S. Infrared thermography and numerical study of vaporization characteristics of pure and blended bio-fuel droplets. Int. J. Heat Mass Transf. 2010, 53, 3862–3873. [Google Scholar] [CrossRef]
  16. Brutin, D.; Sobac, B.; Rigollet, F.; Le Niliot, C. Infrared visualization of thermal motion inside a sessile drop deposited onto a heated surface. Exp. Therm. Fluid Sci. 2011, 35, 521–530. [Google Scholar] [CrossRef]
  17. Tarozzi, L.; Muscio, A.; Tartarini, P. Experimental tests of dropwise cooling on infrared-transparent media. Exp. Therm. Fluid Sci. 2007, 31, 857–865. [Google Scholar] [CrossRef]
  18. Fabien, G.; Antoni, M.; Sefiane, K. Use of IR thermography to investigate heated droplet evaporation and contact line dynamics. Langmuir 2011, 27, 6744–6752. [Google Scholar] [CrossRef]
  19. Sodtke, C.; Ajaev, V.; Stephan, P. Evaporation of thin liquid droplets on heated surfaces. Heat Mass Transf. 2007, 43, 649–657. [Google Scholar] [CrossRef]
  20. Usamentiaga, R.; Venegas, P.; Guerediaga, J.; Vega, L.; Molleda, J.; Bulnes, G.F. Infrared thermography for temperature measurement and non-destructive testing. Sensors 2014, 14, 12305–12348. [Google Scholar] [CrossRef] [PubMed] [Green Version]
  21. Sharma, A.K.; Sharma, S.K.; Vasistha, P.; Mangalhara, J.P. Effect of ambient temperature on calibration of cooled thermal camera. Def. Sci. J. 2017, 67, 173. [Google Scholar] [CrossRef] [Green Version]
  22. Gibbons, M.J.; Di Marco, P.; Robinson, A.J. Heat flux distribution beneath evaporating hydrophilic and superhydrophobic droplets. Int. J. Heat Mass Transf. 2020, 148, 119093. [Google Scholar] [CrossRef]
  23. Kuckling, D.; Harmon, M.E.; Frank, C.W. Photo-cross-linkable PNIPAAm copolymers. 1. Synthesis and characterization of constrained temperature-responsive hydrogel layers. Macromolecules 2002, 35, 6377–6383. [Google Scholar] [CrossRef]
  24. Philipp, M.; Müller, U.; Aleksandrova, R.; Sanctuary, R.; Müller-Buschbaum, P.; Krüger, J.K. On the elastic nature of the demixing transition of aqueous PNIPAM solutions. Soft Matter 2012, 8, 11387–11395. [Google Scholar] [CrossRef]
  25. Garner, B.W.; Cai, T.; Ghosh, S.; Hu, Z.; Neogi, A. Refractive index change due to volume-phase transition in polyacrylamide gel nanospheres for optoelectronics and bio-photonics. Appl. Phys. Express 2009, 2, 057001. [Google Scholar] [CrossRef]
  26. Hasan, M.R.; Akter, S.; Rahman, M.S.; Ahmed, K. Design of a surface plasmon resonance refractive index sensor with high sensitivity. Opt. Eng. 2017, 56, 087101. [Google Scholar] [CrossRef]
  27. Brewster, M.Q. Thermal Radiative Transfer and Properties; Wiley: Hoboken, NJ, USA, 1992. [Google Scholar]
  28. Kim, D.Y.; Jeong, C.H.; Lee, H.J.; Choi, C.K.; Lee, S.H. Modeling of the finite boundary limit of evaporation flux in the contact line region using the surface plasmon resonance imaging. Int. Commun. Heat Mass Transf. 2020, 116, 104598. [Google Scholar] [CrossRef]
  29. Jeong, C.H.; Shin, D.H.; Konduru, V.; Allen, J.S.; Choi, C.K.; Lee, S.H. Quantitative measurements of nanoscale thin frost layers using surface plasmon resonance imaging. Int. J. Heat Mass Transf. 2018, 124, 83–89. [Google Scholar] [CrossRef]
  30. Girard, F.; Antoni, M.; Sefiane, K. Infrared thermography investigation of an evaporating sessile water droplet on heated substrates. Langmuir 2010, 26, 4576–4580. [Google Scholar] [CrossRef]
  31. Deegan, R.D.; Bakajin, O.; Dupont, T.F.; Huber, G.; Nagel, S.R.; Witten, T.A. Contact line deposits in an evaporating drop. Phys. Rev. E 2000, 62, 756. [Google Scholar] [CrossRef] [PubMed] [Green Version]
  32. Jeong, C.H.; Lee, H.J.; Kim, D.Y.; Ahangar, S.B.; Choi, C.K.; Lee, S.H. Quantitative analysis of contact line behaviors of evaporating binary mixture droplets using surface plasmon resonance imaging. Int. J. Heat Mass Transf. 2021, 165, 12690. [Google Scholar] [CrossRef]
  33. Xu, X.; Luo, J. Marangoni flow in an evaporating water droplet. Appl. Phys. Lett. 2007, 91, 124102. [Google Scholar] [CrossRef]
Figure 1. (a) Picture of the present surface plasmon resonance imaging (SPRi) experimental setup and (b) schematic of temperature measurement using a poly(N-isopropylacrylamide) (pNIPAM) solution, left: for the evaluation of pNIPAM solution, center: droplet temperature measurement, right: cross-sectional schematic of multi-layer.
Applsci 11 03379 g001
Figure 2. (a) Reflectance curve of pNIPAM solution considering the incidence angle of light and temperature, (b) magnified reflectance curve near the SPR angle.
Applsci 11 03379 g002
Figure 3. (a) Refractive index variation of pNIPAM solution with the reflectance, (b) temperature variation according to the refractive index of pNIPAM solution.
Applsci 11 03379 g003
Figure 4. Comparison of temperature between pNIPAM solution measurement, T1,p, and thermocouple, T1,TC.
Applsci 11 03379 g004
Figure 5. (a) Side view of a de-ionized (DI) water droplet, (b) SPRi image after locating a droplet at t = 0 s and Ts = 29.0 °C, and (c) magnified image of reflectance of blue dotted rectangular region.
Applsci 11 03379 g005
Figure 6. (a) Reflectance and (b) temperature distribution of pNIPAM (T1,p) along line AB.
Applsci 11 03379 g006
Figure 7. Theoretical evaporation flux of the droplet according to the surface temperature.
Applsci 11 03379 g007
Figure 8. Solid–liquid interface temperature distribution along the line of AB.
Applsci 11 03379 g008
Table 1. Refractive index of pNIPAM solution (10 wt%).
Temperature (°C)Refractive Index
21.1 ± 0.21.3549
24.3 ± 0.21.3549
26.1 ± 0.11.3557
27.5 ± 0.21.3573
28.2 ± 0.21.3580
28.8 ± 0.21.3595
29.3 ± 0.21.3610
Publisher’s Note: MDPI stays neutral with regard to jurisdictional claims in published maps and institutional affiliations.

