Article

Energy Characteristics of Full Tubular Pump Device with Different Backflow Clearances Based on Entropy Production

Research Center of Fluid Machinery Engineering and Technology, Jiangsu University, Zhenjiang 212013, China
*
Author to whom correspondence should be addressed.
Appl. Sci. 2021, 11(8), 3376; https://doi.org/10.3390/app11083376
Submission received: 1 March 2021 / Revised: 27 March 2021 / Accepted: 29 March 2021 / Published: 9 April 2021
(This article belongs to the Section Energy Science and Technology)

Abstract

:
In this study, the entropy theory was used as the evaluation standard of energy dissipation, and the effect of backflow clearance (the gap between motor rotor and motor shell) on energy characteristics of a full tubular pump was investigated by 3D unsteady flow simulation. The calculated results validated through testing shows that backflow clearance produces additional head loss and the rotation of the motor rotor requires more shaft power. The additional energy losses lead to a significant decline in the efficiency of tubular pump device. Under design conditions, the total dissipation of backflow clearance, rear guide vane, and outlet passage decreases with the increase of clearance radius, but that of the impeller decreases first and then rises with the increase of clearance radius. In addition, the increase of the clearance radius leads to disorderly flow pattern in the impeller. The total dissipation rate on the impeller suction side and near the impeller inlet increases with the increase of backflow clearance radius, but that on the impeller suction side decreases with the increase of backflow clearance radius. The total dissipation rate of the suction side of the guide vane and the wall of the outlet passage decreases with the increase of backflow clearance radius. This work can provide an intuitive analysis of the energy dissipation caused by backflow clearance and reference for engineering applications of full tubular pump.

1. Introduction

Axial flow pump devices with low head are widely used in flood control, irrigation, and regional water diversion projects [1,2]. Tubular axial flow pump devices are mounted with the motor inside a passage, which has the advantages of a straight passage profile and small civil work. According to the motor installation model and passage type, the tubular axial flow pump device can be divided into bulb tubular pump devices, vertical shaft tubular pump devices, and full tubular pump devices [3]. To reduce installation space and obtain a compact structure, the impeller of full tubular pump device is placed inside the motor and the impeller blade is connected with motor rotor. The impeller rotates with the motor rotor as a whole, so there is inevitably a backflow clearance between the motor rotor and the motor shell. Under the action of pressure difference between the impeller inlet and outlet, part of the impeller outflow returns to the impeller inlet through the backflow clearance. The backflow converges with the impeller inflow and produce a clearance backflow vortex (CBV), which leads to disorderly internal flow pattern region and a significant decrease in the energy characteristics. The unsteady flow caused by CBV increases internal vibration inside the impeller, and even endangers safe operation in serious cases.
At present, there is a few studies on the backflow clearance in the full tubular pump. Shi [4,5] compared the hydraulic characteristics and pressure characteristics of a full tubular pump and traditional axial flow pump. The results shown that the hydraulic performance of the full tubular pump is lower than the traditional axial flow pump, but the pressure pulsation amplitude of the full tubular pump is smaller than that of the traditional axial flow pump under the design and over-load condition. Driven by the pressure difference between the pressure side and the suction side of impeller, the tip leakage vortex (TLV) and induced cavitation [6] can be found near the blade tip clearance (BTC). Thus, the BTC of the traditional pump is similar to the backflow clearance of full tubular pump, and the research on BTC can provide some references. Many scholars used numerical simulation and test measurement (high-speed photography and particle image velocimetry) to study the TLV in axial flow pump [7], mixed flow pump [8], pump jet [9,10], and multiphase pump [11]. The research found that the evolution of TLV includes splitting stage, developing stage and merging stage [12]. The cavitation pattern induced by TLV consists of TLV cavitation, tip corner vortex cavitation, shear layer cavitation, jetting shear layer cavitation, and suction-side-perpendicular cavitating vortices [13,14]. In addition, the increase of tip clearance radius can intensify TLV and result in a decrease of hydraulic performance [15], but the appropriate tip clearance shape can suppress TLV and induced cavitation [16,17]. Most of the research focuses on the influence of backflow clearance and BTC on the hydraulic performance and internal velocity field, but the energy losses caused by CBV and TLV have not been made fully clear to date. In 2003, Kock [18,19] proposed an entropy production theory and, therefore, the spatial distribution of energy losses in hydro-turbine [20], centrifugal pump [21,22], and axial flow pump [23] can be evaluated from computational fluid dynamics (CFD) post-processing. Furthermore, the effect of geometric parameters on the energy transfer characteristics can also be obtained by using entropy generation theory [24,25,26,27], which can provide reference for optimal design. In the research field of BTC, entropy production theory can better reveal the mechanism of energy losses due to TLV. For instance, Ji [28] and Shen [29] used the entropy production theory to analyze the energy characteristics under different BTC of a mixed flow pump and axial flow pump, respectively. The results shown that the increase of tip clearance radius led to the increase of energy losses and the decrease of hydraulic performance.
In the previous studies, the relationship between backflow clearance and energy transfer characteristics in full tubular pump device was not established. The main contribution of this study is to visualize the energy losses in the full tubular pump device based on entropy generation theory, obtain the influence of the backflow clearance (Rb) on the energy losses, and find the location of the highest energy losses of each hydraulic component. These results can provide some reference for the structure optimization of a full tubular pump and the research on the formation mechanism of high energy loss caused by backflow clearance.

2. Numerical Simulation Method

2.1. Three-Dimensional Geometry Model

In this study, commercial software Creo was used to model the three-dimensional (3D) geometry structure of full tubular pump device as shown in Figure 1. The pump device consists of an inlet passage, front guide vane, impeller, motor rotor, post guide vane, and outlet passage. Four kinds of backflow clearance radius Rb are were used: 0, 0.5, 1, and 2 mm. The calculated results under Rb = 2 mm were validated by test data. Table 1 shows the main geometry parameters and design parameters of this full tubular pump device. The pump head H and efficiency η can be calculated by Equations (1) and (2) [23]:
H = p out p in ρ g
η = ρ g H Q P s
where p out and p in are the total pressure of the outlet and inlet for the full tubular pump device, respectively. ρ is the water density and g is the acceleration of gravity. Q presents the volume flow rate, and P s is shaft power.

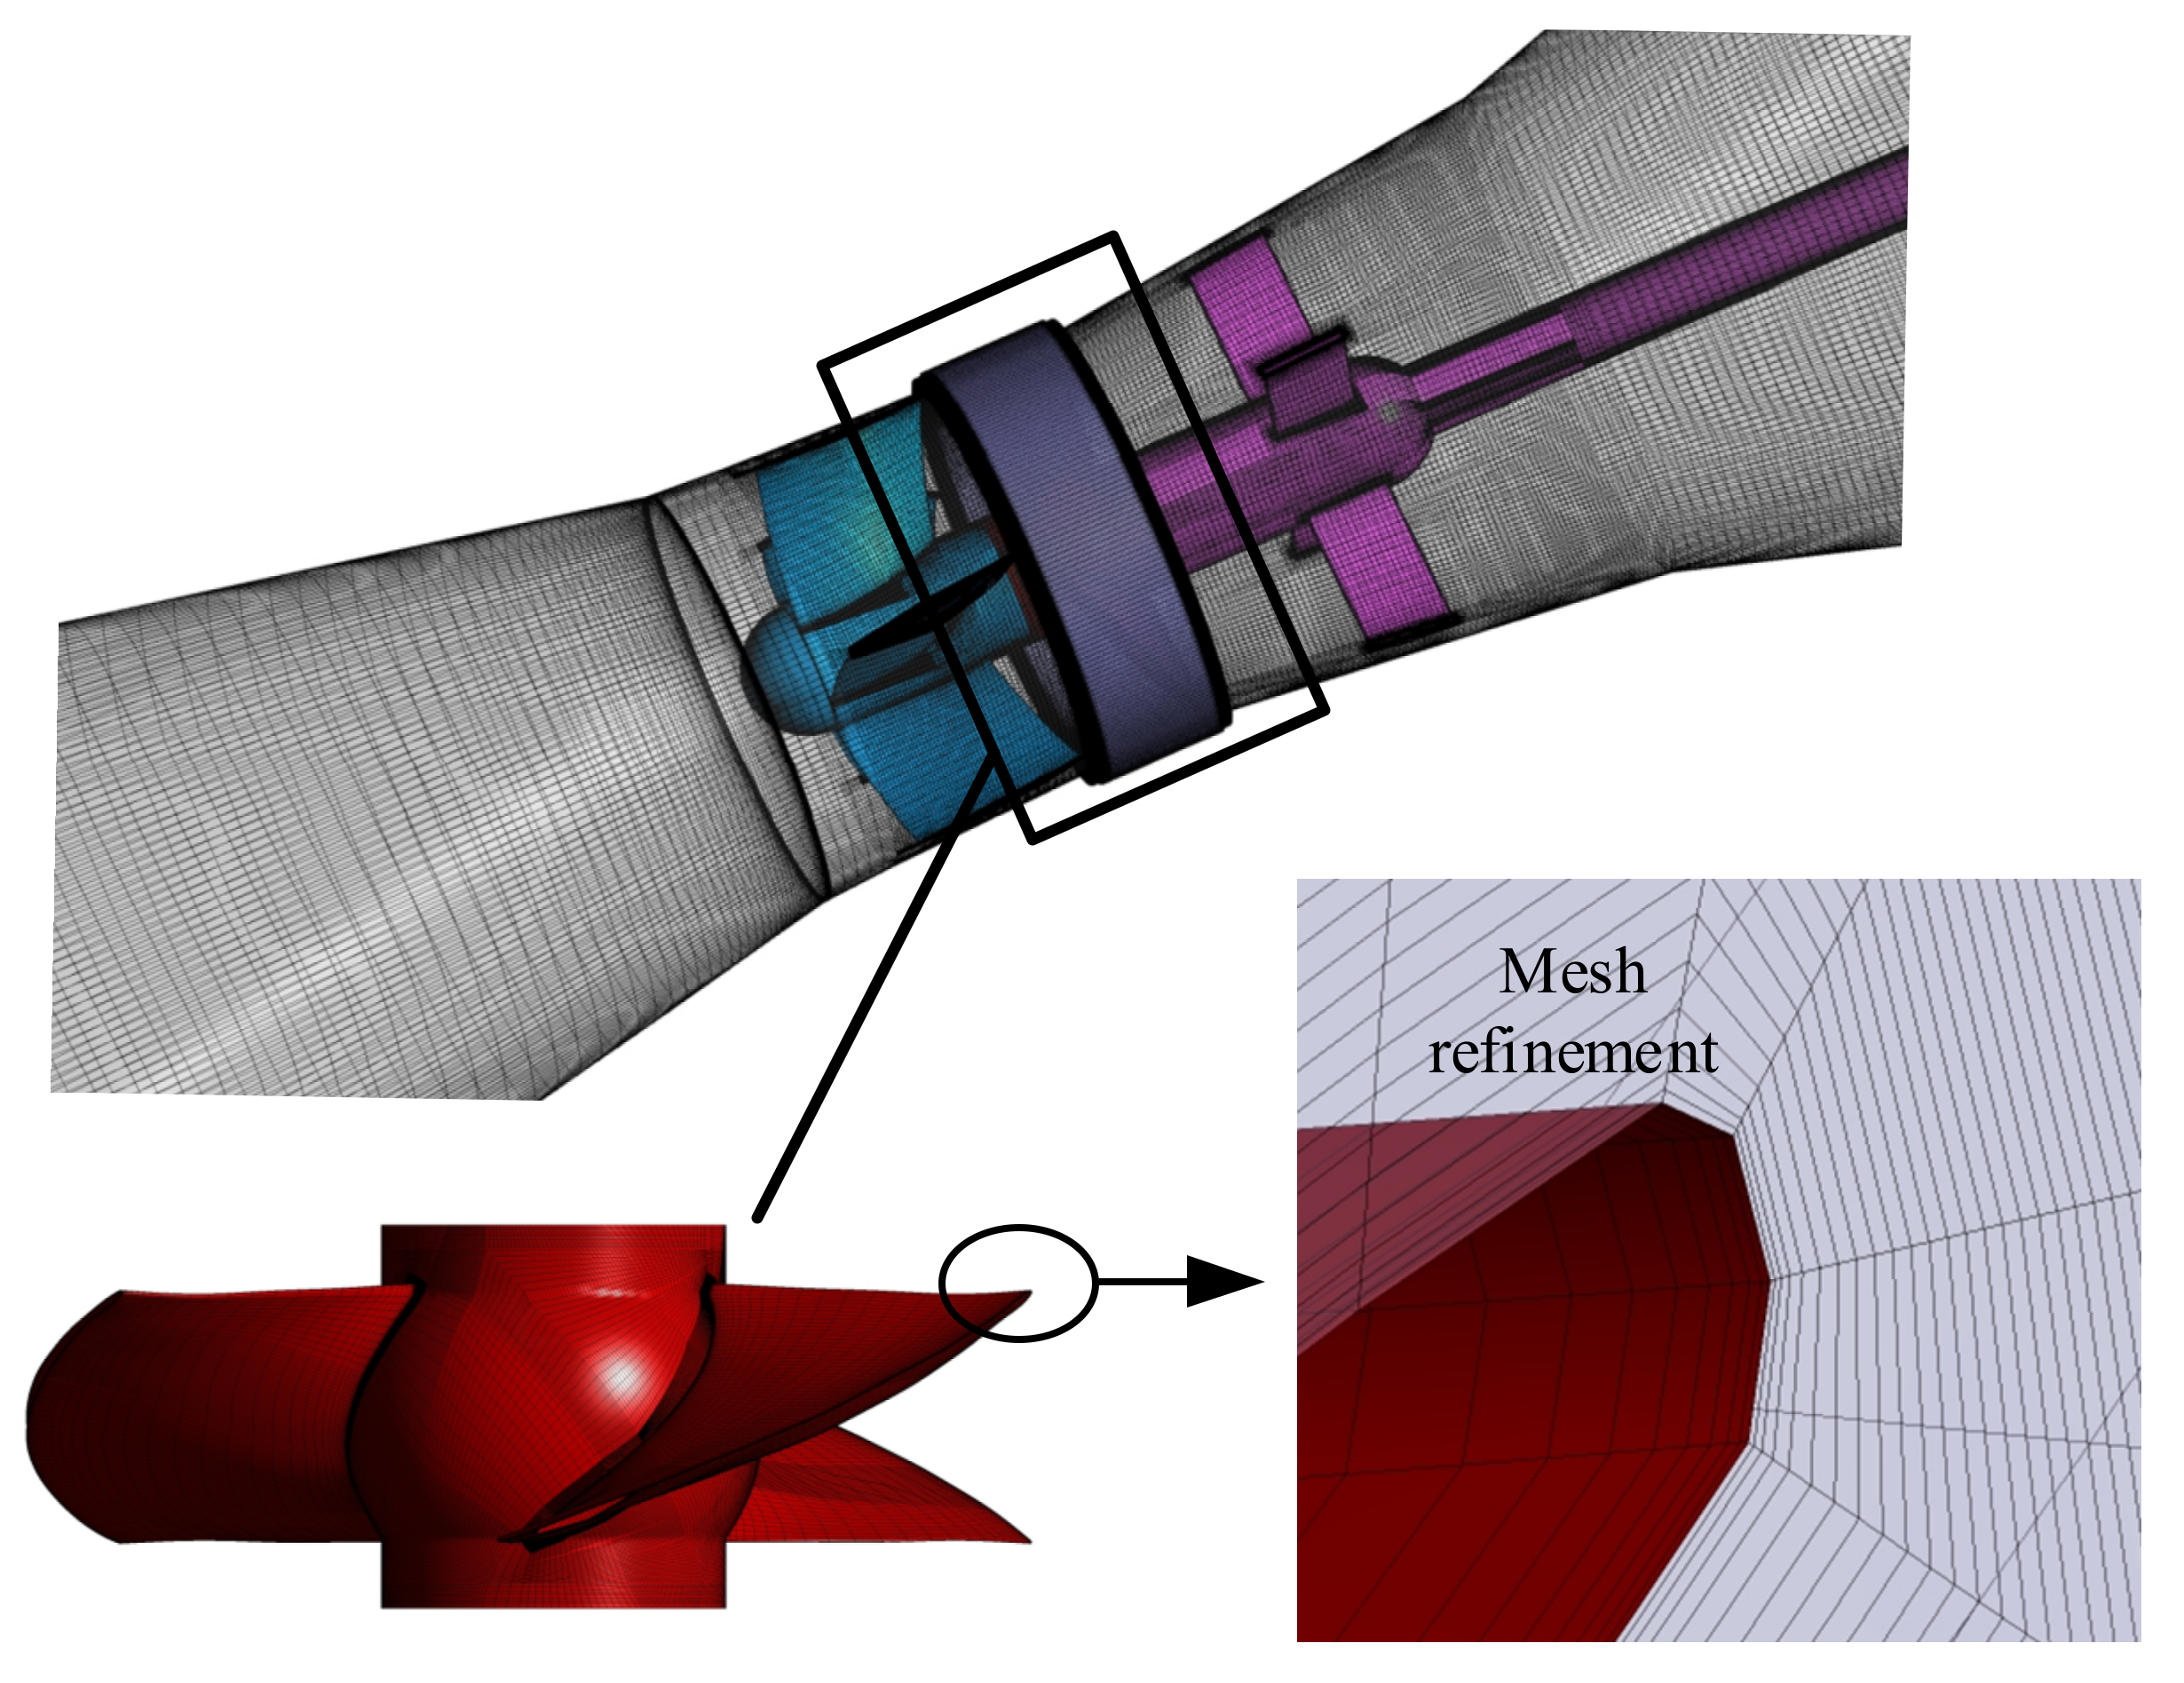
2.2. Mesh Generation

The influence of grid quality on the accuracy of numerical simulation is very significant, so the hexahedral grid was generated for the whole computational domain extracted from the 3D geometry model, as shown in Figure 2. The O-topology method and local mesh refinement were used for the impeller blade, front guide vane, and rear guide vane. Due to the high velocity and complex flow pattern in the backflow clearance, there were at least 20 grid nodes in the clearance to accurately capture the flow characteristics. Figure 3 shows the grid independence analysis of the full tubular pump device. The hydraulic efficiency of the full tubular pump device decreases with the increase of grid node. When the number of grid nodes exceeds 8.82 million, the calculation deviation is less than 0.82%. Therefore, the number of grid nodes in the inlet passage, front guide vane, impeller, motor rotor, post guide vane, and outlet passage were finally determined as 1,151,280, 1,157,940, 1,837,080, 1,699,840, 1,395,000, and 1,579,100 million, respectively.

2.3. Conservation Equations and Boundary Conditions

The CFD code of ANSYS CFX 19.2 was applied to simulate unsteady flow field in the full tubular pump device with four backflow clearances, and the governing equation is defined [23] as follows:
v ¯ j x j = 0
( ρ v ¯ i ) t + ( ρ v ¯ i v ¯ j ) x j = p ¯ x i + x j ( μ v ¯ i x j ρ v i v j ¯ ) + ρ f i
where v ¯ j and v ¯ i are the time-averaged velocity component in Cartesian coordinate of j and i direction (j, i = x, y, z); v j and v i are the velocity fluctuation components in Cartesian coordinate of j and i direction (j, i = x, y, z);t stands for time. μ represents dynamic viscosity. f i represents source item.
In this study, steady and transient simulation for full tubular pump device with four kinds of backflow clearances were carried out under five characteristic conditions (0.8Qdes, 0.9Qdes, 1.0Qdes, 1.1Qdes, 1.2Qdes). Due to the high accuracy of simulating the flow separation caused by adverse pressure gradients inside the pump, the k ω shear stress transport (SST) turbulence model [30] was used to enclose governing equation. The steady simulated results were taken as initial values for transient simulation. The condition of the inlet was set as “mass flow rate” and the values were determined according to the operating conditions. The condition of the outlet was set as “opening”, and the absolute outlet pressure was 1 atm. Smooth and no-slip wall condition were used for all wall surfaces. In the steady simulation, the interface between the rotor and stator was set as “stage” and the interface between stators was set as “none”. In the transient simulation, the interface between the rotor and stator was set as “transient rotor stator”, and the convergence criterion was selected as 5 × 10⁻⁵. The time step was 0.00045977 s which corresponded to the impeller rotation of 3° at each time interval. The total time was 0.551724 s, which is equivalent to 10 revolutions of the impeller.

2.4. Entropy Production Theory

Entropy is a parameter that represents the state of an object. During pump operation, mechanical energy dissipation occurs in the flow field due to fluid viscosity and Reynolds stress, and the lost mechanical energy is converted into internal energy, which leads to an increase in entropy. Thus, local entropy production can effectively characterize the spatial distribution of mechanical energy losses and provide a better physical understanding about loss evaluation. The entropy transport equation is defined as follows [31]:
ρ ( S t + v 1 S x + v 2 S y + v 3 S z ) = d i v ( q T ) + Φ T + Φ θ T 2
where S is specific entropy. T represents absolute temperature. v 1 , v 2 and v 3 are velocity components in the Cartesian coordinate direction: x, y, z. d i v ( q T ) is the reversible heat transfer term. Φ θ T 2 and Φ T are entropy produced by heat transfer and dissipation, respectively.
Since the governing equation is URANS, entropy transport equation should be time-averaged as follows [18,19]:
ρ ( S ¯ t + v 1 ¯ S ¯ x + v 2 ¯ S ¯ y + v 3 ¯ S ¯ z ) = d i v ( q T ) ¯ ρ ( v 1 S ¯ x + v 2 S ¯ y + v 3 S ¯ z ) + Φ T ¯ + Φ θ T 2 ¯
where v 1 ¯ , v 2 ¯ , and v 3 ¯ are time-averaged velocity components. v 1 , v 2 , and v 3 are velocity fluctuation components. S ¯ and S represent time-average specific entropy and specific entropy fluctuation. T ¯ is time-average absolute temperature.
In this study, the working medium inside the pump was set as constant temperature and incompressible flow fluid [27,28,29]. Therefore, the time-averaged entropy production in the pump only results from Φ T ¯ which can be calculated as follows [18,19]:
Φ T ¯ = Φ D ¯ T ¯ + Φ D T ¯
where Φ D ¯ and Φ D are direct dissipation rate and indirect dissipation rate.
In order to calculate the local entropy production in CFD post-processing, Equations (6) and (7) are defined as follows [18,19]:
Φ D ¯ T ¯ = μ T ¯ 2 × v 1 ¯ x 2 + v 2 ¯ y 2 + v 3 ¯ z 2 + v 1 ¯ y + v 2 ¯ x 2 + v 3 ¯ x + v 1 ¯ z 2 + v 2 ¯ z + v 3 ¯ y 2
Φ D T ¯ = ρ ε T ¯
where ε stands for dissipation rate of turbulent kinetic energy.
The power dissipation P PRO , D ¯ and P PRO , D due to direct dissipation rate and indirect dissipation rate can be obtained by volume integration of Φ D ¯ and Φ D , respectively [18,19]:
P PRO , D ¯ = V Φ D ¯ d V
P PRO , D = V Φ D d V
To summarize, the total dissipation rate Φ T and total power dissipation P total can be calculated as follows:
Φ T = Φ D ¯ + Φ D
P total = P PRO , D ¯ + P PRO , D

2.5. Validation of Numerical Simulation

Figure 4 shows the test bench of full tubular pump device. The operating flow rate and pump head were measured by an LDG-500 electromagnetic flowmeter (Shanghai Zhanghua Instrument Co., Ltd) and JC-E110A-EMS4A-92DA differential pressure transmitter (Xi’an Instrument Factory), respectively. The rotation speed and torque of shaft were measured by JN338 torque meter (Beijing Sanjing Technology Group). The measurement uncertainty of flow rate, head, rotation speed and torque were 0.24%, 0.1%, 0.1%, and 0.1%, respectively. Figure 5 shows the comparison of pump performance between experimental data and calculated results under Rb = 2 mm. According to the engineering requirements, the design flow rate was determined as 0.2726 m3/s, and external characteristic parameters at five characteristic flow points (0.8Qdes, 0.9Qdes, 1.0Qdes, 1.1Qdes, 1.2Qdes) were obtained by transient calculation. As shown in the figure, the external characteristic curve of calculated results is similar to that of the experiment. The calculated head and efficiency are higher than the experimental results under large flow rate but lower under small flow rate. At the design flow rate, the relative error between the calculated head and experimental head is 3.19%, and the relative error between the calculated efficiency and the experimental efficiency is 1.14%, which proves that the calculated results is reliable.

3. Analysis of Calculation Results

3.1. Comparison of Pump Performance

Figure 6 shows the external characteristic parameters of the full tubular pump with different Rb. H decreases with the increase of Rb under all flow rates, which shows that the internal backflow and the work capacity of the impeller are intensified and decreased, respectively, due to the increase of Rb. Compared to H under Rb = 0 mm (without motor rotor), H under Rb = 2 mm decreased by 10.9%, 7.2%, and 13% at 0.8Qdes, 1.0Qdes, and 1.2Qdes, respectively. As shown in Figure 6b, because the motor rotor requires additional mechanical energy for rotation, P s under Rb = 0 mm is obviously lower than P s under Rb = 0.5/1/2 mm. In the interval of Rb = 0.5~2 mm, P s decreases with the increase of Rb under all flow rates. Figure 6c shows that η under Rb = 0 mm is significantly higher than η under Rb = 0.5/1/2 mm. Compared to η under Rb = 0 mm, η under Rb = 2 mm decreased by 8.4%, 9.5%, and 18.8% at 0.8Qdes, 1.0Qdes, and 1.2Qdes, respectively. In the interval of Rb = 0.5~2 mm, because both H and P s decrease with increased Rb, η remain stable with the increase of Rb under 0.8Qdes and 1.0Qdes. At 1.2Qdes, however, the head decreases greatly with the increase of Rb, and hence η gradually decrease with the increase of Rb.

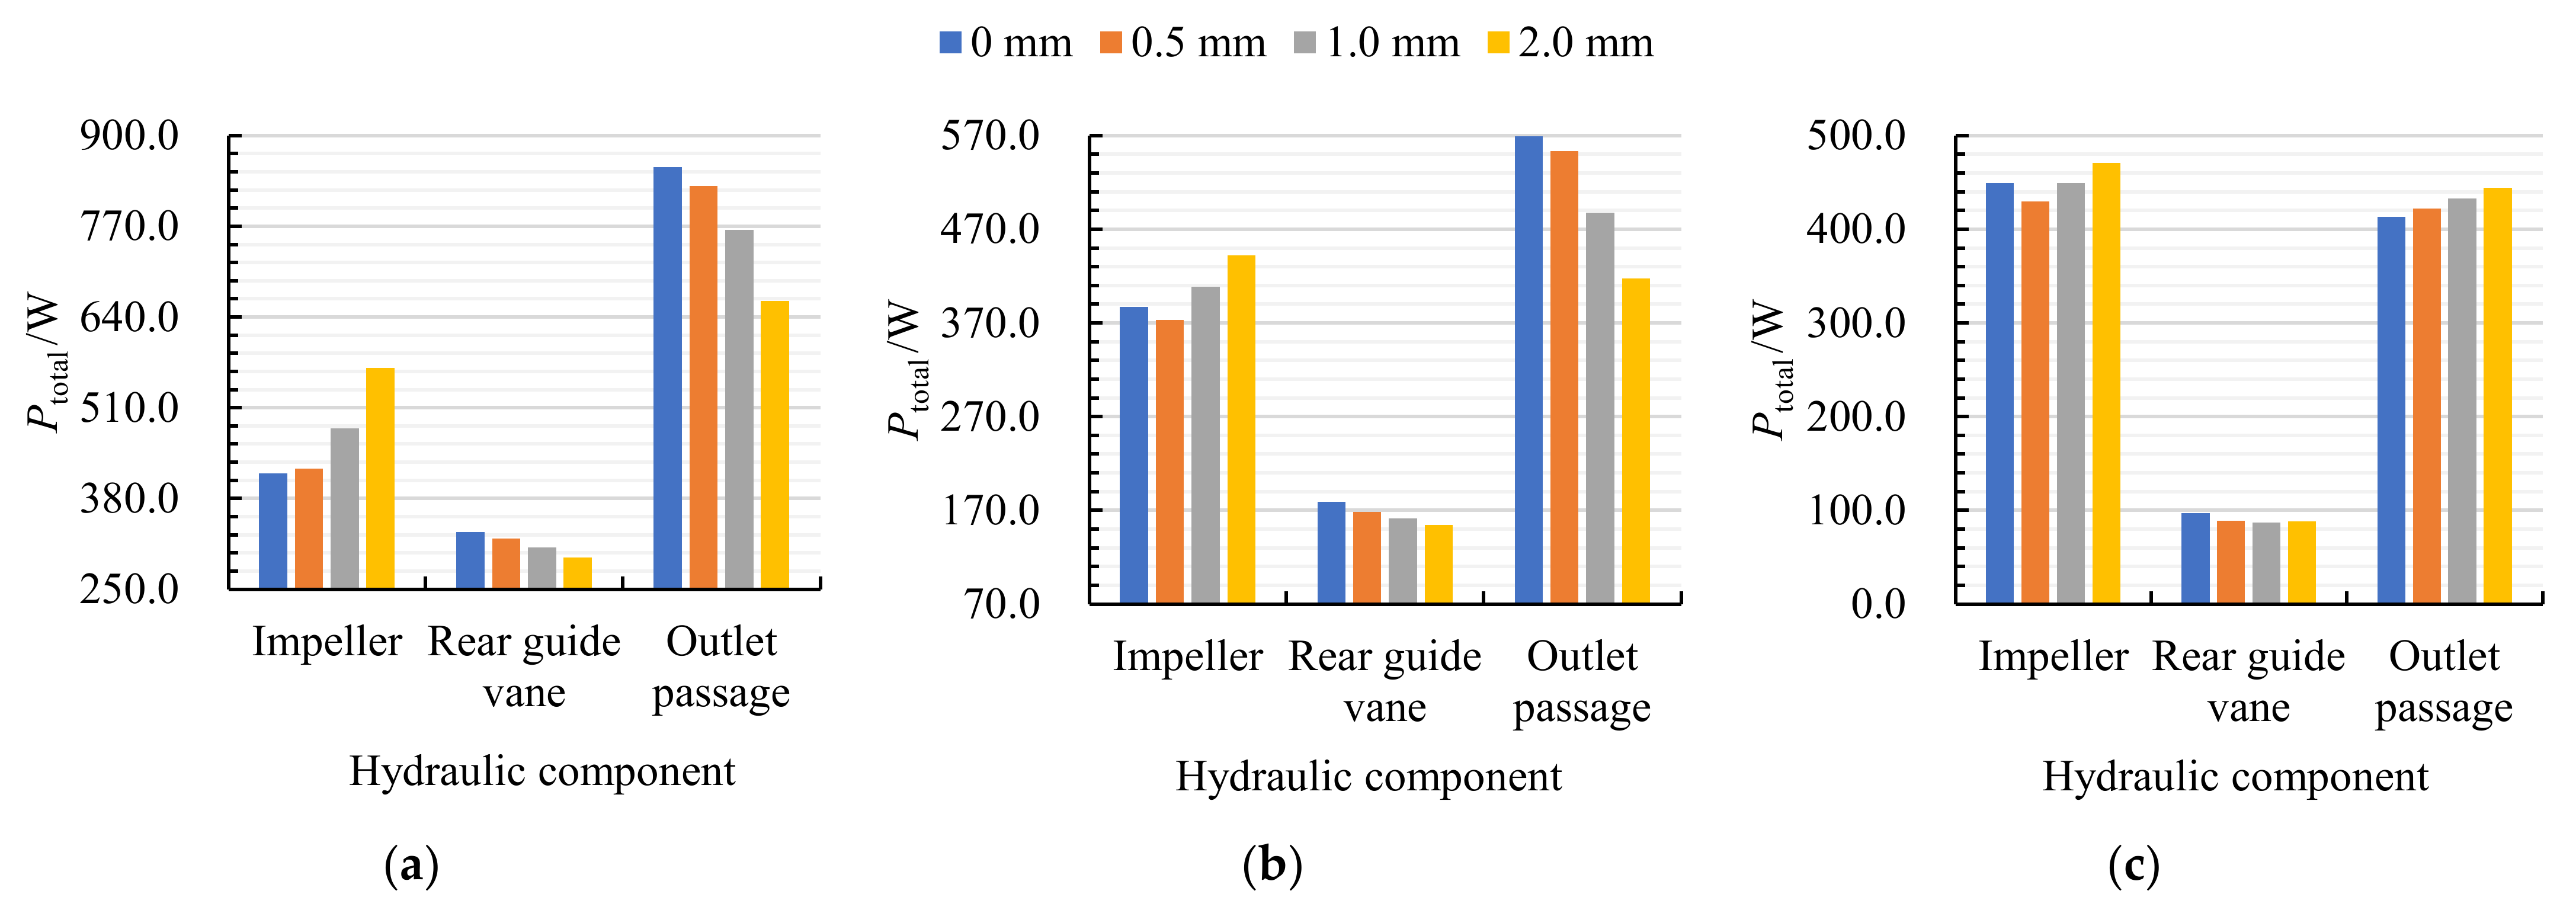
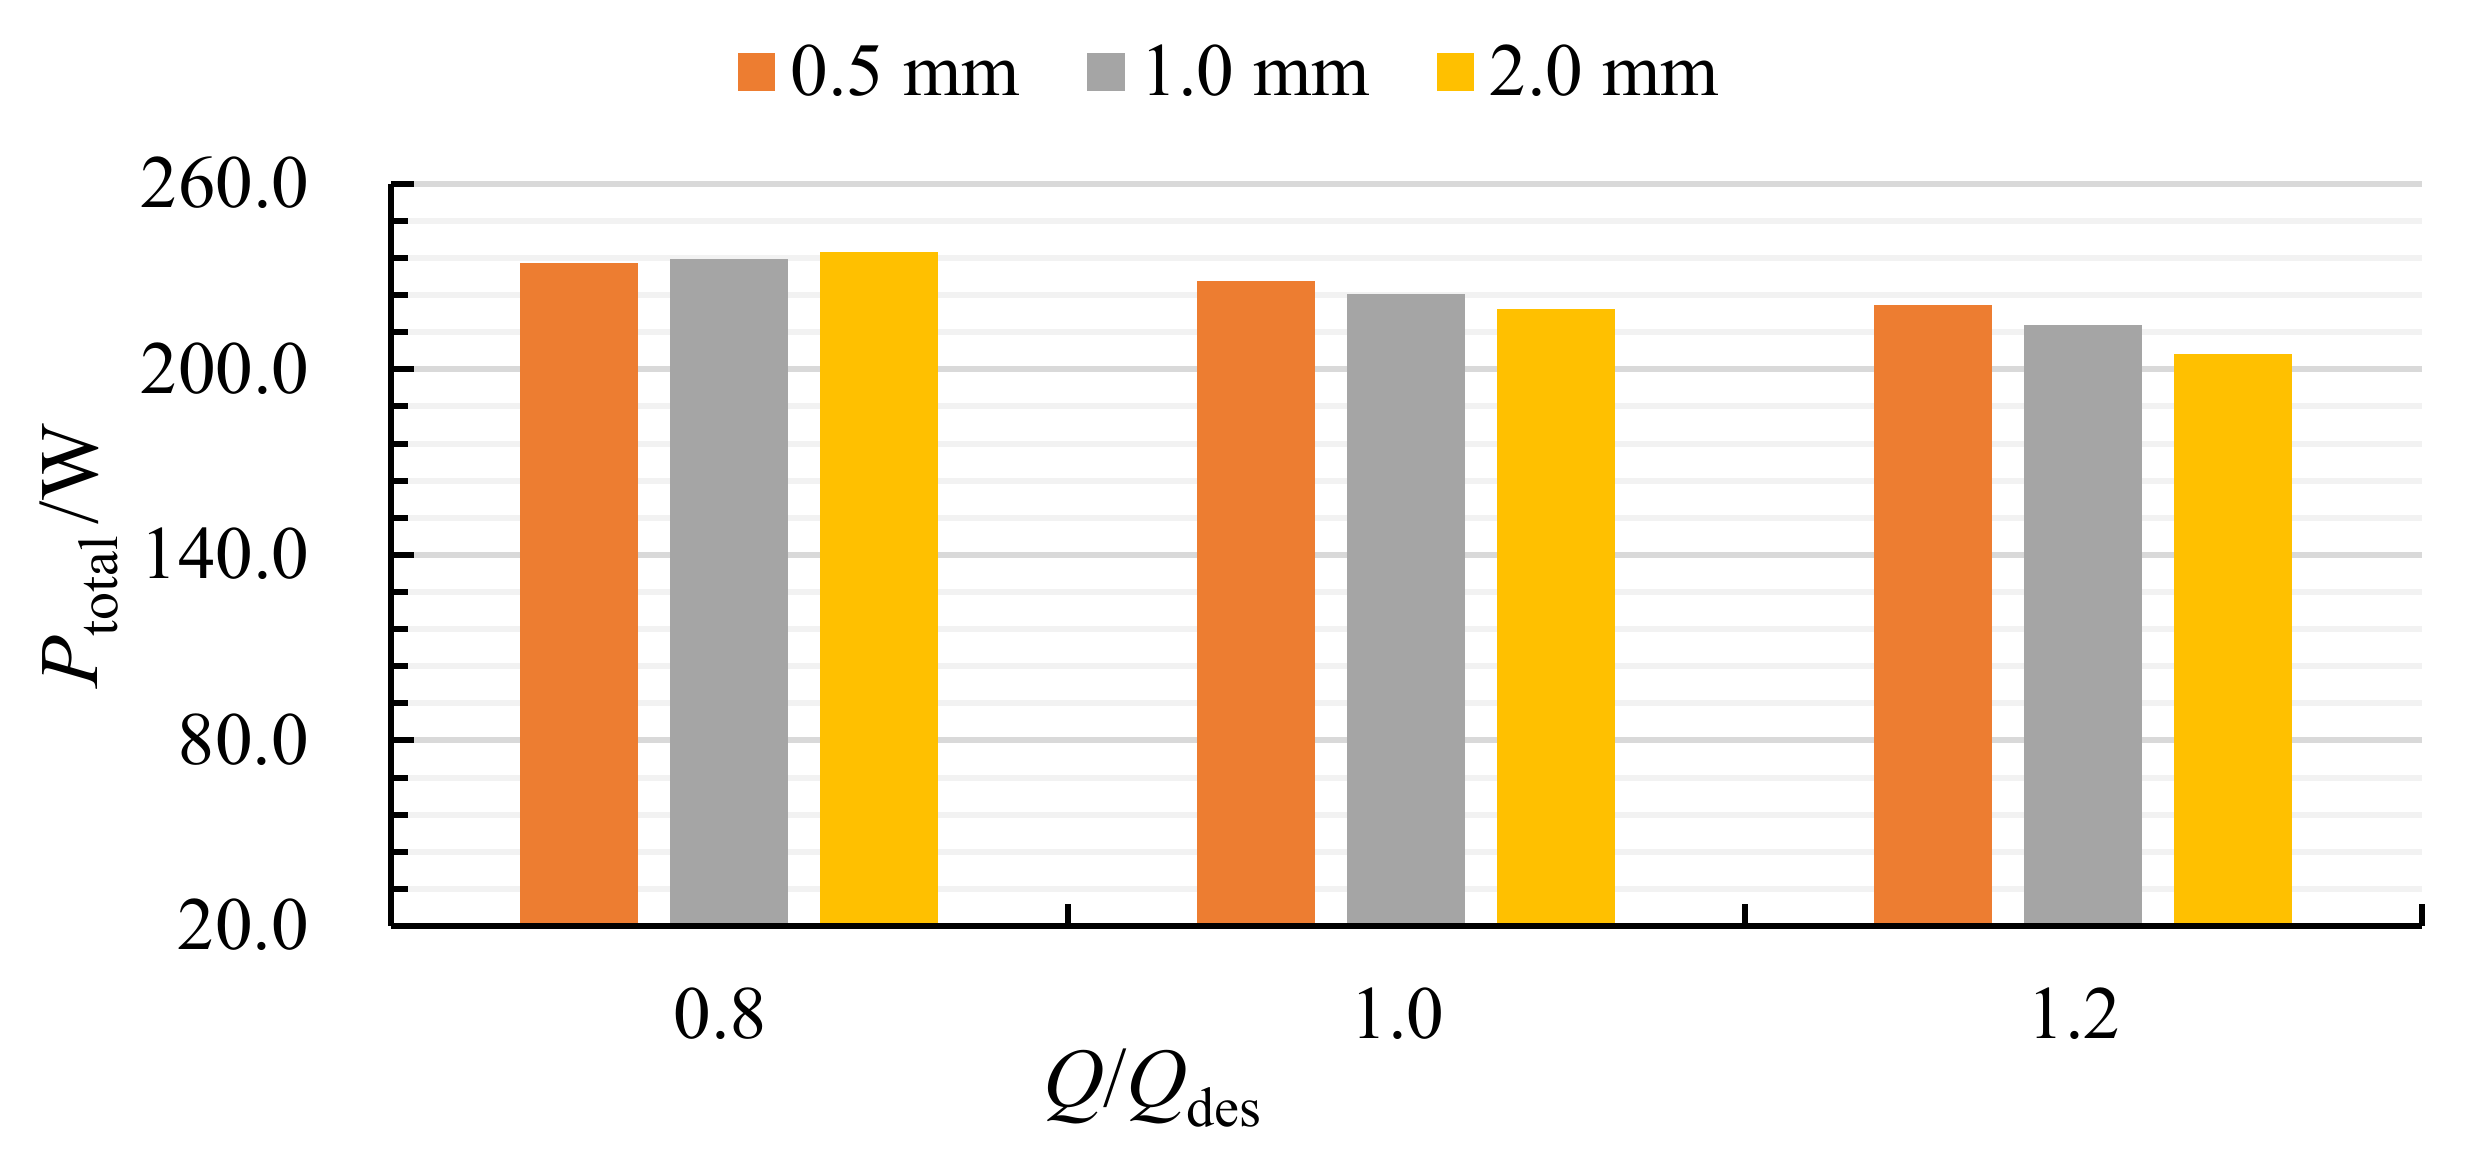
3.2. Comparison of Total Dissipation under Different Backflow Clearances

In order to study the extent to which hydraulic performance degradation is caused by backflow clearance, the distribution of Ptotal for each hydraulic component was calculated under different flow rates (Rb = 2 mm) as shown in Figure 7. Since the Ptotal of the inlet passage and front guide vane is so small, the hydraulic performance of the full tubular pump is mainly determined by Ptotal of the impeller, backflow clearance, rear guide vane, and outlet passage. The Ptotal of backflow clearance and rear guide vane decrease with the increase of flow rate. But the Ptotal of the impeller and outlet passage fluctuate with the increase of flow rate, and the valley value of the impeller and outlet passage can be found in 1.0Qdes and 1.1Qdes, respectively.
Figure 8 shows the Ptotal of the impeller, rear guide vane and outlet passage under different backflow clearance radii. The Ptotal of the rear guide vane decreases with the increase of Rb and the maximum declines are 11.1%, 13.6% and 9.2% under 0.8Qdes, 1.0Qdes, and 1.2Qdes, respectively. The Ptotal of the outlet passage also decreases with the increase of Rb under 0.8Qdes and 1.0Qdes, and the maximum declines are 22.4% and 26.6%, respectively. However, the Ptotal of the outlet passage increases with the increase of Rb, and the maximum increase is 7.4%. In addition, the Ptotal of the impeller increases with the increase of Rb under 0.8Qdes, and the maximum rise is 36.3%. However, the Ptotal of the impeller decreases first and then rises with the increase of Rb under 1.0Qdes and 1.2Qdes. Figure 9 shows the Ptotal of different backflow clearance under three flow rates. The Ptotal of backflow clearance almost remains stable with the increase of Rb under 0.8Qdes. However, the Ptotal of backflow clearance decreases with the increase of Rb under 1.0Qdes and 1.2Qdes, and the maximum decreases are 3.9% and 7.2%.

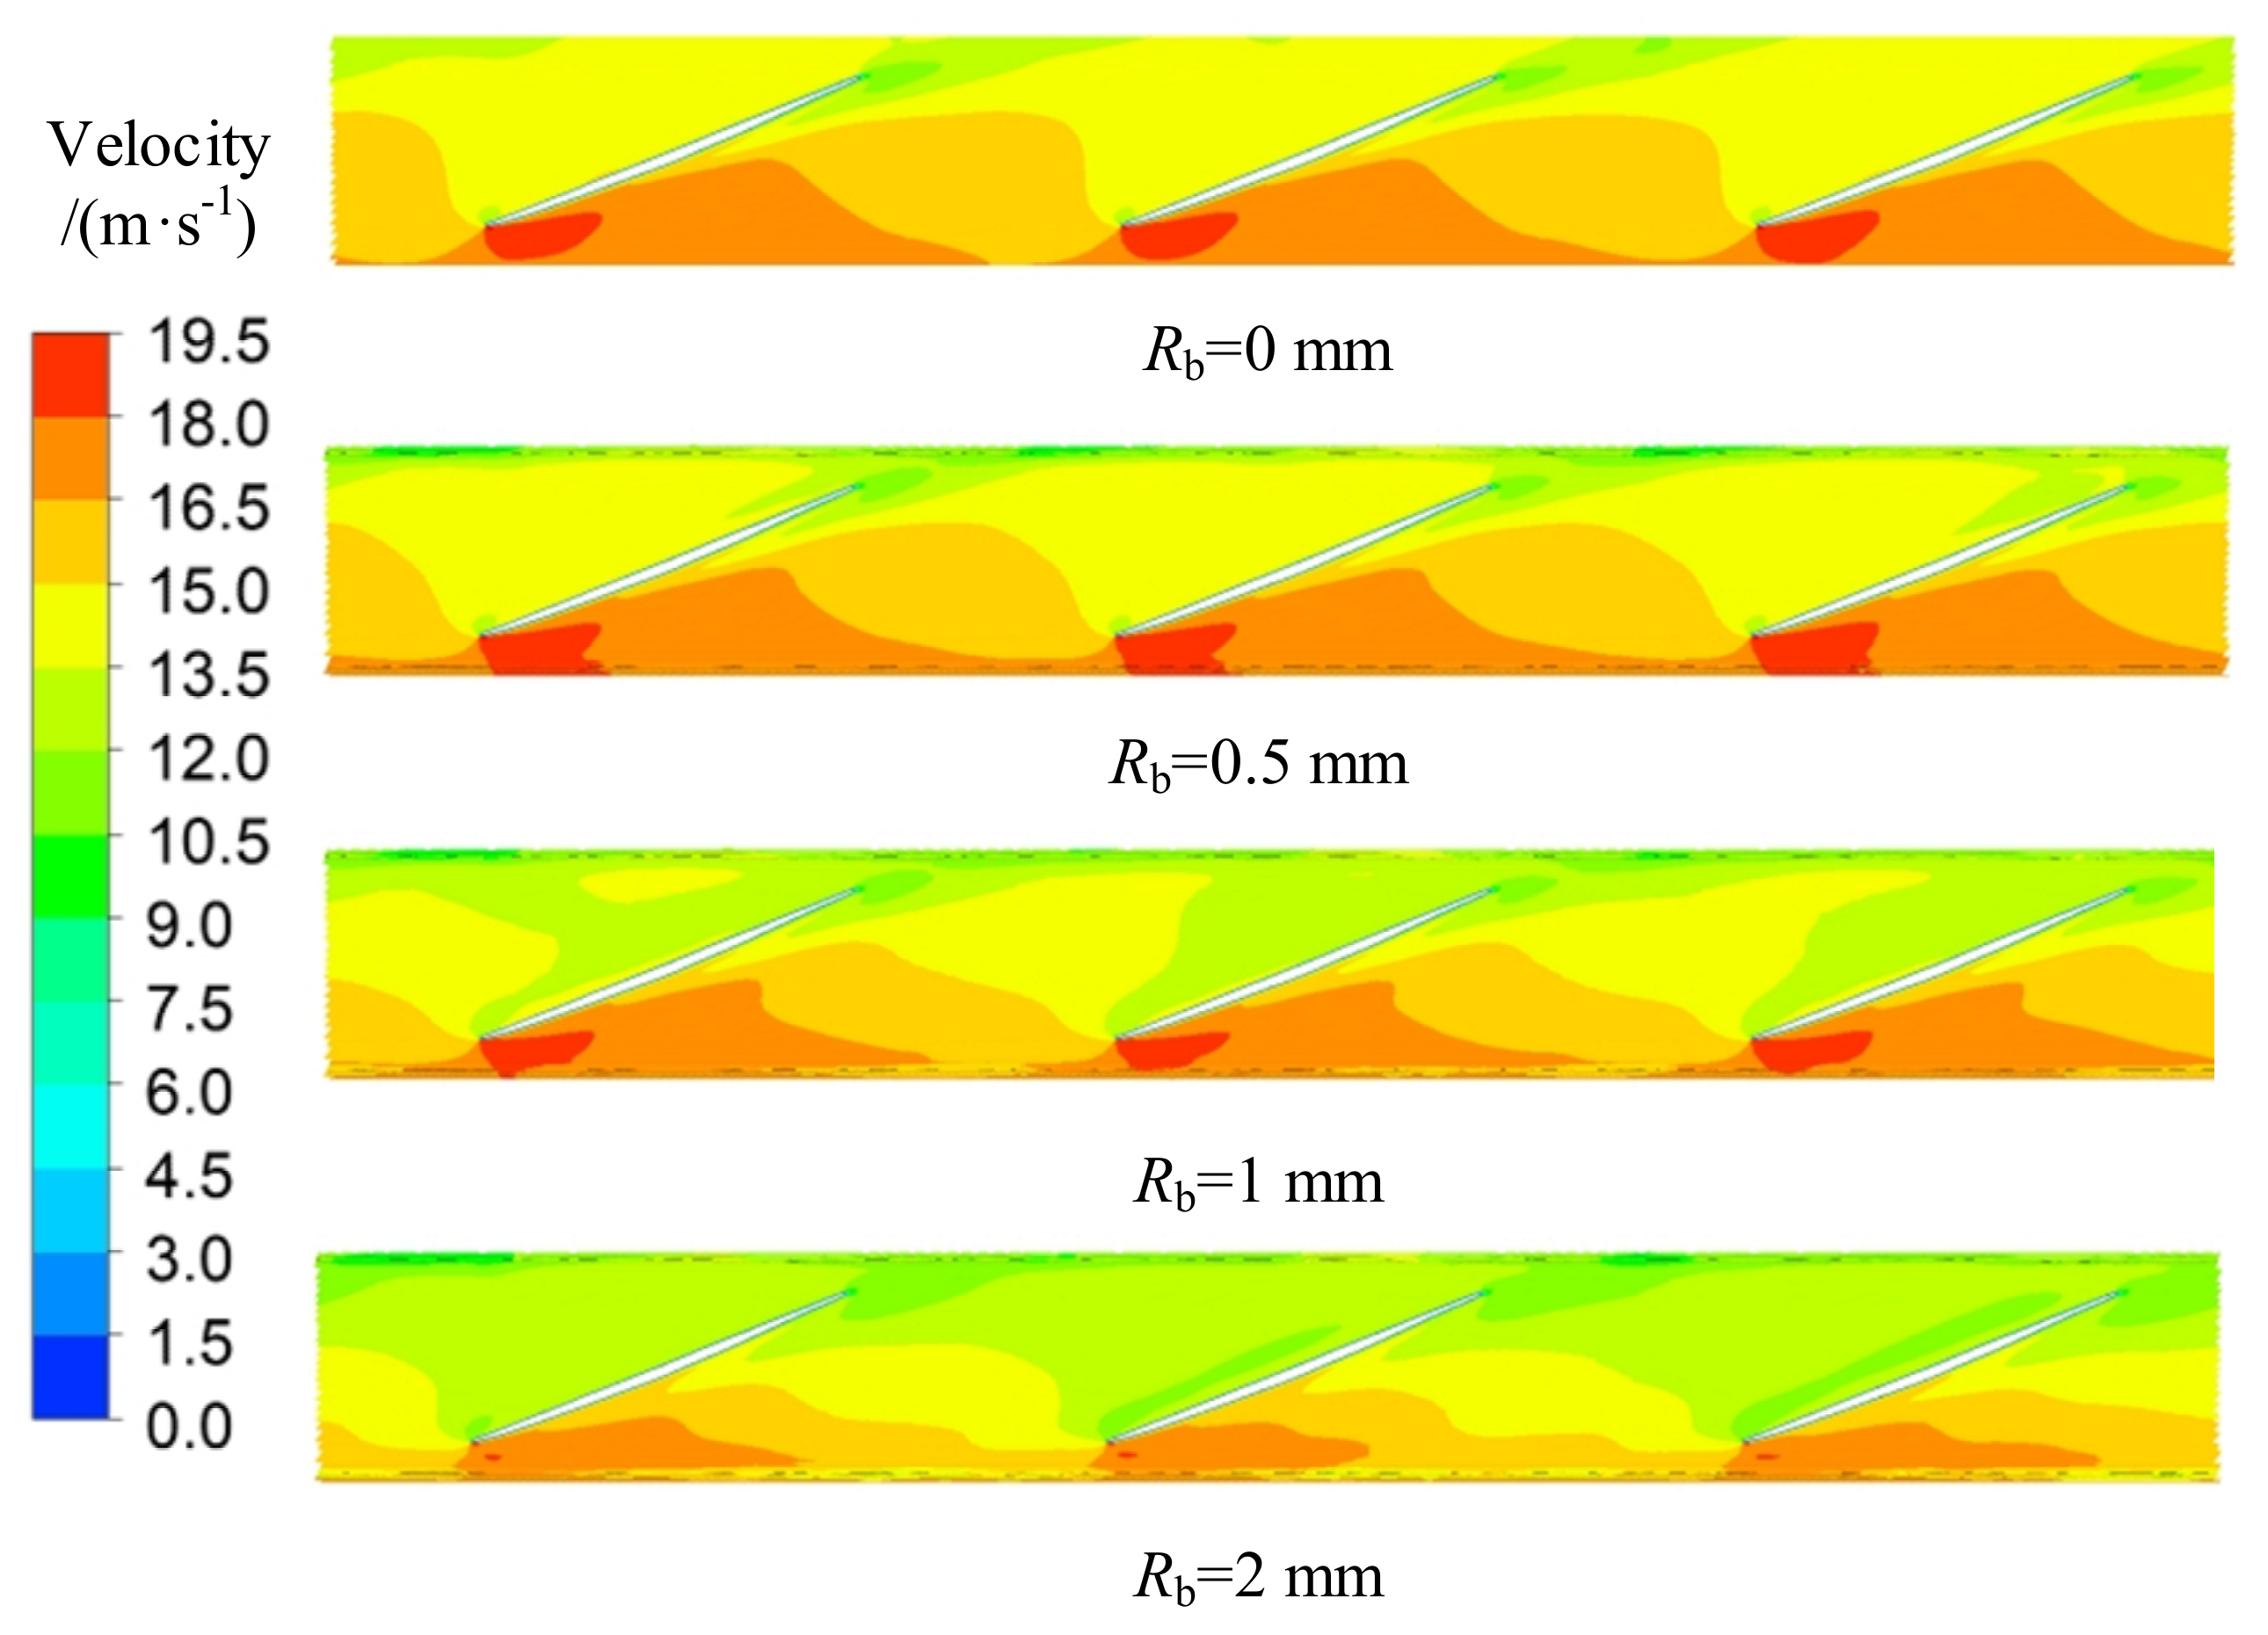
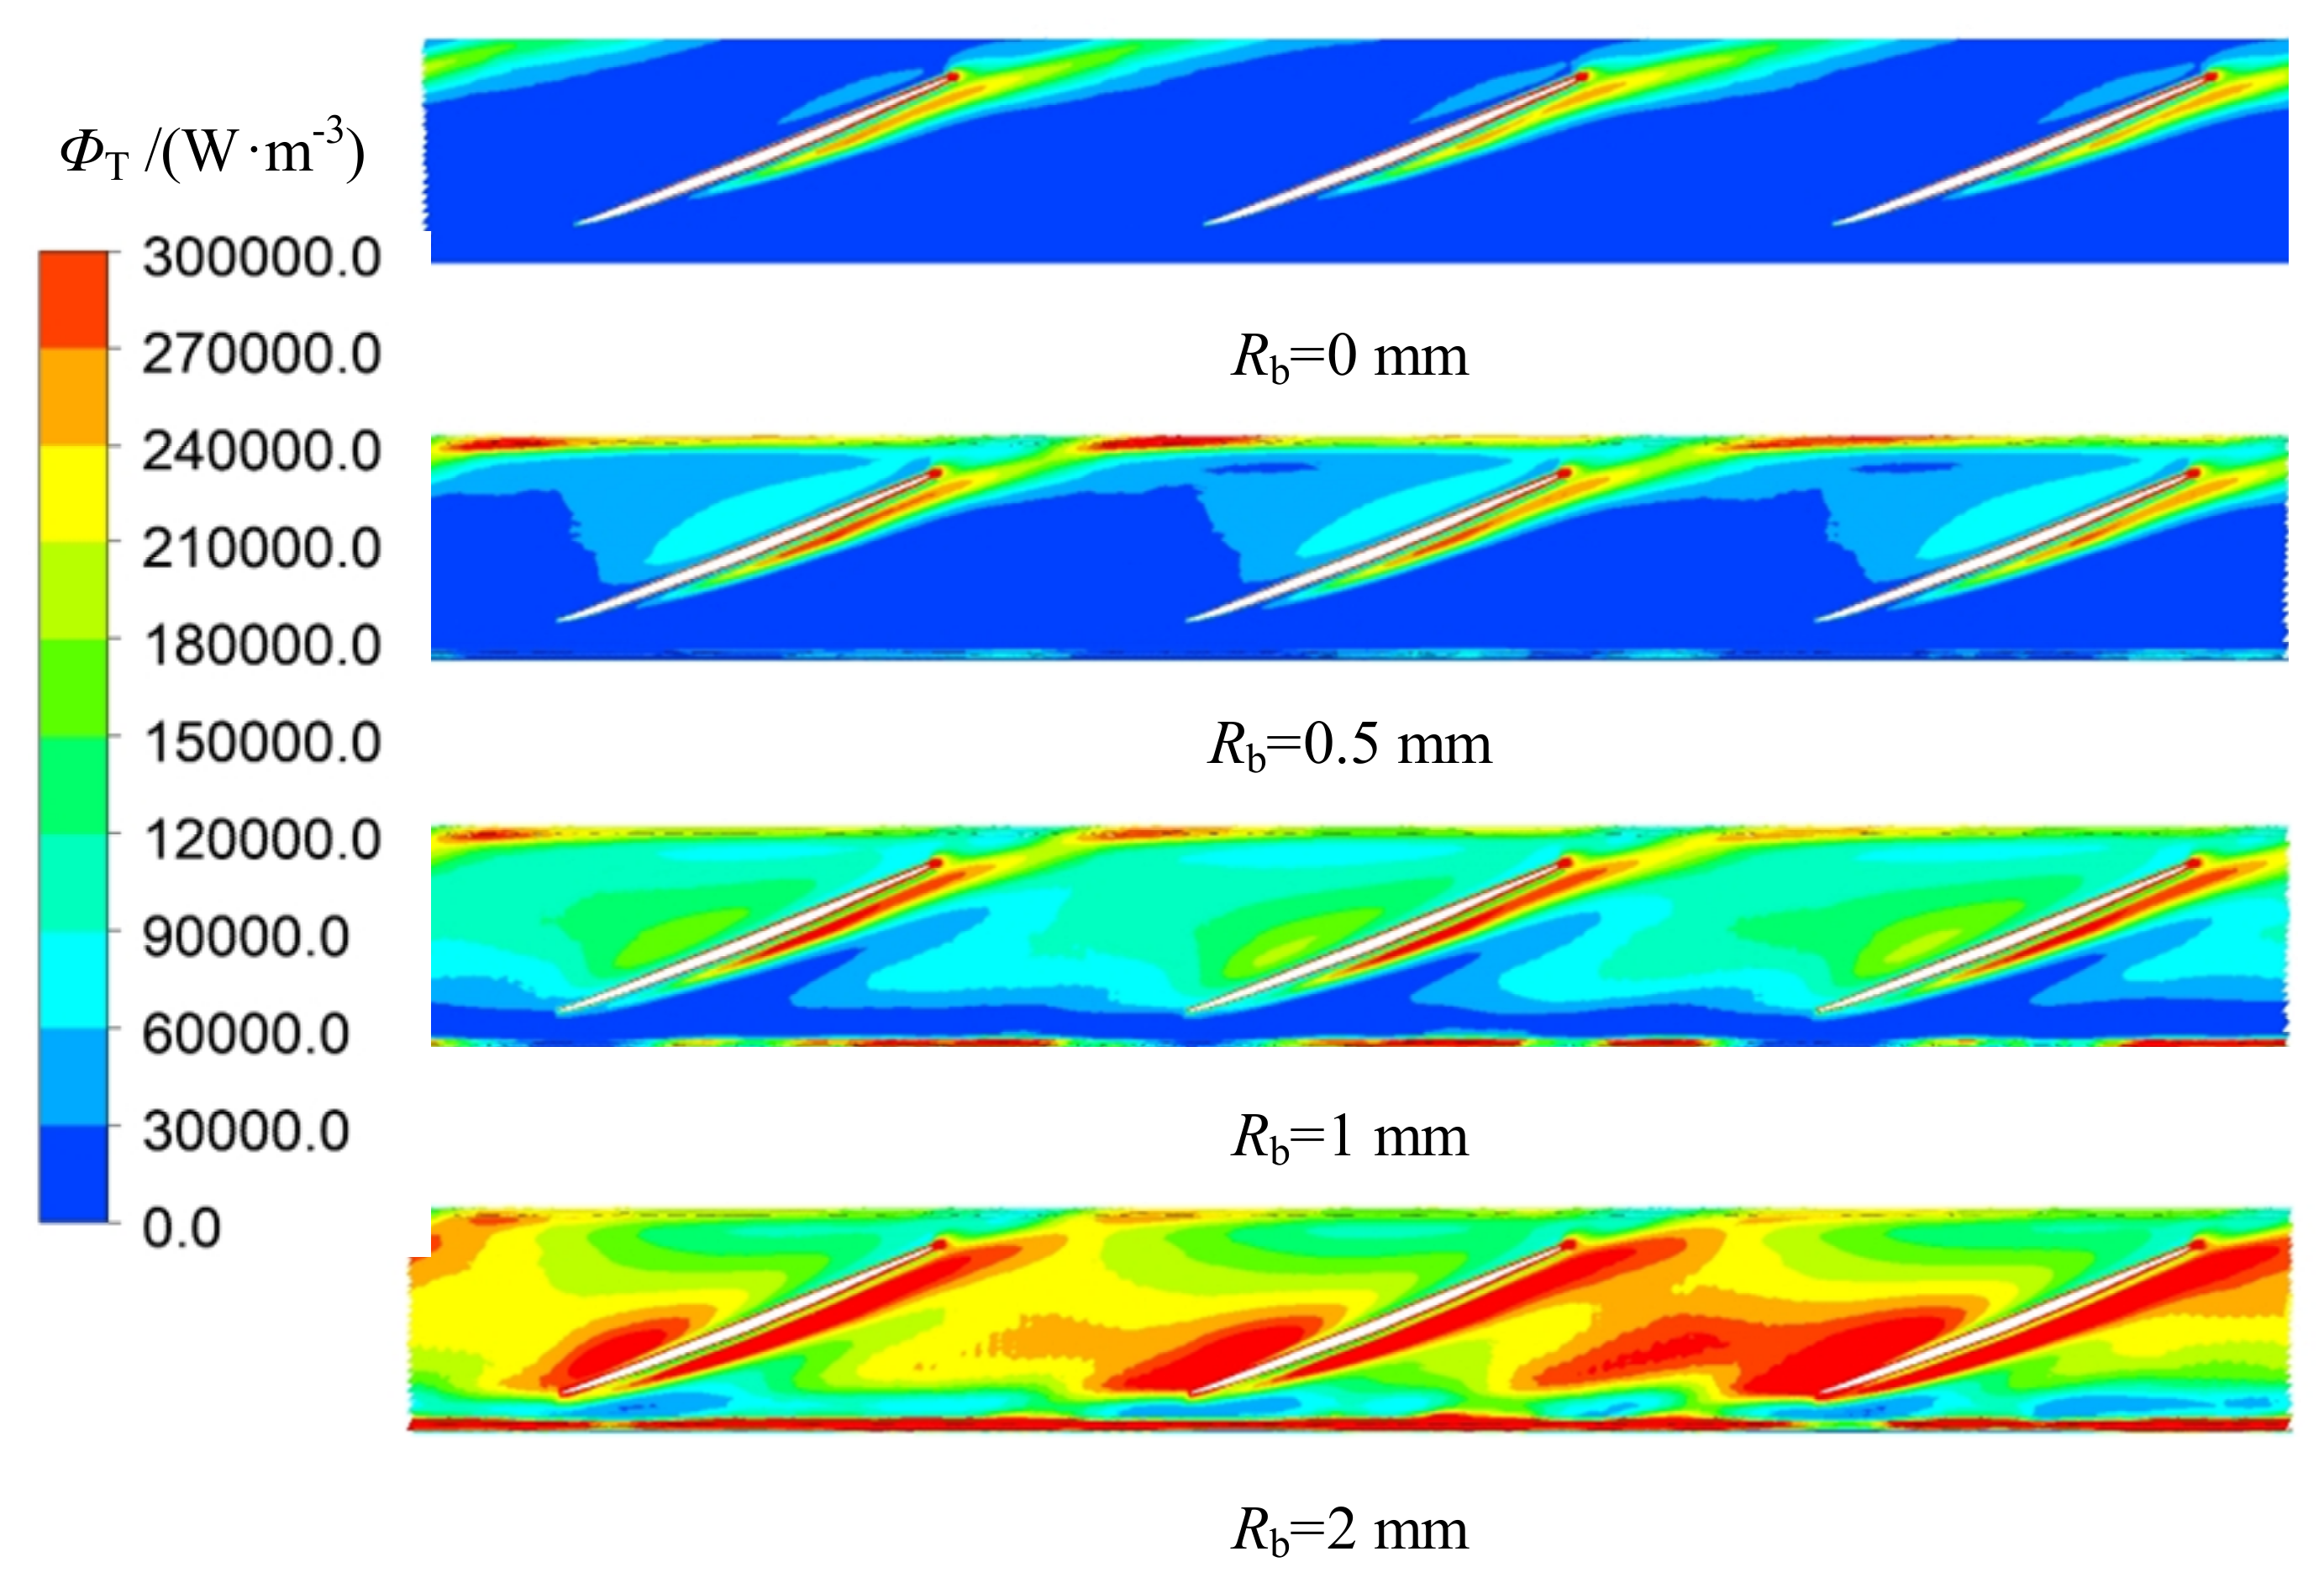
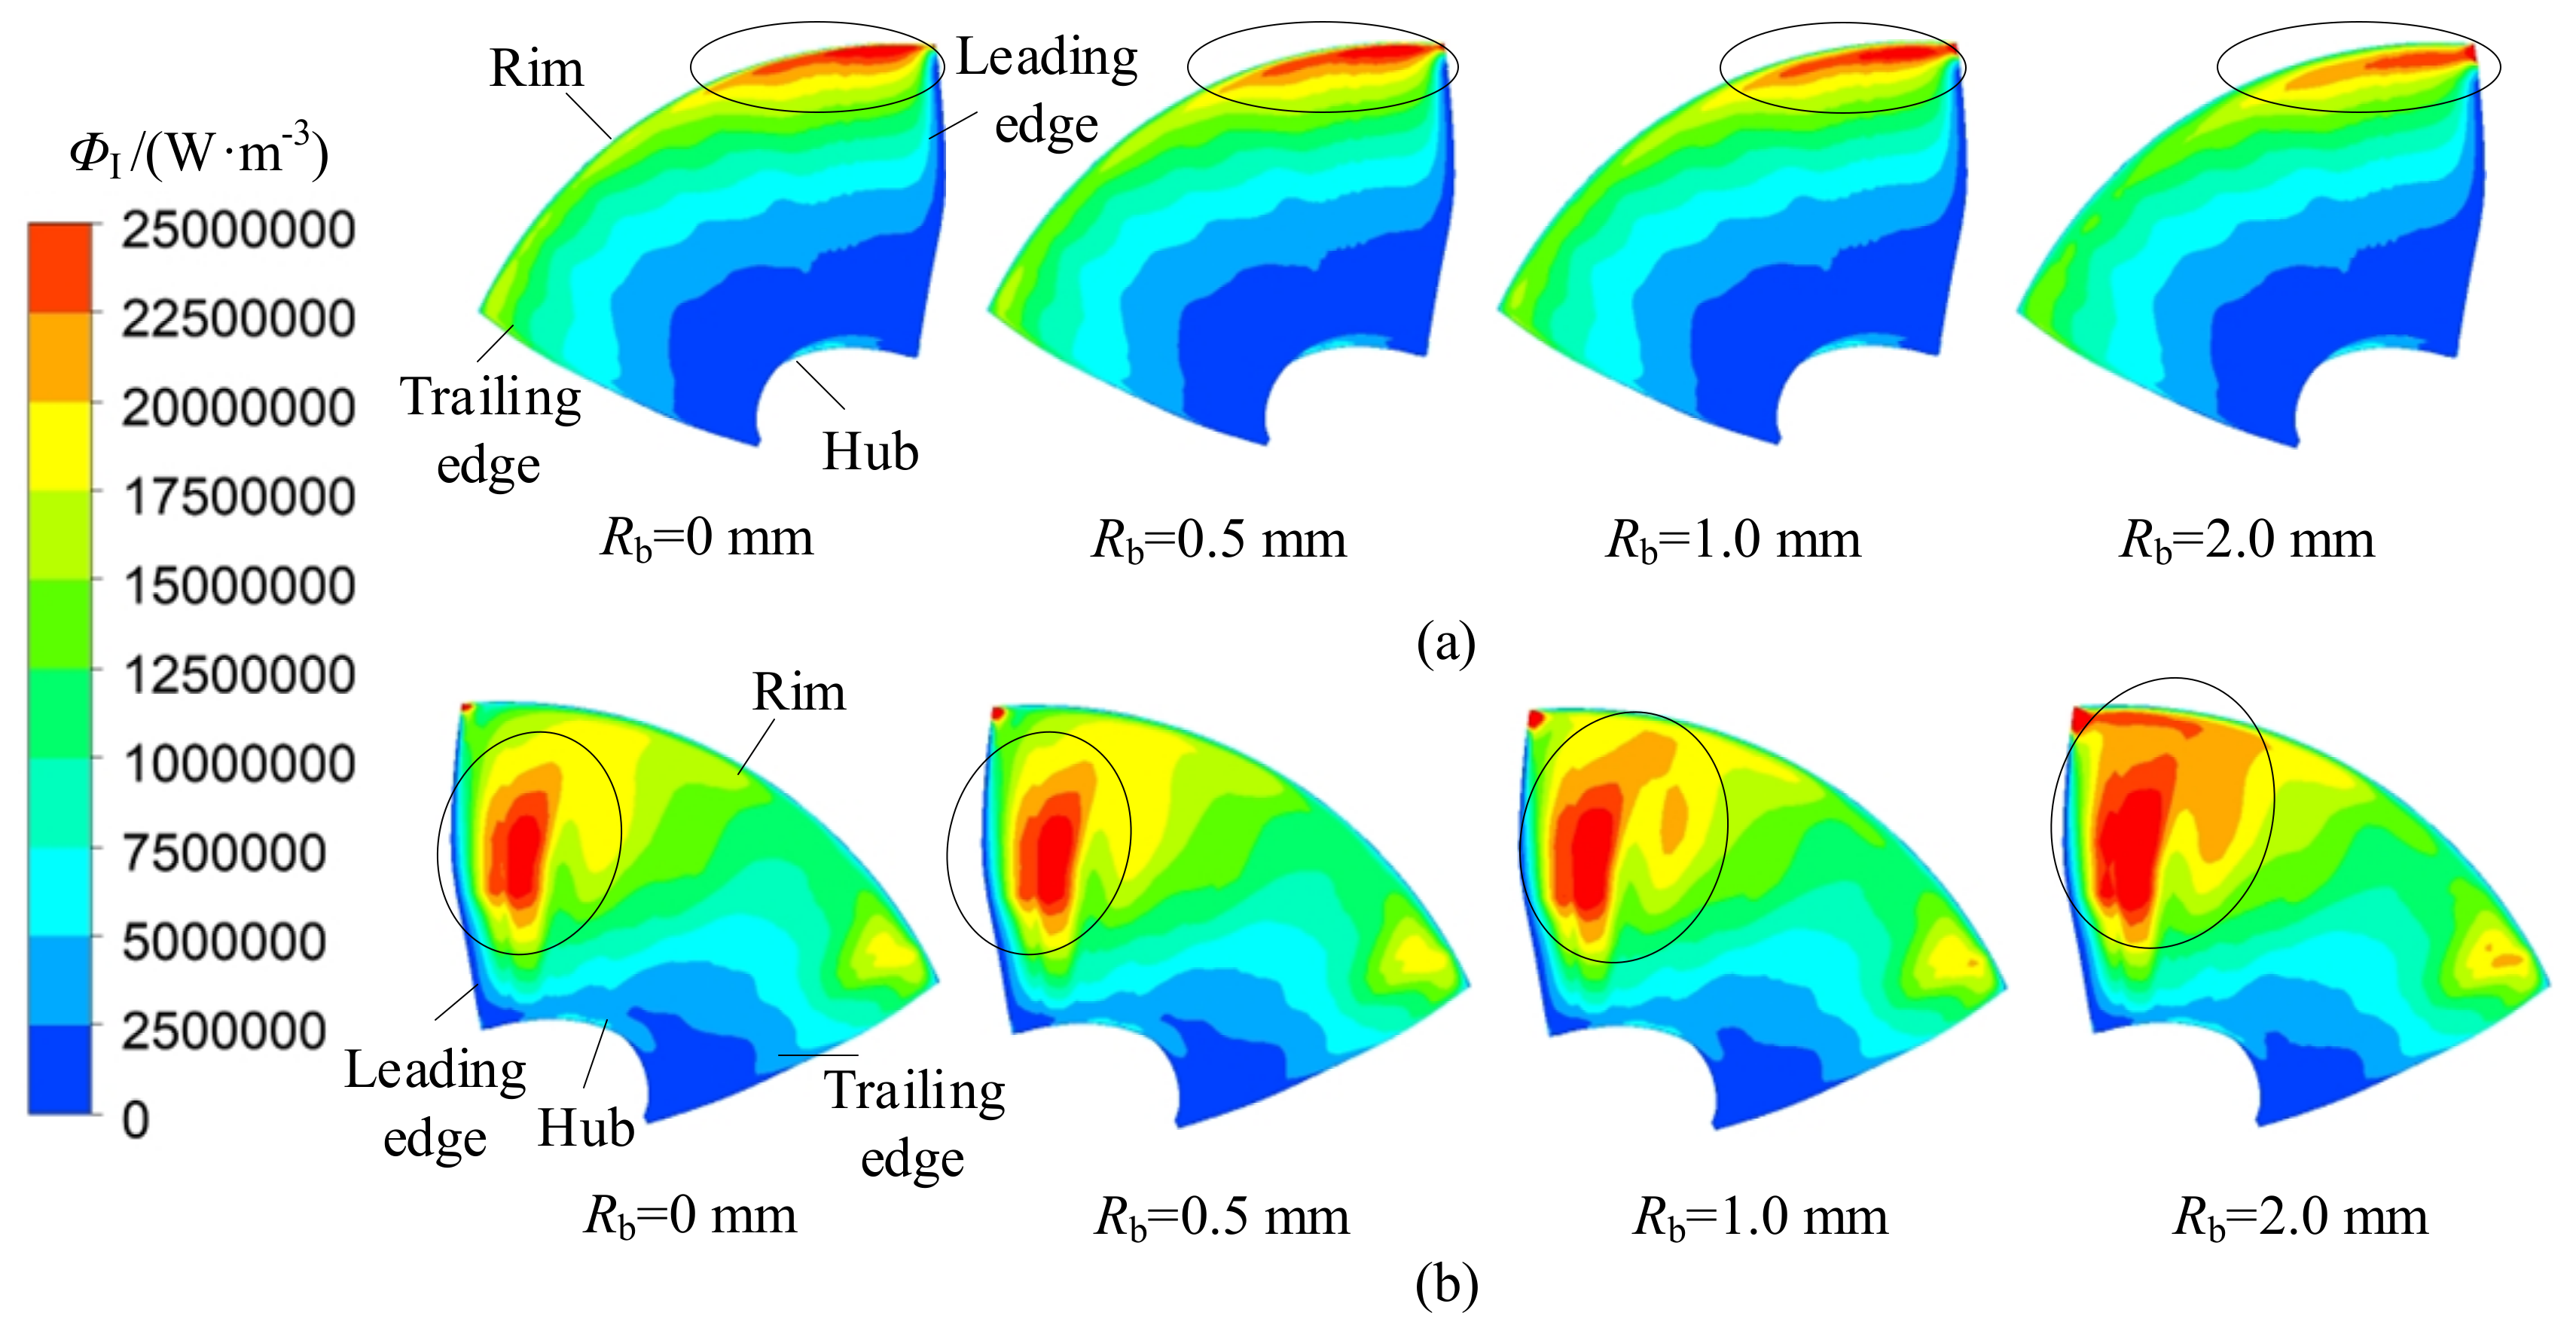
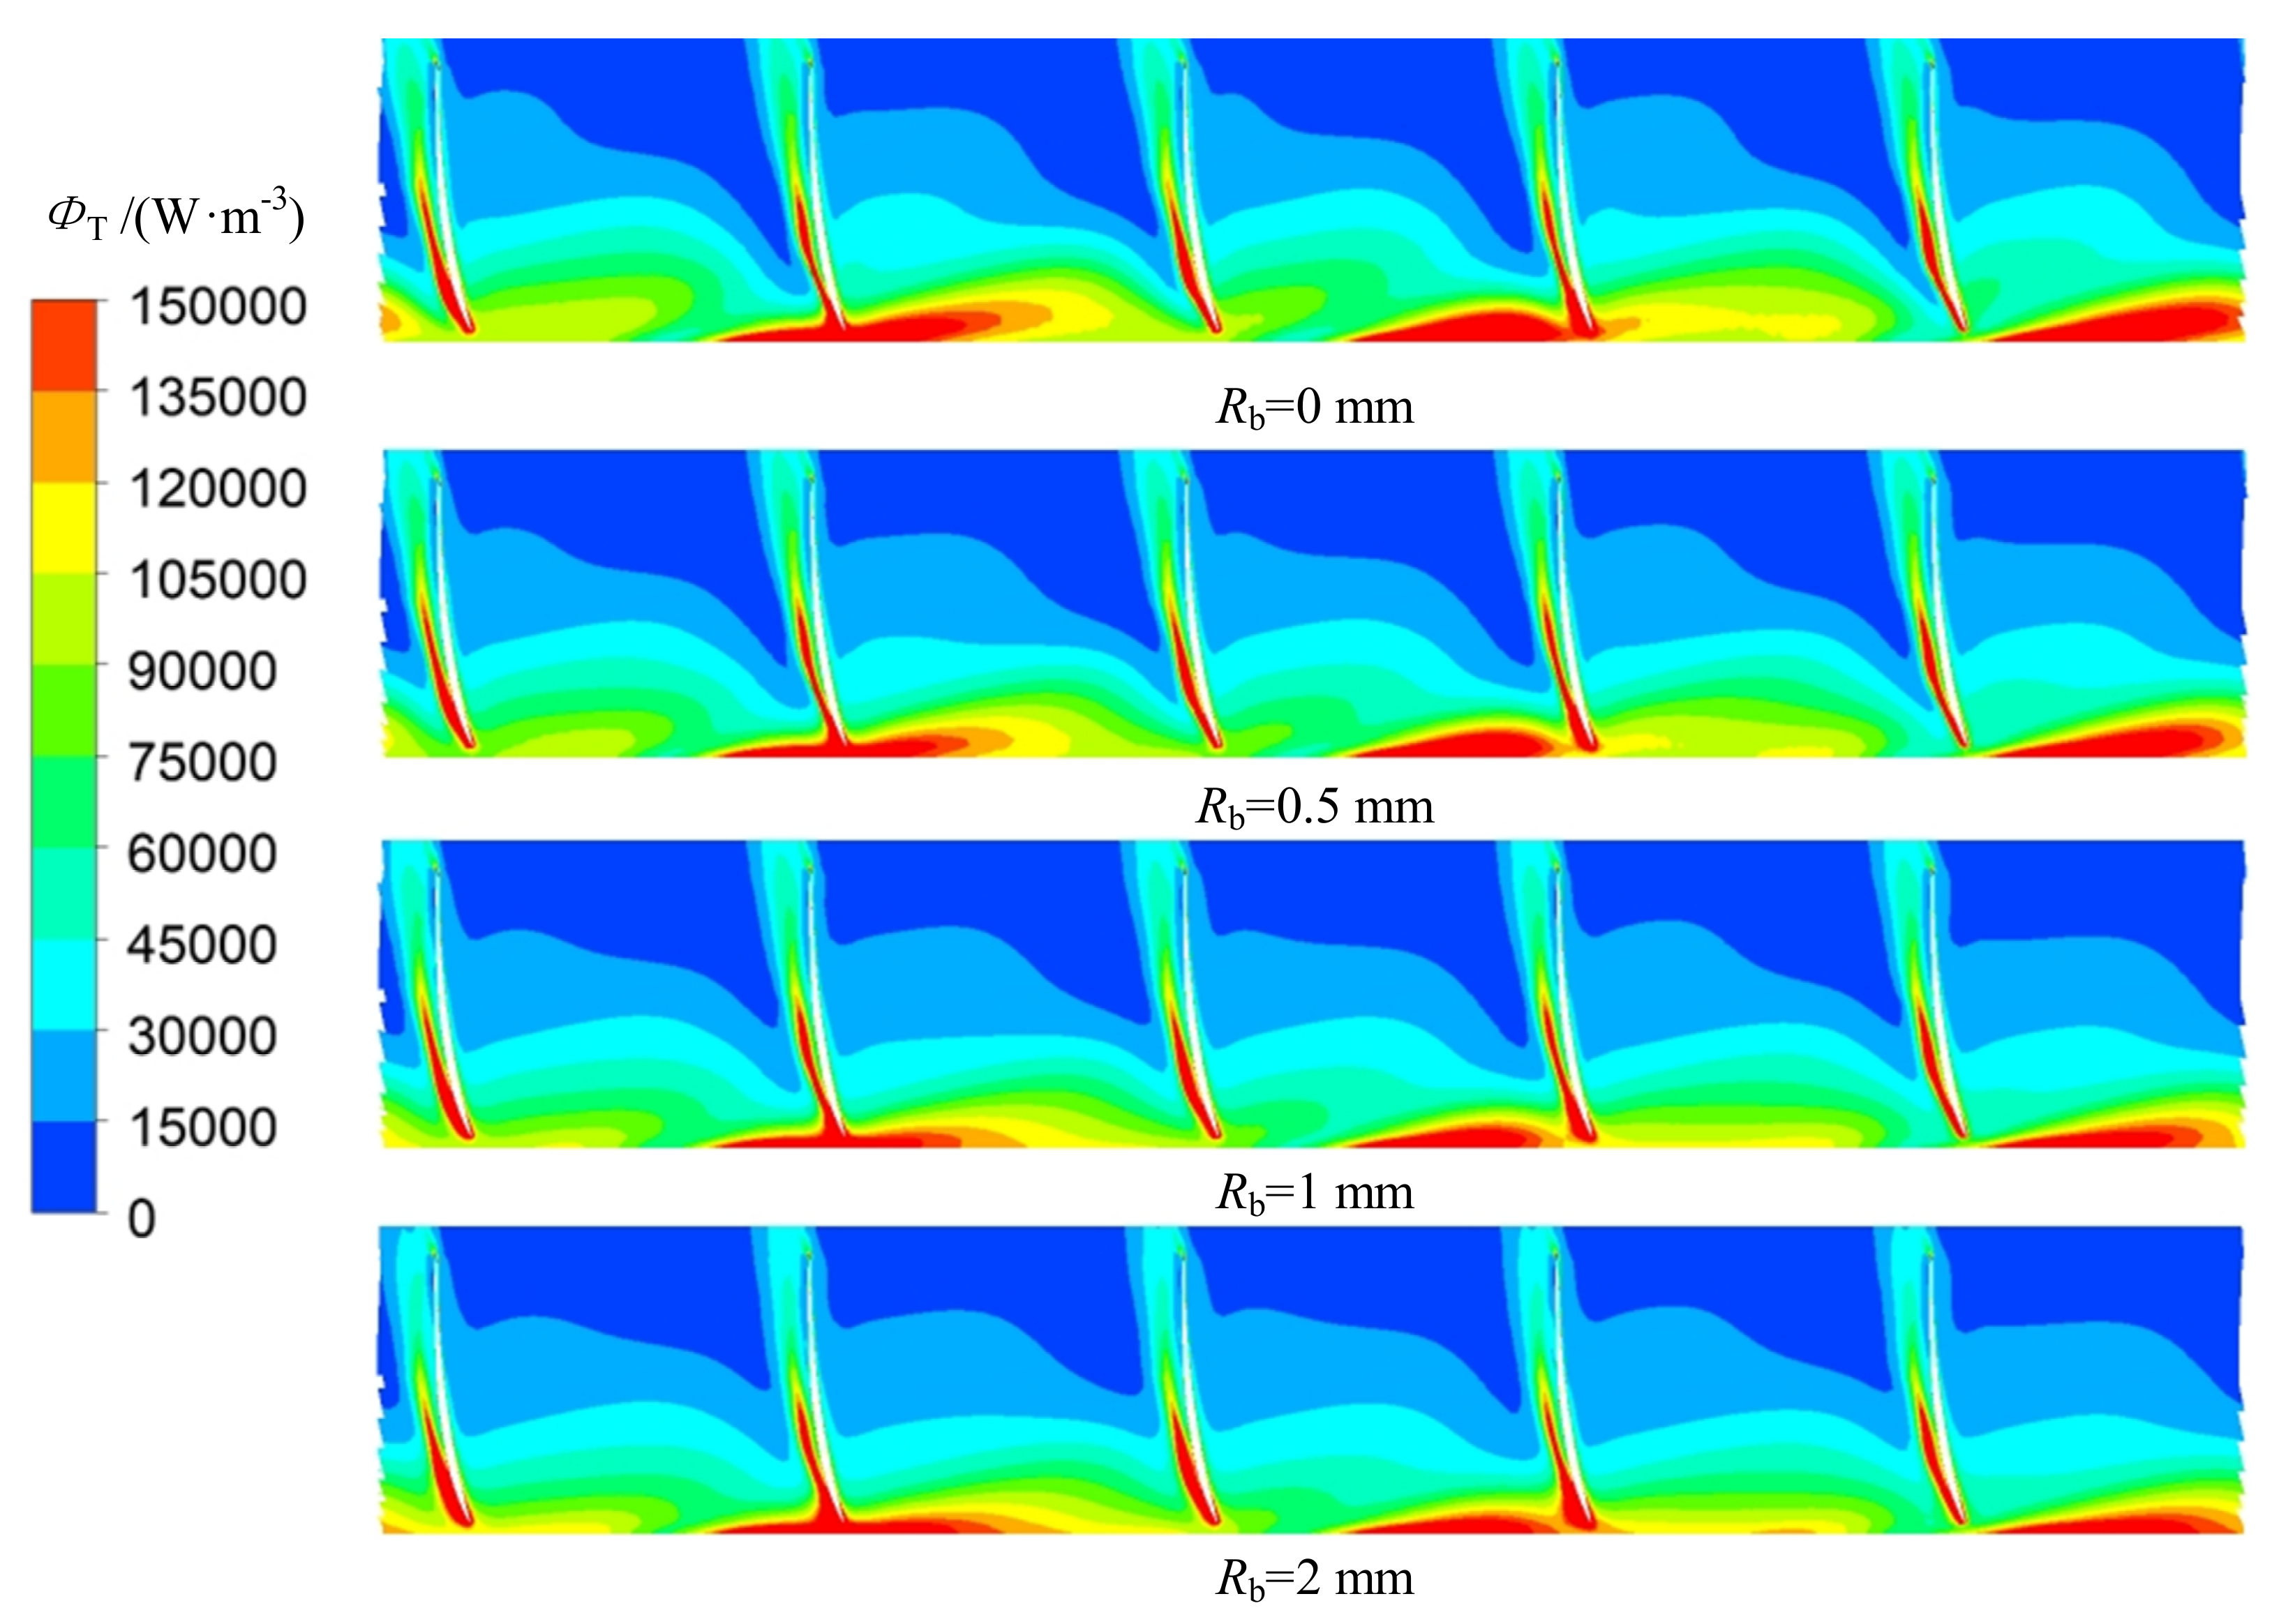
3.3. Comparison of Inner Flow Field

In order to clarify the variation of Ptotal with the backflow clearance, spatial distributions of total dissipation rate of the impeller, backflow clearance, rear guide vane and outlet passage under different Rb were compared and analyzed, as shown in the following section. Figure 10 shows the cylindrical section of the impeller and guide vane. In addition, the radial coefficient of the cylindrical section S p a n is defined as follows:
S p a n = R R h R s R h
where R, Rh, and Rs are the radius of the cylinder section, impeller hub, and impeller rim, respectively.
Figure 11 shows the velocity distribution in cylindrical section of the impeller with different backflow clearance radii under 1.0Qdes. The velocity decreases gradually from the impeller inlet to the impeller outlet, and the highest velocity can be found near the leading edge. Since the impeller outflow returns to the impeller inlet through the backflow clearance, the velocity near the impeller outlet decreases with the increase of Rb. In addition, the clearance backflow mixes with the impeller inflow, resulting in velocity loss, so the velocity near the impeller inlet also decreases with the increase of Rb.
Figure 12 shows the distribution of total dissipation rate in the cylindrical section of the impeller with different backflow clearance radii under 1.0Qdes. Under Rb = 0 mm, the total dissipation rate in the cylinder section of the impeller is low; only the total dissipation rate near the suction side is high due to the flow separation. However, the backflow through the backflow clearance leads to velocity loss of the impeller inflow and outflow, so the total dissipation rate near the inlet and outlet increases with the increase of Rb. Furthermore, the backflow aggravates flow separation near the suction side and, therefore, the total dissipation rate near the suction side also increases with the increase of Rb.
Figure 13 shows the distribution of total dissipation rate on the blade surface under different Rb at 1.0Qdes. The load of the pressure side mainly comes from the impact of the relative circumferential velocity, which gradually increases from hub to rim. Thus, the total dissipation rate near rim of pressure side is the highest, as indicated by the mark in the figure. The load of the suction side also comes from the relative velocity impact, and the relative velocity near the suction side gradually decreases from the leading edge to trailing edge according to Figure 11. Therefore, the total dissipation rate near the leading edge of suction side is the highest, as indicated by the mark in the figure. In addition, because of the velocity loss of the impeller inflow caused by clearance backflow, the total dissipation rate near the rim of pressure side decreases with the increase of Rb. However, the suction side is not only impacted by the impeller inflow but also by the clearance backflow. Although there is a velocity loss of the impeller inflow, the total dissipation rate near the leading edge of the suction side increases with the increase of Rb.
Figure 14 shows the leakage flow rate of three backflow clearances under five operation flow rates. Because the flow resistance of the backflow clearance decreases with the increase of Rb, the leakage flow rate rises with the increase of Rb at same operation flow rate. In addition, the leakage flow is driven by the pressure difference between the impeller inlet and outlet, which decreases with the increase of operation flow rate. Therefore, the leakage flow rate decreases with rise of the operation flow rate. Leakage flow rates under 1.2Qdes decline 48.4%, 46.5%, and 45.3% under Rb = 0.5, 1, and 2 mm, respectively, compared with leakage flow rates under 0.8Qdes.
Figure 15 shows the total dissipation rate in the cross-section of three backflow clearances under 1.0Qdes. The total dissipation rate near the shell wall and blade surface is higher due to the wall’s viscous effect. The flow resistance in the backflow clearance decreases with the increase of Rb, which leads to the decrease of the total dissipation rate in the backflow clearance. In addition, the outflow of backflow clearance mixes with the impeller inflow, resulting in additional hydraulic loss. Thus, the total dissipation rate near impeller inlet increases with the increase of Rb.
Figure 16 shows the distribution of velocity in a cylindrical section of the guide vane with Span = 0.97 at 1.0Qdes. Since the guide vane gradually converts the kinetic energy of inflow into pressure energy, the velocity near the inlet is significantly higher than the velocity near the outlet. Due to the high velocity circulation in the inflow of the guide vane, the flow separation near the suction side can be found and, therefore, there are some low velocity zones near the suction side. In addition, backflow clearance results in a velocity loss in the inflow of the guide vane, so the overall speed inside the guide vane decreases with the increase of Rb.
Figure 17 shows the distribution of total dissipation rate in a cylindrical section of the guide vane with Span = 0.97 at 1.0Qdes. Due to the high velocity and velocity gradients near the guide vane inlet, the total dissipation near the guide vane inlet is very high. There is a low velocity zone near the suction side, and therefore a large amount of momentum exchange between the low-speed zone and the surrounding velocity field can be found, so the total dissipation rate near the suction side is also high. In addition, the backflow clearance mainly reduces the velocity and velocity gradient near the guide vane inlet, so only the total dissipation rate near the guide vane inlet decreases with the increase of Rb.
Figure 18 shows the distribution of total dissipation rate on the wall of the outlet passage under different Rb at 1.0Qdes. The wall of the outlet passage can convert rest kinetic energy from the guide vane into pressure energy. Thus, the total dissipation rate near the inlet is high and it decreases from the inlet to the outlet. The kinetic energy from the guide vane outlet decreases with the increase of Rb, which results in a decline of the energy exchange between kinetic energy and pressure energy by the wall of the outlet passage. Thus, the total dissipative rate of the wall of the outlet passage also decreases with the increase of Rb.

4. Conclusions

In this study, the URANS model was solved and the entropy theory was applied to analyze the distribution of energy dissipation in full flow pump device with four kinds of backflow clearance radii. The simulation results were validated by experimental data, and the following conclusions were obtained.
(1) The rotation of the motor rotor causes extra shaft power, and the backflow clearance produces backflow effect in the impeller. Thus, compared with conventional axial flow pumps (Rb = 0 mm), the design efficiency and head decrease by 9.5% and 7.2%, and the design shaft power increase by 2.5% in the tubular pump with Rb = 2 mm. In addition, Rb has the most obvious influence on the hydraulic performance of the full tubular pump under 1.2Qdes. Compared with Rb = 0 mm, the efficiency and head reduce by 18.8% and 13%, and the shaft power increase by 7.1%, respectively, under Rb = 2 mm;
(2) Hydraulic losses in the full tubular pump are mainly from the total dissipation of the impeller, backflow clearance, rear guide vane and outlet passage. Under 0.8Qdes and 1.0Qdes, the total dissipation of the impeller increases with the increase of Rb (Rb = 0.5~2 mm), but the total dissipation of the rear guide vane and outlet passage decrease with the increase of Rb. Therefore, Rb has no obvious influence on the efficiency of the full tubular pump. Under 1.2Qdes, the total dissipation of both the impeller and outlet passage increase with the increase of Rb. Thus, the efficiency of the full tubular pump declines with the increase of Rb;
(3) Under 1.0Qdes, the total dissipation rate on the pressure side of the impeller blade decreases with the increase of Rb, and the total dissipation rate on the suction side and near the impeller inlet increases with the increase of Rb. Since the kinetic energy of the impeller outflow is reduced due to backflow effect, the total dissipation rate in the guide vane and on the outlet passage wall decrease with the increase of Rb.
Insufficient Rb may lead to the collision between the motor rotor and motor shell, which will affect the safe operation. However, excessive Rb would lead to a significant decline of hydraulic performance for the full tubular pump. Therefore, the results show the internal relationship between the internal dissipation and Rb. In addition, the spatial distribution of total dissipation rate in each hydraulic component can provide suggestions for the targeted optimization of a full tubular pump.

Author Contributions

Conceptualization: F.M. and Y.L.; methodology: F.M. and J.P.; software: F.M.; validation: F.M. and Y.L.; formal analysis: F.M.; investigation: F.M.; resources: F.M.; data curation: F.M. and Y.L.; writing—original draft preparation: F.M.; writing—review and editing: F.M.; visualization: F.M.; supervision: F.M.; project administration: Y.L.; funding acquisition: J.P. All authors have read and agreed to the published version of the manuscript.

Funding

This research was funded by Natural Science Foundation of China (grant no. 51879121), Primary Research and Development Plan of Shandong Province (grant no. 2019TSLH0304).

Institutional Review Board Statement

Not applicable.

Informed Consent Statement

Not applicable.

Data Availability Statement

Not applicable.

Conflicts of Interest

The authors declare no conflict of interest.

Nomenclature

R b (mm)Backflow clearance radius
v ¯ (m/s)Time-averaged velocity
v 1 (m/s)Velocity component in the x direction of Cartesian coordinates
v 2 (m/s)Velocity component in the y direction of Cartesian coordinates
v 3 (m/s)Velocity component in the z direction of Cartesian coordinates
S [J/(K·kg)]Specific entropy
q (W/m2)Heat flux density vector
Φ (W/m3)Viscous dissipation rate
Φ θ (W·K/m3)Entropy production term
S ¯ [J/(K·kg)]Time-averaged specific entropy
ρ (kg/m3)Density of liquid
T (K)Temperature
Φ D ¯ (W/m3)Direct dissipation rate
Φ D (W/m3)Indirect dissipation rate
Φ T (W/m3)Total dissipation rate
P PRO , D ¯ (W)Power dissipation caused by direct dissipation rate
P PRO , D (W)Power dissipation caused by indirect dissipation rate
P total (W)Total power dissipation
Q (m3/s)Volume flow rate
p out (Pa)Total pressure of outlet
p in (Pa)Total pressure of inlet
P s (W)Shaft power
Q des (m3/s)Design flow rate
Q b (m3/s)Volume flow rate in back flow clearance
H (m)Head of full tubular pump device
η (%)Efficiency of full tubular pump device
ε (W/kg)Dissipation rate of turbulent kinetic energy
R (mm)Radius of the cylinder section
R h (mm)Radius of the impeller hub
R s (mm)Radius of the impeller rim

Abbreviations

3DThree-Dimensional
CBVClearance backflow vortex
BTCBlade tip clearance
TLVTip leakage vortex
SSTShear stress transport
URANSUnsteady Reynolds-Averaged Navier-Stokes equation
CFDComputational Fluid Dynamics
EXPExperiment

References

  1. Wang, W.; Wang, W.; Zhang, l.; Zhao, L.; Lu, J.; Feng, J.; Luo, X. Mechanism for end-wall slots to improve hump in an axial flow pump. Trans. Chin. Soc. Agric. Eng. 2020, 36, 12–20. (In Chinese) [Google Scholar]
  2. Xi, S.; Desheng, Z.; Bin, X.; Weidong, S.; van Esch, B. Experimental and numerical investigation on the effect of tip leakage vortex induced cavitating flow on pressure fluctuation in an axial flow pump. Renew. Energy 2021, 163, 1195–1209. [Google Scholar] [CrossRef]
  3. Shi, L.; Jiao, H.; Gou, J.; Yuan, Y.; Tang, F.; Yang, F. Influence of backflow gap size on hydraulic performance of full-flow pump. Trans. Chin. Soc. Agric. Mach. 2020, 51, 139–146. (In Chinese) [Google Scholar]
  4. Shi, L.; Zhang, W.; Jiao, H.; Tang, F.; Wang, L.; Sun, D.; Shi, W. Numerical simulation and experimental study on the comparison of the hydraulic characteristics of an axial-flow pump and a full tubular pump. Renew. Energy 2020, 152, 1455–1464. [Google Scholar] [CrossRef]
  5. Shi, L.; Yuan, Y.; Jiao, H.; Tang, F.; Cheng, L.; Yan, J.; Yan, J.; Zhu, J. Numerical investigation and experiment on pressure pulsation characteristics in a full tubular pump. Renew. Energy 2021, 163, 987–1000. [Google Scholar] [CrossRef]
  6. Xu, B.; Shen, X.; Zhang, D.; Zhang, W. Experimental and numerical investigation on the tip leakage vortex cavitation in an axial flow pump with different tip clearances. Processes 2019, 7, 935. [Google Scholar] [CrossRef] [Green Version]
  7. Zhang, D.; Shi, W.; Esch, B.; Shi, L.; Dubuisson, M. Numerical and experimental investigation of tip leakage vortex trajectory and dynamics in an axial flow pump. Comput. Fluids 2015, 112, 61–71. [Google Scholar] [CrossRef]
  8. Hao, B.; Cao, S.; He, C.; Li, L. Experimental study of the effect of blade tip clearance and blade angle error on the performance of mixed-flow pump. Sci. China 2013, 56, 293–298. [Google Scholar]
  9. Yu, H.; Zhang, Z.; Hua, H. Numerical investigation of tip clearance effects on propulsion performance and pressure fluctuation of a pump-jet propulsor. Ocean Eng. 2019, 192, 106500. [Google Scholar] [CrossRef]
  10. Wang, C.; Weng, K.; Guo, C.; Gu, L. Prediction of hydrodynamic performance of pump propeller considering the effect of tip vortex. J. Ocean Eng. 2019, 171, 259–272. [Google Scholar] [CrossRef]
  11. Shi, G.; Liu, Z.; Xiao, Y.; Li, H.; Liu, X. Velocity characteristics in a multiphase pump under different tip clearances. Proc. Inst. Mech. Eng. Part A J. Power Energy 2020. [Google Scholar] [CrossRef]
  12. Liu, Y.; Han, Y.; Tan, L.; Wang, Y. Blade rotation angle on energy performance and tip leakage vortex in a mixed flow pump as turbine at pump mode. Energy 2020, 206, 118084. [Google Scholar] [CrossRef]
  13. Zhang, D.; Shi, W.; Pan, D.; Dubuisson, M. Numerical and experimental investigation of tip leakage vortex cavitation patterns and mechanisms in an axial flow pump. J. Fluid Eng. 2015, 137, 121103. [Google Scholar] [CrossRef]
  14. Shen, X.; Zhang, D.; Xu, B.; Jin, Y.; Shi, W.; Esch, B. Experimental investigation of the transient patterns and pressure evolution of tip leakage vortex and induced-vortices cavitation in an axial flow pump. J. Fluid Eng. 2020, 142, 101206. [Google Scholar]
  15. Liu, Y.; Tan, Y.; Yue Hao, Y.; Xu, Y. Energy performance and flow patterns of a mixed-flow pump with different tip clearance sizes. Energies 2017, 10, 191. [Google Scholar] [CrossRef]
  16. Huang, Z.; Han, Y.; Tan, L.; Huang, C. Influence of t-shape tip clearance on energy performance and broadband noise for a naca0009 hydrofoil. Energies 2019, 12, 4066. [Google Scholar] [CrossRef] [Green Version]
  17. Shi, L.; Zhang, D.; Zhao, R.; Shi, W.; Jin, Y. Effect of blade tip geometry on tip leakage vortex dynamics and cavitation pattern in axial-flow pump. Sci. China Technol. Sci. 2017, 60, 1480–1493. [Google Scholar] [CrossRef]
  18. Fabian, K.; Heinz, H. Local entropy production in turbulent shear flows: A high-Reynolds number model with wall functions. Int. J. Heat Mass Transf. 2004, 47, 2205–2215. [Google Scholar]
  19. Fabian, K.; Heinz, H. Entropy production calculation for turbulent shear flows and their implementation in cfd codes. Int. J. Heat Fluid Flow 2005, 26, 672–680. [Google Scholar]
  20. Gong, R.; Wang, H.; Chen, L.; Li, D.; Zhang, H.; Wei, X. Application of entropy production theory to hydro-turbine hydraulic analysis. Sci. China 2013, 56, 1636–1643. [Google Scholar] [CrossRef]
  21. Cui, B.; Li, J.; Zhang, C.; Zhang, Y. Analysis of radial force and vibration energy in a centrifugal pump. Math. Probl. Eng. 2020, 2020, 6080942. [Google Scholar] [CrossRef]
  22. Jia, X.Q.; Zhu, Z.C.; Yu, X.L.; Zhang, Y.L. Internal unsteady flow characteristics of centrifugal pump based on entropy generation rate and vibration energy. Proc. Inst. Mech. Eng. Part E J. Process Mech. Eng. 2019, 233, 456–473. [Google Scholar] [CrossRef]
  23. Li, Y.; Zheng, Y.; Meng, F.; Osman, M. The effect of root clearance on mechanical energy dissipation for axial flow pump device based on entropy production. Processes 2020, 8, 1506. [Google Scholar] [CrossRef]
  24. Chang, H.; Shi, W.; Li, W.; Liu, J. Energy loss analysis of novel self-priming pump based on the entropy production theory. J. Therm. Sci. 2018, 28, 306–318. [Google Scholar] [CrossRef]
  25. Zhang, F.; Appiah, D.; Hong, F.; Zhang, J.; Yuan, S.; Adu-Poku, K.A.; Wei, X. Energy loss evaluation in a side channel pump under different wrapping angles using entropy production method. Int. Commun. Heat Mass 2020, 113, 104526. [Google Scholar] [CrossRef]
  26. Yang, B.; Li, B.; Chen, H.; Liu, Z. Entropy production analysis for the clocking effect between inducer and impeller in a high-speed centrifugal pump. Proc. Inst. Mech. Eng. Part E J. Process Mech. Eng. 2019, 233, 5302–5315. [Google Scholar] [CrossRef]
  27. Hou, H.; Zhang, Y.; Zhou, X.; Zuo, Z.; Chen, H. Optimal hydraulic design of an ultra-low specific speed centrifugal pump based on the local entropy production theory. Proc. Inst. Mech. Eng. Part A J. Power Energy 2019, 233, 715–726. [Google Scholar] [CrossRef]
  28. Ji, L.; Li, W.; Shi, W.; Chang, H. Energy characteristics of mixed-flow pump under different tip clearances based on entropy production analysis. Energy 2020, 199, 117447c. [Google Scholar] [CrossRef]
  29. Shen, S.; Qian, Z.; Ji, B. Numerical Analysis of Mechanical Energy Dissipation for an Axial-Flow Pump Based on Entropy Generation Theory. Energies 2019, 12, 4162. [Google Scholar] [CrossRef] [Green Version]
  30. Mentor, F.; Ferreira, J.C.; Esch, T.; Konno, B. The SST turbulence model with improved wall treatment for heat transfer predictions in gas turbines. In Proceedings of the International Gas Turbine Congress, Tokyo, Japan, 2–7 November 2003. [Google Scholar]
  31. Spurk, J.H. Strömungslehre; Springer: Berlin/Heidelberg, Germany, 1989. [Google Scholar]
Figure 1. (a) Three-dimensional model and (b) impeller section of full tubular pump device.
Applsci 11 03376 g001
Figure 2. Mesh of full tubular pump device.
Applsci 11 03376 g002
Figure 3. Grid independence of full tubular pump device with 2 mm backflow clearance.
Applsci 11 03376 g003
Figure 4. The test bench of full tubular pump device.
Applsci 11 03376 g004
Figure 5. Comparison of experiment data and calculated results (Rb = 2 mm).
Applsci 11 03376 g005
Figure 6. Comparison of calculated (a) head, (b) shaft power and (c) efficiency under different Rb.
Applsci 11 03376 g006
Figure 7. Comparison of total dissipation for each hydraulic component under different Q/Qdes (Rb = 2 mm).
Applsci 11 03376 g007
Figure 8. Total dissipation of hydraulic component under different Rb at (a) 0.8Qdes, (b) 1.0Qdes, and (c) 1.2Qdes.
Applsci 11 03376 g008
Figure 9. Total dissipation of different backflow clearances.
Applsci 11 03376 g009
Figure 10. Cylindrical section of (a) impeller and (b) rear guide vane.
Applsci 11 03376 g010
Figure 11. Velocity distribution in cylindrical section of impeller under different Rb at Q = 1.0Qdes (Span = 0.95).
Applsci 11 03376 g011
Figure 12. Distribution of total dissipation rate in cylindrical section of impeller under different Rb at 1.0Qdes (Span = 0.95).
Applsci 11 03376 g012
Figure 13. Total dissipation rate distribution on (a) pressure side and (b) suction side of impeller under different Rb at 1.0Qdes.
Applsci 11 03376 g013
Figure 14. Leakage flow rate of three backflow clearances under different operation flow rates.
Applsci 11 03376 g014
Figure 15. Distribution of total dissipation rate in cross-section of different backflow clearance at 1.0Qdes.
Applsci 11 03376 g015
Figure 16. Distribution of velocity in cylindrical section of the guide vane under different Rb at 1.0Qdes (Span = 0.97).
Applsci 11 03376 g016
Figure 17. Distribution of total dissipation rate in cylindrical section of guide vane under different Rb at 1.0Qdes (Span = 0.97).
Applsci 11 03376 g017
Figure 18. Distribution of total dissipation rate on the outlet passage wall under different Rb at Q = 1.0Qdes.
Applsci 11 03376 g018
Table 1. Main parameters of full tubular pump device.
ParameterUnitValue
Design parameters
(experimental data)
Design flow rate Qdesm3/s0.2726
Design head Hdesm2.36
Design efficiency ηdes%67.28
Rotation speedr/min1087.5
Specific speed-1088
Geometry parameters
Blade number of front guide vane-4
Blade number of impeller-3
Impeller diametermm300
Backflow clearance radiusmm0/0.5/1/2
Blade number of rear guide vane-5
Publisher’s Note: MDPI stays neutral with regard to jurisdictional claims in published maps and institutional affiliations.

