Article

Temperature Dependence of Density and Viscosity of Biobutanol-Gasoline Blends

1
Department of Technology and Automobile Transport, Mendel University in Brno, Zemědělská 1665/1, 613 00 Brno, Czech Republic
2
Department of Biological and Agricultural Engineering, Louisiana State University Agricultural Center, 149 E. B. Doran Building, Baton Rouge, LA 70803-4505, USA
3
College of Technology, University of Bamenda, Bamenda, P.O. Box 39, Bambili, Cameroon
4
Department of Quality and Safety of Industrial Products, Cracow University of Economics, Rakowicka 27, 31-510 Kraków, Poland
*
Author to whom correspondence should be addressed.
Appl. Sci. 2021, 11(7), 3172; https://doi.org/10.3390/app11073172
Submission received: 15 March 2021 / Revised: 29 March 2021 / Accepted: 30 March 2021 / Published: 2 April 2021

Abstract

:

Featured Application

The results are applicable in industrial practice. The models with the coefficients could be used to set a car control unit, which would be able to evaluate the exact amount of fuel needed for injection into the combustion chamber according to the current concentration of the biobutanol in the gasoline and current temperature of the fuel, because, as this paper stated, these can affect the fuel volumetric mass density and the dynamic/kinematic viscosity.

Abstract

Butanol seems to be an eligible fuel for compensating for the increasing fuel consumption. Biobutanol could be produced from local sources in the place of use. Its properties show similar results to gasoline, so biobutanol could be added as a biocomponent into fuels. Important properties, in the case of blending biobutanol into gasoline, are its fluid properties and their dependence on the temperature. Therefore, in this paper, the volumetric mass density and viscosity of the selected ratios between biobutanol and gasoline (0, 5, 10, 85, 100 vol.%) were tested over the temperature range from −10 °C up to 40 °C. Gasolines with a 95 Research Octane Number (RON 95) and with a 98 Research Octane Number (RON 98) were used. It was observed that as the temperature increased, the viscosity and volumetric mass density of the samples decreased nonlinearly. Four mathematical models were used for modelling the viscosity. The accuracy of models was evaluated and compared according to the coefficient of determination R2 and sum of squared estimate of errors (SSE). The results show that blends with 5 vol.% and 10 vol.% of biobutanol promise very similar fluid properties to pure gasoline. In contrast, a blend with 85 vol.% of biobutanol shows different fluid properties from gasoline, especially in negative temperatures, a lot. For practical applications, mathematical polynomial multivariate models were created. Using these models, three-dimensional graphs were constructed.

1. Introduction

In the current consumer society, characterised by an increase in the population, a corresponding increase in the consumption of resources, especially fuels, are required. Unless significant changes are made in the energy sector, fuel needs could increase up to 48% from 2012 to 2040 [1]. Furthermore, it is assumed that by 2030 fossil fuels will become the most expensive energy source. With consideration to the depleting oil resources, market volatility, greenhouse gas (GHG) emissions and required mitigation strategies, and the environmentally unfriendly character of processing crude oils, it would be appropriate to develop other ecological and sustainable sources [2]. Another successful approach is the in situ gasoline upgrade into strong anti-knocking alcohol mixtures [3]. Therefore, many studies have been concentrated on this topic nowadays in order to find suitable renewable sources that can replace or supplement fossil fuels, e.g., [4,5,6].
A promising solution seems to be the processing of biofuels. Two of the main advantages of using biofuels is its good availability and the abundance of local raw materials for production—directly at the place of consumption. Biofuels can replace petroleum fuels mainly in the transportation sector and, in many cases, without the replacement of the existing powertrain design. Of the various biofuels, biobutanol (especially produced from lignocellulosic raw materials [7]) seems to be one of the most appealing because biobutanol has attractive properties such as a higher heating value/specific energy, cetane number, hydrophobicity, and low vapour pressure [8,9]. Furthermore, it is less corrosive and volatile [10]. Currently, in the US and Europe, biofuels are blended with commonly used fuels, referred to as E5, E7, and E10 per Directive 2008/50/EC in Europe. The former and latter express the type of fuel used as the bio-component (bioethanol or fatty acid methyl ester, respectively) as well as the quantity of the biofuel (5, 7, or 10 vol.%, respectively) that have been incorporated into the fossil fuel. Biobutanol can be produced similarly to bioethanol by fermentation of the directly fermentable simple sugars, called the ABE (Acetone-Butanol-Ethanol) process under the action of the microorganism (Clostridium acetobutylicum) [11]. Starch crops (cereals, maize, and potatoes) and molasses from the sugar cane or sugar beet are the traditional raw materials used to produce biobutanol [12,13]. On the other hand, microalgae strains are also gaining attention as an advanced energy feedstock for biofuel production [14,15]. Due to the similar properties to common use fuels, it is possible to add larger amounts of biobutanol into a fuel, which would result in a bigger fossil fuel savings. Although many science papers have been published about biobutanol as a promising biofuel, (e.g., [16,17,18]) only a couple of them have investigated the temperature effect on the rheological properties (kinematic and dynamic viscosity) of the fuel, and only for bioethanol [19]. The temperature dependent properties are crucial for understanding the performance of the fuel and, subsequently, the engine over a given period of time [20,21].
Therefore, the objective of this work is to survey the fluid behaviour of biobutanol-gasoline blends (volumetric mass density, dynamic viscosity, kinematic viscosity) through the whole year’s temperature range that normally occur for most European countries (from −10 °C up to 40 °C) and the subsequent modelling of this behaviour.

2. Materials and Methods

2.1. Material

In this study, automobile gasolines with a 95 Research Octane Number (RON 95) and with a 98 Research Octane Number (RON 98), both without a biocomponent (Čepro, Czech Republic) and biobutanol (Penta, Czech Republic) were used. Five samples with various volume concentrations of gasoline and biobutanol were prepared, see Table 1. The sample identification is according to the volume ratio of the biobutanol in the whole blend (e.g., B10 contains 10 vol.% of biobutanol and 90 vol.% of gasoline).
The typical physical and chemical properties of the fuels (gasoline, bioethanol, and biobutanol) are shown in Table 2.

2.2. Volumetric Mass Density Measuring

The values of the volumetric mass density of the biobutanol-gasoline samples were measured by a digital Densito 30 PX densitometer (Mettler Toledo, Columbus, OH, USA) operating on an oscillating tube principle. All the samples were measured in temperature range from −10 to 40 °C (~263–313 K). The ASTM D4052 standard was followed throughout the whole experiment.

2.3. Viscosity Measuring

To determine the dynamic viscosity, a DV2T rotary viscometer (Brookfield, Middleborough, MA, USA) with standard spindle 18 (according the Brookfield) was used. The shear strain rate was set to a constant 200 s−1. During the experiment, the similar procedure that was already used for gasoline-bioethanol and diesel-biobutanol blends in the papers [19,24,25] was followed. All the samples were measured in a temperature range from −10 to 40 °C (~263–313 K). Each sample was cooled down to −10 °C and gradually heated by 5 °C steps and after 2 min of stabilising the temperature, the viscosity was measured. A closed measuring cuvette was used to prevent evaporation of the sample during the measurement.
The kinematic viscosity was calculated from the dynamic viscosity and volumetric mass density using the equation:
ν = η ρ
where ν is the kinematic viscosity, η is the dynamic viscosity, and ρ is the volumetric mass density.

2.4. Mathematical Models for the Density, Dynamic, and Kinematic Viscosity

In this paper, four mathematical models were used for the temperature dependence of the volumetric mass density and both viscosities. These models are used for nonlinear (frequently exponential) dependences, which is also observed in the temperature dependence of the volumetric mass density and the viscosity of the fuels.
Some of models below were used also in papers [26,27,28,29,30]. The details and formulas of the used mathematical models are shown below.
Exponential model:
η = η 0 · e b · T   for   dynamic   viscosity
ρ = ρ 0 · e b · T   for   volumetric   mass   density
Arrhenius model:
η = η 0 · e E a R · T   for   dynamic   viscosity
ν = ν 0 · e E a R · T   for   kinematic   viscosity
Newton model:
η = η 0 · e b T   for   dynamic   viscosity
ν = ν 0 · e b T   for   kinematic   viscosity
Vogel model:
η = η 0 · e   b c   +   T   for   dynamic   viscosity
ν = ν 0 · e   b c   +   T   for   kinematic   viscosity
where η is the dynamic viscosity, η 0 is the reference value of the dynamic viscosity, ν is the kinematic viscosity, ν 0 is the reference value of the kinematic viscosity, ρ is the volumetric mass density, ρ 0 is the reference value of the volumetric mass density, T is the absolute temperature, R is the Universal gas constant, E a is the Arrhenius activation energy, and b and c are coefficients.
Furthermore, mathematical polynomial multivariate models were created. These models describe the behaviour of the volumetric mass density or kinematic viscosity of the biobutanol-gasoline blends depending on their temperature and concentration. The models were created for both the RON 95 and RON 98 gasolines. The equations of the multivariate models are given below based on polynomial functions.
The volumetric mass density:
ρ ( T , C ) = x 0 + x 1 · T + x 2 · C + x 3 · T 2 + x 4 · T · C
The kinematic viscosity:
ν ( T , C ) = y 0 + y 1 · T + y 2 · C + y 3 · T 2 + y 4 · T · C .
In Equations (11) and (12), ρ is the volumetric mass density, ν is the kinematic viscosity, T is the absolute temperature, C is the concentration, and xi, yi are coefficients.

2.5. Statistical Data Processing

All the measurements were repeated five times for volumetric mass density and 20 times for viscosity to obtain a higher accuracy and relevance of the results, and the values in the tables are displayed as the mean value including the standard deviation.
The experimental data were processed by Matlab® and Statistica®. To determine a statistically significant difference between the measured values of the volumetric mass density, dynamic viscosity and kinematic viscosity at the selected temperatures at the individual gasoline (RON 95, RON 98) and biobutanol concentrations, an ANOVA (analysis of variance) test was performed followed by multiple comparisons using Tukey’s HSD (honestly significant difference) test (at the significance level of p < 0.05).
The normality and homogeneity of the data were evaluated according to a critique of the regression triplet data, which examines the quality of the data for the proposed model. The evaluation was performed by means of graphical (using rankit Q-Q graphs of residues and index graphs) and numerical statistical analysis of residues.

3. Results and Discussion

The following section comprehensively shows the values obtained during the experiments.

3.1. Volumetric Mass Density

Table A1 and Table A2 (in Appendix A) shows the mean values of the volumetric mass density of the biobutanol-gasoline blends at the selected temperature range and concentration.
It can be seen that volumetric mass density of the blends decreases with an increasing temperature. Furthermore, the blends with a higher biobutanol content reach a higher volumetric mass density value and the RON 98 gasoline also has a higher volumetric mass density value than the RON 95 gasoline, similar to the bioethanol and gasoline blends [19,25,31].

3.2. Dynamic Viscosity

Table A3 and Table A4 show the mean values of the dynamic viscosity of the biobutanol-gasoline blends at the selected temperature range and concentration.
It is evident that the dynamic viscosity of the blends decreases with an increasing temperature. Furthermore, the blends with a higher concentration of biobutanol reach a higher dynamic viscosity value and the RON 98 gasoline also has a lower dynamic viscosity value than the RON 95 gasoline, similar to the viscosity values of the bioethanol-gasoline blends [18,32].

3.3. Kinematic Viscosity

The mean values of the kinematic viscosity of the biobutanol-gasoline blends for the selected temperature range and concentrations are shown in Table A5 and Table A6. The tables also show the results of the ANOVA test with respect to the multiple comparisons using Tukey’s HSD test in the similar indices (a, b, c, etc.). The same indices indicate that no statistically significant difference was demonstrated between the respective kinematic viscosity at the significance level of p = 0.95.
From Table A5 and Table A6, it can be seen that the kinematic viscosity values of the biobutanol-gasoline blends decrease with an increasing temperature. Also, the blends with a higher biobutanol content have higher kinematic viscosity values, and the RON 98 gasoline also has lower kinematic viscosity values than the RON 95 gasoline, similar to the bioethanol-gasoline blends [25]. The dependence of the kinematic viscosity on the concentration of the biocomponent in the fuel was also observed and described [8,33].

3.4. Mathematical Models

Finally, the most important part of this paper is devoted to the mathematical modelling of the volumetric mass density and viscosity behaviour of the biobutanol-gasoline blends. This part mainly contains tables with the coefficients of used mathematical models which are listed in Section 2.4. The obtained coefficients of the models are valid for the thermodynamic temperatures with Kelvin units.
The mentioned coefficients, especially the coefficient of determination R2 and sum of squared estimate of errors (SSE), express the degree of accuracy and suitability of using these mathematical models to model the dependence of the volumetric mass density and both viscosities on the temperature of the biobutanol-gasoline blends. Some of the used temperature-viscosity models were described and also used in the papers, e.g., [26,27,28].

3.4.1. Mathematical Model for Volumetric Mass Density

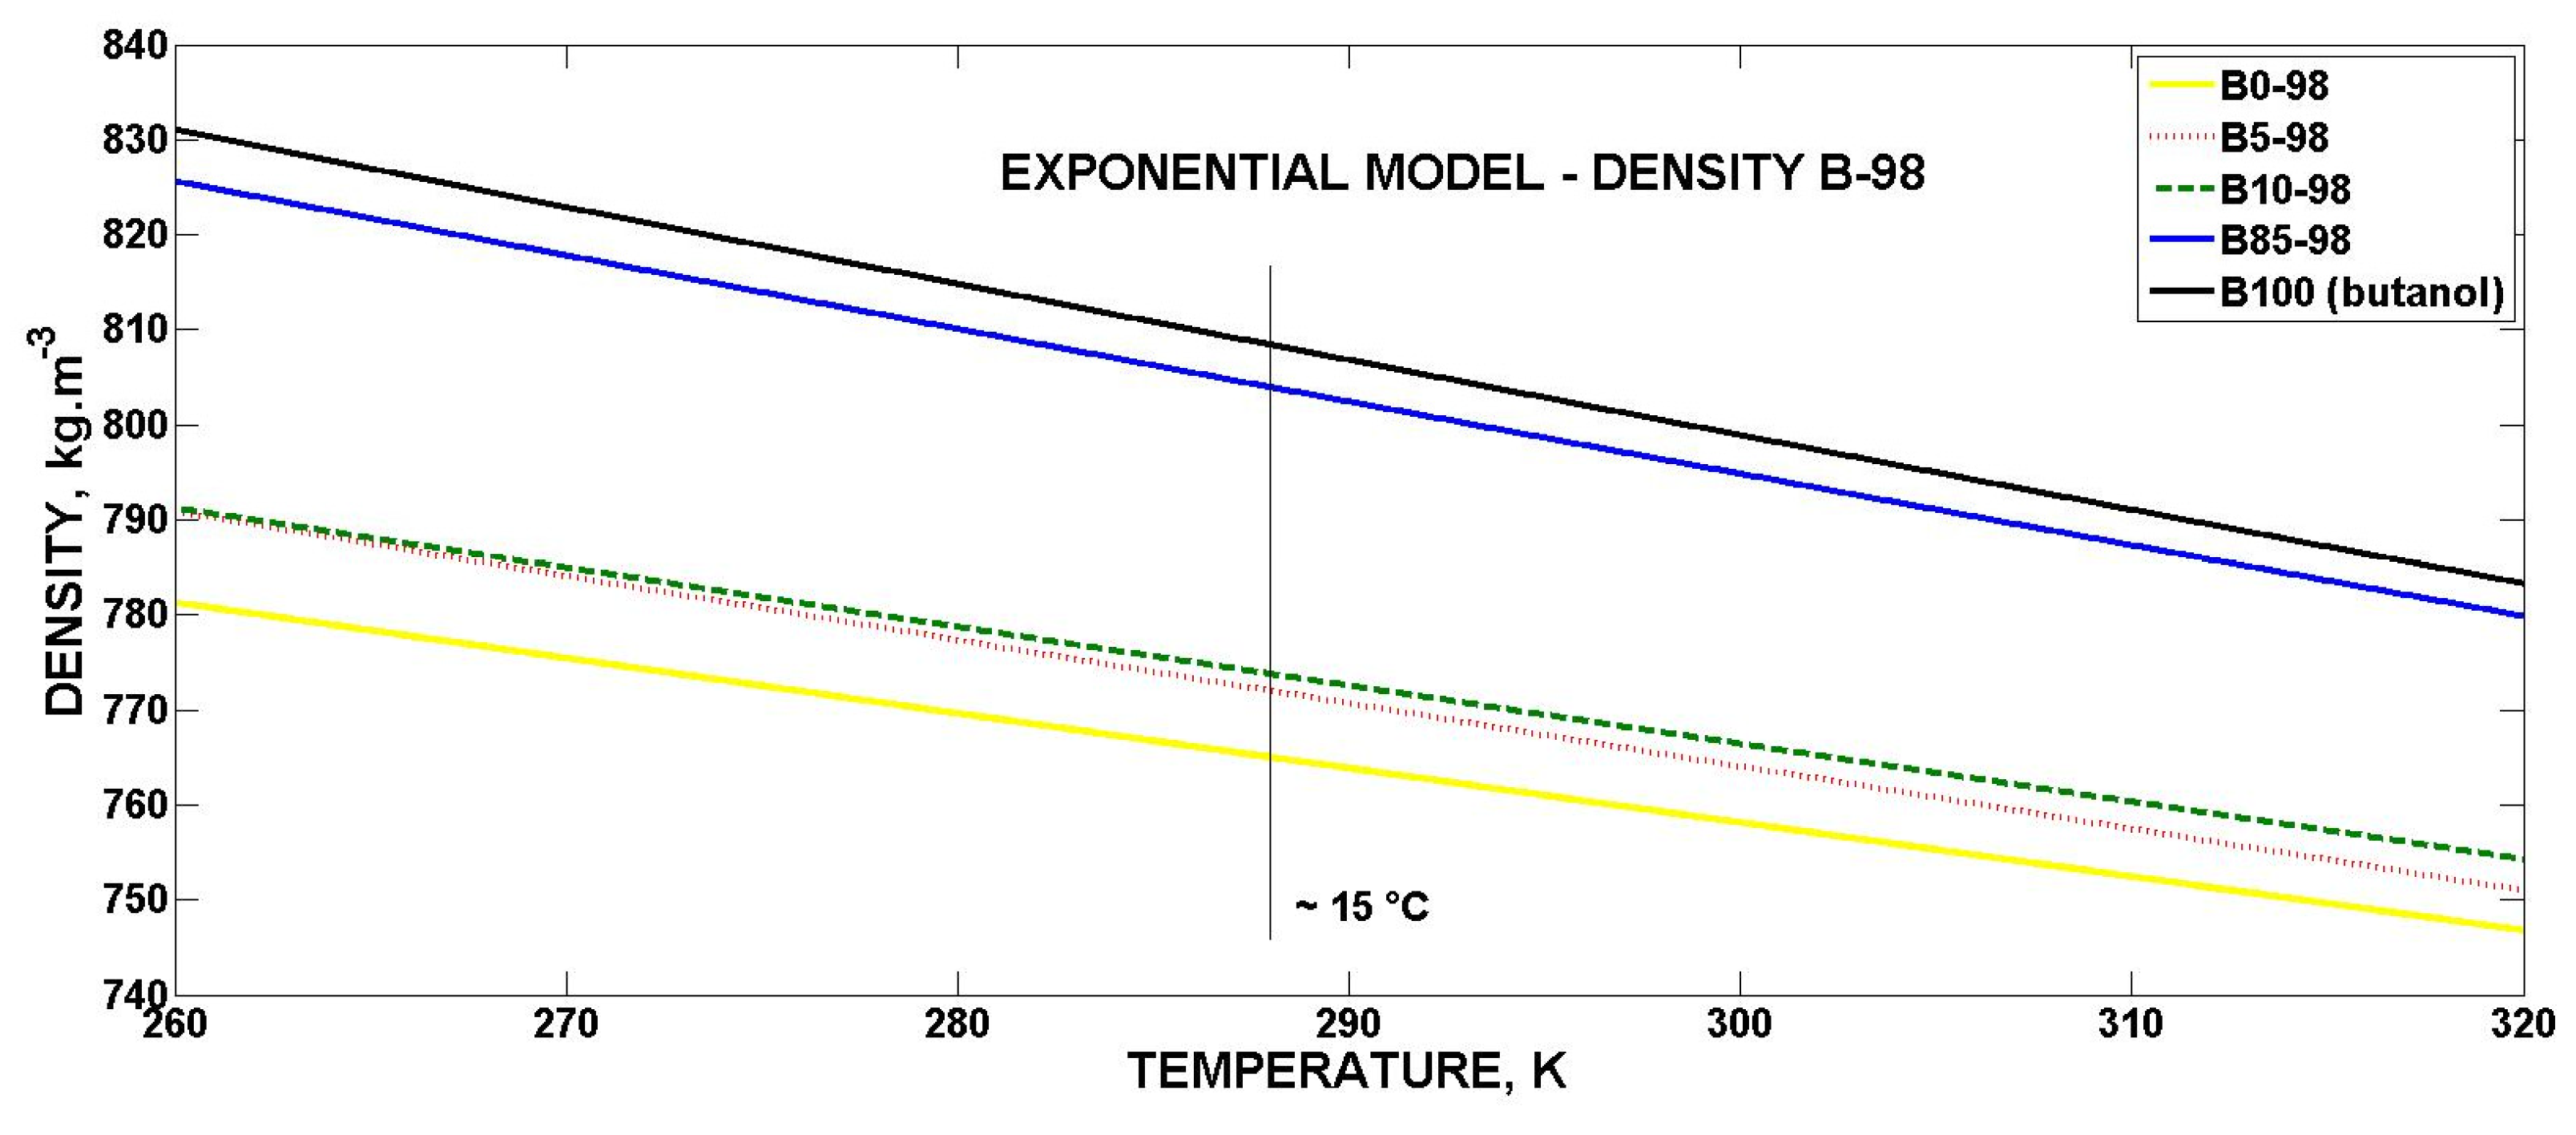
The values of the coefficients for the exponential volumetric mass density model are shown in Table 3. The reference value of the volumetric mass density ρ0 numerically determines the increase in the volumetric mass density of the blends with an increasing biobutanol volume concentration. The values of coefficient b are close to 0, so the temperature impact on the volumetric mass density approaches a linear dependence. The minus operator for the coefficient b means a decreasing trend in the exponential model, respectively, a decreasing volumetric mass density of the biobutanol-gasoline blends with an increasing temperature [8,24,34]. The above statement is graphically confirmed by Figure 1 and Figure 2. The average value of the coefficient of determination R2 for the exponential volumetric mass density model was 0.9676, which indicates the high accuracy of the models.

3.4.2. Mathematical Models for Dynamic Viscosity

The temperature dependence of the dynamic viscosity of the biobutanol-gasoline blends were modelled using four mathematical models, see Section 2.4 for more details. The coefficients of these models are shown in Table 4, Table 5, Table 6 and Table 7. Thus, it was shown that with an increasing temperature, the dynamic viscosity of the biobutanol-gasoline blends decreases [32]. The difference between the Arrhenius model and Newtonian model is only in the use of the Universal gas constant R, so it holds that the coefficient b (Newton model) multiplied by the Universal gas constant R equals the Arrhenius activation energy Ea. However, knowledge of the Arrhenius activation energy Ea of the biobutanol-gasoline blends is important and can be used for further calculations and applications [27,28,29]. In Table 7 (the coefficients of the Vogel model), several statistically insignificant coefficients can be seen, despite the Vogel model being the most accurate according to the highest average value of the coefficient of determination R2 (0.9784) and average value of sum of squared estimate of errors SSE (0.0067). The Newton and Arrhenius models are in the next rows, which have an identical average value of R2 (0.9234) and SSE (0.0514) and the exponential model has the lowest accuracy (but still very high), according to the results of the average value R2 (0.8991) and SSE (0.0168).

3.4.3. Mathematical Models for Kinematic Viscosity

For practical use, modelling the temperature dependence of the kinematic viscosity of the biobutanol-gasoline blends is the most suitable, because the kinematic viscosity contains information about the values of both the dynamic viscosity and the volumetric mass density of the blends [35]. Therefore, in the industrial and petrochemical fields, this viscosity is preferred, especially for temperature-dependent fluids.
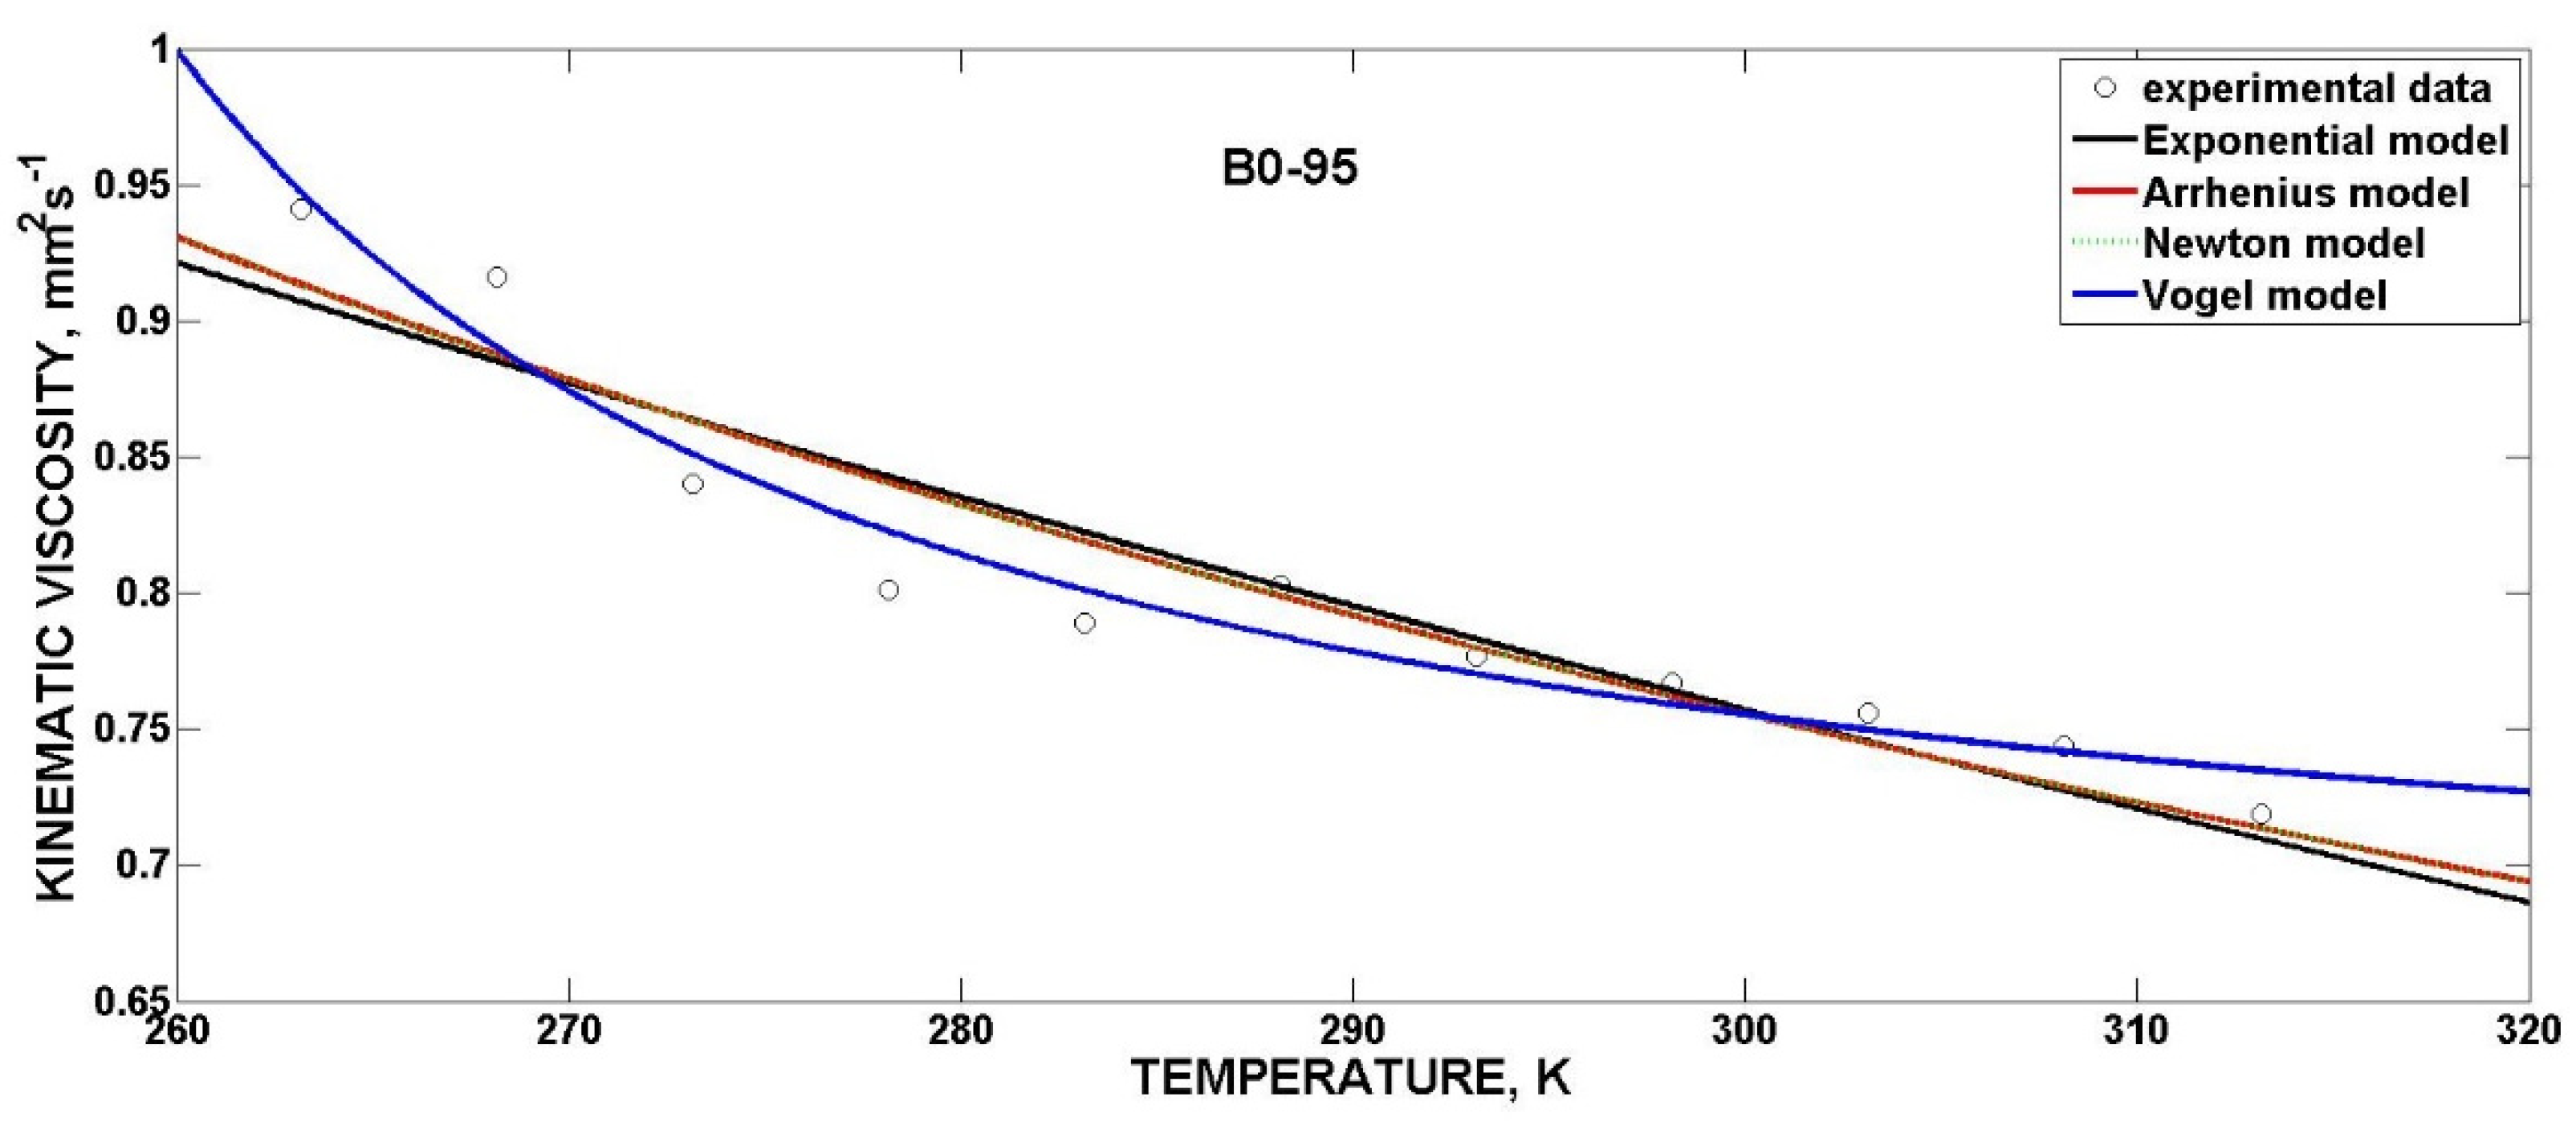
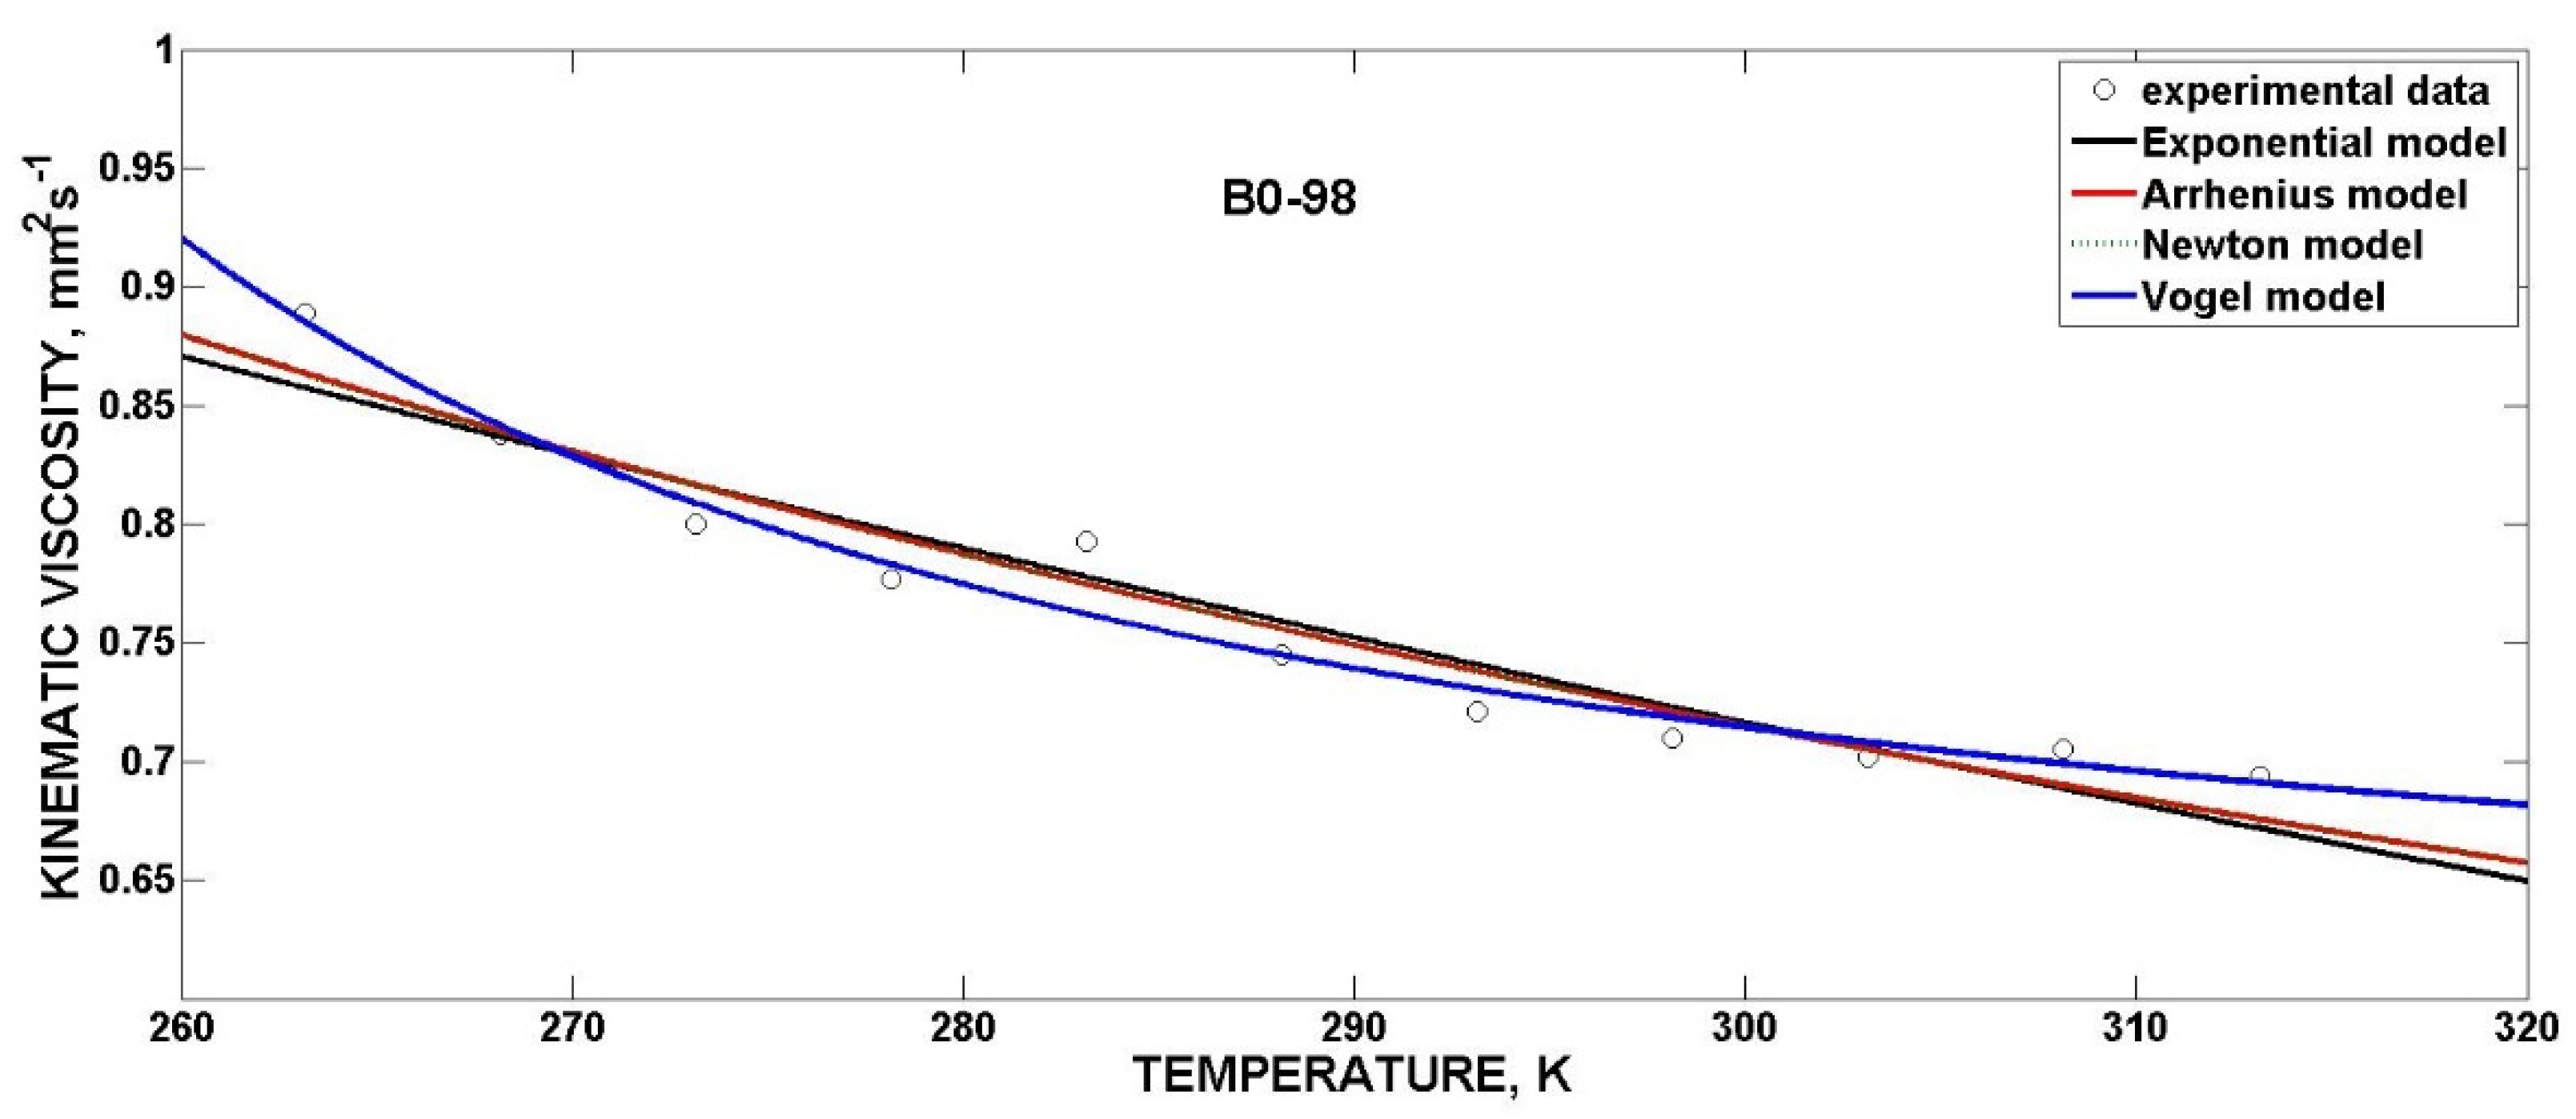
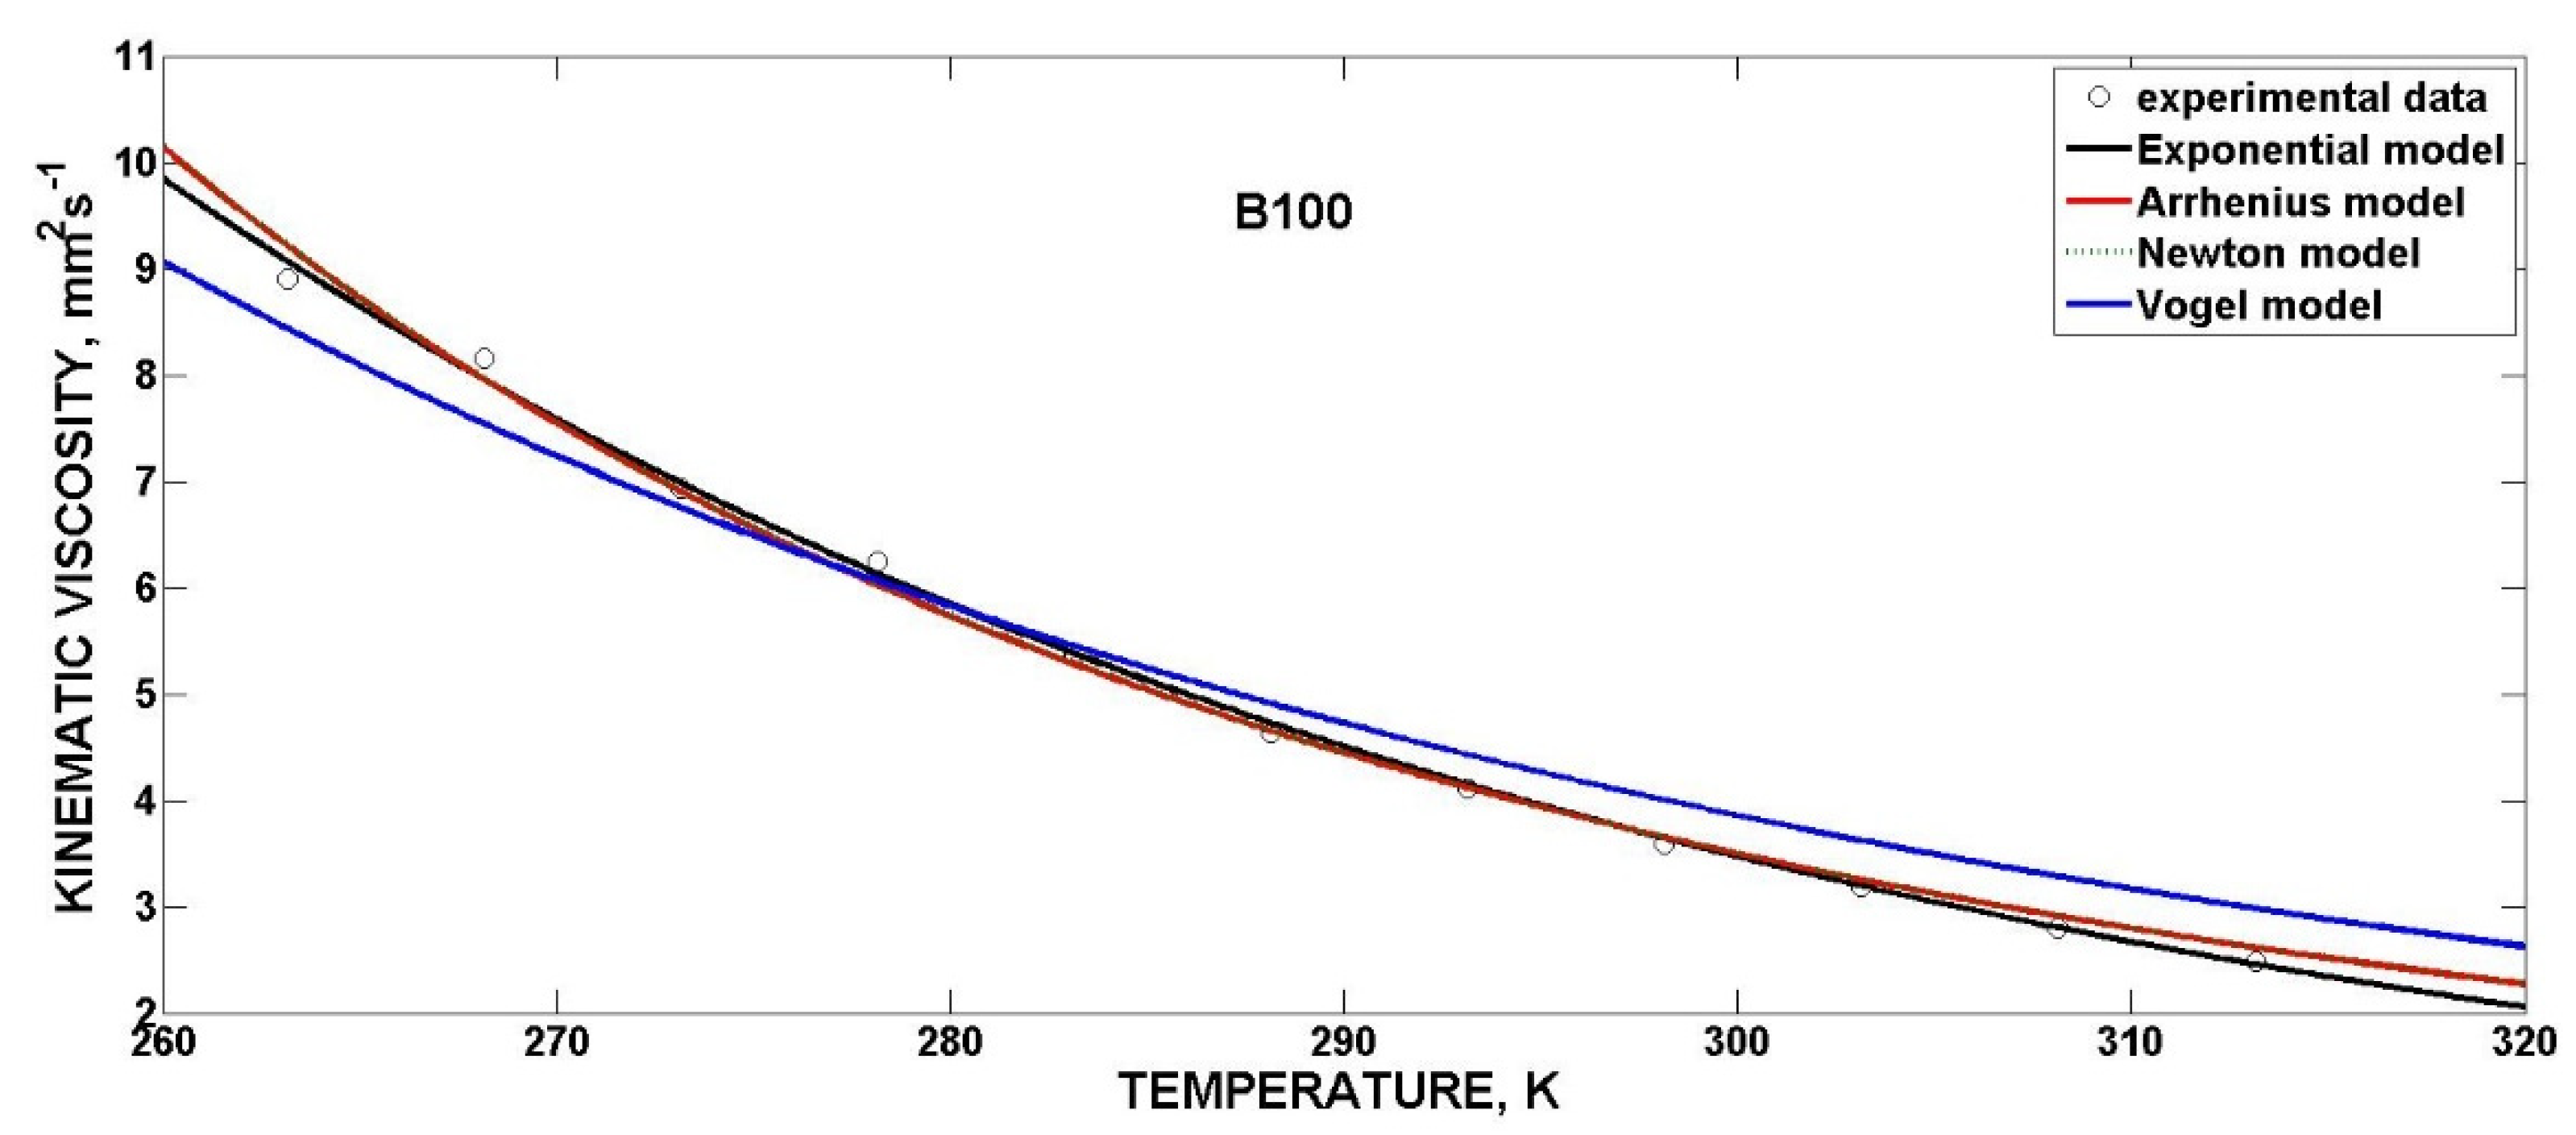
The temperature dependence of the kinematic viscosity of the biobutanol-gasoline blends were also modelled using four mathematical models (see Section 2.4). The coefficients of these models are shown in Table 8, Table 9, Table 10 and Table 11. Again, it has been proven that with an increasing temperature, the kinematic viscosity of the gasolines (RON 95 and RON 98) and biobutanol nonlinearly decreases [36], which is confirmed by the coefficients of the mathematical models in Figure 3, Figure 4 and Figure 5. In Table 11 (the coefficients of the Vogel model), several statistically insignificant coefficients can be seen, despite the Vogel model being the most accurate according to the highest average value of the coefficient of determination R2 (0.9411) and average value of sum of squared estimate of errors SSE (0.0040) without SSE of B100. The Newton and Arrhenius models followed with an average R2 value 0.8621 and SSE value 0.0353, and the exponential model has the lowest accuracy (but still very high), according to the results of the average value R2 (0.8440) and SSE (0.0387).
In Figure 3, Figure 4, Figure 5, Figure 6 and Figure 7, a relatively nonlinear decrease in the kinematic viscosity during the heating of gasolines, biobutanol, and their blends (especially when the Vogel model is used) can be seen. The lowest values in the kinematic viscosity were determined for B0 (pure gasoline) and the highest values in the kinematic viscosity were determined for B100 (pure biobutanol). The viscosity properties of the B5 and B10 blends approached that of the pure gasoline, which applies to both RON95 and RON 98. The viscosity behaviour of the B85 blend is close to the pure biobutanol viscosity behaviour. Similar results and conclusions were reached in [4,21].

3.4.4. Mathematical Multivariate Models

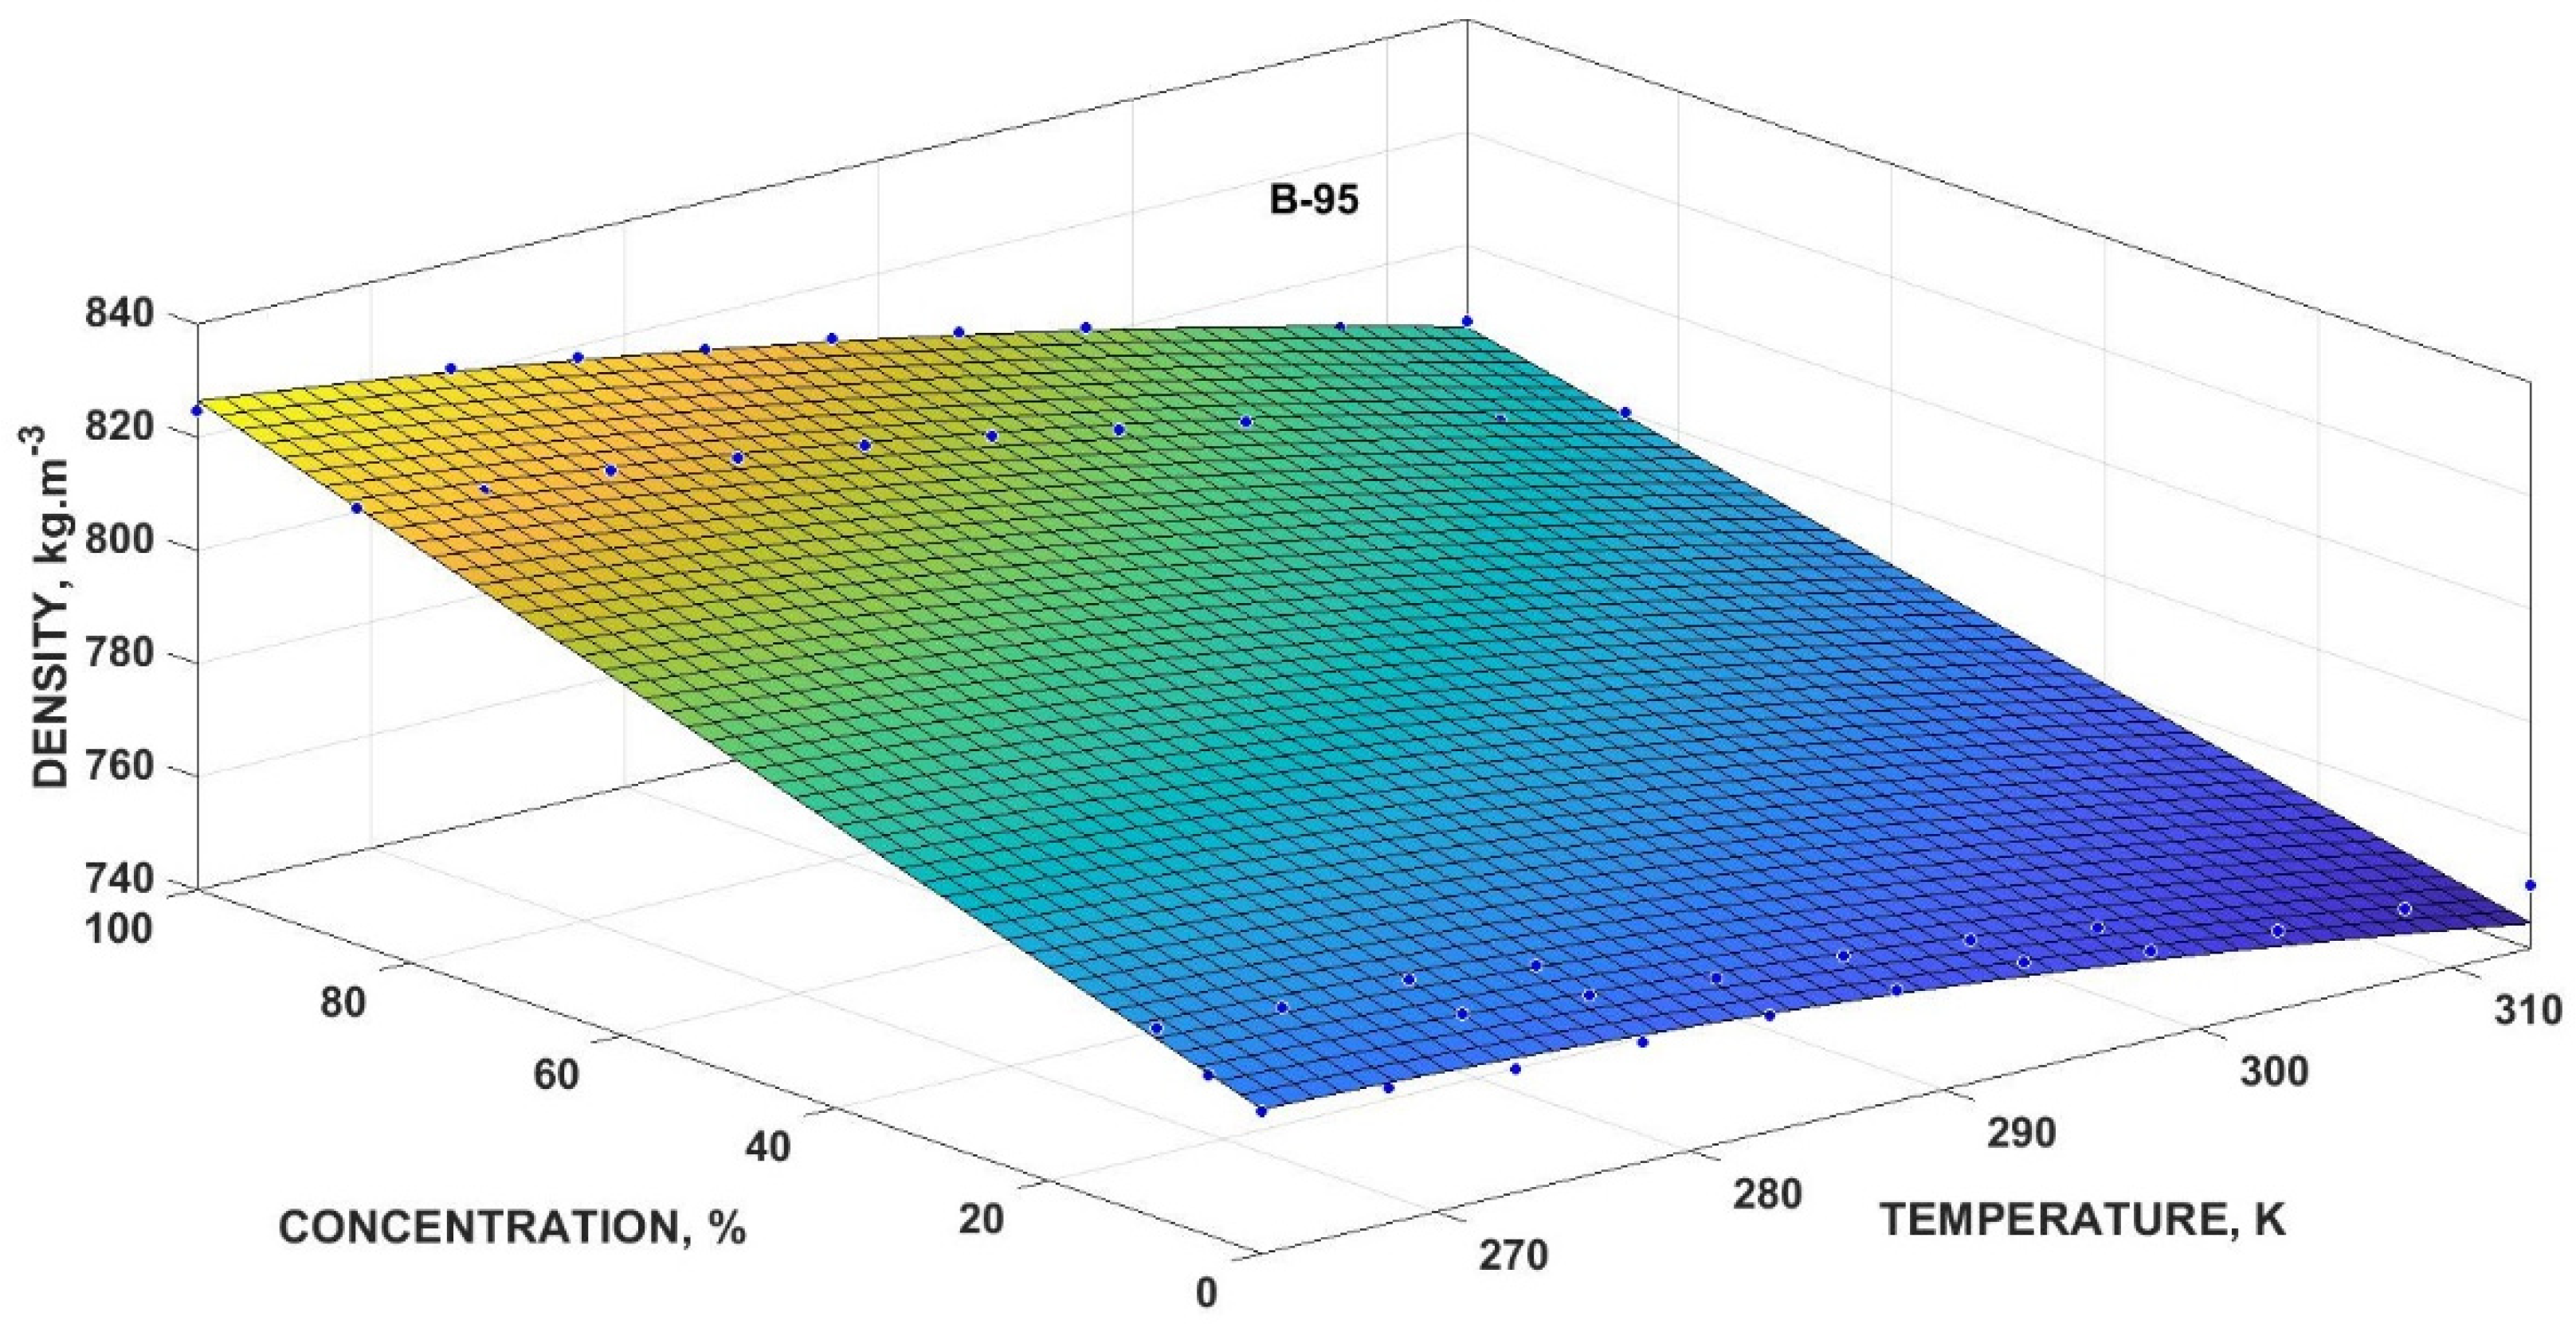
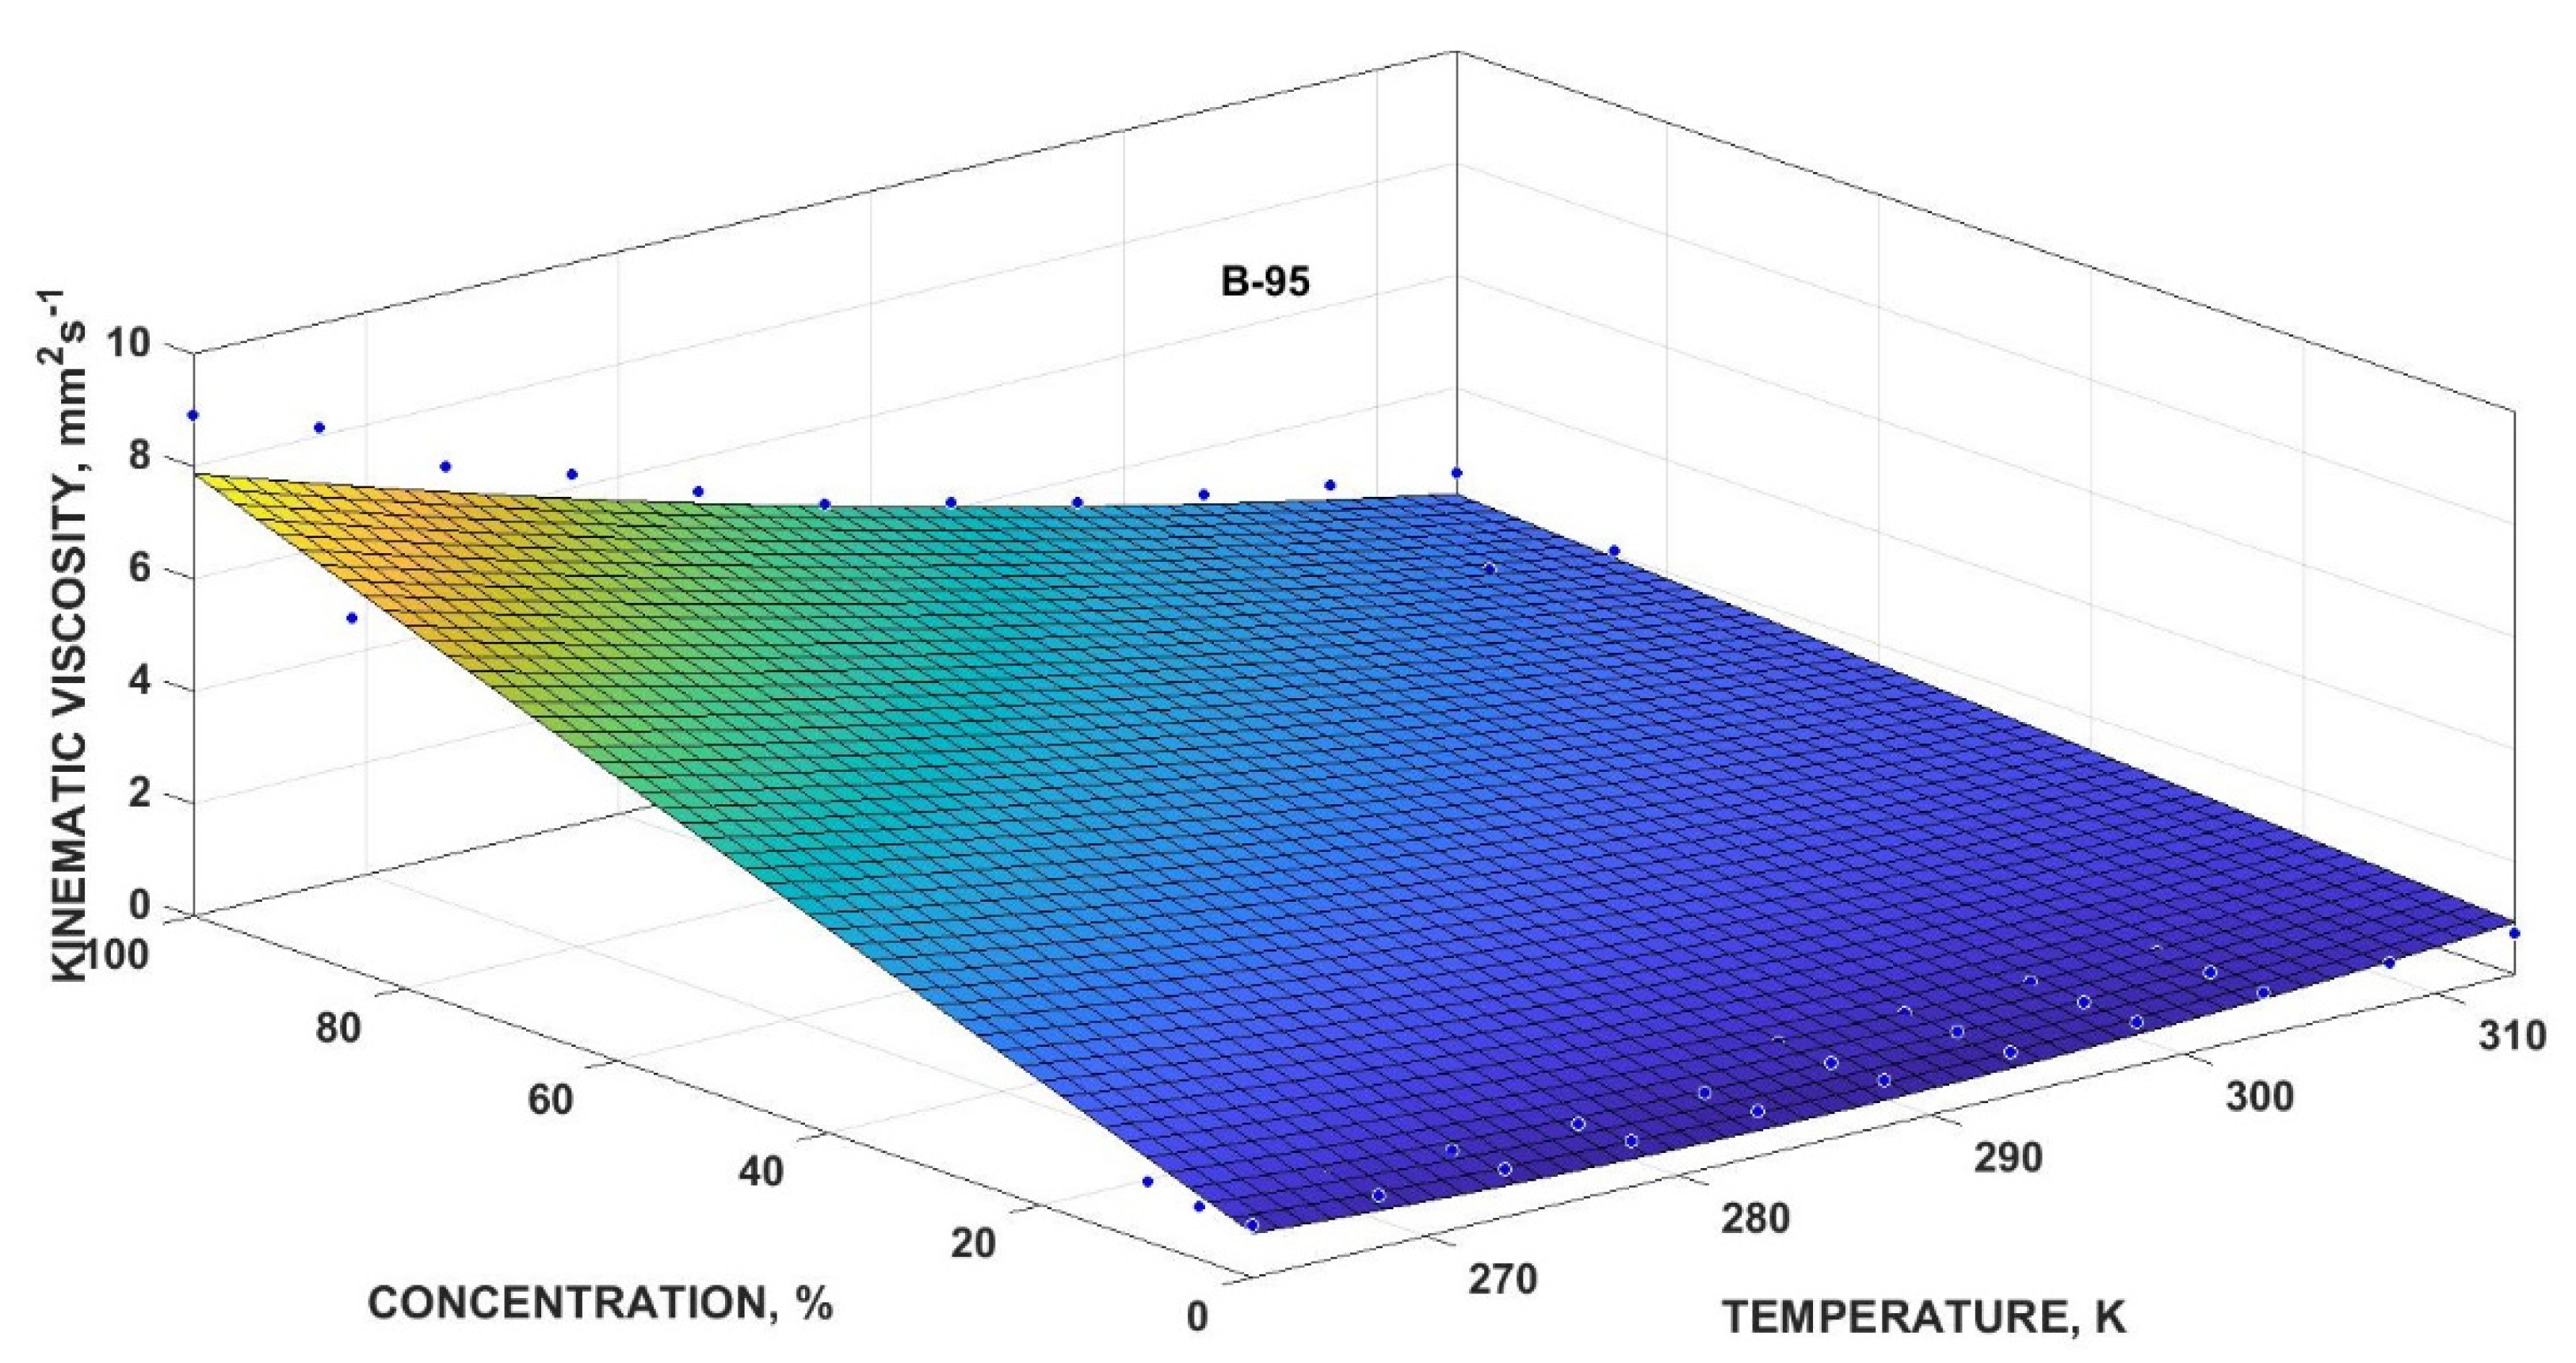
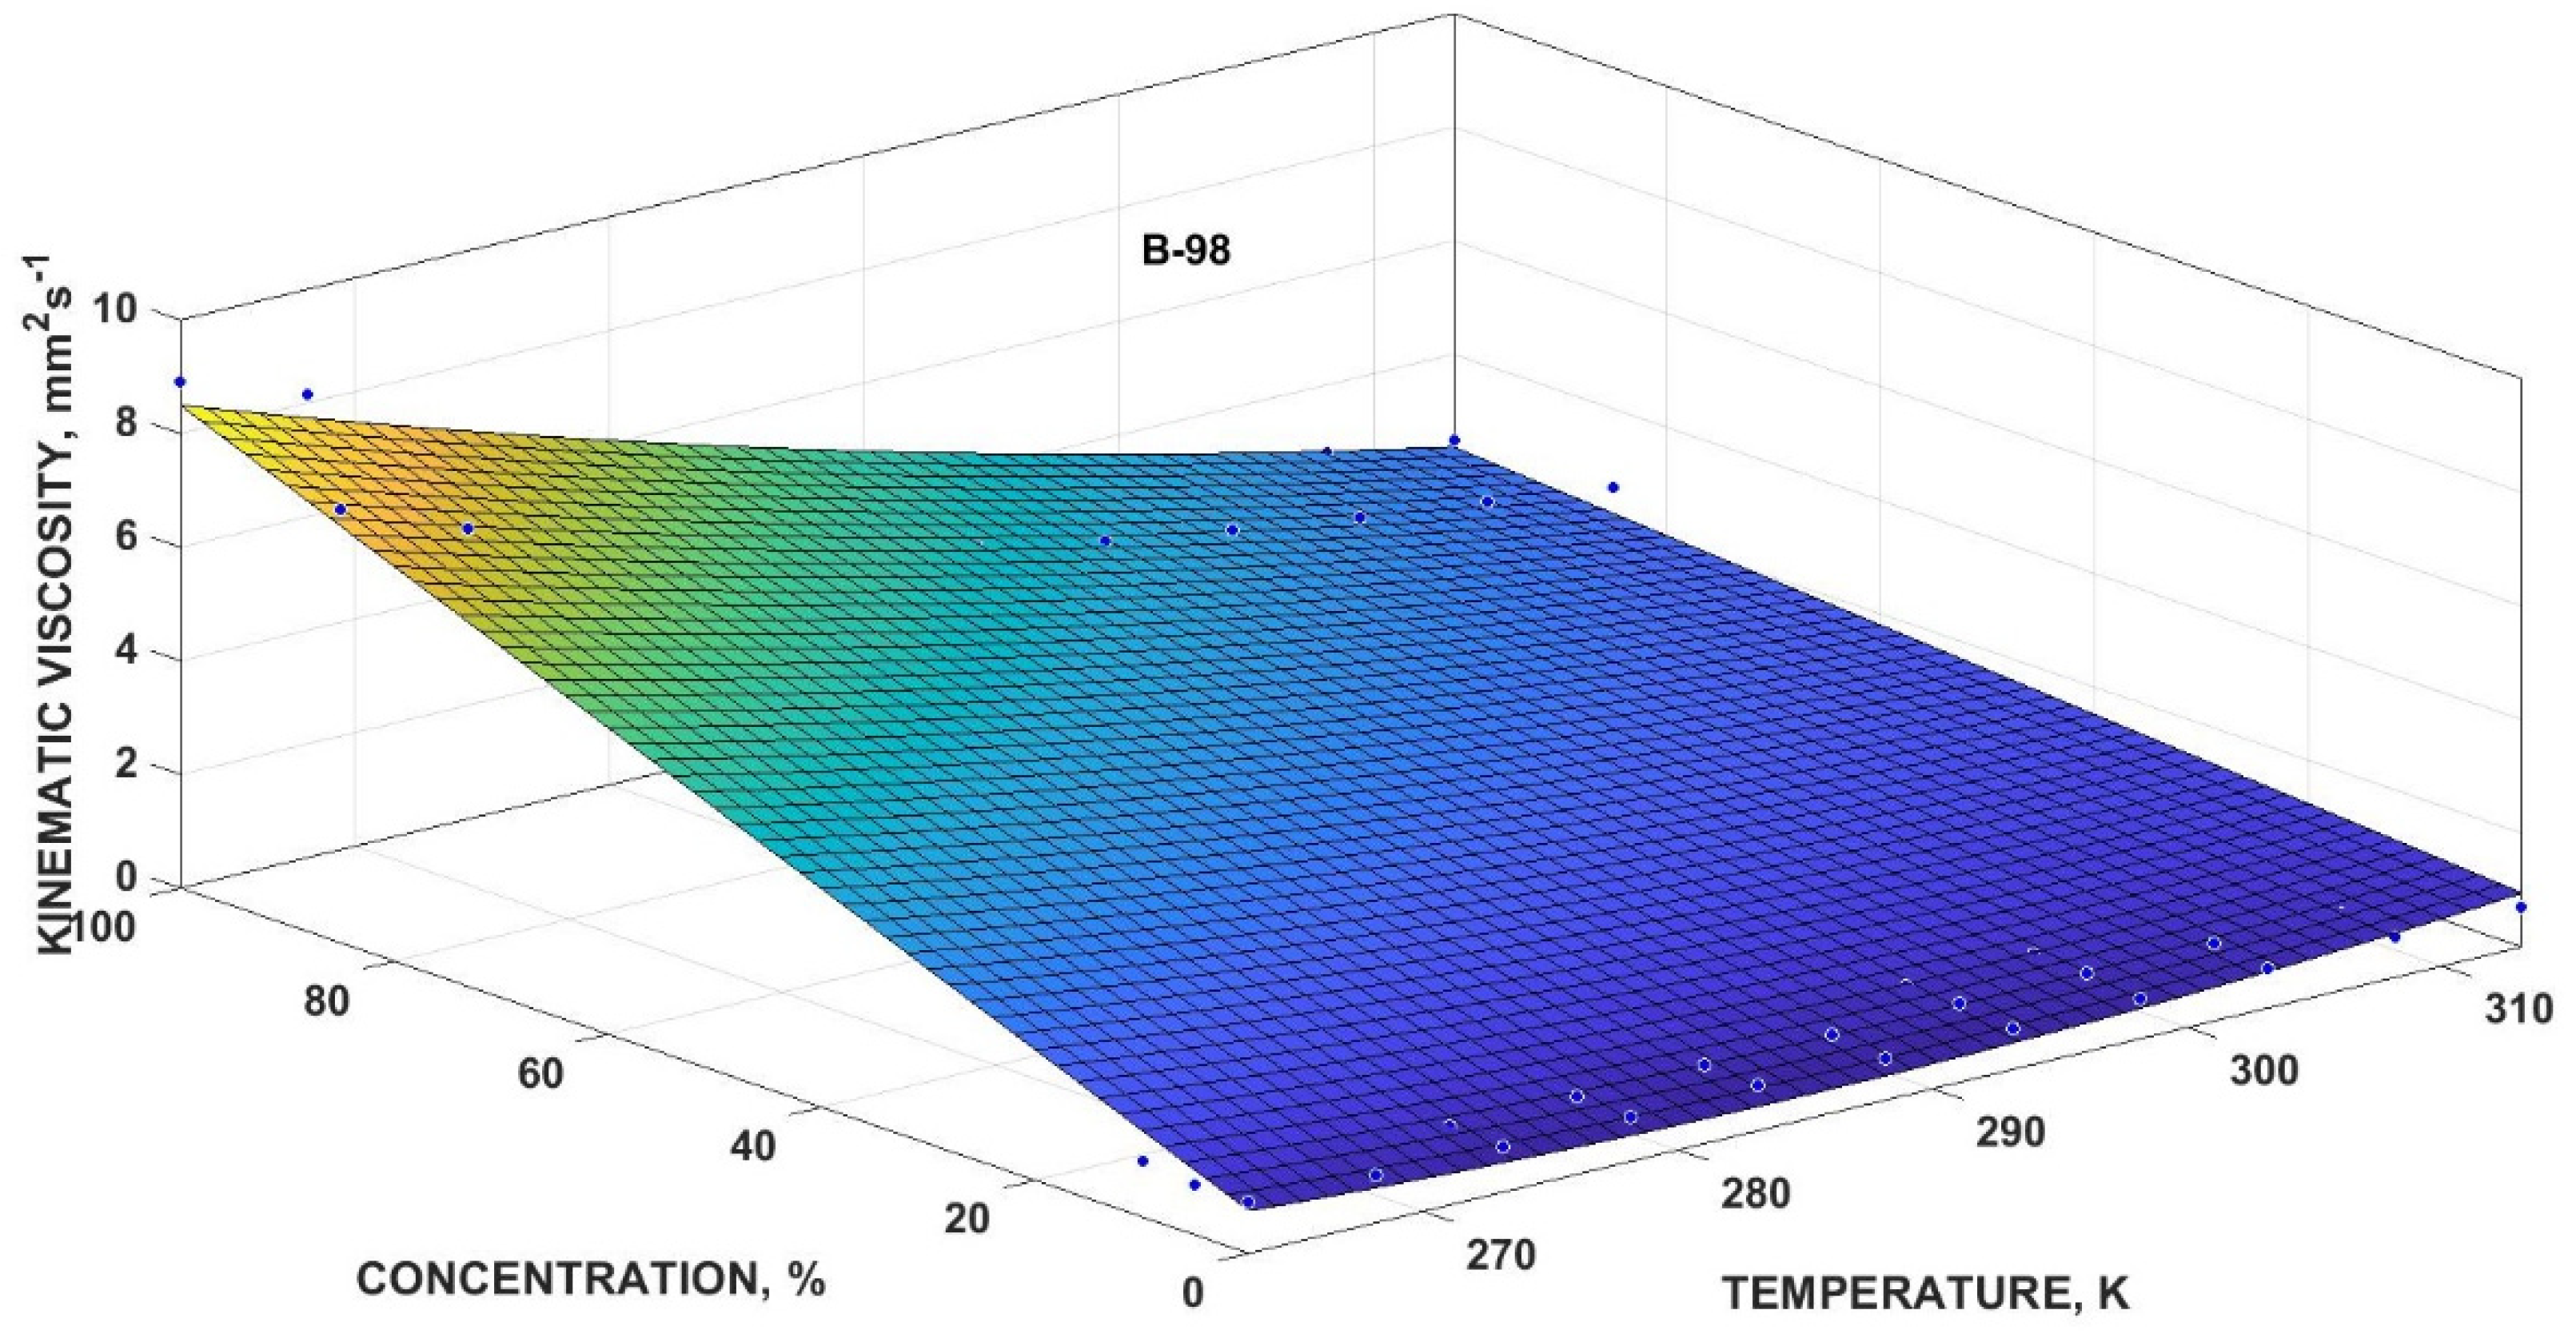
The created three-dimensional mathematical multivariate polynomial models (see Equations (11) and (12)) have a significant application potential, because it is possible to accurately calculate the exact value of the volumetric mass density or the kinematic viscosity for the whole temperatures range from −10 to 40 °C (~263–313 K) and with any possible concentration of the biobutanol in the gasoline (RON 95 and RON 98) with the obtained coefficients (Table 12). The volumetric mass density and kinematic viscosity values obtained by extrapolation from these multivariate models can also be used with a certain degree of accuracy.
From the three-dimensional graphs using the colour scale, it can be clearly seen that the lowest values (blue colour) of the volumetric mass density (Figure 8 and Figure 9) and kinematic viscosity (Figure 10 and Figure 11) are reached in the biobutanol-gasoline blends with a concentration below about 40 vol.% and at temperatures higher than 0 °C (~273 K); on the contrary, the highest values (yellow colour) were reached by the biobutanol-gasoline blends above 80 vol.% of biobutanol and at low temperatures (<0 °C). The temperature dependence of the volumetric mass density or the kinematic viscosity and the effect of the biobutanol concentration in gasoline (RON 95 and RON 98) prove a nonlinear dependence like with the bioethanol-gasoline behaviour described in [19,25].

4. Conclusions

It must be stated that the obtained results, especially the coefficients of the mathematical models, are usable for the advanced numerical modelling of flow properties of biobutanol-gasoline blends; for example, the modelling of the pressure drop, shear stress, maximum and mean flow velocity, volume and mass flow, two-dimensional and three-dimensional velocity profiles, friction factor, laminar and turbulent flow (Reynolds number), etc.
The results are certainly applicable in industrial practice. For instance, the models with the coefficients could be used to set a car control unit, which would be able to evaluate the exact amount of fuel needed for injection into the combustion chamber according to the current concentration of the biobutanol in the gasoline (RON 95 and RON 98) and current temperature of the fuel, because, as this paper stated, these can affect the fuel volumetric mass density and the dynamic/kinematic viscosity.
It is appropriate to emphasise these research findings:
  • The RON 98 gasoline reaches higher values in the volumetric mass density than the RON 95 gasoline.
  • The volumetric mass density of the biobutanol-gasoline blends almost linearly (coefficient of exponential model b → 0) decreases with an increasing temperature for all concentrations.
  • The RON 98 gasoline reaches lower values in the dynamic and kinematic viscosity than the RON 95 gasoline.
  • The dynamic and kinematic viscosity of the biobutanol-gasoline blends nonlinear decreases with an increasing temperature for all concentrations.
  • The biobutanol-gasoline blends with a higher biobutanol content have higher dynamic and kinematic viscosity values.
  • The dynamic and kinematic viscosity of the biobutanol-gasoline blends with a content up to 10 vol.% of biobutanol is almost the same as the dynamic and kinematic viscosity of the RON 95 and RON 98 gasolines without a biocomponent (p < 0.05).
  • The dynamic and kinematic viscosity of the biobutanol-gasoline blends with a content up to 85 vol.% of biobutanol is similar to the dynamic and kinematic viscosity of the pure biobutanol (p < 0.05).

Author Contributions

Conceptualization, D.T. and V.K.; methodology, D.T., A.P., and V.K.; software, A.P.; validation, D.B.N., A.W.; formal analysis, D.T.; investigation, D.T.; resources, V.K.; data curation, D.B.; writing—original draft preparation, D.T.; writing—review and editing, D.B., D.B.N., and A.W.; supervision, V.K.; project administration, V.K.; funding acquisition, D.T. and V.K. All authors have read and agreed to the published version of the manuscript.

Funding

This research was funded by the Internal Grant Agency of the Faculty of AgriSciences no. AF-IGA-2020-IP060.

Institutional Review Board Statement

Not applicable.

Informed Consent Statement

Not applicable.

Data Availability Statement

Data is contained within the article.

Acknowledgments

Authors would like to acknowledge the LSU AgCenter for the proofreading and scientific collaboration on this manuscript.

Conflicts of Interest

The authors declare no conflict of interest. The funders had no role in the design of the study; in the collection, analyses, or interpretation of data; in the writing of the manuscript, or in the decision to publish the results.

Appendix A

Table A1. Values of volumetric mass density of biobutanol-gasoline (RON 95) blends (mean ± Scheme 5).
Temperature (°C)Temperature (K)Volumetric Mass Density RON 95 (kg∙m−3)
B0B5B10B85B100
−10263.15765.1 ± 1.49768.3 ± 1.63773.5 ± 1.41817.1 ± 1.62824.6 ± 1.60
−5268.15763.8 ± 1.56766.7 ± 1.53771.5 ± 1.49814.8 ± 1.81822.8 ± 1.50
0273.15761.9 ± 1.27768.4 ± 1.40771.1 ± 1.52813.1 ± 1.58821.3 ± 1.31
5278.15761.1 ± 1.42766.2 ± 1.48768.3 ± 1.50809.7 ± 1.58817.9 ± 1.60
10283.15760.6 ± 1.61764.0 ± 1.61765.2 ± 1.45806.5 ± 1.81813.9 ± 1.27
15288.15759.6 ± 1.53762.4 ± 1.52762.6 ± 1.39803.0 ± 1.83810.5 ± 1.41
20293.15759.0 ± 1.48759.7 ± 1.38760.0 ± 1.61798.7 ± 1.53806.3 ± 1.44
25298.15755.8 ± 1.42756.5 ± 1.29756.6 ± 1.41794.6 ± 1.57801.7 ± 1.47
30303.15753.8 ± 1.29750.3 ± 1.47751.3 ± 1.48787.9 ± 1.55794.2 ± 1.78
35308.15752.3 ± 1.25747.2 ± 1.62749.4 ± 1.37784.2 ± 1.58790.8 ± 1.52
40313.15751.1 ± 1.55744.2 ± 1.60747.6 ± 1.24780.2 ± 1.48786.6 ± 1.57
Table A2. Values of volumetric mass density of biobutanol-gasoline (RON 98) blends (mean ± standard deviation, N = 5).
Temperature (°C)Temperature (K)Volumetric Mass Density RON 98 (kg∙m−3)
B0B5B10B85B100
−10263.15776.1 ± 1.63785.1 ± 1.40786.3 ± 1.33820.6 ± 1.42824.6 ± 1.60
−5268.15775.6 ± 1.41784.4 ± 1.37784.7 ± 1.36818.3 ± 1.37822.8 ± 1.50
0273.15775.0 ± 1.26783.3 ± 1.35783.9 ± 1.27816.5 ± 1.39821.3 ± 1.31
5278.15772.1 ± 1.37779.9 ± 1.36781.3 ± 1.38812.7 ± 1.49817.9 ± 1.60
10283.15769.6 ± 1.40777.0 ± 1.57778.7 ± 1.40809.5 ± 1.44813.9 ± 1.27
15288.15765.6 ± 1.29773.8 ± 1.47775.9 ± 1.45806.0 ± 1.44810.5 ± 1.41
20293.15763.2 ± 1.12770.1 ± 1.38771.9 ± 1.36802.0 ± 1.48806.3 ± 1.44
25298.15760.4 ± 1.17766.6 ± 1.19768.7 ± 1.27797.9 ± 1.50801.7 ± 1.47
30303.15754.9 ± 1.35760.7 ± 1.29763.2 ± 1.43791.5 ± 1.46794.2 ± 1.78
35308.15752.2 ± 1.40757.3 ± 1.27760.1 ± 1.30787.6 ± 1.40790.8 ± 1.52
40313.15749.4 ± 1.43753.6 ± 1.33756.8 ± 1.32783.4 ± 1.42786.6 ± 1.57
Table A3. Values of dynamic viscosity of biobutanol-gasoline (RON 95) blends (mean ± standard deviation, N = 20).
Temperature (°C)Temperature (K)Dynamic Viscosity RON 95 (mPa∙s)
B0B5B10B85B100
−10263.150.72 ± 0.025 j,k0.73 ± 0.021 m0.83 ± 0.010 o5.12 ± 0.026 ω7.34 ± 0.025 λ
−5268.150.70 ± 0.018 d,e,f,g,h,i0.71 ± 0.023 l0.78 ± 0.010 n4.50 ± 0.023 τ6.71 ± 0.027 δ
0273.150.64 ± 0.035 d,e,f0.66 ± 0.014 k0.73 ± 0.017 m3.88 ± 0.017 ρ5.69 ± 0.025 η
5278.150.61 ± 0.035 d,e,f0.63 ± 0.019 d,e0.69 ± 0.015 l3.45 ± 0.017 z5.11 ± 0.031 ω
10283.150.60 ± 0.018 e,f,g,h,i,j0.63 ± 0.015 d,e,f,g0.64 ± 0.012 i,j,k3.05 ± 0.017 x4.38 ± 0.016 π
15288.150.61 ± 0.032 d,e,f0.62 ± 0.013 d,e,f0.64 ± 0.010 h,i,j2.75 ± 0.015 v3.76 ± 0.012 β
20293.150.59 ± 0.025 c,d0.62 ± 0.016 d,e,f,g,h0.64 ± 0.014 f,g,h,i,j2.47 ± 0.007 t3.32 ± 0.010 y
25298.150.58 ± 0.031 b,c0.62 ± 0.015 d,e,f0.64 ± 0.010 g,h,i,j2.21 ± 0.011 s2.88 ± 0.010 w
30303.150.57 ± 0.024 b0.60 ± 0.015 c,d0.63 ± 0.012 e,f,g,h,i,j1.97 ± 0.010 r2.53 ± 0.009 u
35308.150.56 ± 0.021 b0.58 ± 0.021 b0.62 ± 0.010 d,e,f1.79 ± 0.010 q2.21 ± 0.010 s
40313.150.54 ± 0.018 a0.57 ± 0.015 b0.61 ± 0.013 d,e1.61 ± 0.012 p1.95 ± 0.010 r
The same indices indicate that no statistically significant difference was demonstrated between the respective dynamic viscosity at the significance level of p = 0.95.
Table A4. Values of dynamic viscosity of biobutanol-gasoline (RON 98) blends (mean ± standard deviation, N = 20).
Temperature (°C)Temperature (K)Dynamic Viscosity RON 98 (mPa∙s)
B0B5B10B85B100
−10263.150.69 ± 0.027 i0.70 ± 0.010 k0.77 ± 0.011 m4.89 ± 0.019 τ7.34 ± 0.025 λ
−5268.150.65 ± 0.029 d,e0.68 ± 0.010 j0.74 ± 0.010 l4.39 ± 0.016 π6.71 ± 0.027 δ
0273.150.62 ± 0.030 d,e,f0.65 ± 0.008 f,g,h,i0.69 ± 0.006 j,k3.81 ± 0.011 ρ5.69 ± 0.025 η
5278.150.60 ± 0.029 e,f,g,h,i0.65 ± 0.007 h,i0.65 ± 0.007 f,g,h,i3.28 ± 0.010 y5.11 ± 0.031 ω
10283.150.61 ± 0.031 d,e0.65 ± 0.008 h,i0.63 ± 0.009 d,e2.92 ± 0.010 x4.38 ± 0.016 π
15288.150.57 ± 0.030 e,f,g0.65 ± 0.004 g,h,i0.63 ± 0.010 d,e,f2.62 ± 0.013 v3.76 ± 0.012 β
20293.150.55 ± 0.022 d,e,f0.65 ± 0.008 h,i0.64 ± 0.010 e,f,g,h2.31 ± 0.012 t3.32 ± 0.010 z
25298.150.54 ± 0.026 d,e0.63 ± 0.007 d,e0.64 ± 0.010 e,f,g,h2.09 ± 0.010 r2.88 ± 0.010 w
30303.150.53 ± 0.035 a,b0.63 ± 0.006 d,e0.63 ± 0.006 d,e1.88 ± 0.011 p2.53 ± 0.009 u
35308.150.53 ± 0.028 a0.61 ± 0.008 b,c0.63 ± 0.004 d,e1.69 ± 0.010 o2.21 ± 0.010 s
40313.150.52 ± 0.018 a0.60 ± 0.009 a,b0.62 ± 0.010 c,d1.50 ± 0.008 n1.95 ± 0.010 q
The same indices indicate that no statistically significant difference was demonstrated between the respective dynamic viscosity at the significance level of p = 0.95.
Table A5. Values of kinematic viscosity of biobutanol-gasoline (RON 95) blends (mean ± standard deviation, N = 20).
Temperature (°C)Temperature (K)Kinematic Viscosity RON 95 (mm2∙s−1)
B0B5B10B85B100
−10263.150.94 ± 0.006 l,m,n0.96 ± 0.024 n1.07 ± 0.011 p6.27 ± 0.019 τ 8.90 ± 0.016 β
−5268.150.92 ± 0.012 k,l0.93 ± 0.024 l,m1.01 ± 0.011 o5.52 ± 0.015 θ 8.16 ± 0.021 ρ
0273.150.84 ± 0.021 i,j0.86 ± 0.011 j0.95 ± 0.020 m,n4.77 ± 0.012 δ6.93 ± 0.019 π
5278.150.80 ± 0.026 e,f 0.81 ± 0.012 e,f0.90 ± 0.018 k4.26 ± 0.013 λ6.25 ± 0.015 τ
10283.150.79 ± 0.027 d,e0.81 ± 0.011 e,f0.84 ± 0.014 g,h,i,j3.78 ± 0.013 y5.38 ± 0.016 ω
15288.150.80 ± 0.021 e,f0.81 ± 0.012 e,f0.84 ± 0.012 h,i,j3.45 ± 0.011 w4.63 ± 0.022 η
20293.150.78 ± 0.025 c,d0.82 ± 0.014 f,g,h0.84 ± 0.017 g,h,i3.09 ± 0.003 u4.12 ± 0.017 z
25298.150.77 ± 0.020 b,c,d0.82 ± 0.012 f,g0.85 ± 0.017 i,j2.78 ± 0.008 t3.59 ± 0.020 x
30303.150.76 ± 0.015 b,c0.80 ± 0.012 e,f0.84 ± 0.014 g,h,i2.50 ± 0.008 s3.18 ± 0.009 v
35308.150.74 ± 0.016 b0.78 ± 0.025 c,d0.83 ± 0.012 f,g,h,i2.28 ± 0.008 r2.80 ± 0.015 t
40313.150.72 ± 0.013 a0.77 ± 0.012 b,c,d0.82 ± 0.016 f,g2.06 ± 0.011 q2.48 ± 0.021 s
The same indices indicate that no statistically significant difference was demonstrated between the respective kinematic viscosity at the significance level of p = 0.95.
Table A6. Values of kinematic viscosity of biobutanol-gasoline (RON 98) blends (mean ± standard deviation, N = 20).
Temperature (°C)Temperature (K)Kinematic Viscosity RON 98 (mm2∙s−1)
B0B5B10B85B100
−10263.150.89 ± 0.010 j,k0.89 ± 0.011 n0.98 ± 0.012 p 5.96 ± 0.013 τ8.90 ± 0.016 β
−5268.150.84 ± 0.006 c,d,e,f0.87 ± 0.011 l,m0.94 ± 0.011 o5.37 ± 0.011 θ8.16 ± 0.021 ρ
0273.150.80 ± 0.008 d,e,f,g0.83 ± 0.009 d,e,f,g,h,i0.88 ± 0.006 m,n4.67 ± 0.006 ω6.93 ± 0.019 π
5278.150.78 ± 0.012 g,h,i,j,k0.83 ± 0.008 h,i,j,k0.83 ± 0.008 e,f,g,h,i,j4.04 ± 0.005 λ6.25 ± 0.015 τ
10283.150.79 ± 0.014 d,e,f,g0.84 ± 0.009 i,j,k0.81 ± 0.010 b,c,d,e3.61 ± 0.005 z5.38 ± 0.016 ω
15288.150.75 ± 0.012 g,h,i,j,k0.84 ± 0.004 i,j,k0.81 ± 0.011 d,e,f,g3.25 ± 0.010 y4.63 ± 0.022 η
20293.150.72 ± 0.013 e,f,g,h,i,j0.84 ± 0.009 k,l0.83 ± 0.012 f,g,h,i,j2.88 ± 0.010 w4.12 ± 0.017 z
25298.150.71 ± 0.013 d,e,f,g,h,i,j0.82 ± 0.008 d,e,f,g,h0.83 ± 0.011 g,h,i,j,k2.62 ± 0.008 u3.59 ± 0.020 x
30303.150.70 ± 0.011 a,b0.83 ± 0.007 e,f,g,h,i,j0.83 ± 0.006 d,e,f,g,h,i2.38 ± 0.010 s3.18 ± 0.009 v
35308.150.71 ± 0.009 a0.81 ± 0.009 b,c,d 0.83 ± 0.004 e,f,g,h,i,j2.15 ± 0.008 r2.80 ± 0.015 t
40313.150.69 ± 0.009 a0.79 ± 0.011 a,b,c, 0.81 ± 0.012 d,e,f,g1.92 ± 0.007 q2.48 ± 0.021 s
The same indices indicate that no statistically significant difference was demonstrated between the respective kinematic viscosity at the significance level of p = 0.95.

References

  1. Pereira, L.G.; Chagas, M.F.; Dias, M.O.S.; Cavalett, O.; Bonomi, A. Life cycle assessment of butanol production in sugarcane biorefineries in Brazil. J. Clean. Prod. 2015, 96, 557–568. [Google Scholar] [CrossRef]
  2. Arshad, M.; Zia, M.A.; Shah, F.A.; Ahmad, M. An overview of biofuel. In Perspectives on Water Usage for Biofuels Production; Springer: Cham, Switzerland, 2018; pp. 1–37. [Google Scholar]
  3. Kokkinos, N.C.; Nikolaou, N.; Psaroudakis, N.; Mertis, K.; Mitkidou, S.; Mitropoulos, A.C. Two-step conversion of LLCN olefins to strong anti-knocking alcohol mixtures catalysed by Rh, Ru/TPPTS complexes in aqueous media. Catal. Today 2015, 247, 132–138. [Google Scholar] [CrossRef]
  4. Hönig, V.; Kotek, M.; Orsák, M.; Hromádko, J. Use of biobutanol in gasoline engines. Listy Cukrov. Řepařské 2015, 131, 311–315. [Google Scholar]
  5. Thangavelu, S.K.; Ahmed, A.S.; Ani, F.N. Review on bioethanol as alternative fuel for spark ignition engines. Renew. Sustain. Energy Rev. 2016, 56, 820–835. [Google Scholar] [CrossRef]
  6. Marri, V.B.; Kotha, M.M.; Gaddale, A.P.R. Butanol and pentanol: The promising biofuels for CI engines—A review. Renew. Sustain. Energy Rev. 2017, 78, 1068–1088. [Google Scholar]
  7. Festel, G.W. Biofuels—Economic aspects. Chem. Eng. Technol. 2008, 31, 715–720. [Google Scholar] [CrossRef]
  8. Ramírez-Verduzco, L.F.; Rodríguez-Rodríguez, J.E.; Jaramillo-Jacob, A.D.R. Predicting cetane number, kinematic viscosity, density and higher heating value of biodiesel from its fatty acid methyl ester composition. Fuel 2012, 91, 102–111. [Google Scholar] [CrossRef]
  9. Han, X.; Yang, Z.; Wang, M.; Tjong, J.; Zheng, M. Clean combustion of n -butanol as a next generation biofuel for diesel engines. Appl. Energy 2017, 198, 347–359. [Google Scholar] [CrossRef]
  10. Pugazhendhi, A.; Mathimani, T.; Varjani, S.; Rene, E.R.; Kumar, G.; Kim, S.-H.; Ponnusamy, V.K.; Yoon, J.-J. Biobutanol as a promising liquid fuel for the future—Recent updates and perspectives. Fuel 2019, 253, 637–646. [Google Scholar] [CrossRef]
  11. Qureshi, N.; Meagher, M.; Huang, J.; Hutkins, R. Acetone butanol ethanol (ABE) recovery by pervaporation using silicalite-silicone composite membrane from fed-batch reactor of Clostridium acetobutylicum. J. Membr. Sci. 2001, 187, 93–102. [Google Scholar] [CrossRef]
  12. García, V.; Päkkilä, J.; Ojamo, H.; Muurinen, E.; Keiski, R.L. Challenges in biobutanol production: How to improve the efficiency? Renew. Sustain. Energy Rev. 2011, 15, 964–980. [Google Scholar] [CrossRef]
  13. Jin, C.; Yao, M.; Liu, H.; Lee, C.-F.F.; Ji, J. Progress in the production and application of n-butanol as a biofuel. Renew. Sustain. Energy Rev. 2011, 15, 4080–4106. [Google Scholar] [CrossRef]
  14. Tredici, M.R. Photobiology of microalgae mass cultures: Understanding the tools for the next green revolution. Biofuels 2010, 1, 143–162. [Google Scholar] [CrossRef]
  15. Kokkinos, N.; Lazaridou, A.; Stamatis, N.; Orfanidis, S.; Mitropoulos, A.C.; Christoforidis, A.; Nikolaou, N. Biodiesel production from selected microalgae strains and determina tion of its properties and combustion specific characteristics. J. Eng. Sci. Technol. Rev. 2015, 8, 1–6. [Google Scholar] [CrossRef]
  16. Hestekin, J.; Lopez, A.; Clausen, E.; Potts, T. Biobutanol. In Applications of Microbial Engineering, 1st ed.; Gupta, V.K., Schmoll, M., Maki, M., Tuohy, M., Mazutti, M.A., Eds.; CRC Press: Boca Raton, FL, USA, 2013; pp. 450–487. [Google Scholar]
  17. Rakopoulos, D.; Rakopoulos, C.; Giakoumis, E.; Dimaratos, A.; Kyritsis, D. Effects of butanol–diesel fuel blends on the performance and emissions of a high-speed DI diesel engine. Energy Convers. Manag. 2010, 51, 1989–1997. [Google Scholar] [CrossRef]
  18. Dimian, A.C.; Bildea, C.S.; Kiss, A.A. Bioethanol and biobutanol. In Applications in Design and Simulation of Sustainable Chemical Processes; Elsevier: Amsterdam, The Netherlands, 2019; pp. 285–327. [Google Scholar]
  19. Kumbár, V.; Dostál, P. Temperature dependence density and kinematic viscosity of petrol, bioethanol and their blends. Pak. J. Agric. Sci. 2014, 51, 175–179. [Google Scholar]
  20. Yilmaz, N. Temperature-dependent viscosity correlations of vegetable oils and biofuel–diesel mixtures. Biomass Bioenergy 2011, 35, 2936–2938. [Google Scholar] [CrossRef]
  21. Peterka, B.; Pexa, M.; Čedík, J.; Aleš, Z. The influence of biobutanol on performance parameters of mobile generator. Agron. Res. 2016, 14, 167–173. [Google Scholar]
  22. Rakopoulos, C.D.; Rakopoulos, D.C.; Giakoumis, E.G.; Kyritsis, D.C. The combustion ofn-butanol/diesel fuel blends and its cyclic variability in a direct injection diesel engine. Proc. Inst. Mech. Eng. Part A J. Power Energy 2011, 225, 289–308. [Google Scholar] [CrossRef]
  23. Qi, D.; Lee, C. Combustion and emissions behaviour for ethanol–gasoline-blended fuels in a multipoint electronic fuel injection engine. Int. J. Sustain. Energy 2014, 35, 1–16. [Google Scholar] [CrossRef]
  24. Hönig, V.; Pexa, M.; Mařík, J.; Linhart, Z.; Zeman, P. Biobutanol standardizing waste cooking oil as a biofuel. Pol. J. Environ. Stud. 2017, 26, 69–78. [Google Scholar] [CrossRef]
  25. Kumbár, V.; Polcar, A.; Votava, J. Physical and mechanical properties of bioethanol and gasoline blends. Listy Cukrov. Řepařské 2015, 131, 112–116. [Google Scholar]
  26. Peleg, M. Temperature–viscosity models reassessed. Crit. Rev. Food Sci. Nutr. 2018, 58, 2663–2672. [Google Scholar] [CrossRef]
  27. Peleg, M.; Normand, M.D.; Corradini, M.G. The arrhenius equation revisited. Crit. Rev. Food Sci. Nutr. 2012, 52, 830–851. [Google Scholar] [CrossRef] [PubMed]
  28. Trávníček, P.; Valach, M.; Hlaváčová, Z.; Mareček, J.; Vítěz, T.; Junga, P. Selected physical properties of liquid biofuels. Res. Agric. Eng. 2013, 59, 121–127. [Google Scholar] [CrossRef] [Green Version]
  29. Hlavac, P.; Božiková, M.; Cviklovič, V. Dynamic viscosity and activation energy of wort during fermentation and storing. Acta Technol. Agric. 2016, 19, 6–9. [Google Scholar]
  30. Hlaváčová, Z.; Božiková, M.; Hlaváč, P.; Regrut, T.; Ardonová, V. Selected physical properties of various diesel blends. Int. Agrophys. 2018, 32, 93–100. [Google Scholar] [CrossRef]
  31. Barabás, I. Predicting the temperature dependent density of biodiesel–diesel–bioethanol blends. Fuel 2013, 109, 563–574. [Google Scholar] [CrossRef]
  32. Poling, B.E.; Prausnitz, J.M.; O’Connell, J.P. Properties of Gases and Liquids, 5th ed.; McGraw-Hill Education: New York, NY, USA, 2001; pp. 154–196. [Google Scholar]
  33. Tesfa, B.; Mishra, R.; Gu, F.; Powles, N. Prediction models for density and viscosity of biodiesel and their effects on fuel supply system in CI engines. Renew. Energy 2010, 35, 2752–2760. [Google Scholar] [CrossRef] [Green Version]
  34. Olanrewaju, A.A.; Hasan, S.W.; Abu-Zahra, M.R.M. Rheological and physicochemical characterization of UAE crude oil. Pet. Sci. Technol. 2016, 34, 659–664. [Google Scholar] [CrossRef]
  35. Kumbár, V.; Votava, J. Differences in engine oil degradation in spark-ignition and compres-sion-ignition engine. Eksploat. Niezawodn. Maint. Reliab. 2014, 16, 622–628. [Google Scholar]
  36. Brandão, L.F.P.; Suarez, P.A.Z. Determination of the alternative butanol/gasoline and butanol/diesel fuel blends heats of combustion by a heat-loss compensated semi-microcalorimeter. J. Therm. Anal. Calorim. 2018, 132, 1953–1960. [Google Scholar] [CrossRef]
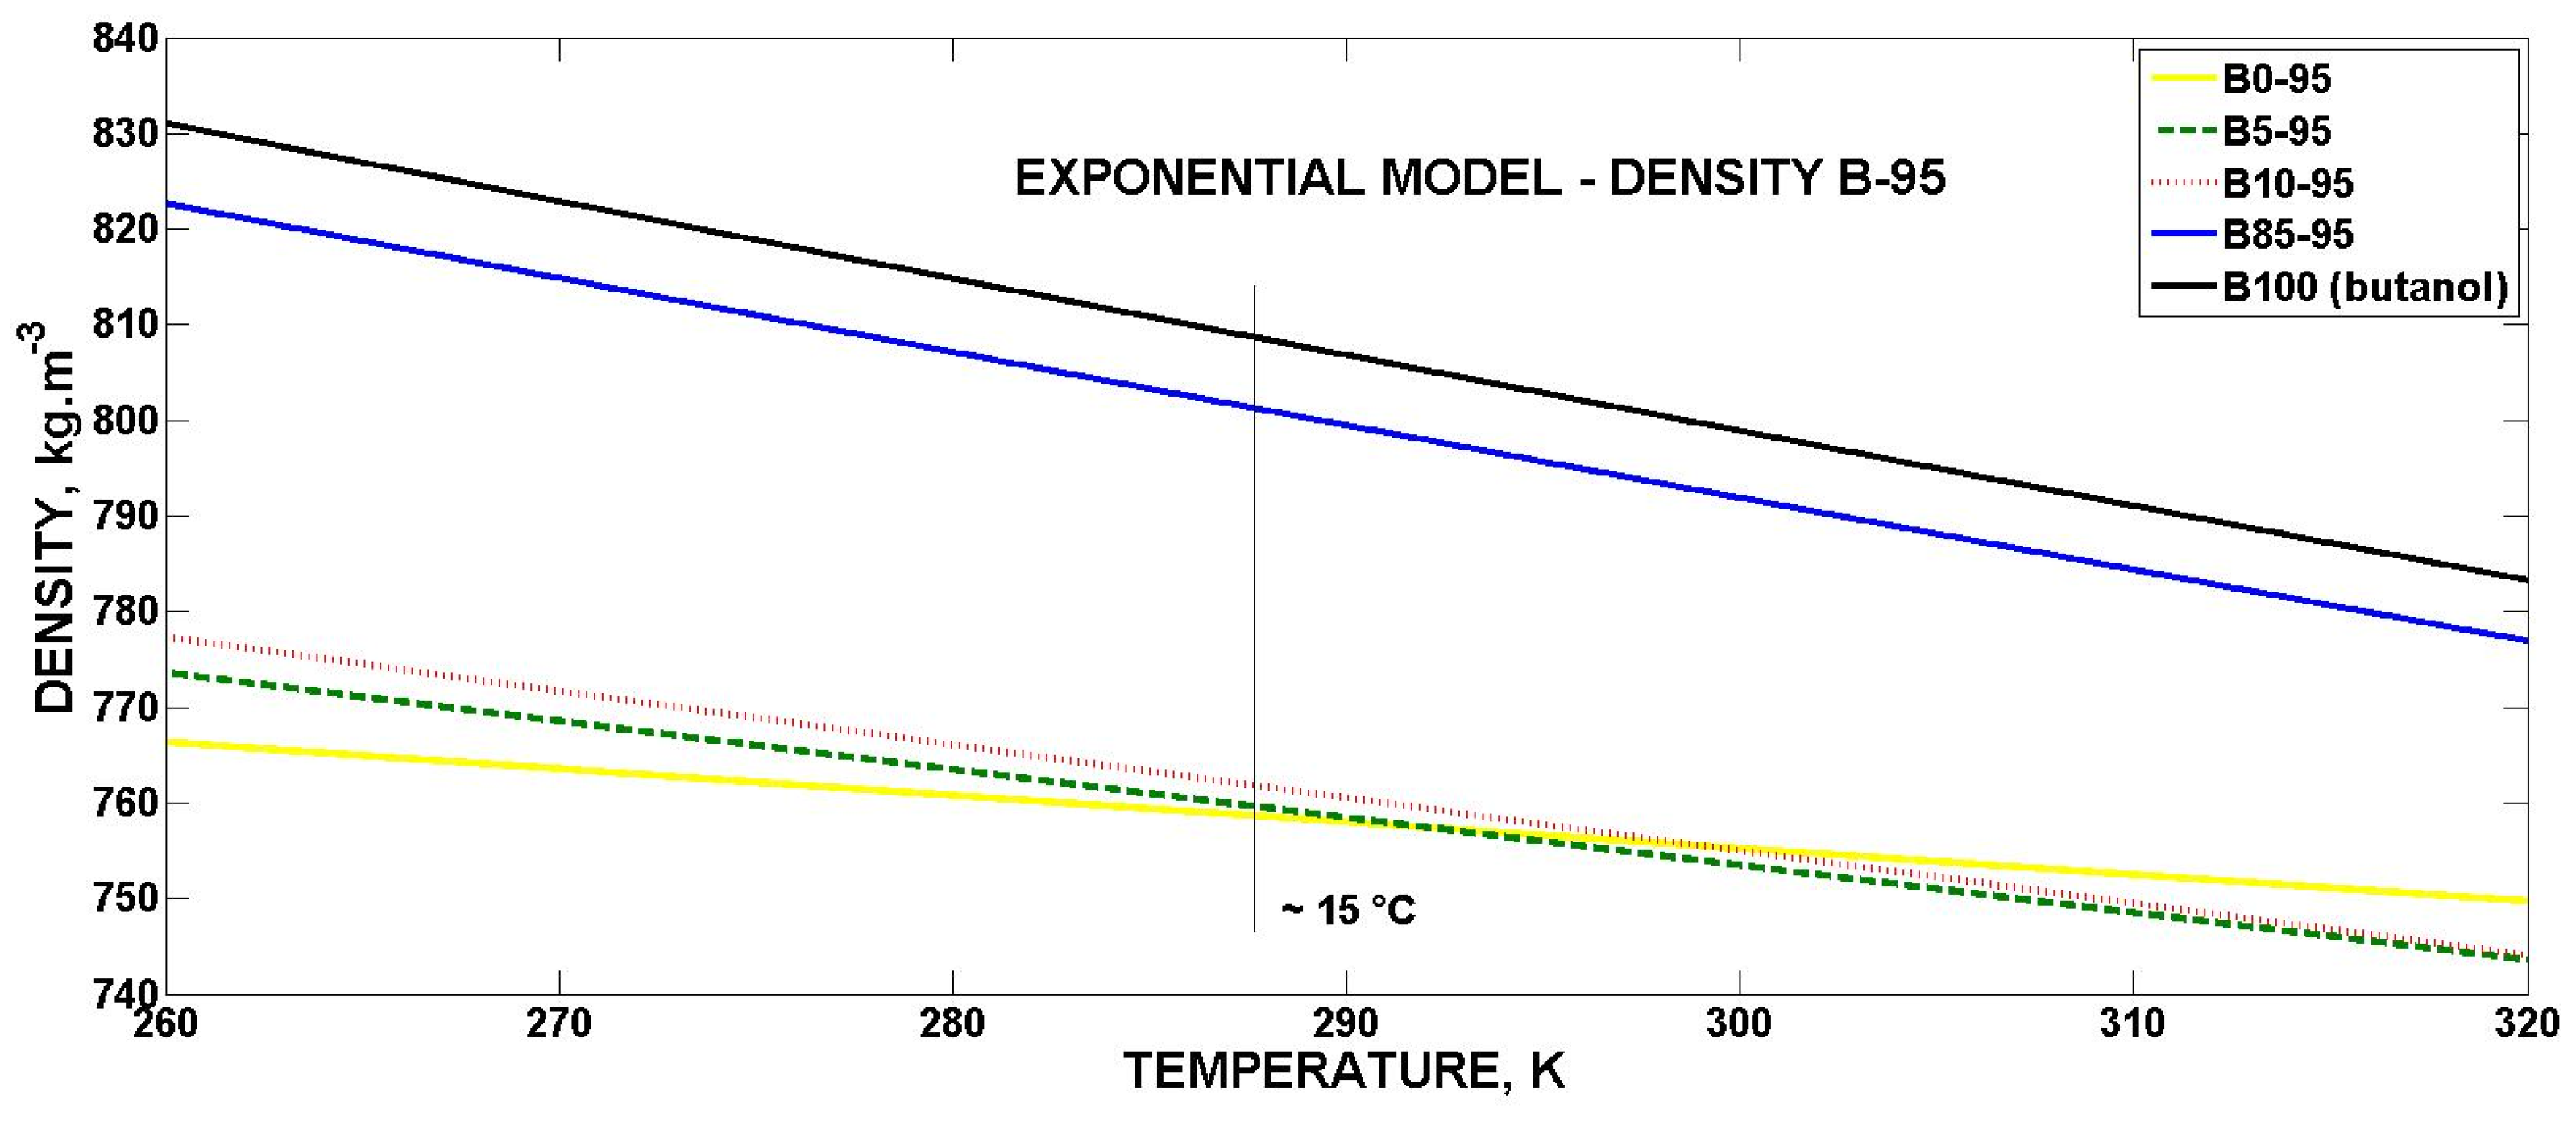
Figure 1. Exponential model for volumetric mass density of biobutanol-gasoline (RON 95) blends.
Applsci 11 03172 g001
Figure 2. Exponential model for volumetric mass density of biobutanol-gasoline (RON 98) blends.
Applsci 11 03172 g002
Figure 3. Mathematical models graph for kinematic viscosity of gasoline (RON 95). Experimental data are presented as the mean (N = 20) for selected temperatures.
Applsci 11 03172 g003
Figure 4. Mathematical models graph for kinematic viscosity of gasoline (RON 98). Experimental data are presented as the mean (N = 20) for selected temperatures.
Applsci 11 03172 g004
Figure 5. Mathematical models graph for kinematic viscosity of biobutanol (B100). Experimental data are presented as the mean (N = 20) for selected temperatures.
Applsci 11 03172 g005
Figure 6. Vogel model graph for kinematic viscosity of biobutanol-gasoline (RON 95) blends.
Applsci 11 03172 g006
Figure 7. Vogel model graph for kinematic viscosity of biobutanol-gasoline (RON 98) blends.
Applsci 11 03172 g007
Figure 8. Three-dimensional graph created using multivariate polynomial model for volumetric mass density of biobutanol-gasoline (RON 95) blends. Experimental data are presented as the mean (N = 5) for selected temperatures and concentrations.
Applsci 11 03172 g008
Figure 9. Three-dimensional graph created using multivariate polynomial model for volumetric mass density of biobutanol-gasoline (RON 98) blends. Experimental data are presented as the mean (N = 5) for selected temperatures and concentrations.
Applsci 11 03172 g009
Figure 10. Three-dimensional graph created using multivariate polynomial model for kinematic viscosity of biobutanol-gasoline (RON 95) blends. Experimental data are presented as the mean (N = 20) for selected temperatures and concentrations.
Applsci 11 03172 g010
Figure 11. Three-dimensional graph created using multivariate polynomial model for kinematic viscosity of biobutanol-gasoline (RON 98) blends. Experimental data are presented as the mean (N = 20) for selected temperatures and concentrations.
Applsci 11 03172 g011
Table 1. Composition of samples.
SampleVolume of BiobutanolVolume of Gasoline
B00%100%
B55%95%
B1010%90%
B8585%15%
B100100%0%
Table 2. Comparison of selected properties of fuels [22,23].
PropertyUnitGasolineBioethanolBiobutanol
Chemical formula C4 to C12C2H5OHC4H9OH
Molecular masskg·mol−11094674
Volumetric mass density (15 °C)kg·m−3720–775789814
Calorific valueMJ·kg−143.32933
Heat of vaporizationkJ·kg−1349918583
Octane number ROM-91–9910796
Boiling point°C27–22578104
Flash point°C−451335
Auto ignition Temp.°C258420415
Stoichiometric AFR-14.79.0111.12
Table 3. Coefficients of exponential volumetric mass density model and statistical indicators (R2—coefficient of determination, SSE—sum of squared estimate of errors).
Exponentialρ0 (kg·m−3)b (K−1)R2SSE
B0-95842.7−0.00036530.96757.094
B5-95918.5−0.00066020.910867.90
B10-95939.7−0.00072960.980017.37
B85-951054−0.00095300.979333.96
B0-98950.2−0.00075280.970527.75
B5-98989.9−0.00086320.972035.31
B10-98973.6−0.00079750.971031.33
B85-981057−0.00095010.982428.75
B1001074−0.00098630.974545.80
Table 4. Coefficients of Exponential dynamic viscosity model and statistical indicators (R2—coefficient of determination, SSE—sum of squared estimate of errors).
Exponentialη0 (mPa·s)b (K−1)R2SSE
B0-952.785−0.0052770.89040.003453
B5-952.291−0.0044740.88000.002957
B10-953.753−0.0059580.82340.009255
B85-952.785−0.0052770.89040.003453
B0-982.855−0.0055260.94120.001755
B5-981.318−0.0024810.87290.001026
B10-982.040−0.0039180.70080.007626
B85-982926−0.0243200.99740.033080
B1001.141 × 104−0.0280900.99710.088950
Table 5. Coefficients of Arrhenius dynamic viscosity model and statistical indicators (R2—coefficient of determination, SSE—sum of squared estimate of errors).
Arrheniusη0 (mPa·s)Ea (J·mol−1)R2SSE
B0-950.132936340.91010.002831
B5-950.173530850.89940.002481
B10-950.119441340.85630.007531
B85-950.0037941.576 × 1040.99960.005149
B0-980.11870037930.95660.001295
B5-980.31680016980.87420.001015
B10-980.20880027470.73970.006637
B85-980.0030841.615 × 1040.99890.013940
B1000.0014791.856 × 1040.99970.010480
Table 6. Coefficients of Newton dynamic viscosity model and statistical indicators (R2—coefficient of determination, SSE—sum of squared estimate of errors).
Newtonη0 (mPa·s)b (K−1)R2SSE
B0-950.132900437.10.91010.002831
B5-950.1735003710.89940.002481
B10-950.119400497.30.85630.007531
B85-950.00379418960.99960.005149
B0-980.118700456.20.95660.001295
B5-980.316800204.30.87420.001015
B10-980.208800330.40.73970.006637
B85-980.00308419420.99890.013940
B1000.00147922330.99970.010480
Table 7. Coefficients of Vogel dynamic viscosity model and statistical indicators (R2—coefficient of determination, SSE—sum of squared estimate of errors).
Vogelη0 (mPa·s)b (K)c (K)R2SSE
B0-950.4717000012.59 *−233.80.95720.0013480
B5-950.513000009.758 *−235.90.94930.0012490
B10-950.541200008.194−244.40.97000.0015740
B85-950.0079680 *1500−31.16 *0.99960.0047340
B0-980.4019000025.06 *−216.50.97820.0006507
B5-980.0008957 *2703 *50.67 *0.99890.0133100
B10-980.585000003.513 *−250.80.93210.0147100
B85-980.0008959 *2703 *50.66 *0.99890.0133100
B1000.0037680 *1737−33.16 *0.99970.0093950
* coefficient is not statistically significant for confidence level p < 0.05.
Table 8. Coefficients of Exponential kinematic viscosity model and statistical indicators (R2—coefficient of determination, SSE—sum of squared estimate of errors).
Exponentialν0 (mm2·s−1)b (K−1)R2SSE
B0-953.2970−0.0049050.87450.006032
B5-950.8766−0.0037290.74720.008742
B10-954.1030−0.0053240.77600.017080
B85-952465−0.0227900.99610.072730
B0-983.0930−0.0048760.91570.003430
B5-981.3070−0.0015490.71270.001855
B10-982.0960−0.0031250.58000.013700
B85-982356−0.0218700.99500.131700
B100 (butanol)8691−0.0260900.99800.093450
Table 9. Coefficients of Arrhenius kinematic viscosity model and statistical indicators (R2—coefficient of determination, SSE—sum of squared estimate of errors).
Arrheniusν0 (mm2·s−1)Ea (J·mol−1)R2SSE
B0-950.19450033840.89620.004991
B5-950.27980025940.77510.007778
B10-950.18710037110.81290.014270
B85-950.0060531.518 × 1040.99950.010040
B0-980.18620033560.93450.002662
B5-980.53430010700.72470.001777
B10-980.33750022110.62170.012340
B85-980.0096141.459 × 1040.99910.022710
B1000.0034691.725 × 1040.99500.240900
Table 10. Coefficients of Newton kinematic viscosity model and statistical indicators (R2—coefficient of determination, SSE—sum of squared estimate of errors).
Newtonν0 (mm2·s−1)b (K−1)R2SSE
B0-950.194500407.10.89620.004991
B5-950.2798003710.77510.007778
B10-950.187100446.30.81290.014270
B85-950.00605318260.99950.010040
B0-980.186200403.60.93450.002662
B5-980.534300128.70.72470.001777
B10-980.337500265.90.62170.012340
B85-980.00961417550.99910.022710
B1000.00346920750.99500.240900
Table 11. Coefficients of Vogel kinematic viscosity model and statistical indicators (R2—coefficient of determination, SSE—sum of squared estimate of errors).
Vogelν0 (mm2·s−1)b (K)c (K)R2SSE
B0-950.64400010.02 *−237.20.95420.002200
B5-950.7366003.685 *−249.30.90690.003220
B10-950.7406005.904−247.80.96180.002911
B85-950.02609 *1093−63.790.99960.006728
B0-980.57130016.83 *−224.70.96700.001343
B5-980.7991001.329 *−250.80.79370.001332
B10-980.7823002.076 *−254.30.88790.003658
B85-980.0695 *814.2−89.90.99960.01064
B1001.511 × 105 *324 *7770 *0.96451.697
* coefficient is not statistically significant for confidence level p < 0.05.
Table 12. Coefficients of polynomial multivariate models and statistical indicators (R2—coefficient of determination, SSE—sum of squared estimate of errors).
Volumetric Mass Densityx0
(kg·m−3)
x1
(K−1·kg·m−3)
x2
(kg·m−3)
x3
(K−2·kg·m−3)
x4
(K−1·kg·m−3)
R2 S S E
Bx-95358.43.2021.649−0.006287−0.0039530.9944178.1
Bx-98375.23.3500.9477−0.006874−0.0018590.9902239.7
Kinematic Viscosityy0
(mm2·s−1)
y1
(K−1·mm2·s−1)
y2
(mm2·s−1)
y3
(K−2·mm2·s−1)
y4
(K−1·mm2·s−1)
R2 S S E
Bx-9552.91−0.36680.38090.0006412−0.0011780.97157.021
Bx-9854.61−0.38010.41050.0006663−0.0012650.98972.999
Publisher’s Note: MDPI stays neutral with regard to jurisdictional claims in published maps and institutional affiliations.