Review

Performance Evaluation Metrics for Multi-Objective Evolutionary Algorithms in Search-Based Software Engineering: Systematic Literature Review

1
Faculty of Computer Science and Information Technology, Universiti Putra Malaysia (UPM), Serdang 43400, Malaysia
2
Faculty of Social Sciences and Humanities, Universiti Teknologi Malaysia, Skudai 80130, Malaysia
*
Author to whom correspondence should be addressed.
Appl. Sci. 2021, 11(7), 3117; https://doi.org/10.3390/app11073117
Submission received: 14 December 2020 / Revised: 17 January 2021 / Accepted: 20 January 2021 / Published: 31 March 2021
(This article belongs to the Section Computing and Artificial Intelligence)

Abstract

:
Many recent studies have shown that various multi-objective evolutionary algorithms have been widely applied in the field of search-based software engineering (SBSE) for optimal solutions. Most of them either focused on solving newly re-formulated problems or on proposing new approaches, while a number of studies performed reviews and comparative studies on the performance of proposed algorithms. To evaluate such performance, it is necessary to consider a number of performance metrics that play important roles during the evaluation and comparison of investigated algorithms based on their best-simulated results. While there are hundreds of performance metrics in the literature that can quantify in performing such tasks, there is a lack of systematic review conducted to provide evidence of using these performance metrics, particularly in the software engineering problem domain. In this paper, we aimed to review and quantify the type of performance metrics, number of objectives, and applied areas in software engineering that reported in primary studies—this will eventually lead to inspiring the SBSE community to further explore such approaches in depth. To perform this task, a formal systematic review protocol was applied for planning, searching, and extracting the desired elements from the studies. After considering all the relevant inclusion and exclusion criteria for the searching process, 105 relevant articles were identified from the targeted online databases as scientific evidence to answer the eight research questions. The preliminary results show that remarkable studies were reported without considering performance metrics for the purpose of algorithm evaluation. Based on the 27 performance metrics that were identified, hypervolume, inverted generational distance, generational distance, and hypercube-based diversity metrics appear to be widely adopted in most of the studies in software requirements engineering, software design, software project management, software testing, and software verification. Additionally, there are increasing interest in the community in re-formulating many objective problems with more than three objectives, yet, currently are dominated in re-formulating two to three objectives.

1. Introduction

Tackling problems in the software engineering (SE) discipline (i.e., regarding products, processes, and resources) has commonly been characterized as complex, error-prone, and expensive. While there is thus a need to simplify these aspects of problem-solving to make it less complex, less failure-prone, and less costly, objectively achieving these conflicting goals within existing constraints is difficult for decision-makers. However, many software engineering problems are specified as optimization problems—and to solve such problems, practitioners use optimization techniques (metaheuristics) to search for the best (i.e., optimal) solutions. In the specialized literature, SBSE is the common term used in relation to this [1], and it has been successfully applied in practice to SE areas, such as software requirements, design, testing, and many more. This has led to many SE problems being re-formulated as search problems [1,2]. For example, in test case prioritization in regression testing aims to maximize coverage criteria, while minimizing a set of given constraints, such as cost and time, however, this makes the decision-making process a challenging task.
In the course of finding quality solutions to support the decision-making (DM) process, several techniques are used. There are techniques (algorithms) that can improve and maintain a single solution at a time, and those can maintain multiple solutions (population) at once [3]. Most of these methods are inspired by the intelligence that has evolved in nature in living things, as exemplified in biology through genetics and the movement of animals (i.e., insects, birds, fish, etc.) for their survival.
In the initial stages of SBSE research, single objective problems (SOPs) are re-formulated and solved using Simulated Annealing and Tabu Search. However, these methods can only maintain and improve a single solution at a time [3,4]. In contrast, multi-objective evolutionary algorithms (MOEAs) are improved versions of the initial methods and can tackle multiple objective problems (MOPs) with no more than three objectives, simultaneously. There are also other improved methods that can handle many-objective optimization problems (MaOPs) with more than three objectives. These methods are also called many-objective evolutionary algorithms (MaOEAs) [5]. Both MOEAs and MaOEAs produce sets of solutions with different trade-offs (Pareto optimal solutions).
However, in the available literature, there appears to be no agreement on the number of objectives we call ‘multi’ or ‘many’ [6], and the focuses of these terminologies may create confusion.
In practical approaches, these multi/many-objective methods deal with large numbers of conflicting objectives, and finding the best solutions may not be easily observable. For such tasks, they can find multiple Pareto optimal solutions and perform better global searches of the search space [7]. However, evaluation of the solution sets obtained by these methods, which present different trade-offs among the objective problems, has to be quantitatively assessed in a meaningful way using a number of measurement scales [8]. Such measurements have different purposes as some are specific to problems (e.g., some SE testing papers use the average percentage of faults detected [APFD]), some use statistical measures, and others use the calculated execution time as a performance measure. However, our study is focused on the metrics used to evaluate solvers. Terminologically, these metrics are called performance metrics, also known as quality indicators.
On the other hand, solving the MOP requires to use of metaheuristic solvers to optimize the number of conflicting objectives or functions and provide a set of solutions (Pareto optimal set) to the decision-maker. However, there is no single solution that is better than the other with respect to all objectives, thus, these solvers provide an approximation of the Pareto front [9]. In the literature, several metrics are proposed to evaluate and compare these approximations sets [10].
In our context, we review the use of performance metrics that is used to evaluate the quality of solver (algorithm) outputs, or during comparisons with other solution sets obtained by other solvers. In general, there is no universally good or bad algorithm; however, one algorithm may perform well for a specific problem, thus, such types of metrics may necessarily be used in the studies.
To fill this gap, researchers have developed a number of performance metrics [11,12]. In the specialized literature [13,14,15], these metrics are roughly grouped into capacity, convergence, diversity (distribution, spread), or combination (convergence, diversity) metrics [13]. It is worth noting that some studies have reported that no single performance metric is enough to assess all the qualities of such methods [8,9,15] because each metric can only assess one or two desirable properties of the solution sets (e.g., convergence, diversity, or both) [16]. However, the rapid growth in the usage and development of multi/many-objective methods, performance metrics, and comparison of algorithms has received little attention [15].
Apart from the performance metrics, there are studies re-formulate the number of objectives and target specific areas in the SE domain. Nevertheless, readers are redirected toward the formal definitions of these metrics, critical analysis, and comparison of different metrics [9,13,14,17], which are not covered here.
To the best of our knowledge, according to an overwhelming number of studies in the field of SBSE, there have been few systematic literature review studies relevant to the use of such metrics, number of objectives, and sub-field of SE applied over the last decade. This served as a motivation to explore, investigate, and interpret the relevant studies (based on our research questions). This research will serve as a guide and reference for research practitioners to obtain new knowledge in order to see the possible gaps that might exist in this area, which will lead to improving the current practice in this niche, such as increasing the number of performance metrics, increase the number of objectives, and to apply new SE areas.
This research is meant to analyze how the SBSE community progressively evolved the performance metrics, number of objectives, and applied SE areas. The rest of this paper is organized as follows: Section 2 mainly provides an overview of the existing secondary studies (related works) in the field. Section 3 defines the review method, including the study research questions, search strategies, study selection criteria, and data extraction process. In Section 4, the analysis and results of the study are detailed, and finally, Section 5 provides a discussion and summary of the findings as a conclusion of the study.

2. Related Work

This section describes the secondary studies that have been conducted within the context under consideration.
Ramirez et al. [18] conducted a study that relied on a guided review motivated by the growing attention being focused on many-objective problems. The research sought to discover the limitations on problem formulation, algorithm selection, experimental design, and industrial applicability. In the findings, it was agreed that multi and many-objective EAs use the same indicators, but no quantifiable results were obtained or objectively stated in the study on the distribution of these metrics.
An early informal review conducted by Sayyad and Ammar [19] aimed to collect data on the algorithms, tools, quality indicators, and number of objectives used in the SBSE community. The researchers concluded that the use of MOEAs was becoming a new trend and found that many articles used single algorithms. They also reported that a few articles employed performance metrics, and HV was the most used one. However, research in the community has increased, and the use of multi/many-objective methods are on the rise. Hence, conducting up-to-date SLR is advisable to accommodate new trends and challenges.
Colanzi et al. [20] focused on the Brazilian authors and their contribution to the field of SBSE. Some of their objectives included tallying the number of publications of the community, the areas in which they focused, and their optimization techniques, as well as identification of the authors and their levels of collaboration. However, although their defined research questions were aimed at the SBSE field, the research was limited in scope, and their results are not generalizable.
Assunção et al. [21] also reported a similar mapping study targeting Brazil to expose existing research groups within the Brazilian SBSE community mainly discussed questions addressing evolved problems in SE, techniques used in solutions, and the number of researchers, institutions, and regions involved in these areas. Their findings showed significant growth in the community.
Another recent critical review was conducted by Chen et al. [17] within a limited timeframe (2009–2019). The study analyzed the quality indicators (performance metrics), problems involved in subfields of SE, and overall general issues in SBSE. The review finally provided methodological guidance on how to select and use evaluation methods in different scenarios. However, the study did not discuss how the community was currently using the metrics, which metrics were most used or least used, or how many metrics each study involved. Such discovery is our objective, and it may lead the community to better understand current practices.
The above-mentioned studies focused on SBSE but with regard to different or specific subjects, such as specific location [20,21], or specific techniques [18], while some of them are old [19], and some are new [17]. Hence, our study with its guided protocol is mainly meant to provide a generalizable result to the SBSE community by discovering how the community practitioners are employing the above-mentioned metrics, and this might eventually reveal pertinent issues and future opportunities.
It is worth considering that in the accumulated literature, we found a number of review studies targeted on specific contexts of SBSE, such as different areas in testing, requirements, design, and software refactoring, and many others, but their results may not be generalizable and address little attention to the broader collection of literature in this field, especially in performance metrics. In this regard, to utilize our limited scope, readers are redirected to references [22,23,24,25,26,27,28,29,30,31,32,33].
Thus, to keep the SBSE community up to date on this subject, since performance metrics are equally used to evaluate algorithm performance, especially when new algorithms are proposed, there are other studies from other communities that mainly discussed the issues related to the performance metrics used. Such studies, including a study reported by Jiang et al. [13], grouped the performance metrics in the literature into four main classes and then analyzed the relationships between representative metrics from the groups. However, the study was limited to only investigating the performance metrics categorized in the literature and their relationships among symmetric and continuous Pareto fronts (PFs). The authors suggested further investigation of the relationships of other geometric perspectives in performance metrics, such as asymmetric and discrete PFs, and also highlighted the need for appropriate metrics with hypervolume (HV) use for concave shapes.
Riquelme et al. [14] conducted informal and small review focused on the frequency usage of 54 performance metrics in MOEAs with their advantages and disadvantages from five editions (2005, 2007, 2009, 2011, and 2013) by only main sourcing the published studies of bi-annual evolutionary multi-objective optimization (EMO) community conferences.
A recent review study observed by Li and Yao [34] categorized and analyzed the weaknesses and strengths of 100 state-of-the-art performance metrics with their desirable properties. With the help of that, they concluded that there is no perfect metric to measure the solution sets, since different metrics are appropriate in different situations. Another research direction suggested was to design new performance metrics suitable to the preferences of decision-makers (DMs).
Okabe et al. [8] reviewed the existing performance metrics by categorizing them into a number of groups based on their functionalities, then showing the advantages and disadvantages of performance metrics. Thus, a comparative study was done that discovered some of the metrics were misleading. Therefore, their point of discussion appeared to be that no single metric alone can quantify the qualities of the solution sets obtained by solvers.
Laszczyk and Myszkowski [35] described a taxonomy-based surveying 38 of the existing performance metrics and their definitions along with their advantages and disadvantages. They claim their proposed complementary set of metrics can create meaningful results when used on solution sets obtained by solvers.
Audet et al. [36] is another review study of performance metrics recently published, which intended to focus on using 57 metrics grouped into four categories: Cardinality, convergence, distribution, and spread. The research gap reported in this paper is the need for new metrics that can tackle the limitations faced by the HV.
While these papers are similarly discussed and focus on discovering the weaknesses of the existing performance metrics in use by the EMO community, no paper tracked how the current research in SBSE practice uses these metrics (i.e., their applications to real-world problems instead of artificial problems). This research will, therefore, discover if enough practitioners are using these metrics and distributions and the types of metrics employed.
For further performance metric analysis on their strengths and weaknesses with practical guidance, readers are referred to references [37,38,39,40].

3. Research Methodology

Systematic literature review (SLR) is a process of identifying the relevant research questions, collecting the relevant secondary data, evaluating and interpreting such data.
To obtain a good sample of primary studies, several approaches are discussed in the literature, such as standard SLR, Systematic Mapping Study (SMS), Snowballing, or Quasi-Gold Standard (GQS) methods. In relation to these methods, SMS is mainly employed when the primary studies are huge or to cover broad topics, however, the cost of assessing all the studies would be unreasonably high [41]. To reduce such constraints, it is required to stop classification processes at a certain level, thus, it may reduce or leads to missing important articles. On the other hand, Snowballing (backward and forward) is also used to find primary studies, however, it might be necessary, if used a well-defined reliable, and efficient search strings in the digital libraries. While some studies use the concept of GQS to improve the search steps, thus, this depends too much on a good QGS [41].
While standard SLR is driven by a very specific research question that is used to identify, analyze, and interpret the relevant studies [41,42]. In SLR, the primary studies are identified with the help of the search process, and data extraction process (such as inclusion and exclusion criteria) [42]. We believe the standard SLR methodology used in our study is essential to support this research constructively.
In this aspect, we describe the methodology of this SLR method guided by Kitchenham et al. [43] to systematically collect, analyze and summarize the quantifiable data obtained from the specialized literature. In the following subsections, we will discuss our research questions, search strategies, study selection, and data extraction process.

3.1. Research Questions

To define what we are trying to answer, it is essential to design our research questions (RQs) at the studies that quantitatively evaluate the Pareto-based methods using performance metrics, number of objectives, and applied SE areas, thus, we consider the following RQs:
RQ1: What are the studies that applied none or one or more performance metrics?
To answer this RQ, we investigate the number of performance metrics that the SBSE community employed over the years, we aim to check the number of performance metrics each study employed by adopting a grouping strategy. This discovery will help the practitioners to understand how the existed studies measuring the quality of the solution sets obtained by the solvers.
RQ2: What metrics are most or least used in the studies?
In this question, we aim to identify the metrics that reported mostly or least used. From this point of discovery, tallying, and grouping (adopting previous grouping strategy), the different set of metrics in each group and their frequencies are discussed.
RQ3: What is the rank order of the metrics most or least used in the studies?
To see how the overall metrics and their ranks, we calculate their total frequencies. In RQ2, the overall rank of these metrics were not discussed. However, in this RQ, we intended to identify the metric frequencies and group them using their frequencies and calculate their percentages. In this case, we also avoid using the previous grouping strategy.
RQ4: How do the top popular metrics (>5%) increase or decrease in the studies?
It is beneficial to see how a set of metrics distributed in the study group (adopting previous grouping strategy), especially those gained more than five percent. This investigation will help us to increase our knowledge about how a set of metrics become increasingly popular or decreased in the study groups.
RQ5: How well do the current studies in SBSE use performance metrics?
In this RQ, we also identify and further investigate the study groups by showing the total number of studies in each study group, their total number of unique metrics, and their total frequency metric.
RQ6: What are the number of objectives used in the studies?
In this aspect, we show the number of objectives the community employing in practice by grouping the studies based on the objective count. This will discover the current practice of SBSE practitioners and the future direction of the research.
RQ7: What are the applied areas in SE of the studies?
In this RQ, we investigate the most and least common investigated software engineering (SE) areas by showing the studies’ distribution among these. Previously software testing was nominated, but recently, many areas in SE were investigated in the SBSE community. In this case, we also adopt the grouping made by the previous studies [19,20]. This might help and lead the current practitioners to further investigate these areas.
RQ8: What are the performance metrics distribution in each SE applied area?
In this RQ, we also identify how the previously investigated performance metrics (based on the grouping strategy) are distributed on the applied SE areas. This will help the SBSE practitioners to understand which SE areas are employing more or fewer metrics.
Answering the above RQs will help the practitioners to understand how studies have measured the quality of the solution sets obtained by solvers. There may be philosophical ideas among members of SE communities that might be revealed through answering these RQs, thus giving them meaning. To address the scope of the RQs, we limit the research papers published over years, which ranges from 2000–2020. While, we selected the publications only in relation to SBSE, especially those involving the multi/many-objective methods and their employed performance metrics, and number of objectives utilized in their evaluation setups and in applied areas of SE.

3.2. The Search Strategy

To avoid missing the relevant studies, we used a manual search method from the four most suitable digital libraries:
  • IEEExplore
  • Scopus
  • Web of Science
  • Science Direct
To avoid covering limited articles, we selected a set of digital liberties that can cover a large number of articles. We make a detailed search string and relevant to our topic to collect a significant number of studies. The construction of these strings are inspired by several literature reviews [17,20,23,26,44,45]. These queries are enough to cover a wide range of articles and match the article title, abstract, and keywords.
To identify publications, we used a set of keyword strings in our search parameters, as shown in Table 1. These keywords are categorized into those related to SE, Search Based, and performance metrics. This group organization was inspired by that found in Reference [44].
The keywords related to SE field areas, Search Based, and performance metrics were extracted and then combined using Boolean operators, such as “OR” and “AND.” All the search parameters targeted article titles, abstracts, and keyword sections. Finally, these strings were executed by splitting them into shorter segments because some of the targeted databases would not fully accept long strings, (to avoid showing unsatisfactory results).

3.3. Study Selection

To select the candidate papers, we employed inclusion and exclusion criteria as we mainly aimed to not miss any beneficial articles that matched our research objectives and were written in the English language in sources from specified publishers (IEEExplore, Science Direct) or indexers (Scopus, Web of Science). To finally select the desired studies, we filtered the fetched articles by carefully reading the titles, abstracts, keywords, and body texts, iteratively. The steps in the process of searching and selecting are illustrated in Figure 1.
In the above steps (from top to bottom), Step 1 shows the number of studies returned from each database, with a total of 699 studies. In Step 2, we excluded those mismatched by title. In Step 3, deletion of the duplicates was performed. In Step 4, the abstracts were read, and those that were out of our scope were excluded; and finally, in Step 5, a full reading of the remaining articles was performed. We also applied the inclusion and exclusion criteria in every step if matched.
The inclusion criteria are as follows:
  • The study must be related to the topic (SBSE) and must use multi-objective or many-objective methods.
  • The study must be written in the English language.
  • The study must be available online and in electronic format.
And the exclusion criteria are:
  • Studies not related to SBSE;
  • Thesis, tutorials, book chapters, editorials;
  • Not written in the English language;
  • Not available online.

3.4. Data Extraction Process

In this step, after full text reading, we extracted the desired data from the final selected studies that satisfied our criteria. To review the primary studies, multiple researchers (three researchers) are randomly assigned to assess the relevant papers, then the researchers extract the data from the relevant studies, and the obtained data were cross-checked. The data are then stored in Excel spreadsheets for further analyses. The desired extracted parameters included the name and number of performance metrics and number of objectives and subfield of SE used. This process facilitated easy classification and analysis to answer our research questions.

4. Results

To make a detailed explanation in this stage, we analyzed the extracted data from the final 105 studies after applying inclusion and exclusion criteria to answer the research questions. To start, we first summarized all the 27 unique metrics used in the studies, as shown in Table 2. Figure 2 shows the number of studies by publication year.
RQ1: What are the studies that applied none or one or more performance metrics?
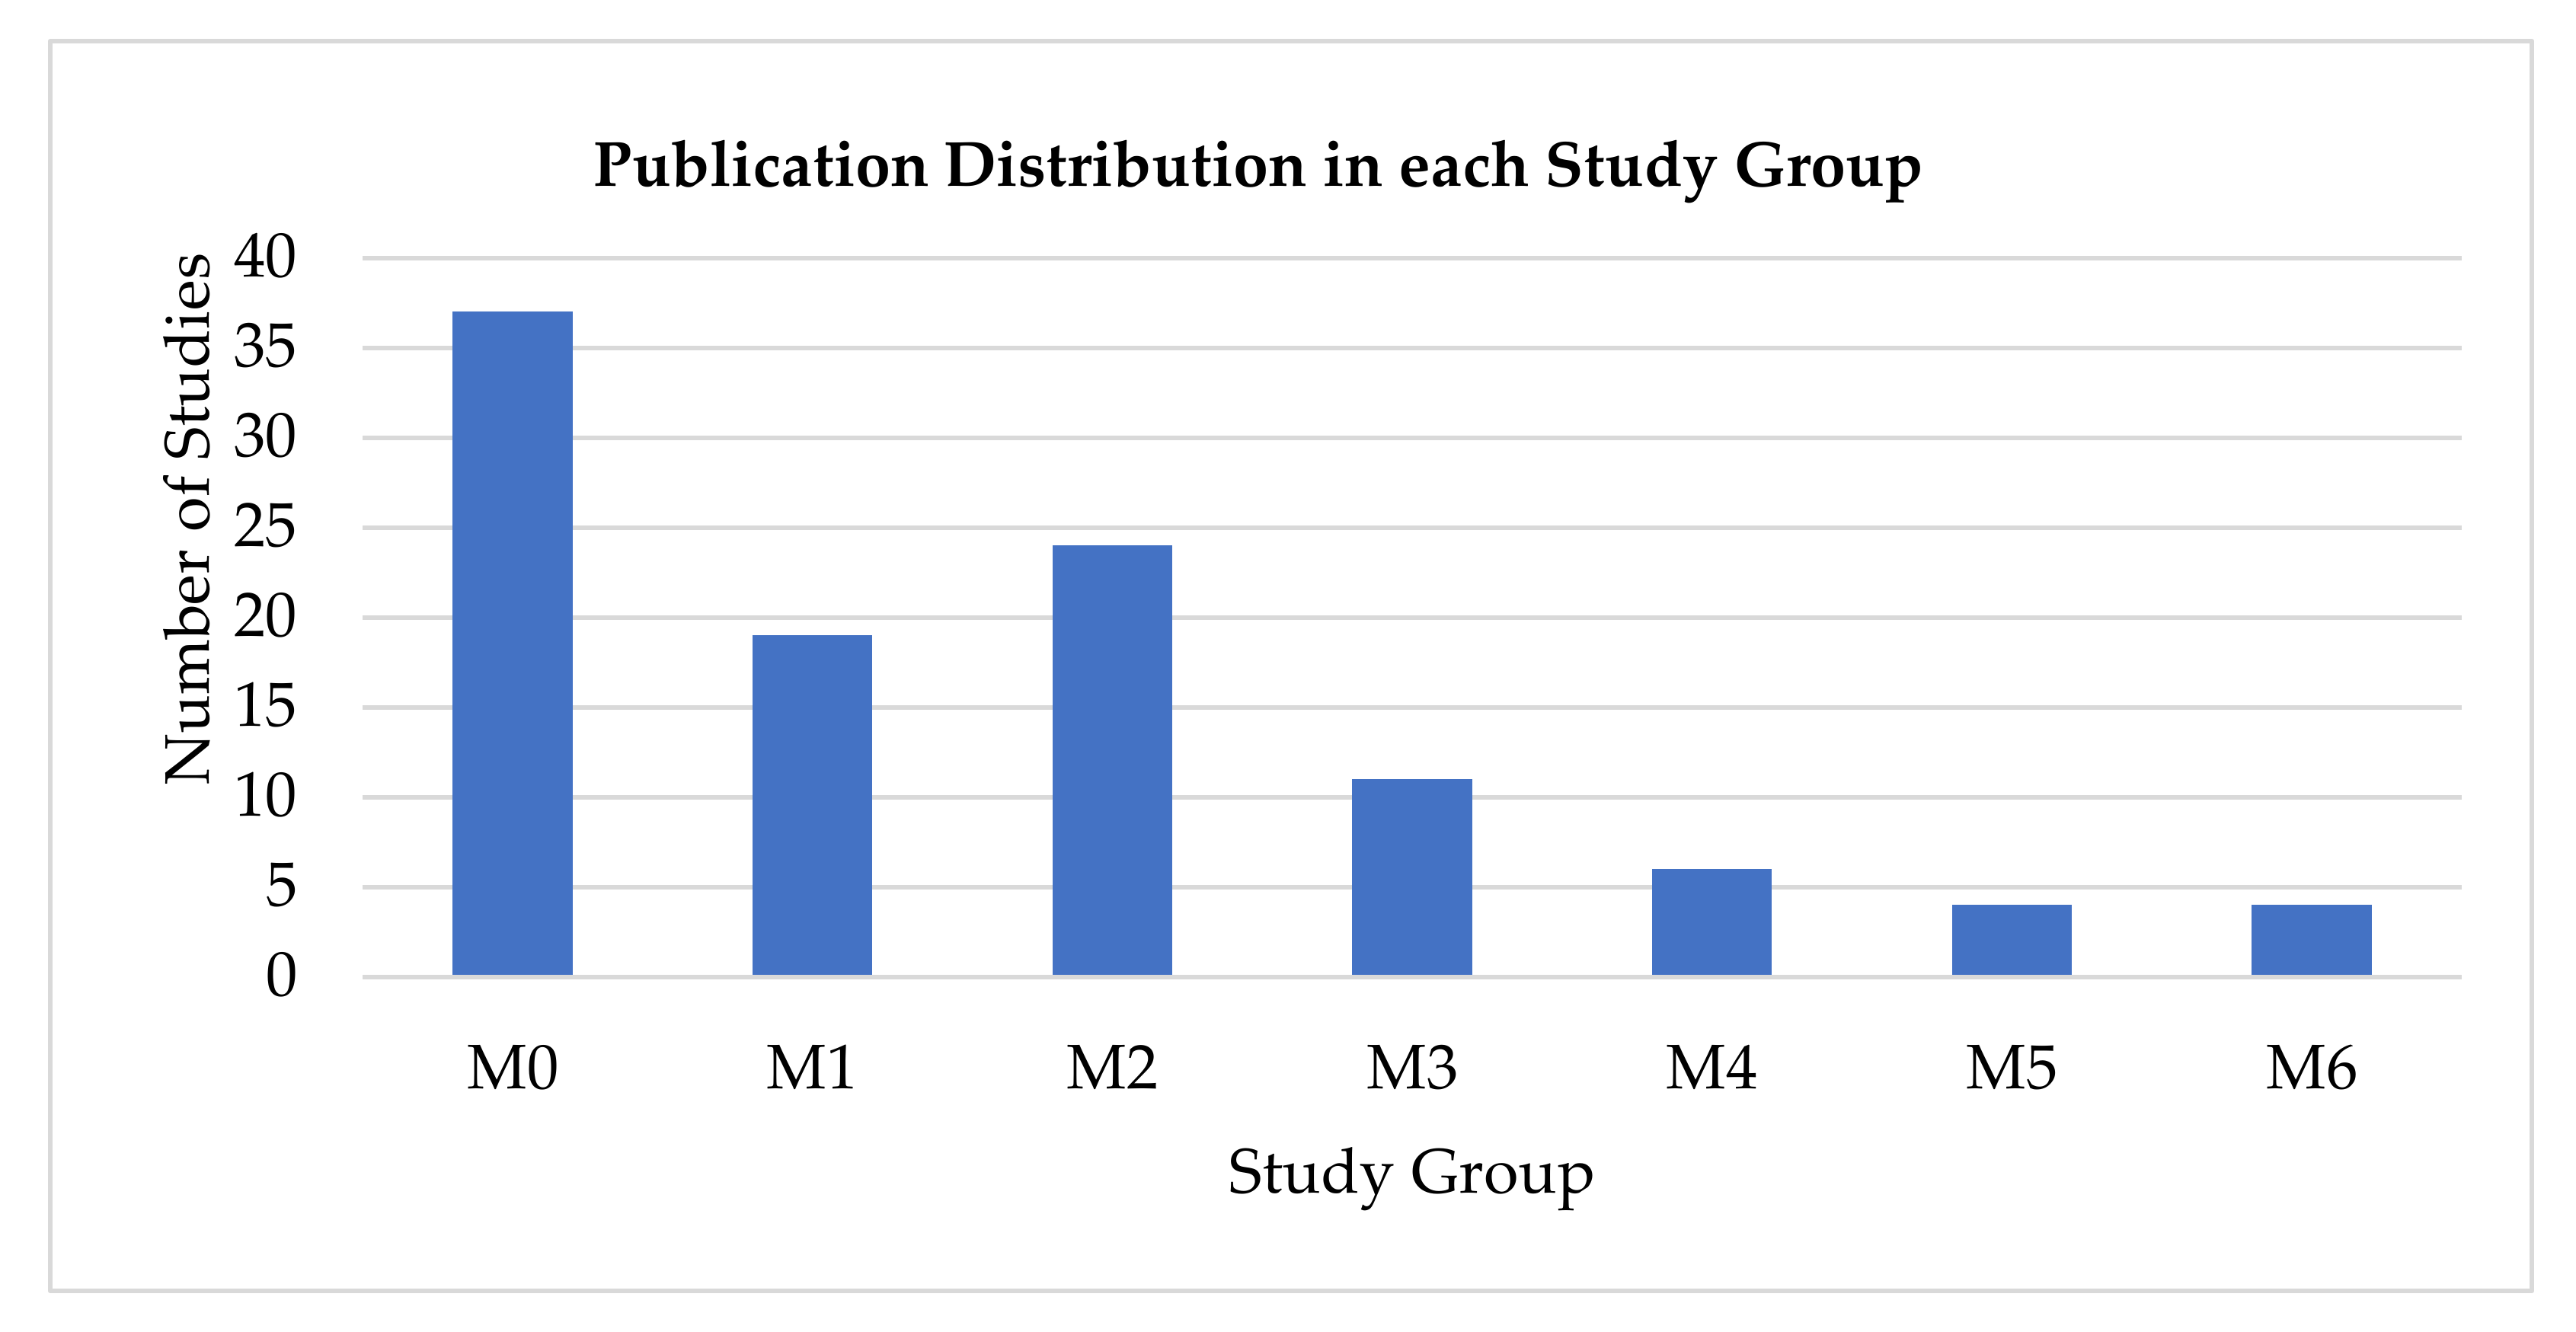
In order to see how the existing studies used performance metrics, we grouped our collected studies based on the number of metrics used. After full reading, we found that the maximum number of metrics used in the nominated studies was six. Thus, our grouping strategy adopted these abbreviations: M0 means zero metrics, M1 for one metric, M2 for two metrics, M3 for three metrics, M4 for four metrics, M5 for five metrics, and M6 for six metrics. This means articles that had not employed or not reported the defined performance metrics would be listed in the M0 group and those with one metric in M1, etc. Figure 3 shows that most of the studies, based on this grouping, used zero metrics, which accounted for 37 articles, and the second rank deployed two metrics. Meanwhile, the graph shows a decline in the studies that employed more than two metrics. It is worth noting that only four studies employed six metrics (M6), and four others used five metrics (M5). However, to make it more meaningful, we needed to address what the dominant metrics were, thus creating another detail from this point by showing how they (the 27 metrics) were used over 105 studies. This would answer another RQ.
RQ2: What metrics are most or least used in the studies?
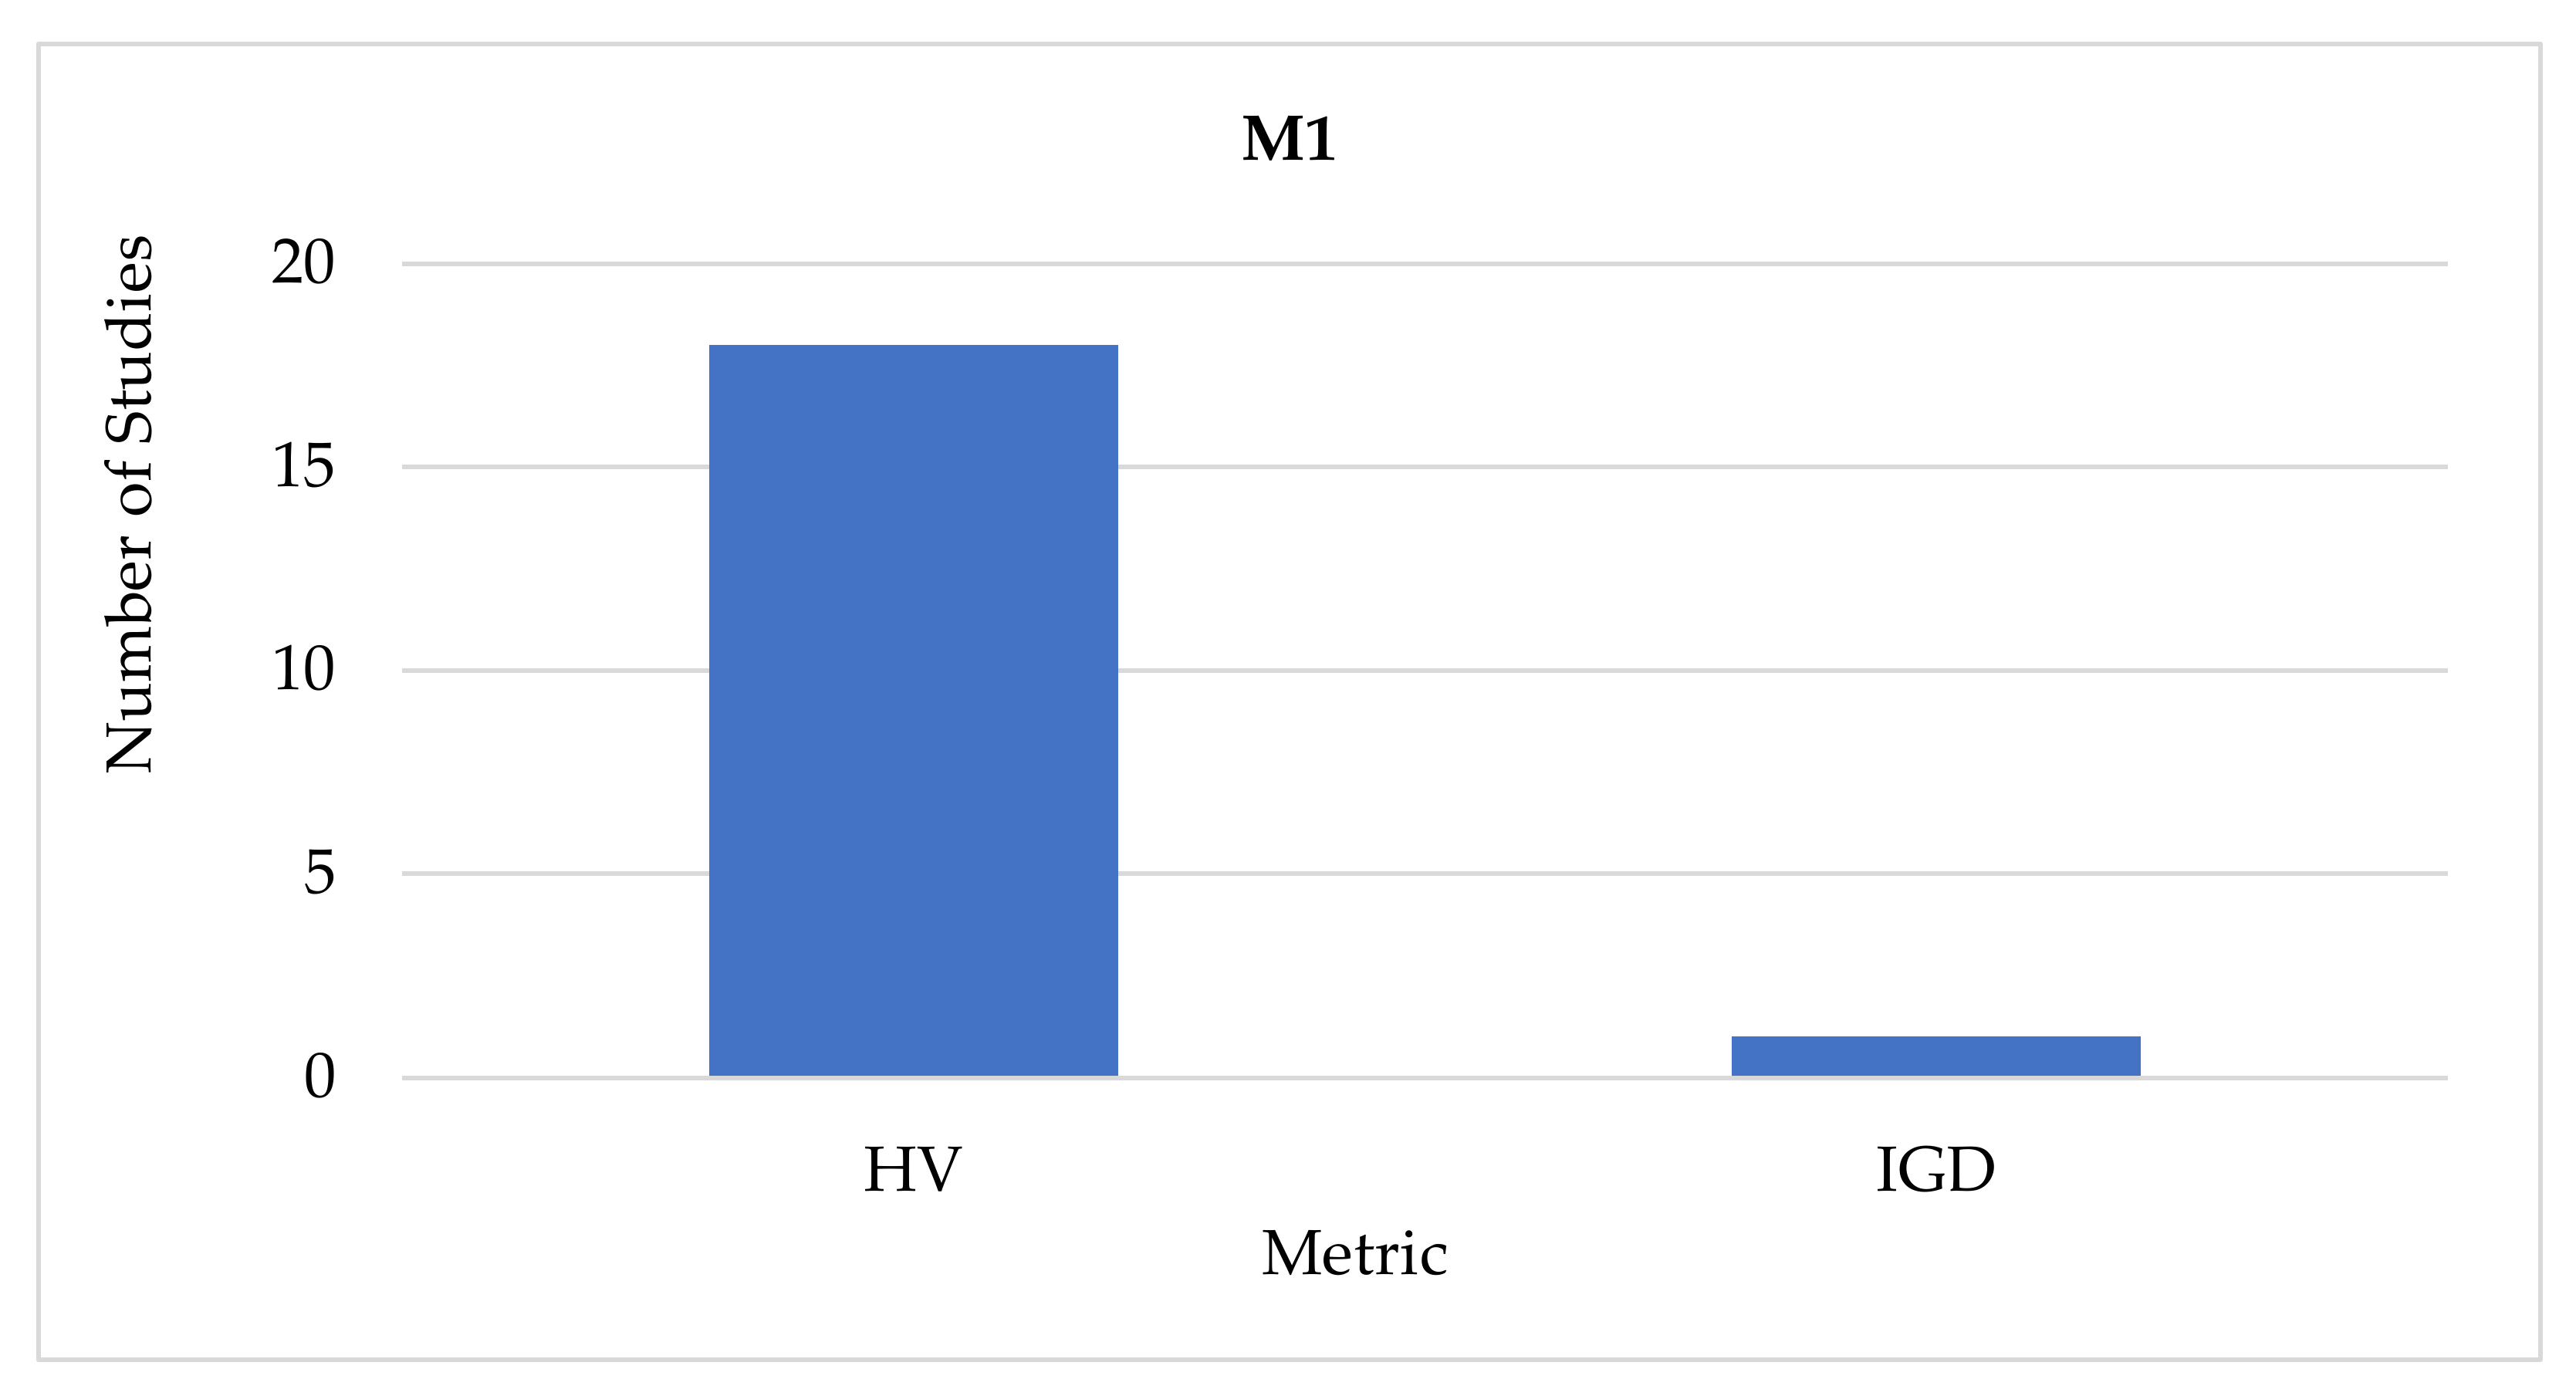
From this point of discovery, tallying of the used metrics is discussed. It is not surprising that some of the employed metrics were selected, due to their broad usage in the literature [10,46]. We only tallied the sections of the studies that used performance metrics; hence, those using zero metrics were excluded, such as the M0 set. With the help of Excel spreadsheet visualization, the obtained result is presented in figures. Figure 4, which shows the distribution of the metrics for the M1 group, which had a total of 19 articles, yet they employed one metric in each of the studies, and therefore, there were only two unique metrics involved, which were HV and IGD. However, IGD was only used once, while HV was used 18 times in this set of the M1 group.
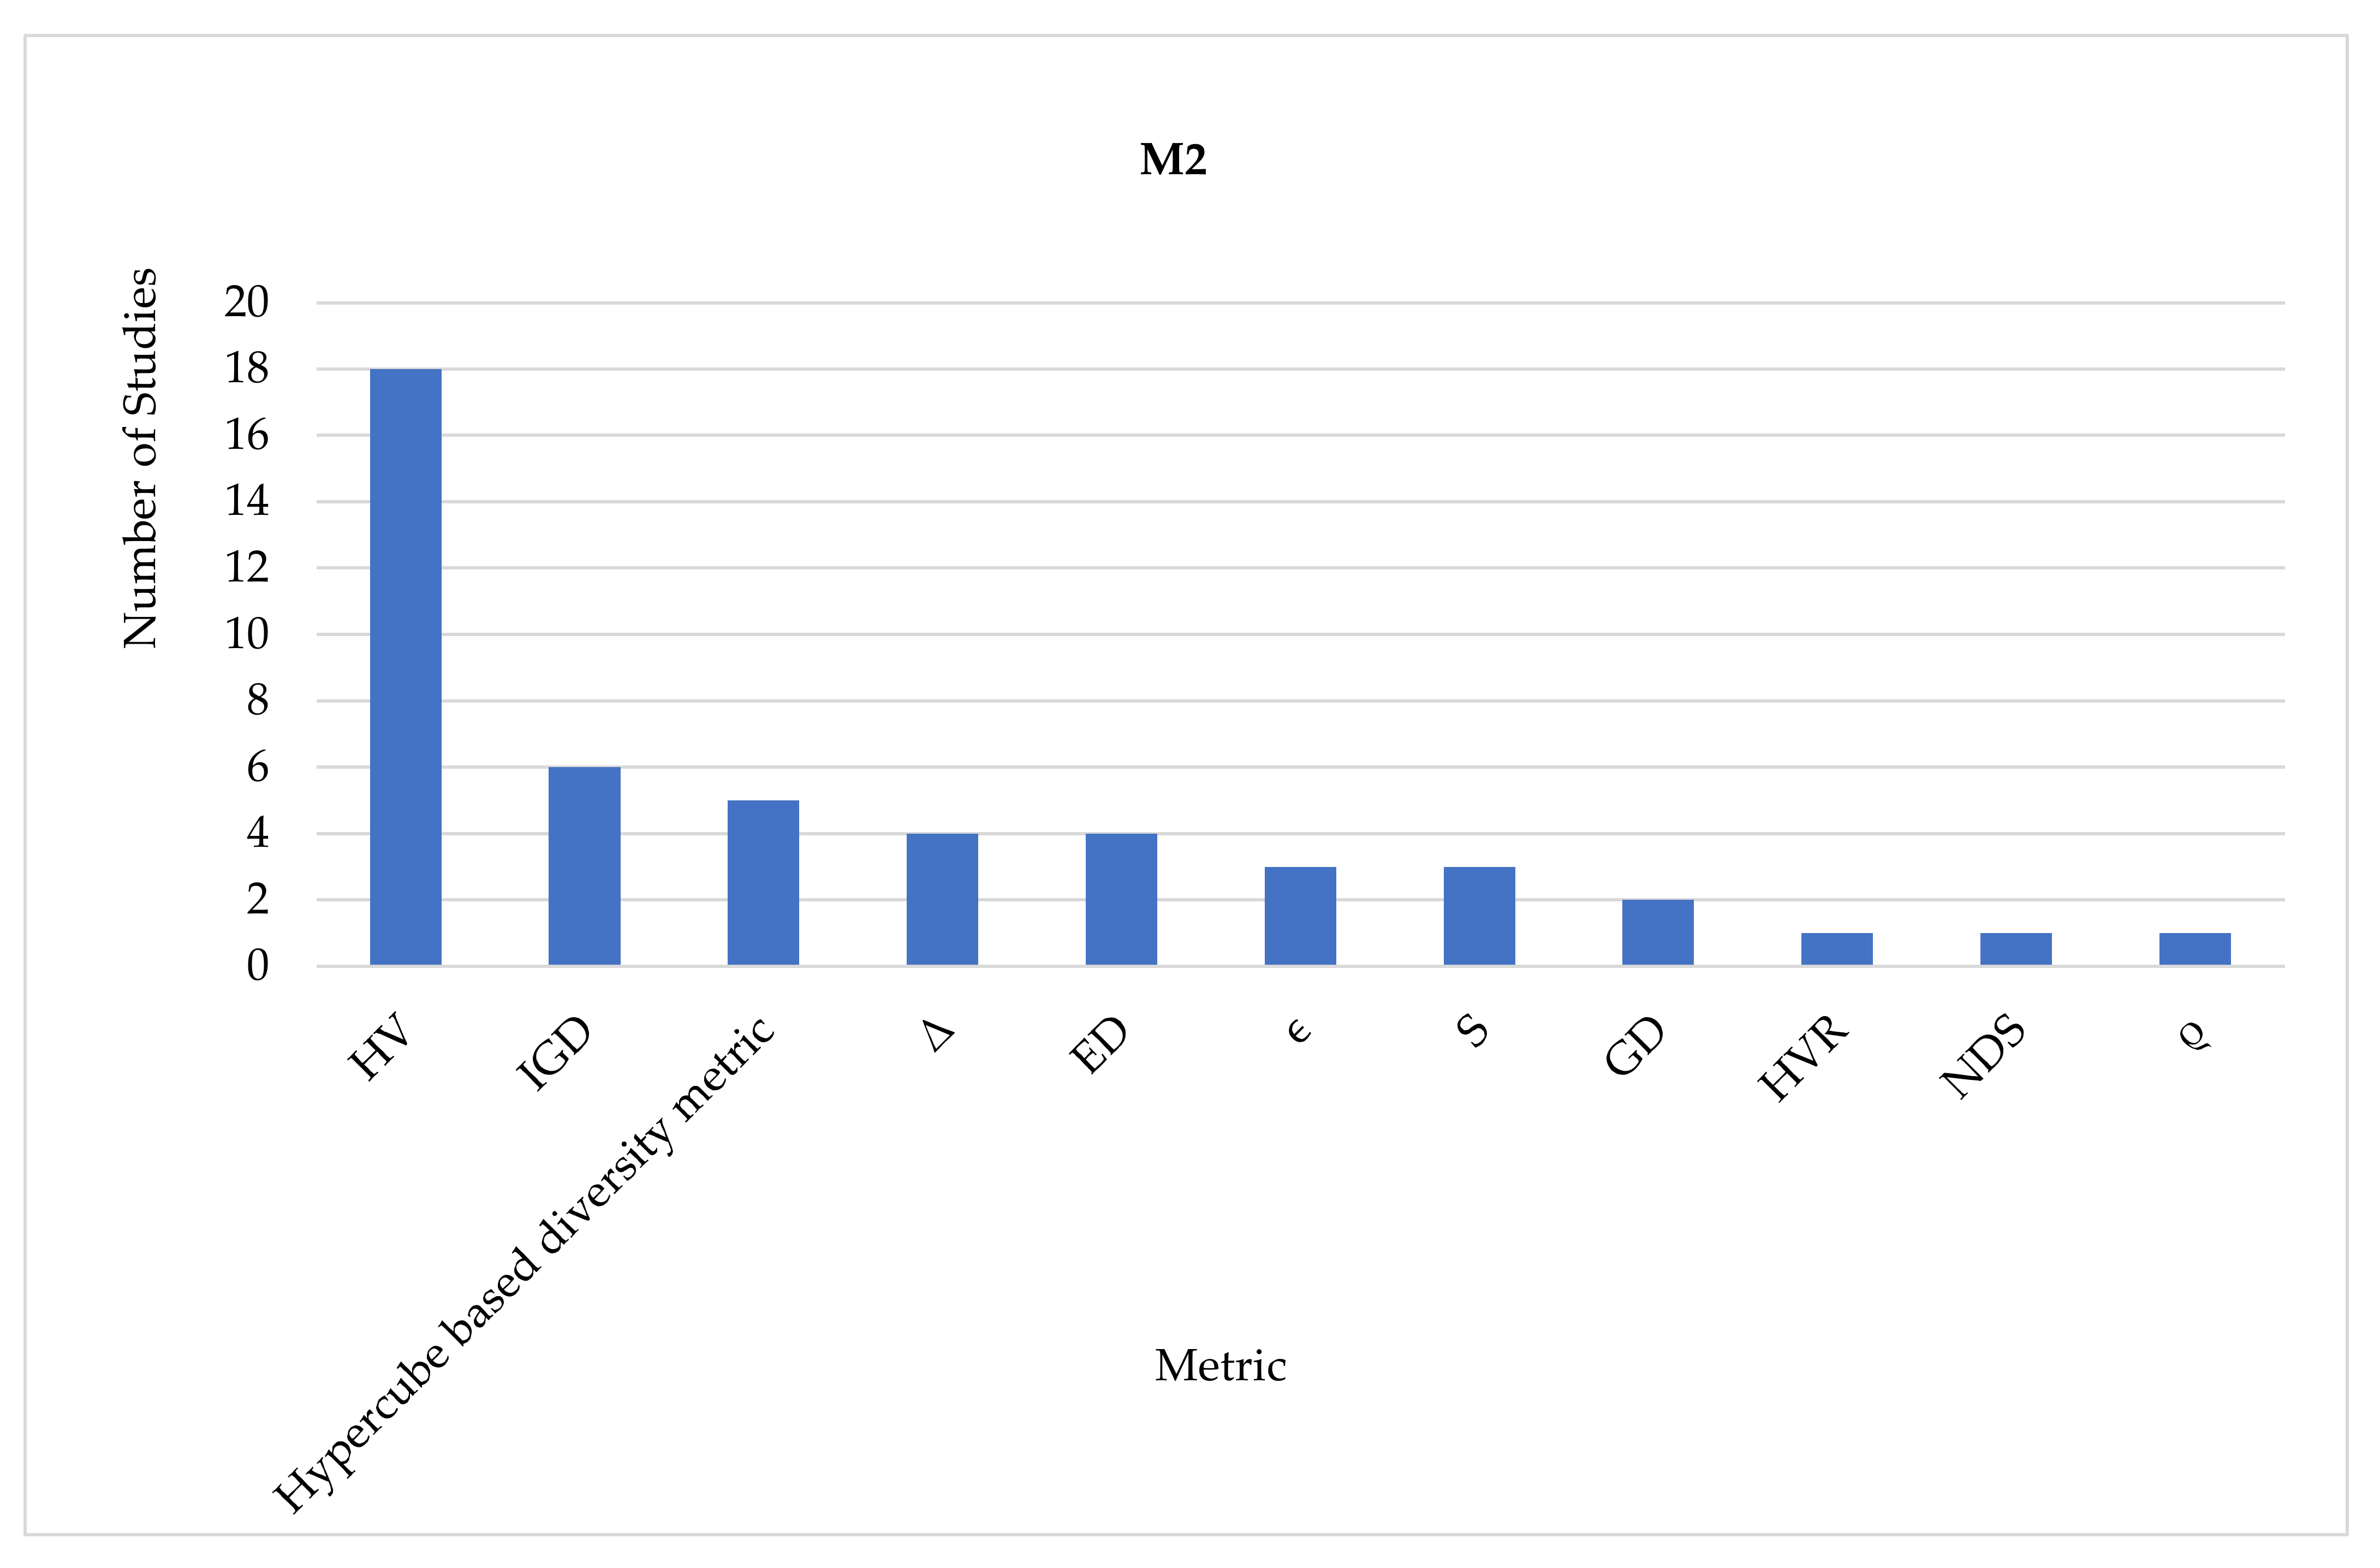
Figure 5 shows that a total of 24 articles employed sets of two metrics. Although the number of studies involved in this group (M2) was more than the previous one (M1), it comprised a good number of metrics (good diversity with a total of 11 unique metrics), and yet HV and IGD were the leading ones, which means they were the most used metrics. HV was used 18 times, IGD was used six times, and there were nine other additional metrics in this set, which were the hypercube-based diversity metric, which was used five times, and delta spread (∆) and ED, which were used four times each. The remaining metrics were used as follows: ϵ and S were used three times each, GD two times, and finally, HVR, NDS, and ρ (convergence measure) were used only one time each.
Figure 6 shows a total of 16 metrics that appeared in the publications. After comparison according to their usage, HV was found to be the highest in total with seven cases, while NDS and the hypercube-based diversity metric were ranked five and four, respectively. While GD, the contribution metric, ∆, and CM were used two times each, and the remaining nine metrics in this list had the lowest values, only having been used once.
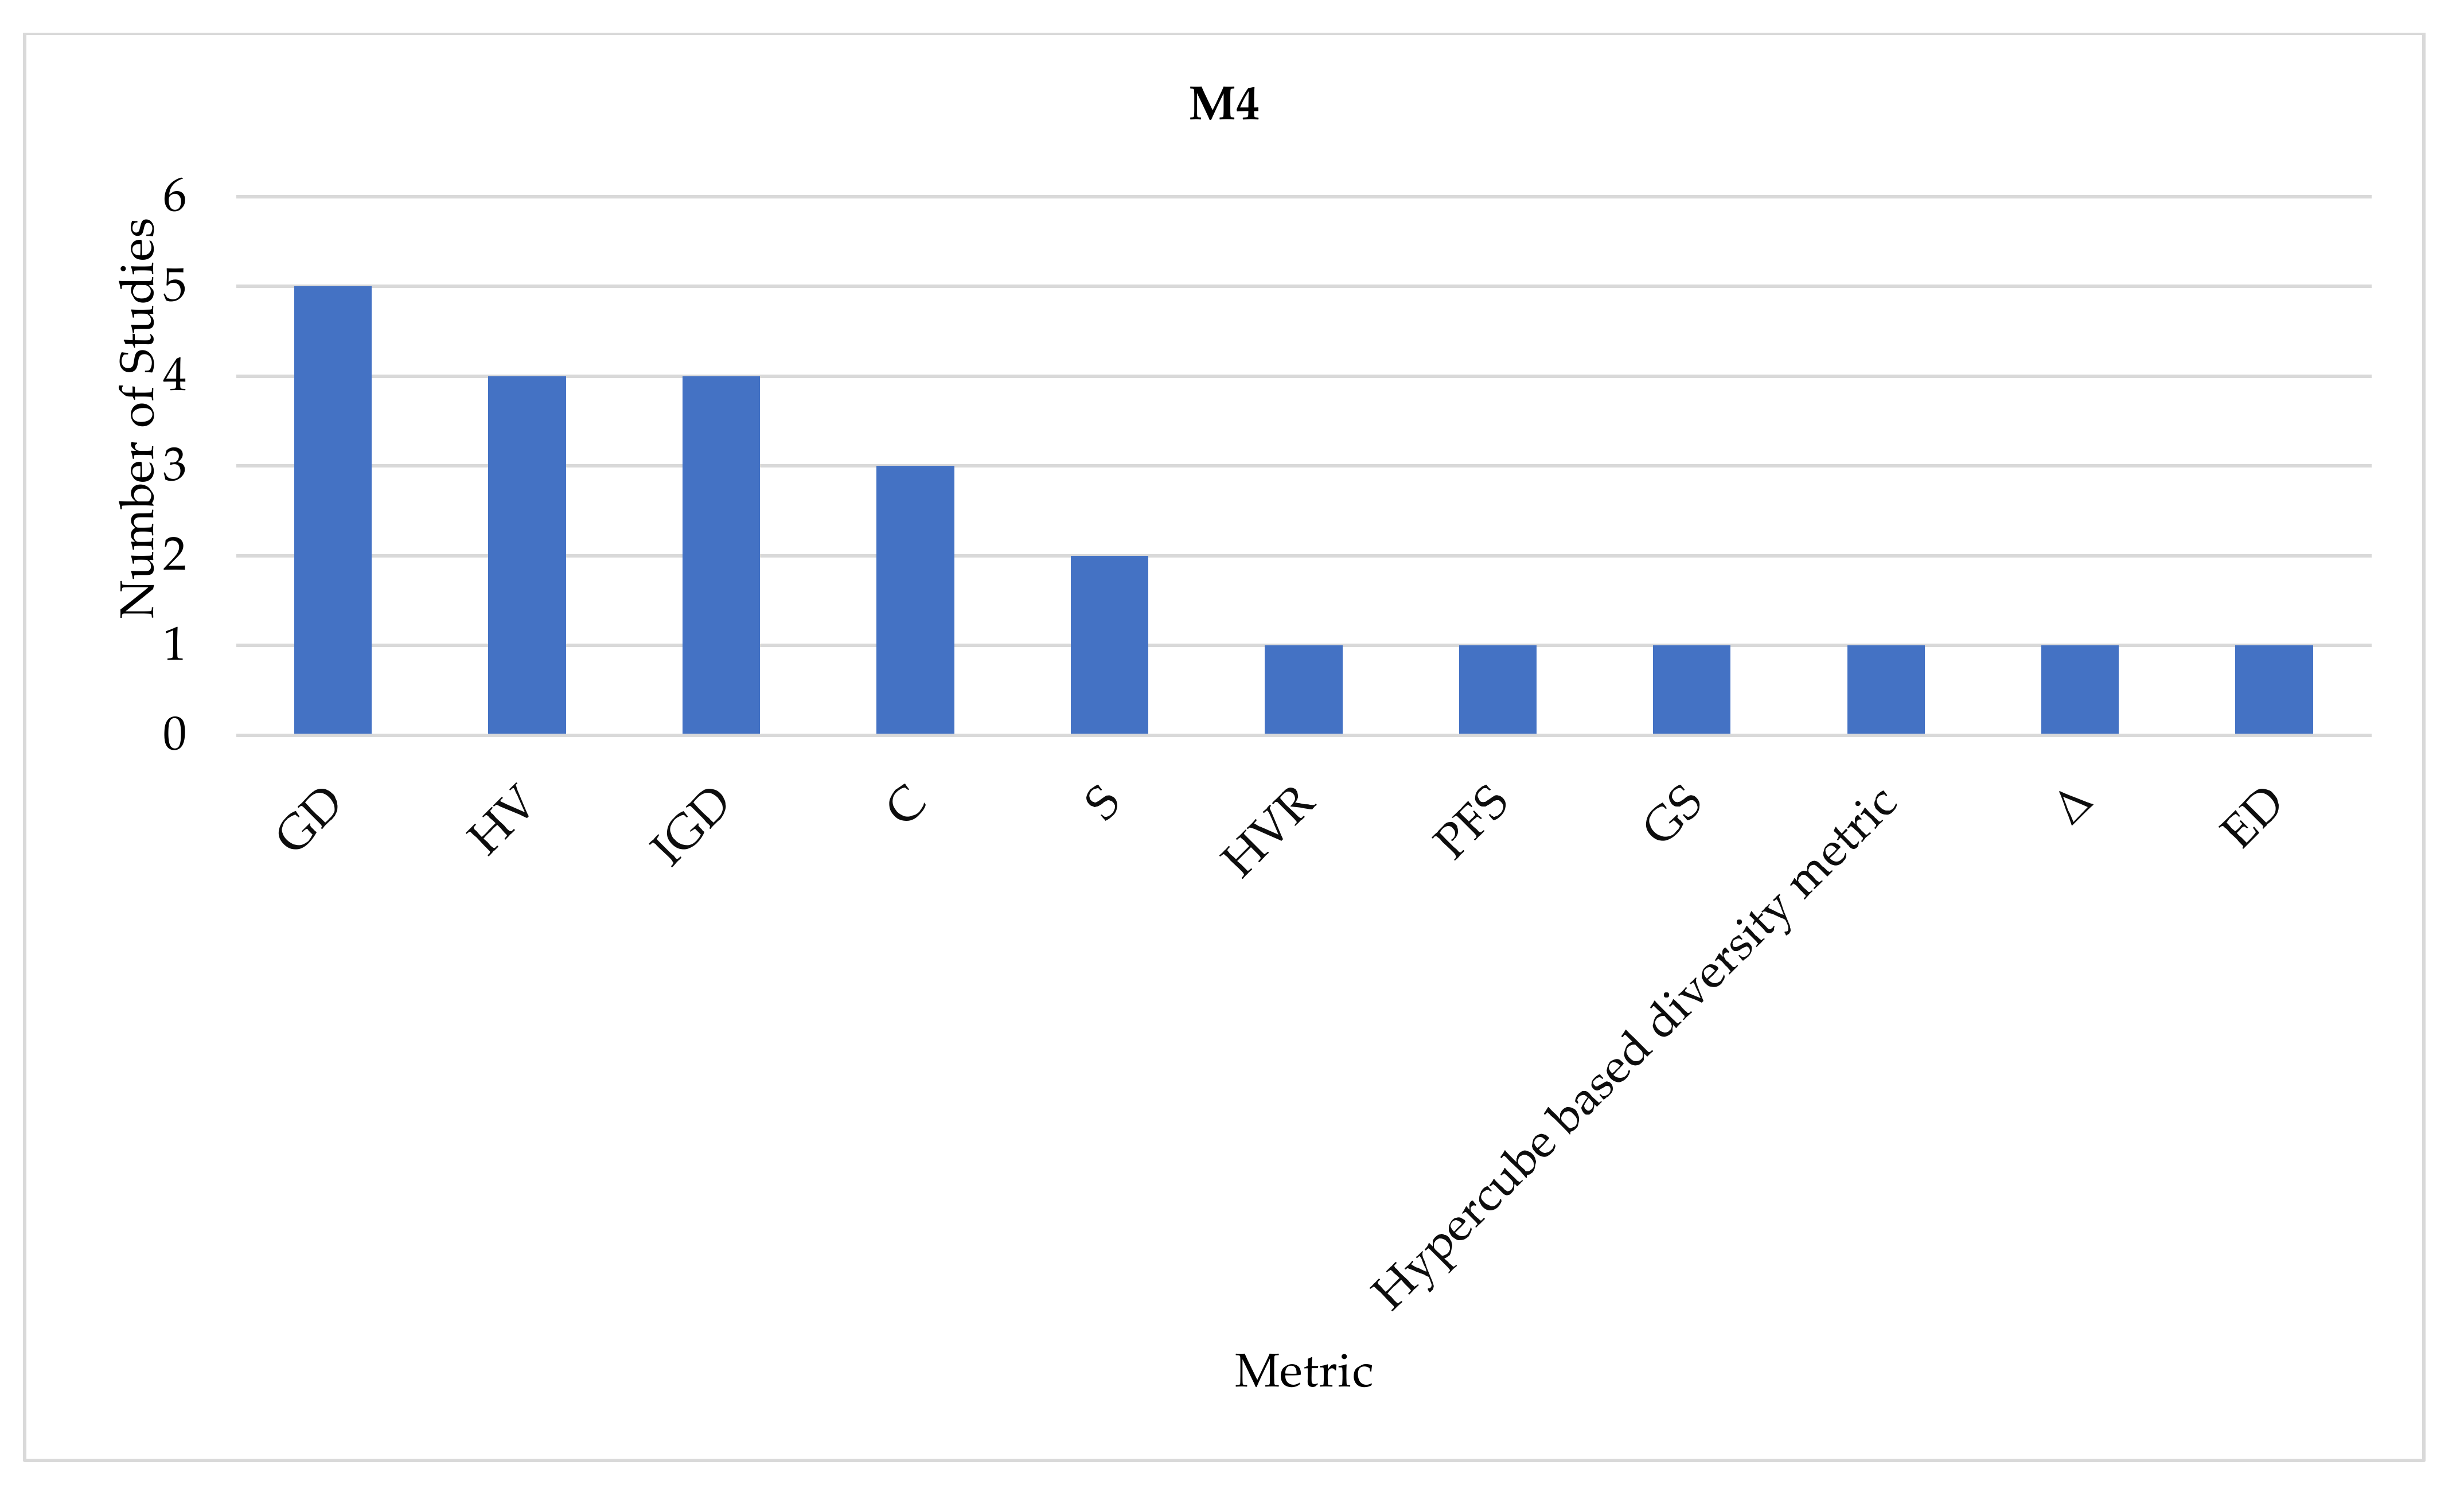
In the M4 group, as Figure 7 shows, GD is the most used for the first time, having been used five times, and HV and IGD are in second position, having been used four times. In this graph, 11 unique metrics are involved with a total of six articles in the set (M4) and a two-set coverage (C). Spacing (S) metrics gained three and two, respectively, while the rest of the metrics had one use in each, which are HVR, PFS, GS, the hypercube-based diversity metric, ∆, and ED metrics.
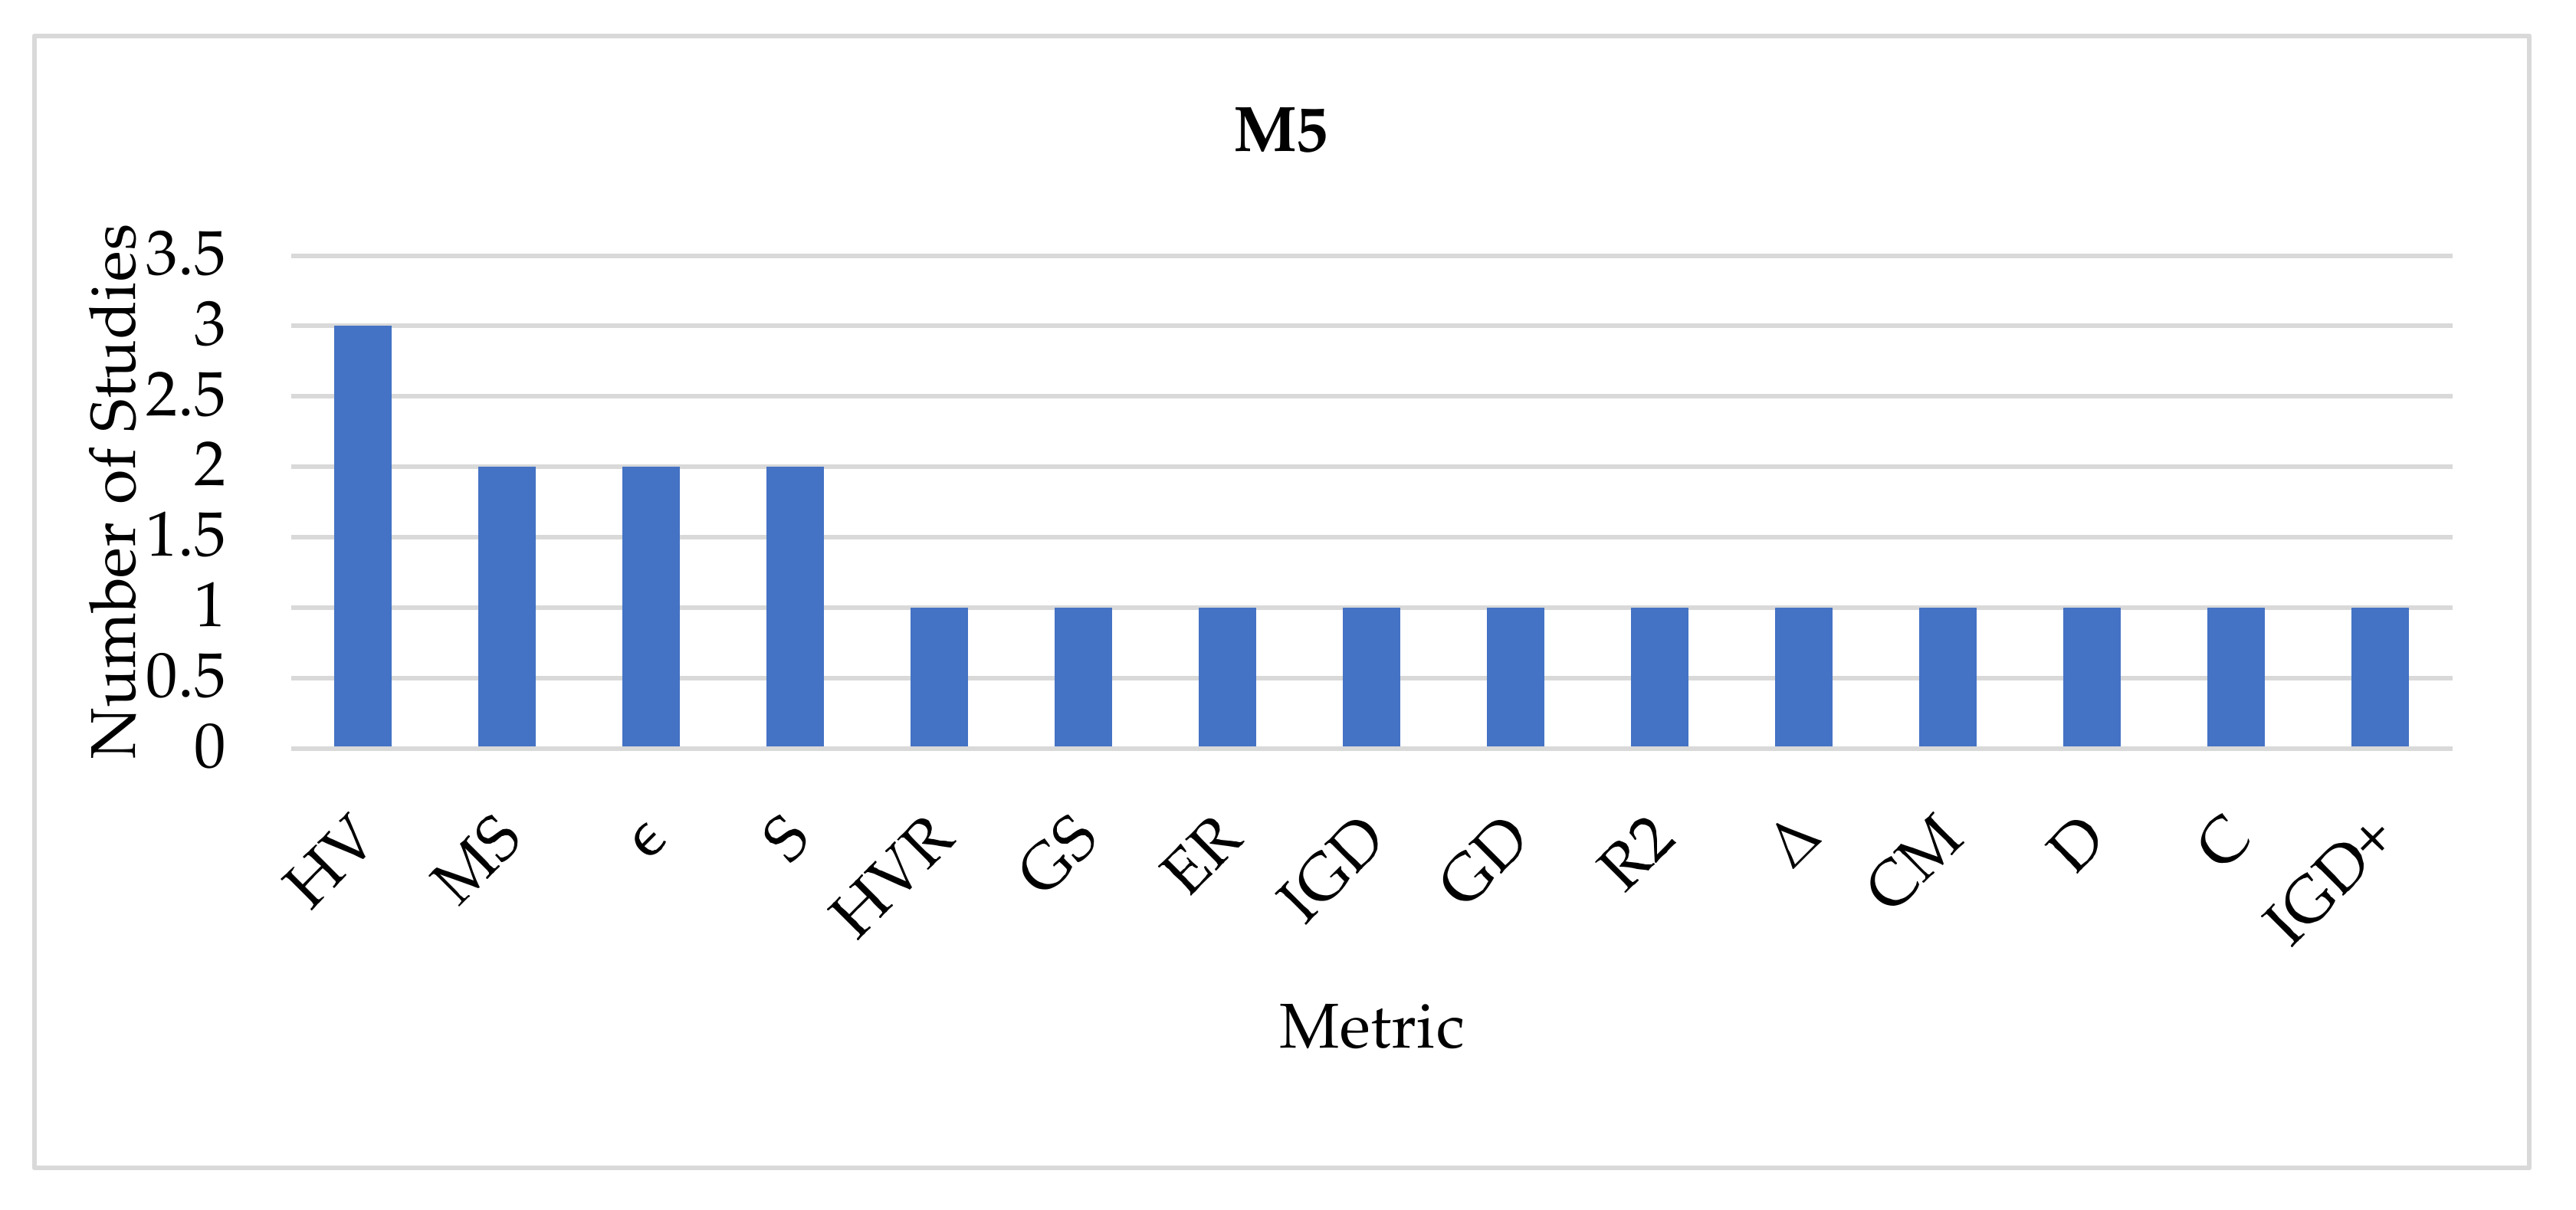
In Figure 8, although the articles utilizing more than two metrics are lower in number, the number of unique metrics is high. The figure indicates 15 unique metrics with the frequency used for each metric and their scores as follows: HV was used three times, and MS, ϵ, and S were used two times each, while the rest (HVR, GS, ER, IGD, GD, R2, ∆, CM, D, C, and IGD+) were reported only one time each.
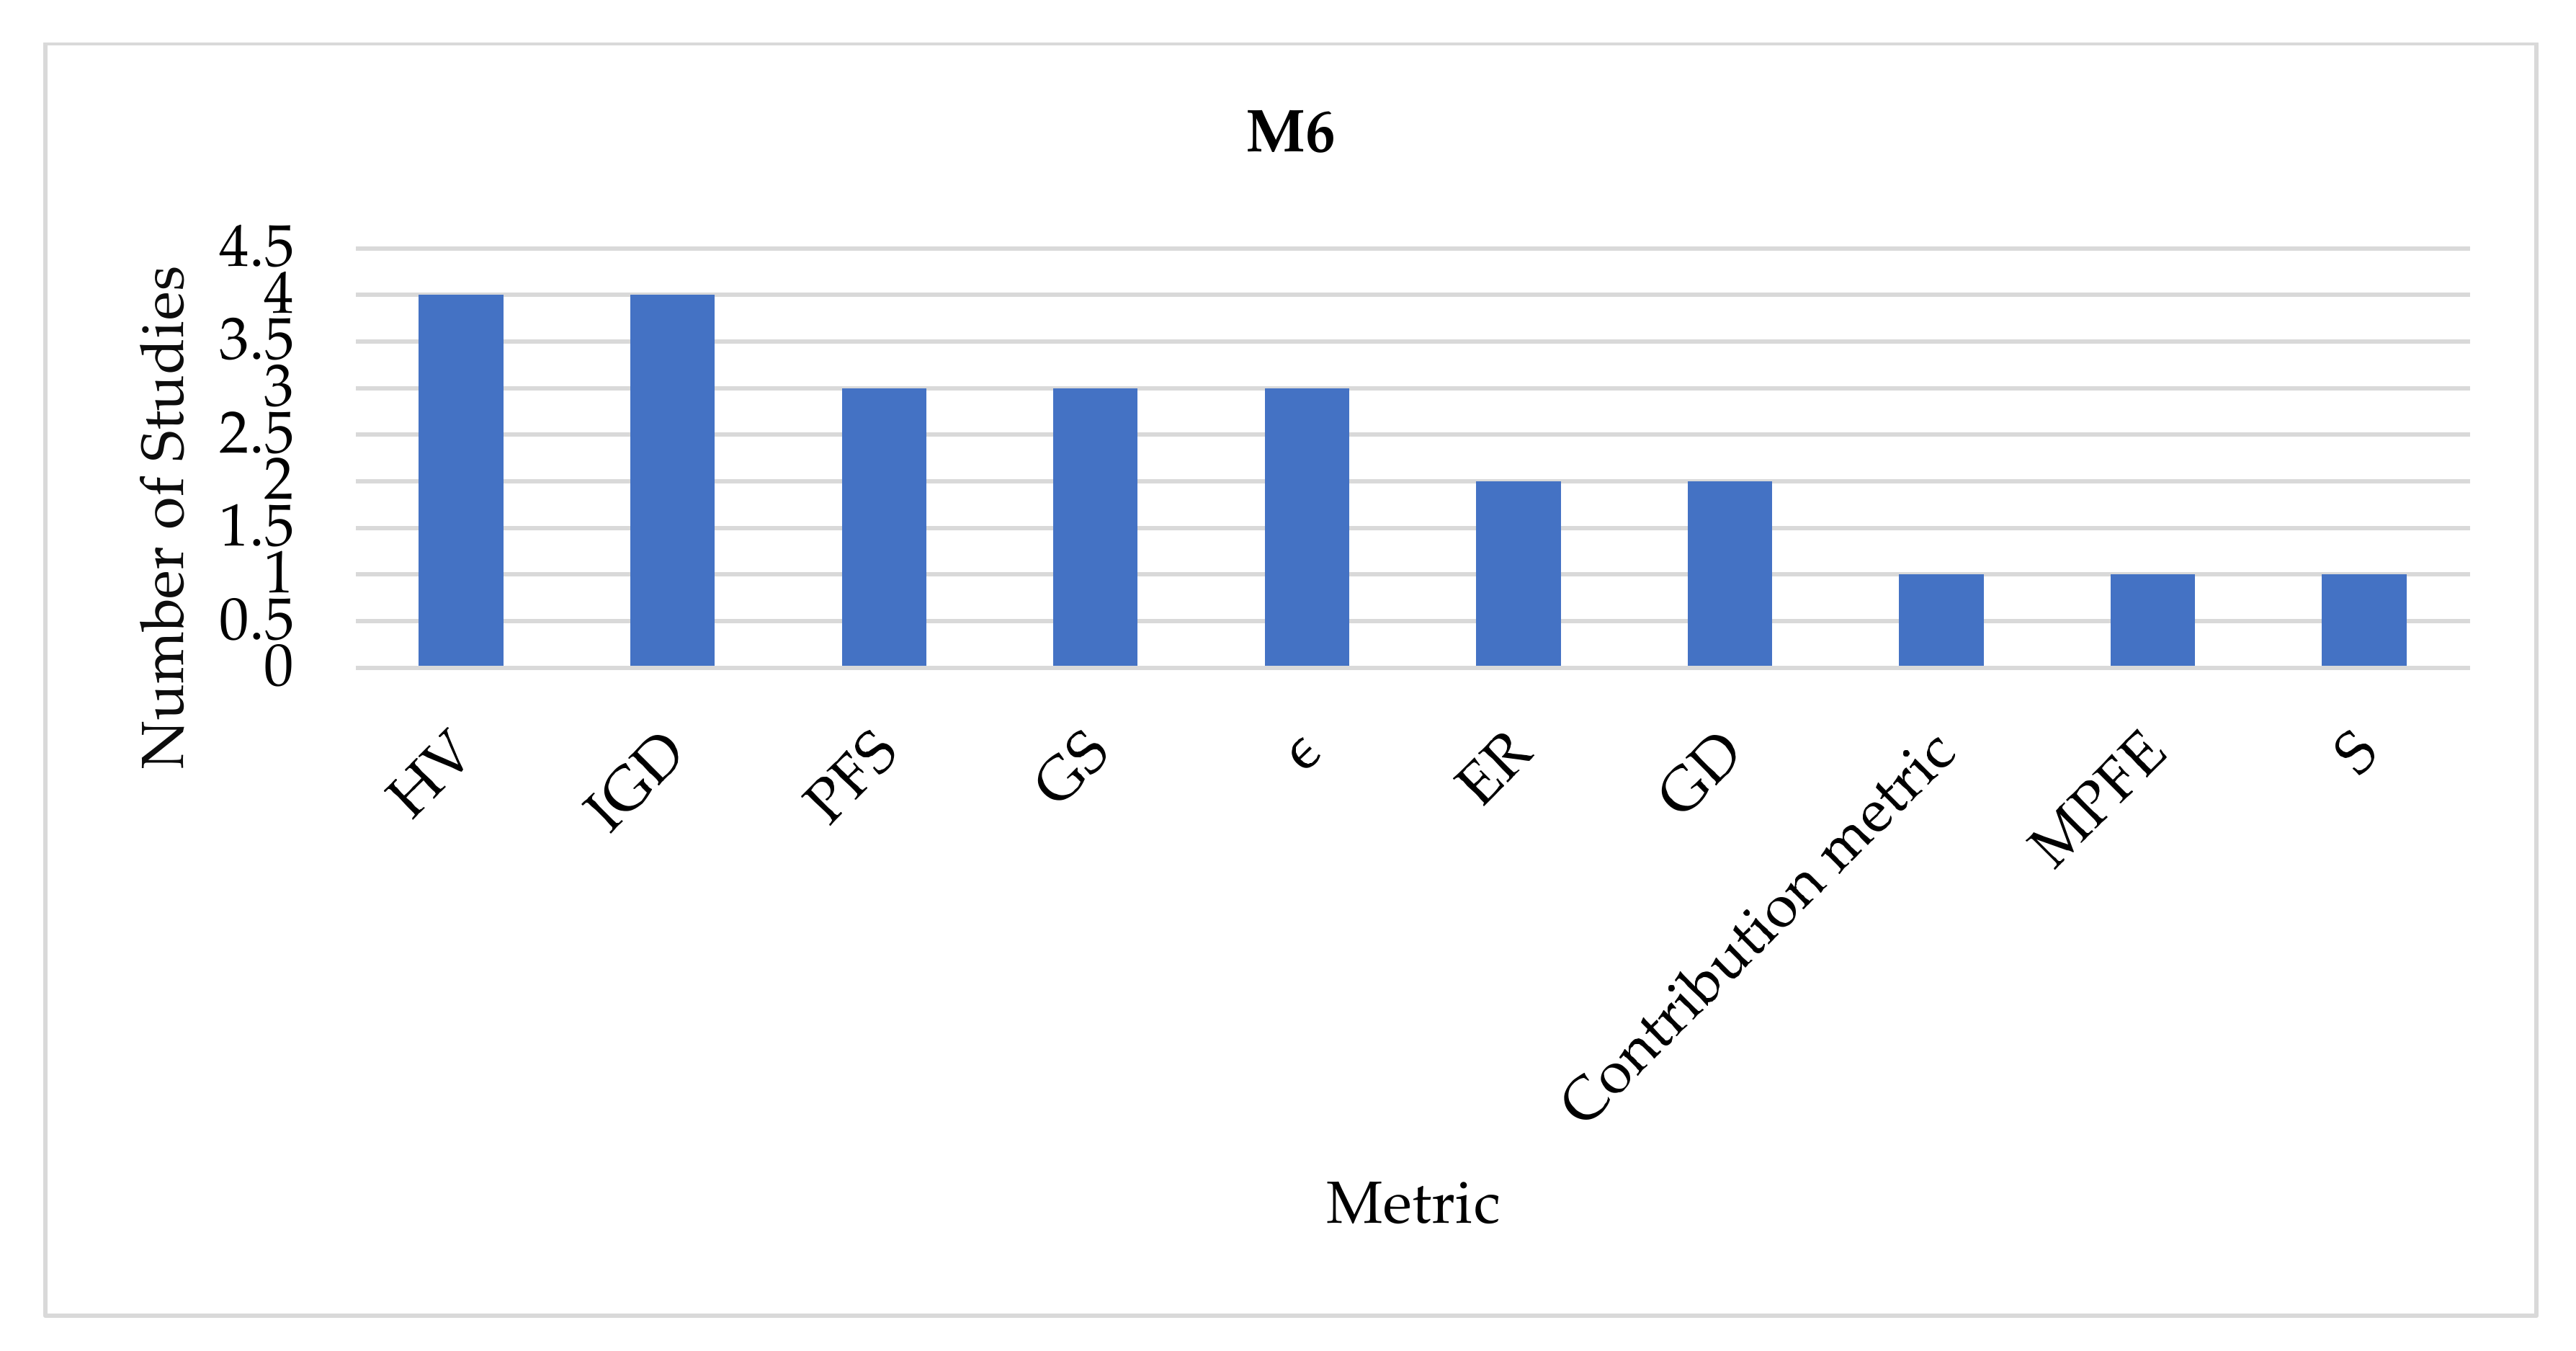
Finally, articles that employed six metrics (M6) were also fewer in quantity (four in total), and they used ten unique metrics. Figure 9 shows the frequencies of these metrics. HV and IGD had four each, and the remaining eight metrics were reported with three different scores: PFS, GS, and ϵ had three each, ER and GD had two each, while the contribution metric, MPFE, and S were reported once each.
Although the total of the unique reported metrics is 27 out of 105 articles, and they are repeatedly used in some of them. From this perspective, we can answer another research question on the total ranks of these 27 metrics over the studies.
RQ3: What is the rank order of the metrics most or least used in the studies?
To show the overall metrics with their ranks by calculating the total frequency of each metric, the above-mentioned analysis was used to determine how group studies employed these metrics in separate representations. Thus, in this section, the most or least used metrics (high or low in frequency) are described using their total frequencies. Table 3 shows the 27 unique metrics grouped based on their frequencies in column two. This means those that received the same value will be in the same set or rank. Column three shows the percentages calculated for each metric as the product of the frequency/total frequency of 168 multiplied by 100. Please note the total of the percentage values should be calculated as follows. For example, frequency number five has three metrics in that position (PFS, GS, C), and each of them has the value 3.0%, which means their total must be calculated as 3.0 + 3.0 + 3.0 = 9, and the rest should be calculated in the same manner (only if a set of metrics is in the cells) to reach a total of 100%.
The result is that HV has the highest frequency of 54, and is, thus, positioned in the first position in terms of the number of times used (frequency), and in percentage, this metric accounts for 32.1%. In the second position, IGD is presented, which has a frequency of 17 and accounts for 10.1% of the total. In position three and four, GD and the hypercube-based diversity metric (also called spread [S]) scored 12 and 10 in frequency and 7.1% and 6.0% in the percentage column, respectively. The reaming metrics are less than 6.0% in score; hence, they are the least used metrics in this report. In position five (∆, ϵ, S) and six (NDS, ED), there are sets of metrics in the cells with total frequency scores of 8 and 6 and percentages of 4.8% and 3.6%, respectively. As shown in Table 3, the rest of the metrics account for less than 3.6% in scores. However, another RQ mainly concerns how the top metric evolution was based on grouping.
RQ4: How do the top popular metrics (>5%) increase or decrease in the studies?
To answer this question, we need to show the distribution of special metrics, particularly those used more than 5%, in order to increase our knowledge about how these metrics got increasingly popular or when they decreased in the overall studies. We made a bar chart to visualize the distribution of these metrics over the above-mentioned groups (M1 to M6). Figure 10 shows that for M1, M2, M3, and M5, the HV metric was the most used, and for the rest, it was used less than in M1 and M2. For the M4 and M5 groups, HV and IGD were comparable. In M2, IGD, the hypercube-based diversity metric, and GD appeared with higher values, respectively. Although the number of publications in the remaining sets is less than the previous ones, some of the metrics in this list also decreased in use, such as the hypercube-based diversity metric, which declined in use after its first appearance in M2, and it was not reported in M1, M5, or M6, while IGD was represented in all of the groups and GD is present in M2–M6. However, the graph shows most of the studies relied on HV in M1 and in M2 when the studies started using more than two metrics together with other metrics, such as IGD, GD, and the hypercube-based diversity metric. In all of the groups, HV was top-ranked except in M4, where GD was highest in frequency, and M6, where it was equal with IGD. It must be noted, however, that there are more studies in M1 and M2 (43 articles in total) compared to M3, M4, M5, and M6. This means most of the studies (according to M1–M6) employed one or two metrics, as shown in Figure 3 and Table 4. In short, this graph shows HV is preferred for DM when it comes to using one metric, while the rest of these metrics only become desirable when it comes to using more than one metric.
RQ5: How well do the current studies in SBSE use performance metrics?
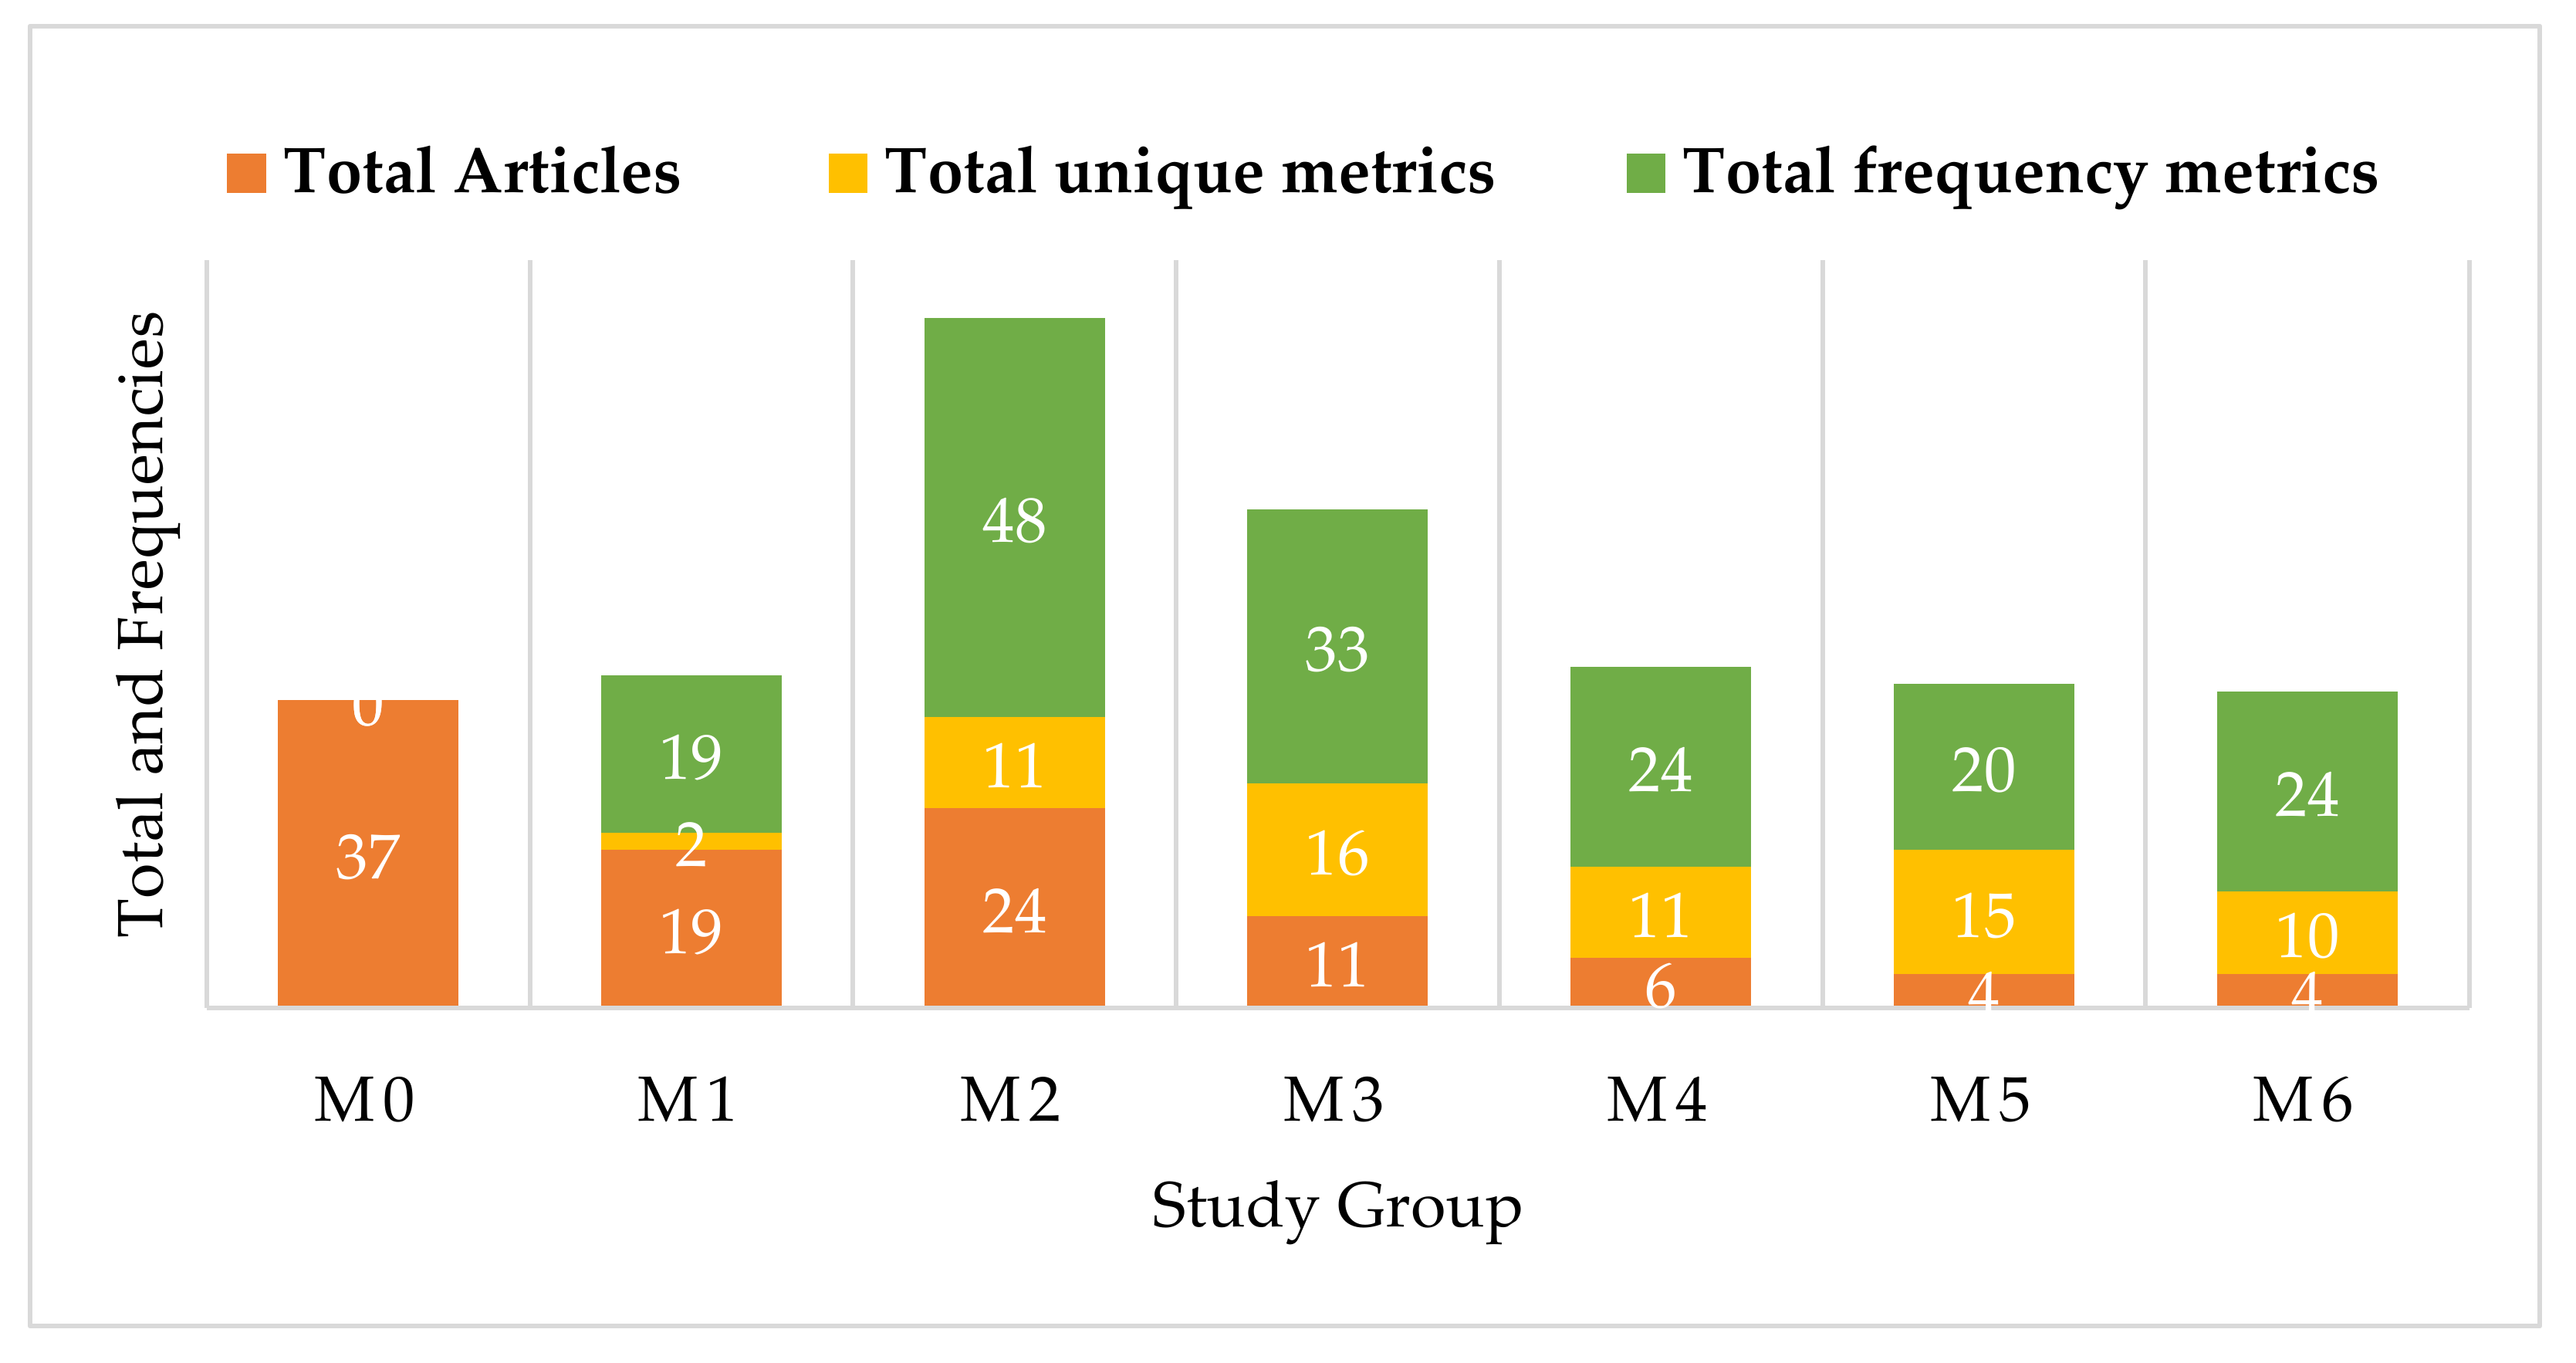
In Table 4, the total 105 articles and the study groups (M0 to M6) together with their references are reported. The total number of articles in each set (as earlier mentioned) together with the total number of unique metrics employed in each set and the total frequencies of use shown in Figure 10 visually emphasize that more metrics are used in sets M2, M3, M4, M5, and M6. Thus, while the articles involved are fewer in quantity, more diverse metrics were used.
Regarding the data presented in Figure 11, it is worth mentioning that the M1 group has a total of 19 studies that used single metrics, comprising a total of two unique metrics (HV and IGD) with a frequency of 19; however, 18 of them were HV, while the remaining one was IGD. In the same figure, the rest of the groups maintain a good diversity of metrics. This indicates that few studies utilized multiple metrics in their research, but the total number of unique metrics was high. For example, studies that employed more than four metrics employed the highest number of metrics: M3 = 16, M4 = 11, M5 = 15, and M6 = 10 metrics.
RQ6: What are the number of objectives used in the studies?
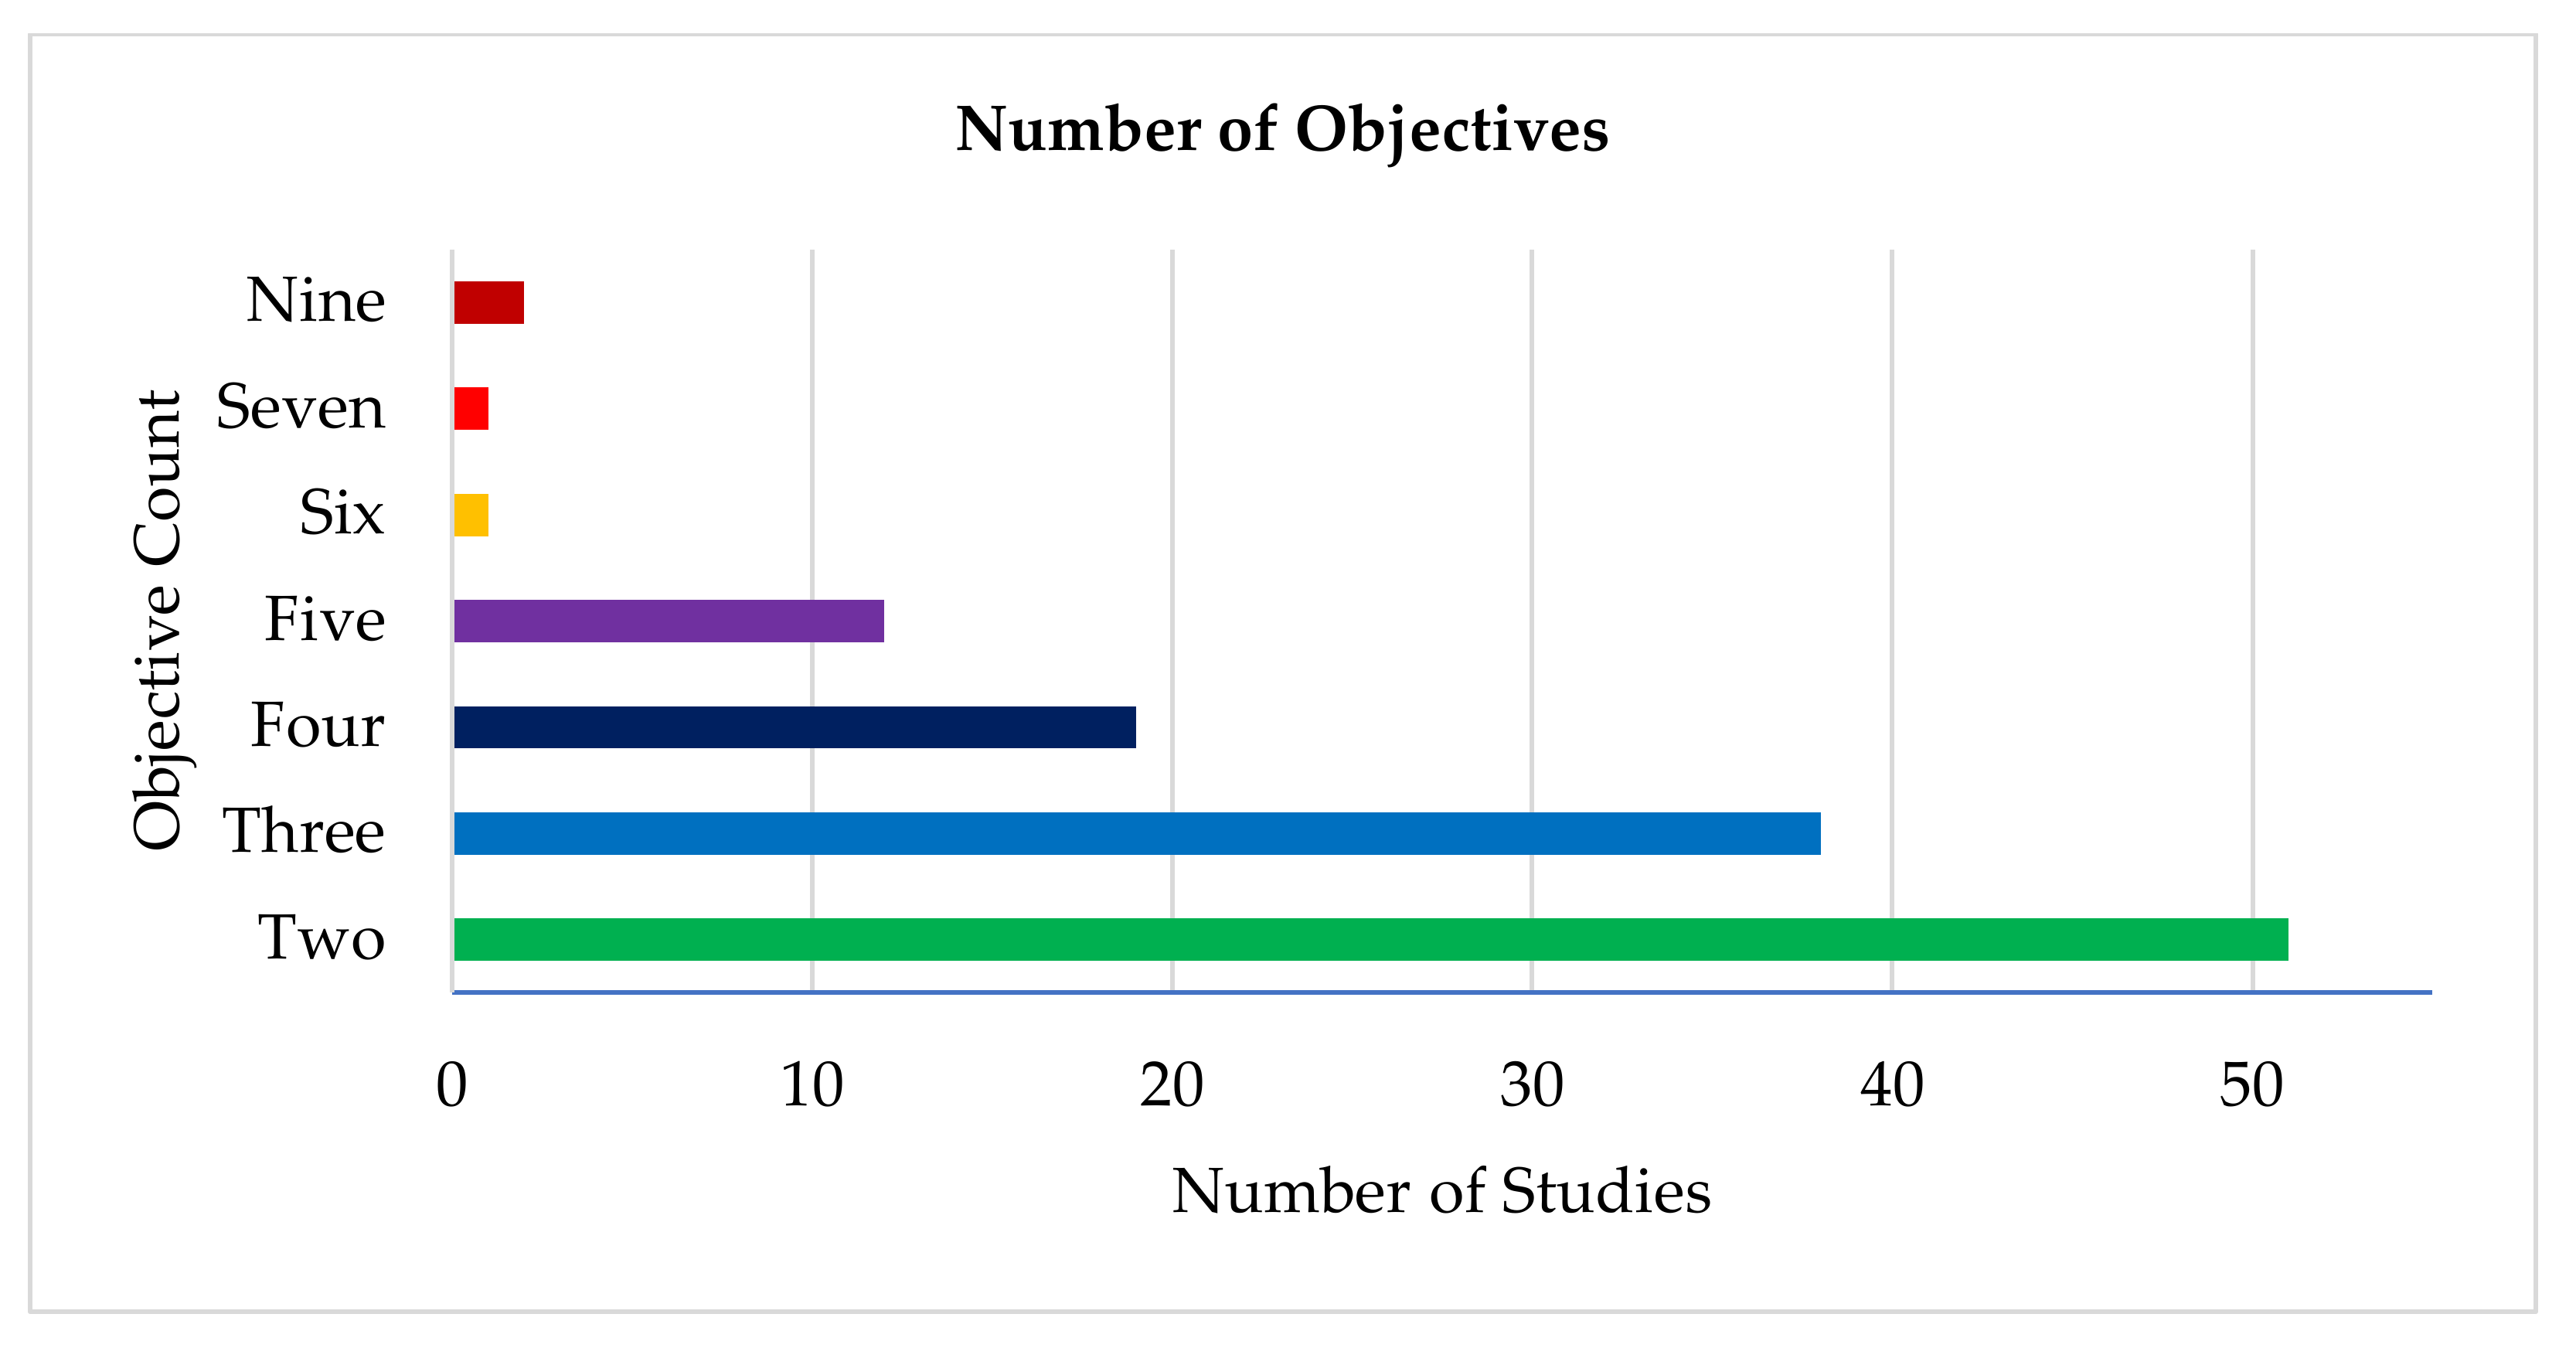
Figure 12 shows the number of objective functions or problems formulated in the community. As above-mentioned there are MOPs with no more than three objectives (2 and 3) and MaOPs with more than three objectives. As shown in Figure 12, two and three objectives are the most re-formulated problems, while there are increasing interest in the community in formulating MaOPs compared to previous studies’ review [19], although there are number of studies that formulated a different number of objectives in a single study, such as References [75,76,86,91,95,96,102,108,109,117,122,123,124,125,133,138,146,147]. Table 5 references of these objectives are stated.
RQ7: What are the applied areas in SE of the studies?
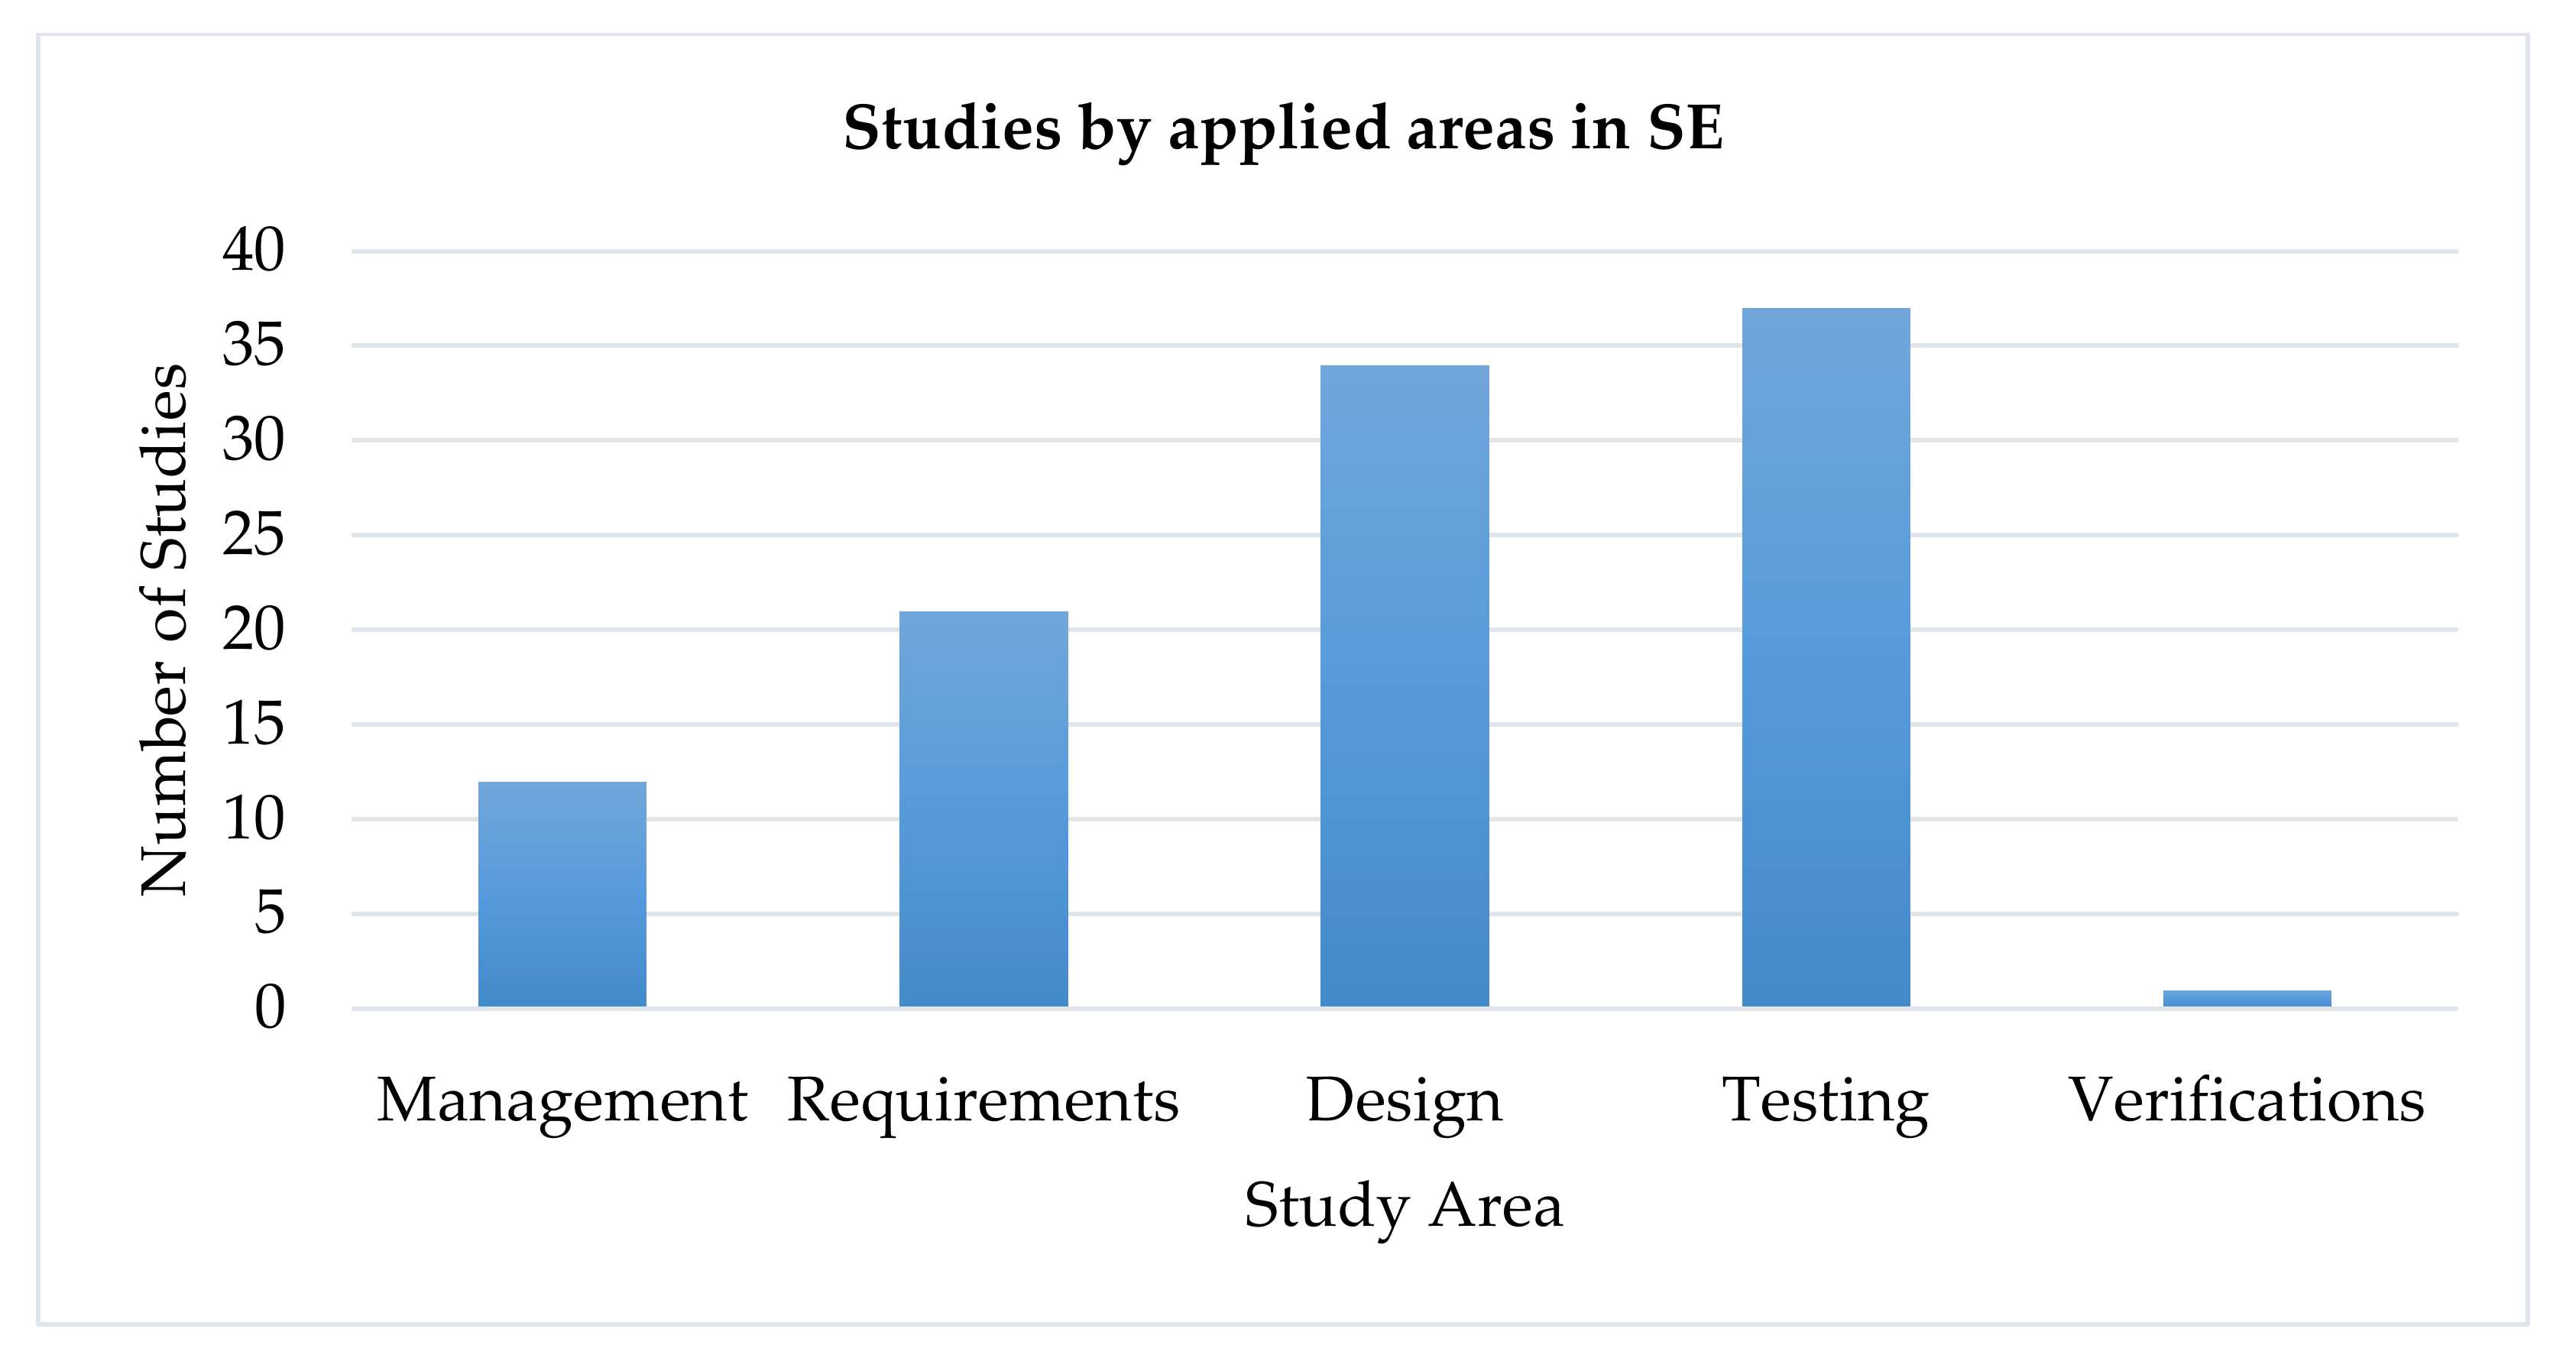
To answer this question, we adopt the grouping made by the previous related studies [19,20]. Figure 13 shows the studies’ distribution of common software engineering areas. As shown in the graph, software testing is the most applied area, while the graph shows a decline for software design, requirements, management, and verifications, respectively. This also indicates that the SBSE community practically applied many applicable areas in SE fields, and we believe some are still not mature, yet they are gaining popularity in the community. On the other hand, some questions may arise regarding the popularity of software testing or design. There are many convincing facts, and some are historically related. For example, early SBSE studies were on software testing, and this might lead to a new research gap or discoveries that result in further investigation. Another fact is that software testing is a perfect fit for automation that might be applicable to SBSE, as well, although testing activities are considered the most expensive in SE in terms of time, cost, and resources. Regarding this aspect, practitioners might prefer to optimize conflicting objectives, while SBSE pioneers believe the metric richness in SE fields is a perfect fit for applying search-based methods. However, it is unknown if testing and design have more metrics compared to other fields. Table 6 lists the references for applied areas in SE.
RQ8: What are the performance metrics distribution in each SE applied areas?
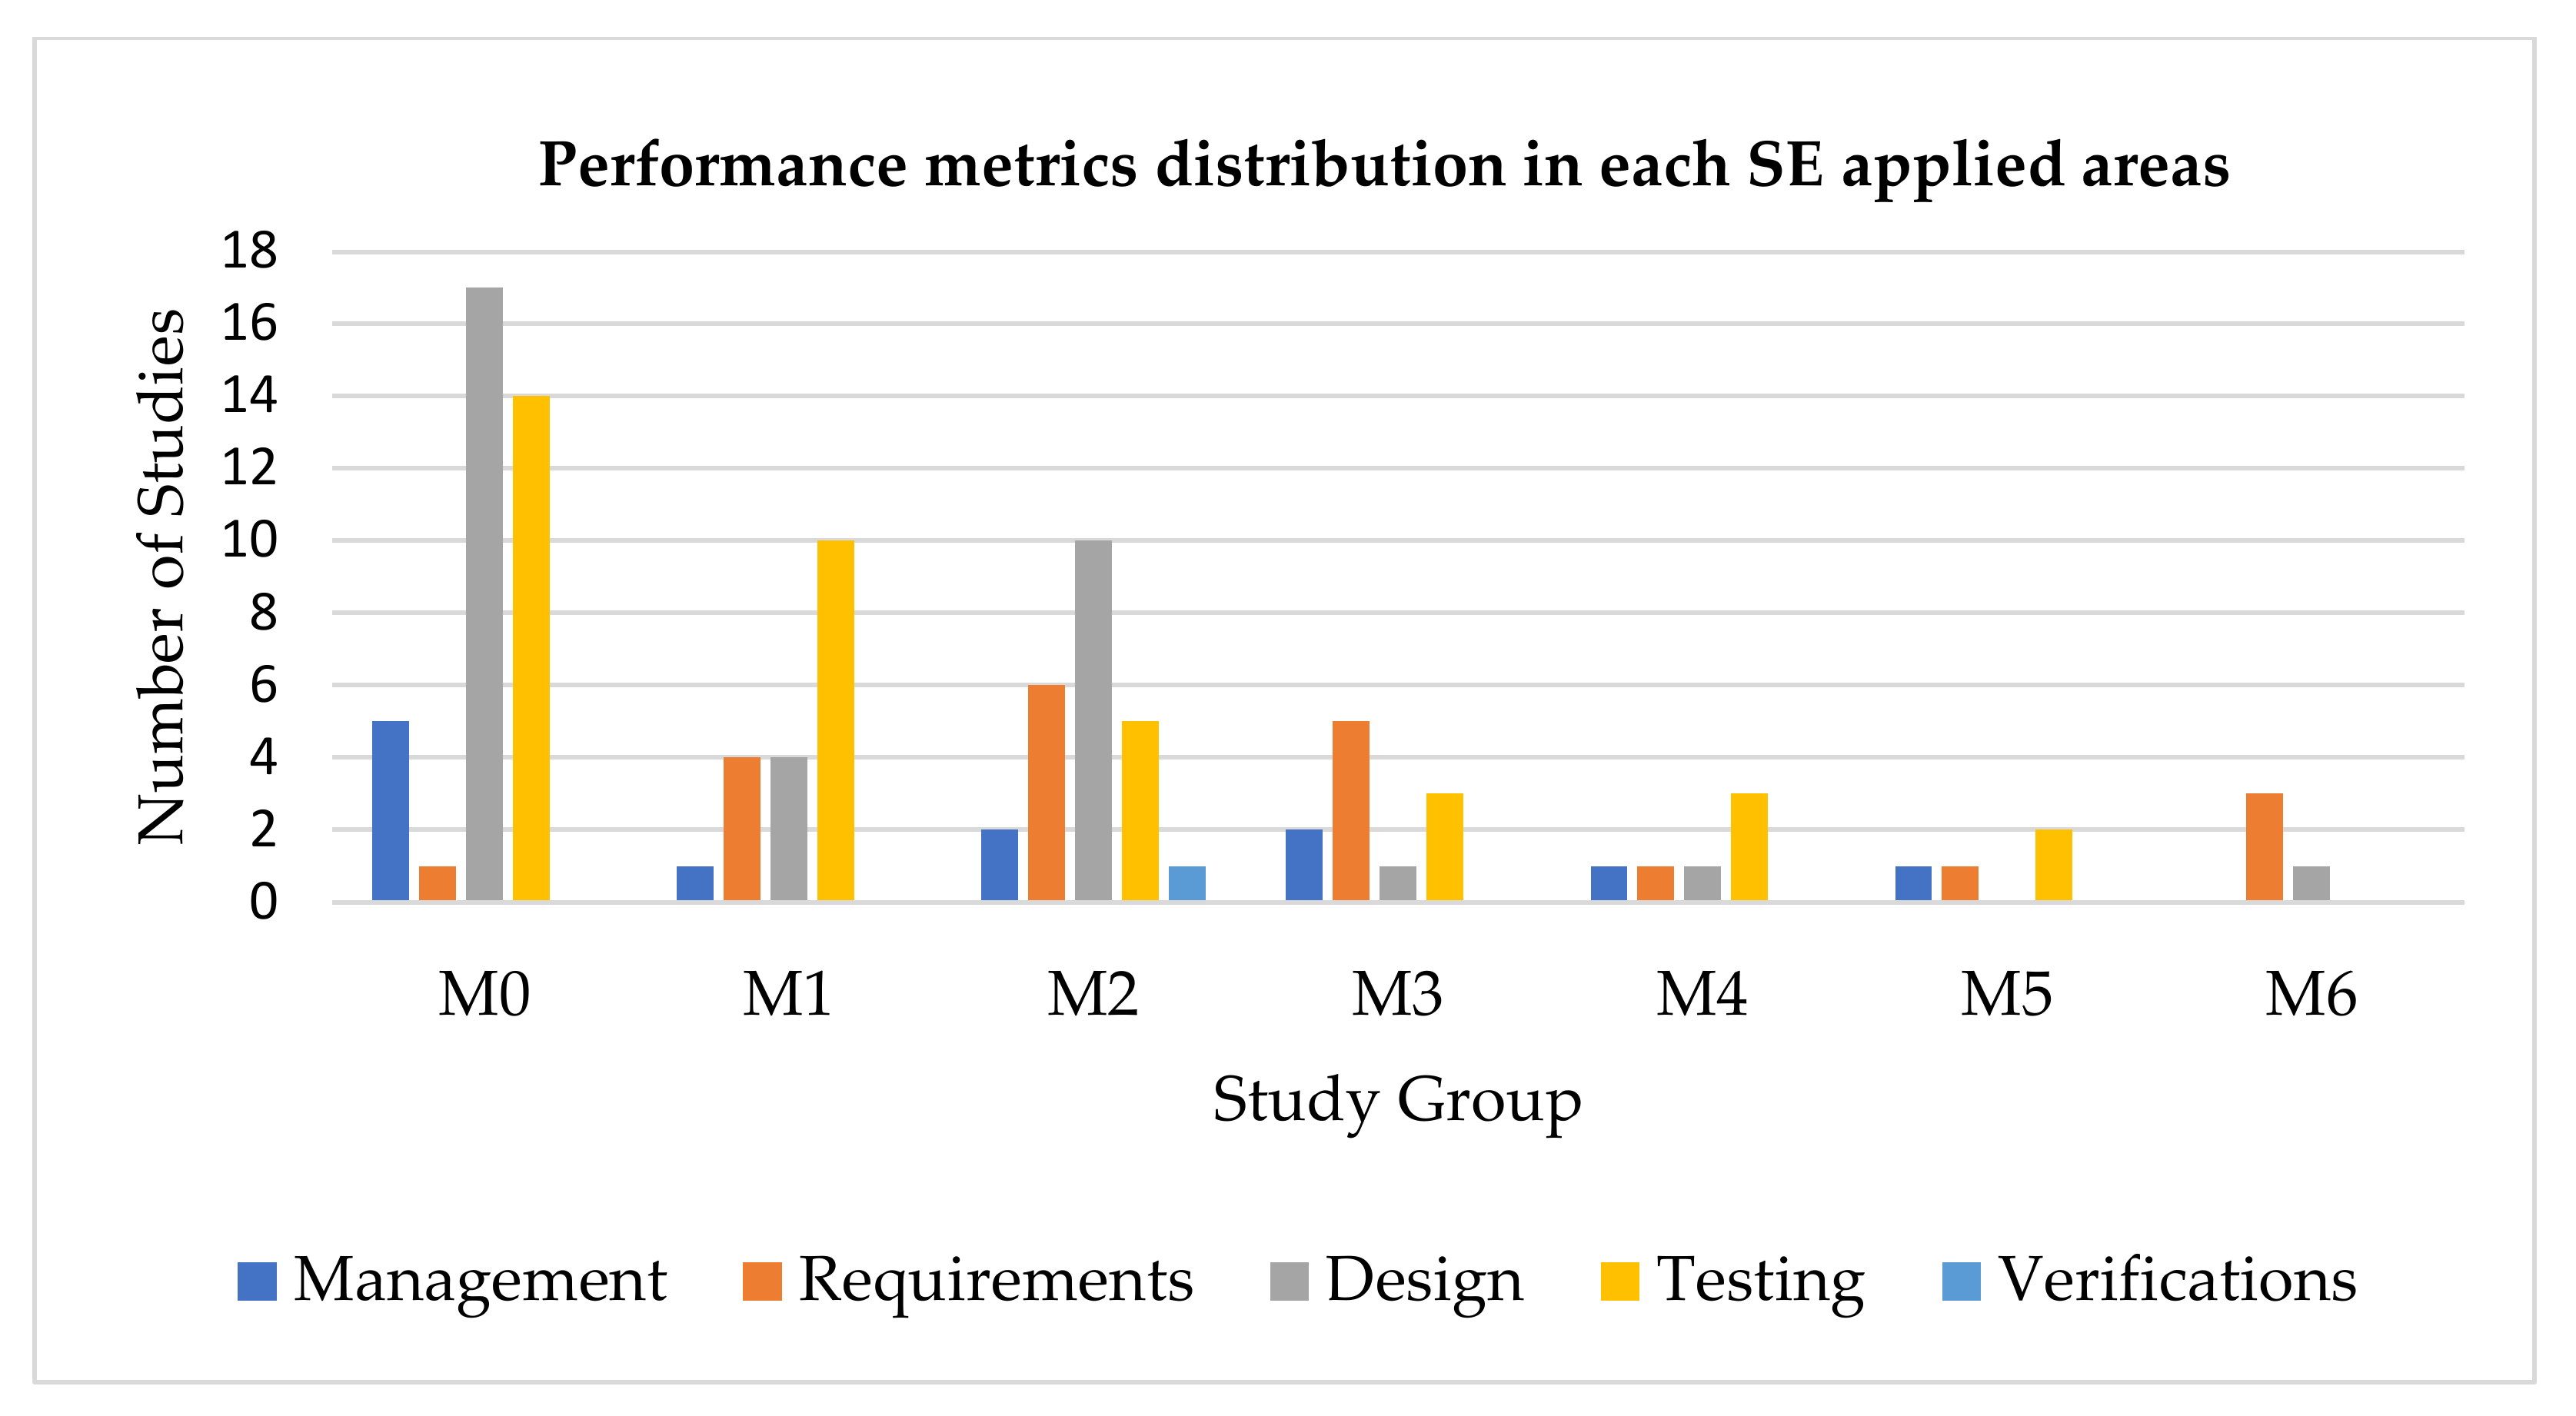
In this section, we show how the different performance metrics, based on the grouping (M0–M6) are distributed on the applied areas reported in Figure 13. Regarding the data presented in Figure 14 shows that requirement-based studies are the lowest in numbers in M0 group (studies reported zero metric), only one study contributes to this list, while design-based publications are the highest with a total of 17 studies in the same group, yet, both requirement and design studies maintained consistency with the rest of the groups (M1 to M6), except design-based studies which had not appeared in M5 group. On the other hand, studies under management areas are the second-lowest according to M0, M2, and M3 sets, but also appeared in M4 and M5. Although the testing areas are the highest in numbers and verification studies are the lowest, yet, testing areas become the second highest in M0, and ranked in second-lowest in M2 and M3, while there are studies that employed four metrics and six metrics in M4 and M5, respectively, but had not appeared in M6 group. Generally, the graph shows a decline in the studies that employed more than two metrics.

5. Discussion and Conclusions

Performance metrics have been identified as having a promising role in better assessing the quality of solutions provided by evolutionary algorithms and perform better in comparison with them, thus becoming a key ingredient to support the preferences of decision-makers. In this paper, the aim was to show the current practices or how the SBSE practitioners used these metrics. It is believed such discoveries will eventually highlight the possible sets of metrics, objective functions, or new areas in SE to explore in the future. To achieve this, we carried out a systematic review with a guided protocol to carefully (systematically) plan, collect, and present the dominant results, in detail. We technically defined the relevant research questions to answer and also conducted a manual search from a set of digital libraries to select the candidate papers. Inclusion and exclusion criteria were applied, and finally, the desired extracted data were stored in Excel worksheets. We then discussed the outcomes using tables and graphs to better digest the data. As a result, the final 105 relevant publications revealed that there are (based on the groupings) several studies that employed zero metrics (solver metrics). In the SBSE community, it is preferable to use more metrics, and it is worth noting that only four studies employed six metrics, and four others used five metrics. In addition, the analysis also discovered the number of sets of metrics used in the studies and their ranks over the study groups. To this effect, HV was the most widely used individual performance metric, while for groups, HV, IGD, GD, and the hypercube-based diversity metric are top-ranked, respectively (they had frequency scores of more 10). On the other hand, there is increasing interest in the community in re-formulating MaOPs with more than three objectives, additionally, software testing was the most applied area in software engineering.
Furthermore, we addressed some of the open issues found in our study, and they are mainly related to these three main areas: Performance metrics, number of objectives, and SE application areas. All the issues related to these should be addressed in the future.
Performance metric: We found that there are remarkable studies that did not employ performance metrics, while those that used two metrics increased in number, and the remaining studies, specifically in sets M3, M4, M5, and M6, used more diverse metrics. However, in the literature, most researchers did not agree to evaluate their algorithms based on a high number of performance metrics, but they agreed that no single performance metric alone can assess all the qualities of the solution sets, since each metric can only be targeted to evaluate a single or two desired properties.
Another issue is metrics preference among researchers. We observed that some of the studies justify the reason they employ these metrics as either based on a metric’s popularity (i.e., usage or related work in which it was used) or if it best fits their choice of algorithm (i.e., References [6,86,87]), while some other studies adopted some of these metrics because they are hybrids. For example, HV can cover both convergence and diversity [87], while some others avoided using more metrics because that might have led to different conclusions or threatened the validity of their results [122]. Thus, such gaps will remain in their future work [122]. Some avoid these metrics, which would be a visible gap in their future work [75]. With regard to such practice, it is also clear that the use of performance metrics has received little attention. Since the current practice is dominated using 0 to 2 metrics, hence such comparison might be unfair. Thus, we recommend employing more diverse sets of metrics, since they have been found to be low in quantity in current practice.
Other possible research gaps that deserve further investigation include other metrics, such as statistical measures, since these automated performance metrics produce sets of numerical values, and these data require the application of further statistical analysis; however, it is debatable which statistical model is best fit to describe these data.
The number of objectives: We believe in advancing the current practice of defining the objective functions in SBSE will eventually reveal new research gaps. However, there are increasing interests in the community in re-formulating MaOPs with more than three objectives. We found not all the research studies define a new problem(s), some studies apply the existed problems [102,122,125]. This depends on the objective of the paper, some papers intend to formulate new problems while others only propose a new algorithm or compare existed algorithms by either applying existed formulated problems or considering new problem formulation. However, this does not indicate the practitioners are relaying the existed formulated problems, since the majority of them are formulating new problems with several objective functions, while we have seen studies employing a different number of objectives in a single study [75,76,86,91,95,96,102,108,109,117,122,123,124,125,133,138,146,147]. Such practice of formulating a limited number of objectives shows the practitioners are either facing difficulties in re-formulating more objective functions that normally need a mathematical definition or defining a small number of objectives that are less expensive and easy to perform. It is worth mentioning that the community is lacking theoretical studies or discussions. Although, traditionally SBSE community re-formulated a single objective problem, and currently dominated by two to three objectives, however, this indicates, the opportunities of exploring a wide range of objectives are open issues.
Software engineering application areas: We observed that some of the applied areas in SE are less explored, such as requirement, management, and verification, while some areas are highly explored, such as software testing and software design. It is worth noting, that the less dominated areas indicate there are limited problems to solve in that area while the dominant areas are considered to have more diversity of problems to solve.
It is also interesting to address why some software engineering areas are less applied compared to others. Some of the factors that can be linked to this include: Some areas in software engineering disciplines are characterized to be expensive in terms of cost and time, such areas include software testing. However, decision-makers might prefer solving such constraints to have the best alternative solutions. Software testing was also considered one of those SBSE practitioners previously applying, however, over the years, the discussion was growing significantly while finding new research gaps become easy, and interest in responding to such future works is another contributing factor. Another fact is that software testing is easy to automate, thus, such automated problems are easy to measure, and such measurements are used to guide the fitness functions. Although SBSE pioneers argue that the software engineering field is rich in metric, however, this makes many areas in software engineering subfields to become fit for re-formulating as a multi-objective problem and applying search-based methods. However, it is required a future investigation and finding if software testing and software design have more metrics compared to other subfields such as management, requirement, and verification. Besides, it is recommended to explore more software engineering fields that are least applied and re-formulate their problem (e.g., formal methods).

Author Contributions

J.A.N. and T.W.K. conceived the question questions, conducted review procedure, synthesize data and wrote the paper. T.W.K., S.B., M.H.O., and S.N.K. contributed in reviewing method and editing the paper. All authors have read and agreed to the published version of the manuscript.

Funding

This study has been funded by the Ministry of Education (MOE) Malaysia under Fundamental Research Grant (FRGS) project no. 05-01-19-2199FR (5540324).

Institutional Review Board Statement

Not applicable.

Informed Consent Statement

Not applicable.

Data Availability Statement

Not applicable.

Acknowledgments

Authors would like to thank editor and all anonymous reviewers for valuable comments.

Conflicts of Interest

The authors declare no conflict of interest.

References

  1. Harman, M.; Jones, B.F. Search-based software engineering. Inf. Softw. Technol. 2001, 43, 833–839. [Google Scholar] [CrossRef] [Green Version]
  2. Harman, M.; Mansouri, S.A.; Zhang, Y. Search-based software engineering: Trends, techniques and applications. ACM Comput. Surv. (CSUR) 2012, 45, 2379787. [Google Scholar] [CrossRef] [Green Version]
  3. Fleck, M.; Troya, J.; Kessentini, M.; Wimmer, M.; Alkhazi, B. Model transformation modularization as a many-objective optimization problem. IEEE Trans. Softw. Eng. 2017, 43, 1009–1032. [Google Scholar] [CrossRef]
  4. Harman, M. The Current State and Future of Search Based Software Engineering. In Proceedings of the Future of Software Engineering (FOSE’07), Minneapolis, MN, USA, 23–25 May 2007; pp. 342–357. [Google Scholar]
  5. Tian, Y.; Cheng, R.; Zhang, X.; Cheng, F.; Jin, Y. An indicator-based multiobjective evolutionary algorithm with reference point adaptation for better versatility. IEEE Trans. Evol. Comput. 2017, 22, 609–622. [Google Scholar] [CrossRef] [Green Version]
  6. Geng, J.; Ying, S.; Jia, X.; Zhang, T.; Liu, X.; Guo, L.; Xuan, J. Supporting Many-Objective Software Requirements Decision: An Exploratory Study on the Next Release Problem. IEEE Access 2018, 6, 60547–60558. [Google Scholar] [CrossRef]
  7. Gonsalves, T.; Itoh, K. Multi-Objective Optimization for Software Development Projects. In Proceedings of the International Multiconference of Engineers and Computer Scientist 2010, Hong Kong, China, 17–19 March 2010; Lecture Notes in Engineering and Computer Science. pp. 1–6. [Google Scholar]
  8. Okabe, T.; Jin, Y.; Sendhoff, B. A Critical Survey of Performance Indices for Multi-Objective Optimization. In Proceedings of the 2003 Congress on Evolutionary Computation, 2003 (CEC’03), Canberra, Australia, 8–12 December 2003; Volume 2, pp. 878–885. [Google Scholar]
  9. Ravber, M.; Mernik, M.; Črepinšek, M. The impact of quality indicators on the rating of multi-objective evolutionary algorithms. Appl. Softw. Comput. 2017, 55, 265–275. [Google Scholar] [CrossRef]
  10. Li, M.; Yang, S.; Liu, X. Diversity comparison of Pareto front approximations in many-objective optimization. IEEE Trans. Cybern. 2014, 44, 2568–2584. [Google Scholar] [CrossRef]
  11. Deb, K. Multi-Objective Optimization Using Evolutionary Algorithms; Wiley: Chichester, UK, 2001. [Google Scholar]
  12. Zitzler, E.; Thiele, L. Multiobjective evolutionary algorithms: A comparative case study and the strength Pareto approach. IEEE Trans. Evol. Comput. 1999, 3, 257–271. [Google Scholar] [CrossRef] [Green Version]
  13. Jiang, S.; Ong, Y.S.; Zhang, J.; Feng, L. Consistencies and contradictions of performance metrics in multiobjective optimization. IEEE Trans. Cybern. 2014, 44, 2391–2404. [Google Scholar] [CrossRef]
  14. Riquelme, N.; von Lücken, C.; Baran, B. Performance Metrics in Multi-Objective Optimization. In Proceedings of the 2015 Latin American Computing Conference (CLEI), Arequipa, Peru, 19–23 October 2015; pp. 1–11. [Google Scholar]
  15. Yen, G.G.; He, Z. Performance metric ensemble for multiobjective evolutionary algorithms. IEEE Trans. Evol. Comput. 2013, 18, 131–144. [Google Scholar] [CrossRef]
  16. Cardona, J.G.F.; Coello, C.A.C. A Multi-Objective Evolutionary Hyper-Heuristic Based on Multiple Indicator-Based Density Estimators. In Proceedings of the Genetic and Evolutionary Computation Conference, Kyoto, Japan, 15–19 July 2018; pp. 633–640. [Google Scholar]
  17. Chen, T.; Li, M.; Yao, X. How to Evaluate Solutions in Pareto-based Search-Based Software Engineering? A Critical Review and Methodological Guidance. arXiv 2020, arXiv:2002.09040. [Google Scholar]
  18. Ramirez, A.; Romero, J.R.; Ventura, S. A survey of many-objective optimisation in search-based software engineering. J. Syst. Softw. 2019, 149, 382–395. [Google Scholar] [CrossRef]
  19. Sayyad, A.S.; Ammar, H. Pareto-Optimal Search-Based Software Engineering (POSBSE): A literature survey. In Proceedings of the 2013 2nd International Workshop on Realizing Artificial Intelligence Synergies in Software Engineering (RAISE), San Francisco, CA, USA, 25–26 May 2013; pp. 21–27. [Google Scholar]
  20. Colanzi, T.E.; Vergilio, S.R.; Assunção, W.K.G.; Pozo, A. Search based software engineering: Review and analysis of the field in Brazil. J. Syst. Softw. 2013, 86, 970–984. [Google Scholar] [CrossRef]
  21. Assunção, W.K.; de Barros, M.O.; Colanzi, T.E.; Neto, A.C.D.; Paixão, M.H.; de Souza, J.T.; Vergilio, S.R. A mapping study of the Brazilian SBSE community. J. Softw. Eng. Res. Dev. 2014, 2, 3. [Google Scholar] [CrossRef] [Green Version]
  22. Rezende, A.V.; Silva, L.; Britto, A.; Amaral, R. Software project scheduling problem in the context of search-based software engineering: A systematic review. J. Syst. Softw. 2019, 155, 43–56. [Google Scholar] [CrossRef]
  23. Silva, R.A.; de Souza, S.D.R.S.; de Souza, P.S.L. A systematic review on search based mutation testing. Inf. Softw. Technol. 2017, 81, 19–35. [Google Scholar] [CrossRef]
  24. Khari, M.; Kumar, P. An extensive evaluation of search-based software testing: A review. Soft Comput. 2019, 23, 1933–1946. [Google Scholar] [CrossRef]
  25. McMinn, P. Search-Based Software Testing: Past, Present and Future. In Proceedings of the 2011 IEEE 4th Int. Conference Software Testing, Verification and Validation Workshops, Berlin, Germany, 21–25 March 2011; pp. 153–163. [Google Scholar]
  26. Herrejon, R.E.L.; Linsbauer, L.; Egyed, A. A systematic mapping study of search-based software engineering for software product lines. Inf. Softw. Technol. 2015, 61, 33–51. [Google Scholar] [CrossRef]
  27. Malhotra, R.; Khanna, M.; Raje, R.R. On the application of search-based techniques for software engineering predictive modeling: A systematic review and future directions. Swarm Evol. Comput. 2017, 32, 85–109. [Google Scholar] [CrossRef]
  28. Pitangueira, A.M.; Maciel, R.S.P.; Barros, M. Software requirements selection and prioritization using SBSE approaches: A systematic review and mapping of the literature. J. Syst. Softw. 2015, 103, 267–280. [Google Scholar] [CrossRef]
  29. Mariani, T.; Vergilio, S.R. A systematic review on search-based refactoring. Inf. Softw. Technol. 2017, 83, 14–34. [Google Scholar] [CrossRef]
  30. Afzal, W.; Torkar, R.; Feldt, R. A systematic review of search-based testing for non-functional system properties. Inf. Softw. Technol. 2009, 51, 957–976. [Google Scholar] [CrossRef]
  31. Souza, J.; Araújo, A.A.; Saraiva, R.; Soares, P.; Maia, C. A Preliminary Systematic Mapping Study of Human Competitiveness of SBSE. In Proceedings of the International Symposium on Search Based Software Engineering, Montpellier, France, 8–9 September 2018; pp. 131–146. [Google Scholar]
  32. Ramirez, A.; Romero, J.R.; Simons, C.L. A systematic review of interaction in search-based software engineering. IEEE Trans. Softw. Eng. 2018, 45, 760–781. [Google Scholar] [CrossRef]
  33. Peixoto, D.C.C.; Mateus, G.R.; Resende, R.F. Evaluation of the Search-Based Optimization Techniques to Schedule and Staff Software Projects: A Systematic Literature Review. Available online: https://homepages.dcc.ufmg.br/~cascini/cascini_paper_SBSE.pdf (accessed on 15 December 2019).
  34. Li, M.; Yao, X. Quality evaluation of solution sets in multiobjective optimisation: A survey. ACM Comput. Surv. (CSUR) 2019, 52, 1–38. [Google Scholar] [CrossRef]
  35. Laszczyk, M.; Myszkowski, P.B. Survey of quality measures for multi-objective optimization. Construction of complemen-tary set of multi-objective quality measures. Swarm Evol. Comput. 2019, 48, 109–133. [Google Scholar] [CrossRef]
  36. Audet, C.; Bigeon, J.; Cartier, D.; le Digabel, S.; Salomon, L. Performance indicators in multiobjective optimization. Optim. Online 2018, 8, 546. [Google Scholar]
  37. Zitzler, E.; Thiele, L.; Laumanns, M.; Fonseca, C.M.; da Fonseca, V.G. Performance assessment of multiobjective optimizers: An analysis and review. IEEE Trans. Evol. Comput. 2003, 7, 117–132. [Google Scholar] [CrossRef] [Green Version]
  38. Wang, S.; Ali, S.; Yue, T.; Li, Y.; Liaaen, M. A Practical Guide to Select Quality Indicators for Assessing Pareto-Based Search Algorithms in Search-Based Software Engineering. In Proceedings of the 38th International Conference on Software Engi-neering, Austin, TX, USA, 14–16 May 2016; pp. 631–642. [Google Scholar]
  39. Liefooghe, A.; Derbel, B. A Correlation Analysis of Set Quality Indicator Values in Multiobjective Optimization. In Proceedings of the Genetic and Evolutionary Computation Conference 2016, Denver, CO, USA, 20–24 July 2016; pp. 581–588. [Google Scholar]
  40. Knowles, J.; Corne, D. On Metrics for Comparing Nondominated Sets. In Proceedings of the 2002 Congress on Evolutionary Computation, CEC’02, Honolulu, HI, USA, 12–17 May 2002; pp. 711–716. [Google Scholar]
  41. Kosar, T.; Bohra, S.; Mernik, M. A systematic mapping study driven by the margin of error. J. Syst. Softw. 2018, 144, 439–449. [Google Scholar] [CrossRef]
  42. Kitchenham, B.A.; Budgen, D.; Brereton, O.P. Using mapping studies as the basis for further research–A participant-observer case study. Inf. Softw. Technol. 2011, 53, 638–651. [Google Scholar] [CrossRef] [Green Version]
  43. Kitchenham, B.; Brereton, O.P.; Budgen, D.; Turner, M.; Bailey, J.; Linkman, S. Systematic literature reviews in software en-gineering–a systematic literature review. Inf. Softw. Technol. 2009, 51, 7–15. [Google Scholar] [CrossRef]
  44. Ferreira, T.N.; Vergilio, S.R.; de Souza, J.T. Incorporating user preferences in search-based software engineering: A systematic mapping study. Inf. Softw. Technol. 2017, 90, 55–69. [Google Scholar] [CrossRef]
  45. Saeed, A.; Hamid, S.H.A.; Mustafa, M.B. The experimental applications of search-based techniques for model-based testing: Taxonomy and systematic literature review. Appl. Soft Comput. 2016, 49, 1094–1117. [Google Scholar] [CrossRef]
  46. Herrejon, R.E.L.; Ferrer, J.; Chicano, F.; Egyed, A.; Alba, E. Comparative Analysis of Classical Multi-Objective Evolutionary Algorithms and Seeding Strategies for Pairwise Testing of Software Product Lines. In Proceedings of the 2014 IEEE Con-gress on Evolutionary Computation (CEC), Beijing, China, 6–11 July 2014; pp. 387–396. [Google Scholar]
  47. Praditwong, K.; Harman, M.; Yao, X. Software module clustering as a multi-objective search problem. IEEE Trans. Softw. Eng. 2010, 37, 264–282. [Google Scholar] [CrossRef]
  48. Khoshgoftaar, T.M.; Liu, Y.; Seliya, N. A multiobjective module-order model for software quality enhancement. IEEE Trans. Evol. Comput. 2004, 8, 593–608. [Google Scholar] [CrossRef]
  49. Khoshgoftaar, T.M.; Liu, Y. A multi-objective software quality classification model using genetic programming. IEEE Trans. Reliab. 2007, 56, 237–245. [Google Scholar] [CrossRef]
  50. Nguyen, M.L.; Hui, S.C.; Fong, A.C. Large-scale multiobjective static test generation for web-based testing with integer programming. IEEE Trans. Learn. Tech. 2012, 6, 46–59. [Google Scholar] [CrossRef]
  51. Paixao, M.; Harman, M.; Zhang, Y.; Yu, Y. An empirical study of cohesion and coupling: Balancing optimization and disruption. IEEE Trans. Evol. Comput. 2017, 22, 394–414. [Google Scholar] [CrossRef]
  52. Bushehrian, O. Dependable composition of transactional web services using fault-tolerance patterns and service scheduling. IET Softw. 2017, 11, 338–346. [Google Scholar] [CrossRef]
  53. Rathee, A.; Chhabra, J.K. A multi-objective search based approach to identify reusable software components. J. Comput. Lang. 2019, 52, 26–43. [Google Scholar] [CrossRef]
  54. Chhabra, J.K. Search-Based Object-Oriented Software Re-Structuring with Structural Coupling Strength. In Proceedings of the Procedia Computer Science, Bangalore, India, 21–23 August 2015; Volume 54, pp. 380–389. [Google Scholar]
  55. Kessentini, W.; Sahraoui, H.; Wimmer, M. Automated metamodel/model co-evolution: A search-based approach. Inf. Softw. Technol. 2019, 106, 49–67. [Google Scholar] [CrossRef]
  56. Chen, X.; Zhao, Y.; Wang, Q.; Yuan, Z. MULTI: Multi-objective effort-aware just-in-time software defect prediction. Inf. Softw. Technol. 2018, 93, 1–13. [Google Scholar] [CrossRef]
  57. Panichella, A.; Kifetew, F.M.; Tonella, P. A large scale empirical comparison of state-of-the-art search-based test case gener-ators. Inf. Softw. Technol. 2018, 104, 236–256. [Google Scholar] [CrossRef]
  58. Mohan, M.; Greer, D. Using a many-objective approach to investigate automated refactoring. Inf. Softw. Technol. 2019, 112, 83–101. [Google Scholar] [CrossRef] [Green Version]
  59. Kumari, A.C.; Srinivas, K. Hyper-heuristic approach for multi-objective software module clustering. J. Syst. Softw. 2016, 117, 384–401. [Google Scholar] [CrossRef]
  60. Arcuri, A. Test suite generation with the Many Independent Objective (MIO) algorithm. Inf. Softw. Technol. 2018, 104, 195–206. [Google Scholar] [CrossRef]
  61. Tawosi, V.; Jalili, S.; Hasheminejad, S.M.H. Automated software design using ant colony optimization with semantic network support. J. Syst. Softw. 2015, 109, 1–17. [Google Scholar] [CrossRef]
  62. Chhabra, J.K. Improving modular structure of software system using structural and lexical dependency. Inf. Softw. Technol. 2017, 82, 96–120. [Google Scholar]
  63. Chhabra, J.K. Preserving core components of object-oriented packages while maintaining structural quality. In Proceedings of the Procedia Computer Science, Kochi, India, 3–5 December 2014; Volume 46, pp. 833–840. [Google Scholar]
  64. Langdon, W.B.; Harman, M.; Jia, Y. Efficient multi-objective higher order mutation testing with genetic programming. J. Syst. Softw. 2010, 83, 2416–2430. [Google Scholar] [CrossRef] [Green Version]
  65. Jalali, N.S.; Izadkhah, H.; Lotfi, S. Multi-objective search-based software modularization: Structural and non-structural fea-tures. Soft Comput. 2019, 23, 11141–11165. [Google Scholar] [CrossRef]
  66. Khanna, M.; Chaudhary, A.; Toofani, A.; Pawar, A. Performance comparison of multi-objective algorithms for test case pri-oritization during web application testing. Arab. J. Sci. Eng. 2019, 44, 9599–9625. [Google Scholar] [CrossRef]
  67. Rathee, A.; Chhabra, J.K. Reusability in multimedia softwares using structural and lexical dependencies. Multimed. Tools Appl. 2019, 78, 20065–20086. [Google Scholar] [CrossRef]
  68. Mansoor, U.; Kessentini, M.; Wimmer, M.; Deb, K. Multi-view refactoring of class and activity diagrams using a mul-ti-objective evolutionary algorithm. Softw. Qual. J. 2017, 25, 473–501. [Google Scholar] [CrossRef]
  69. White, D.R.; Arcuri, A.; Clark, J.A. Evolutionary improvement of programs. IEEE Trans. Evol. Comput. 2011, 15, 515–538. [Google Scholar] [CrossRef] [Green Version]
  70. Sabbaghi, A.; Keyvanpour, M.R. A Novel Approach for Combinatorial Test Case Generation Using Multi Objective Optimization. In Proceedings of the 2017 7th International Conference on Computer and Knowledge Engineering (ICCKE), Mashhad, Iran, 26–27 October 2017; pp. 411–418. [Google Scholar]
  71. Whigham, P.A.; Owen, C. Multi-Objective Optimisation, Software Effort Estimation and Linear Models. In Proceedings of the Asia-Pacific Conference on Simulated Evolution and Learning, Dunedin, New Zealand, 15–18 December 2014; pp. 263–273. [Google Scholar]
  72. Hrubá, V.; Křena, B.; Letko, Z.; Pluháčková, H.; Vojnar, T. Multi-Objective Genetic Optimization for Noise-Based Testing of Concurrent Software. In Proceedings of the International Symposium on Search Based Software Engineering, Fortaleza, Brazil, 26–29 August 2014; pp. 107–122. [Google Scholar]
  73. Shuaishuai, Y.; Dong, F.; Li, B. Optimal Testing Resource Allocation for Modular Software Systems Based-On Mul-ti-Objective Evolutionary Algorithms with Effective Local Search Strategy. In Proceedings of the IEEE Workshop Memetic Computing (MC), Singapore, Singapore, 16–19 April 2013; pp. 1–8. [Google Scholar]
  74. Yano, T.; Martins, E.; de Sousa, F.L. A Multi-Objective Evolutionary Algorithm to Obtain Test Cases with Variable Lengths. In Proceedings of the 13th Annual Conference on Genetic and Evolutionary Computation, Dublin, Ireland, 12–16 July 2011; pp. 1875–1882. [Google Scholar]
  75. Panichella, A.; Kifetew, F.M.; Tonella, P. Automated test case generation as a many-objective optimisation problem with dynamic selection of the targets. IEEE Trans. Softw. Eng. 2017, 44, 122–158. [Google Scholar] [CrossRef] [Green Version]
  76. Yoo, S.; Harman, M.; Ur, S. GPGPU test suite minimisation: Search based software engineering performance improvement using graphics cards. Empir. Softw. Eng. 2013, 18, 550–593. [Google Scholar] [CrossRef]
  77. Ouni, A.; Kessentini, M.; Sahraoui, H.; Hamdi, M.S. The Use of Development History in Software Refactoring Using a Mul-ti-Objective Evolutionary Algorithm. In Proceedings of the 15th Annual Conference on Genetic and Evolutionary Compu-tation, Amsterdam, The Netherlands, 6–10 July 2013; pp. 1461–1468. [Google Scholar]
  78. Bibi, N.; Anwar, Z.; Ahsan, A. Comparison of Search-Based Software Engineering Algorithms for Resource Allocation Optimization. J. Intell. Syst. 2016, 25, 629–642. [Google Scholar] [CrossRef]
  79. Masoud, H.; Jalili, S. A clustering-based model for class responsibility assignment problem in object-oriented analysis. J. Syst. Softw. 2014, 93, 110–131. [Google Scholar] [CrossRef]
  80. Mukherjee, R.; Patnaik, K.S. Prioritizing JUnit Test Cases Without Coverage Information: An Optimization Heuristics Based Approach. IEEE Access 2019, 7, 78092–78107. [Google Scholar] [CrossRef]
  81. Shahbazi, A.; Miller, J. Black-box string test case generation through a multi-objective optimization. IEEE Trans. Softw. Eng. 2015, 42, 361–378. [Google Scholar] [CrossRef]
  82. Marchetto, A.; Islam, M.M.; Asghar, W.; Susi, A.; Scanniello, G. A multi-objective technique to prioritize test cases. IEEE Trans. Softw. Eng. 2015, 42, 918–940. [Google Scholar] [CrossRef]
  83. Yang, B.; Hu, Y.; Huang, C.Y. An architecture-based multi-objective optimization approach to testing resource allocation. IEEE Trans. Reliab. 2014, 64, 497–515. [Google Scholar] [CrossRef]
  84. Bian, Y.; Li, Z.; Zhao, R.; Gong, D. Epistasis based aco for regression test case prioritization. IEEE Trans. Emerg. Top. Comput. Intell. 2017, 1, 213–223. [Google Scholar] [CrossRef]
  85. Zheng, W.; Wu, X.; Cao, S.; Lin, J. MS-guided many-objective evolutionary optimisation for test suite minimisation. IET Softw. 2018, 12, 547–554. [Google Scholar] [CrossRef]
  86. Wang, Z.; Tang, K.; Yao, X. Multi-objective approaches to optimal testing resource allocation in modular software systems. IEEE Trans. Reliab. 2010, 59, 563–575. [Google Scholar] [CrossRef] [Green Version]
  87. Lu, H.; Wang, S.; Yue, T.; Nygård, J.F. Automated refactoring of ocl constraints with search. IEEE Trans. Softw. Eng. 2017, 45, 148–170. [Google Scholar] [CrossRef]
  88. Li, L.; Harman, M.; Wu, F.; Zhang, Y. The value of exact analysis in requirements selection. IEEE Trans. Softw. Eng. 2016, 43, 580–596. [Google Scholar] [CrossRef]
  89. Ni, C.; Chen, X.; Wu, F.; Shen, Y.; Gu, Q. An empirical study on pareto based multi-objective feature selection for software defect prediction. J. Syst. Softw. 2019, 152, 215–238. [Google Scholar] [CrossRef]
  90. Ríos, M.Á.D.; Chicano, F.; Alba, E.; del Águila, I.; del Sagrado, J. Efficient anytime algorithms to solve the bi-objective Next Release Problem. J. Syst. Softw. 2019, 156, 217–231. [Google Scholar]
  91. Parejo, J.A.; Sánchez, A.B.; Segura, S.; Cortés, A.R.; Herrejon, R.E.L.; Egyed, A. Multi-objective test case prioritization in highly configurable systems: A case study. J. Syst. Softw. 2016, 122, 287–310. [Google Scholar] [CrossRef] [Green Version]
  92. Zhang, M.; Ali, S.; Yue, T. Uncertainty-wise test case generation and minimization for cyber-physical systems. J. Syst. Softw. 2019, 153, 1–21. [Google Scholar] [CrossRef]
  93. Pradhan, D.; Wang, S.; Yue, T.; Ali, S.; Liaaen, M. Search-based test case implantation for testing untested configurations. Inf. Softw. Technol. 2019, 111, 22–36. [Google Scholar] [CrossRef]
  94. Ferreira, T.D.N.; Kuk, J.N.; Pozo, A.; Vergilio, S.R. Product Selection Based on Upper Confidence Bound MOEA/D-DRA for Testing Software Product Lines. In Proceedings of the 2016 IEEE Congress on Evolutionary Computation (CEC), Vancouver, BC, Canada, 24–29 July 2016; pp. 4135–4142. [Google Scholar]
  95. Li, R.; Etemaadi, R.; Emmerich, M.T.; Chaudron, M.R. An Evolutionary Multiobjective Optimization Approach to Compo-nent-Based Software Architecture Design. In Proceedings of the 2011 IEEE Congress of Evolutionary Computation (CEC), New Orleans, LA, USA, 5–8 June 2011; pp. 432–439. [Google Scholar]
  96. Xue, Y.; Li, M.; Shepperd, M.; Lauria, S.; Liu, X. A novel aggregation-based dominance for Pareto-based evolutionary algorithms to configure software product lines. Neurocomputing 2019, 364, 32–48. [Google Scholar] [CrossRef]
  97. Strickler, A.; Lima JA, P.; Vergilio, S.R.; Pozo, A.T. Deriving products for variability test of feature models with a hy-per-heuristic approach. Appl. Soft Comput. 2016, 49, 1232–1242. [Google Scholar] [CrossRef]
  98. Chhabra, J.K. FP-ABC: Fuzzy-Pareto dominance driven artificial bee colony algorithm for many-objective software module clustering. Comput. Lang. Syst. Struct. 2018, 51, 1–21. [Google Scholar]
  99. Bouaziz, R.; Lemarchand, L.; Singhoff, F.; Zalila, B.; Jmaiel, M. Efficient Parallel Multi-Objective Optimization for Real-Time Systems Software Design Exploration. In Proceedings of the 27th International Symposium on Rapid System Prototyping: Shortening the Path from Specification to Prototype, Pittsburgh, PA, USA, 6–7 October 2016; pp. 58–64. [Google Scholar]
  100. Ferrer, J.; Chicano, F.; Alba, E. Evolutionary algorithms for the multi-objective test data generation problem. Softw. Pract. Exp. 2012, 42, 1331–1362. [Google Scholar] [CrossRef] [Green Version]
  101. Xue, Y.; Zhong, J.; Tan, T.H.; Liu, Y.; Cai, W.; Chen, M.; Sun, J. IBED: Combining IBEA and DE for optimal feature selection in software product line engineering. Appl. Soft Comput. 2016, 49, 1215–1231. [Google Scholar] [CrossRef]
  102. Krall, J.; Menzies, T.; Davies, M. Gale: Geometric active learning for search-based software engineering. IEEE Trans. Softw. Eng. 2015, 41, 1001–1018. [Google Scholar] [CrossRef]
  103. Ouni, A.; Kessentini, M.; Sahraoui, H.; Inoue, K.; Hamdi, M.S. Improving multi-objective code-smells correction using de-velopment history. J. Syst. Softw. 2015, 105, 18–39. [Google Scholar] [CrossRef]
  104. Durillo, J.J.; Zhang, Y.; Alba, E.; Harman, M.; Nebro, A.J. A study of the bi-objective next release problem. Empir. Softw. Eng. 2011, 16, 29–60. [Google Scholar] [CrossRef]
  105. Amaral, A.; Elias, G. A risk-driven multi-objective evolutionary approach for selecting software requirements. Evol. Intell. 2019, 12, 421–444. [Google Scholar] [CrossRef]
  106. Kumari, A.C.; Srinivas, K.; Gupta, M.P. Software Requirements Optimization Using Multi-Objective Quantum-Inspired Hy-brid Differential Evolution. In EVOLVE—A Bridge between Probability, Set Oriented Numerics, and Evolutionary Computation II; Springer: Berlin, Germany, 2013; pp. 107–120. [Google Scholar]
  107. Brasil MM, A.; da Silva TG, N.; de Freitas, F.G.; de Souza, J.T.; Cortes, M.I. A Multiobjective Optimization Approach to the Software Release Planning with Undefined Number of Releases and Interdependent Requirements. In Proceedings of the International Conference on Enterprise Information Systems, Beijing, China, 8–11 June 2011; pp. 300–314. [Google Scholar]
  108. Guizzo, G.; Vergilio, S.R.; Pozo, A.T.; Fritsche, G.M. A multi-objective and evolutionary hyper-heuristic applied to the inte-gration and test order problem. Appl. Soft Comput. 2017, 56, 331–344. [Google Scholar] [CrossRef] [Green Version]
  109. Bill, R.; Fleck, M.; Troya, J.; Mayerhofer, T.; Wimmer, M. A local and global tour on MOMoT. Softw. Syst. Model. 2019, 18, 1017–1046. [Google Scholar] [CrossRef]
  110. Ramirez, A.; Romero, J.R.; Ventura, S. Interactive multi-objective evolutionary optimization of software architectures. Inf. Sci. 2018, 463, 92–109. [Google Scholar] [CrossRef]
  111. Ramírez, A.; Parejo, J.A.; Romero, J.R.; Segura, S.; Cortés, A.R. Evolutionary composition of QoS-aware web services: A many-objective perspective. Expert Syst. Appl. 2017, 72, 357–370. [Google Scholar] [CrossRef]
  112. Ramírez, A.; Romero, J.R.; Ventura, S. A comparative study of many-objective evolutionary algorithms for the discovery of software architectures. Empir. Softw. Eng. 2016, 21, 2546–2600. [Google Scholar] [CrossRef]
  113. Colanzi, T.E.; Vergilio, S.R. A feature-driven crossover operator for multi-objective and evolutionary optimization of product line architectures. J. Syst. Softw. 2016, 121, 126–143. [Google Scholar] [CrossRef]
  114. Chen, T.; Li, K.; Bahsoon, R.; Yao, X. FEMOSAA: Feature-guided and knee-driven multi-objective optimization for self-adaptive software. ACM Trans. Softw. Eng. Methodol. (TOSEM) 2018, 27, 1–50. [Google Scholar] [CrossRef] [Green Version]
  115. Mariani, T.; Colanzi, T.E.; Vergilio, S.R. Preserving architectural styles in the search based design of software product line architectures. J. Syst. Softw. 2016, 115, 157–173. [Google Scholar] [CrossRef]
  116. Pascual, G.G.; Herrejon, R.E.L.; Pinto, M.; Fuentes, L.; Egyed, A. Applying multiobjective evolutionary algorithms to dynamic software product lines for reconfiguring mobile applications. J. Syst. Softw. 2015, 103, 392–411. [Google Scholar] [CrossRef]
  117. Ferreira, T.N.; Lima, J.A.P.; Strickler, A.; Kuk, J.N.; Vergilio, S.R.; Pozo, A. Hyper-heuristic based product selection for soft-ware product line testing. IEEE Comput. Intell. Mag. 2017, 12, 34–45. [Google Scholar] [CrossRef]
  118. Pietrantuono, R.; Potena, P.; Pecchia, A.; Rodriguez, D.; Russo, S.; Sanz, L.F. Multiobjective testing resource allocation under uncertainty. IEEE Trans. Evol. Comput. 2017, 22, 347–362. [Google Scholar] [CrossRef]
  119. Calinescu, R.; Češka, M.; Gerasimou, S.; Kwiatkowska, M.; Paoletti, N. Efficient synthesis of robust models for stochastic systems. J. Syst. Softw. 2018, 143, 140–158. [Google Scholar] [CrossRef]
  120. Wu, H.; Nie, C.; Kuo, F.C. The optimal testing order in the presence of switching cost. Inf. Softw. Technol. 2016, 80, 57–72. [Google Scholar] [CrossRef]
  121. Cai, X.; Wei, O.; Huang, Z. Evolutionary approaches for multi-objective next release problem. Comput. Inform. 2012, 31, 847–875. [Google Scholar]
  122. Chen, J.; Nair, V.; Menzies, T. Beyond evolutionary algorithms for search-based software engineering. Inf. Softw. Technol. 2018, 95, 281–294. [Google Scholar] [CrossRef] [Green Version]
  123. Assunção, W.K.; Vergilio, S.R.; Herrejon, R.E.L. Automatic extraction of product line architecture and feature models from UML class diagram variants. Inf. Softw. Technol. 2020, 117, 106198. [Google Scholar]
  124. Jakubovski Filho, H.L.; Ferreira, T.N.; Vergilio, S.R. Preference based multi-objective algorithms applied to the variability testing of software product lines. J. Syst. Softw. 2019, 151, 194–209. [Google Scholar] [CrossRef]
  125. Panichella, A.; Oliveto, R.; di Penta, M.; de Lucia, A. Improving multi-objective test case selection by injecting diversity in genetic algorithms. IEEE Trans. Softw. Eng. 2014, 41, 358–383. [Google Scholar] [CrossRef]
  126. Zhang, Y.; Harman, M.; Lim, S.L. Empirical evaluation of search based requirements interaction management. Inf. Softw. Technol. 2013, 55, 126–152. [Google Scholar] [CrossRef]
  127. Zhang, G.; Su, Z.; Li, M.; Yue, F.; Jiang, J.; Yao, X. Constraint handling in NSGA-II for solving optimal testing resource allocation problems. IEEE Trans. Reliab. 2017, 66, 1193–1212. [Google Scholar] [CrossRef]
  128. Ouni, A.; Kula, R.G.; Kessentini, M.; Ishio, T.; German, D.M.; Inoue, K. Search-based software library recommendation using multi-objective optimization. Inf. Softw. Technol. 2017, 83, 55–75. [Google Scholar] [CrossRef]
  129. Sarro, F.; Ferrucci, F.; Harman, M.; Manna, A.; Ren, J. Adaptive multi-objective evolutionary algorithms for overtime planning in software projects. IEEE Trans. Softw. Eng. 2017, 43, 898–917. [Google Scholar] [CrossRef] [Green Version]
  130. González, J.M.C.; Toledano, M.A.P. Differential evolution with Pareto tournament for the multi-objective next release problem. Appl. Math. Comput. 2015, 252, 1–13. [Google Scholar]
  131. González, J.M.C.; Toledano, M.A.P.; Navasa, A. Teaching learning based optimization with Pareto tournament for the mul-tiobjective software requirements selection. Eng. Appl. Artif. Intell. 2015, 43, 89–101. [Google Scholar] [CrossRef]
  132. Mansoor, U.; Kessentini, M.; Langer, P.; Wimmer, M.; Bechikh, S.; Deb, K. MOMM: Multi-objective model merging. J. Syst. Softw. 2015, 103, 423–439. [Google Scholar] [CrossRef]
  133. Zhang, Y.; Harman, M.; Finkelstein, A.; Mansouri, S.A. Comparing the performance of metaheuristics for the analysis of multi-stakeholder tradeoffs in requirements optimisation. Inf. Softw. Technol. 2011, 53, 761–773. [Google Scholar] [CrossRef] [Green Version]
  134. Gonzalez, J.M.C.; Toledano, M.A.P.; Navasa, A. Software requirement optimization using a multiobjective swarm intelligence evolutionary algorithm. Knowl. Based Syst. 2015, 83, 105–115. [Google Scholar] [CrossRef]
  135. Shen, X.N.; Minku, L.L.; Marturi, N.; Guo, Y.N.; Han, Y. A Q-learning-based memetic algorithm for multi-objective dynamic software project scheduling. Inf. Sci. 2018, 428, 1–29. [Google Scholar] [CrossRef] [Green Version]
  136. Chen, T.; Li, M.; Yao, X. Standing on the shoulders of giants: Seeding search-based multi-objective optimization with prior knowledge for software service composition. Inf. Softw. Technol. 2019, 114, 155–175. [Google Scholar] [CrossRef]
  137. Kumari, A.C.; Srinivas, K. Comparing the performance of quantum-inspired evolutionary algorithms for the solution of software requirements selection problem. Inf. Softw. Technol. 2016, 76, 31–64. [Google Scholar] [CrossRef]
  138. Assunção WK, G.; Colanzi, T.E.; Vergilio, S.R.; Pozo, A. A multi-objective optimization approach for the integration and test order problem. Inf. Sci. 2014, 267, 119–139. [Google Scholar] [CrossRef]
  139. De Souza, L.S.; Prudêncio, R.B.; Barros FD, A. A Hybrid Binary Multi-Objective Particle Swarm Optimization with Local Search for Test Case Selection. In Proceedings of the 2014 Brazilian Conference on Intelligent Systems, Sao Paulo, Brazil, 18–22 October 2014; pp. 414–419. [Google Scholar]
  140. De Souza, L.S.; Prudêncio, R.B.; Barros, F.D.A. A Comparison Study of Binary Multi-Objective Particle Swarm Optimization Approaches for Test Case Selection. In Proceedings of the 2014 IEEE Congress on Evolutionary Computation (CEC), Beijing, China, 6–11 July 2014; pp. 2164–2171. [Google Scholar]
  141. Shen, X.; Minku, L.L.; Bahsoon, R.; Yao, X. Dynamic software project scheduling through a proactive-rescheduling method. IEEE Trans. Softw. Eng. 2015, 42, 658–686. [Google Scholar] [CrossRef] [Green Version]
  142. Črepinšek, M.; Ravber, M.; Mernik, M.; Kosar, T. Tuning Multi-Objective Evolutionary Algorithms on Different Sized Problem Sets. Mathematics 2019, 7, 824. [Google Scholar]
  143. Guo, J.; Liang, J.H.; Shi, K.; Yang, D.; Zhang, J.; Czarnecki, K.; Yu, H. SMTIBEA: A hybrid multi-objective optimization algorithm for configuring large constrained software product lines. Softw. Syst. Model. 2019, 18, 1447–1466. [Google Scholar] [CrossRef]
  144. De Souza, L.S.; de Miranda, P.B.; Prudencio, R.B.; Barros, F.D.A. A Multi-Objective Particle Swarm Optimization for Test Case Selection Based on Functional Requirements Coverage and Execution Effort. In Proceedings of the 2011 IEEE 23rd Interna-tional Conference on Tools with Artificial Intelligence, Boca Raton, FL, USA, 7–9 November 2011; pp. 245–252. [Google Scholar]
  145. Almarimi, N.; Ouni, A.; Bouktif, S.; Mkaouer, M.W.; Kula, R.G.; Saied, M.A. Web service API recommendation for automat-ed mashup creation using multi-objective evolutionary search. Appl. Soft Comput. 2019, 85, 105830. [Google Scholar] [CrossRef]
  146. Shi, K.; Yu, H.; Guo, J.; Fan, G.; Chen, L.; Yang, X. A Parallel Framework of Combining Satisfiability Modulo Theory with Indicator-Based Evolutionary Algorithm for Configuring Large and Real Software Product Lines. Int. J. Softw. Eng. Knowl. Eng. 2019, 29, 489–513. [Google Scholar] [CrossRef]
  147. Shi, K.; Yu, H.; Guo, J.; Fan, G.; Yang, X. A parallel portfolio approach to configuration optimization for large software product lines. Softw. Pract. Exp. 2018, 48, 1588–1606. [Google Scholar] [CrossRef]
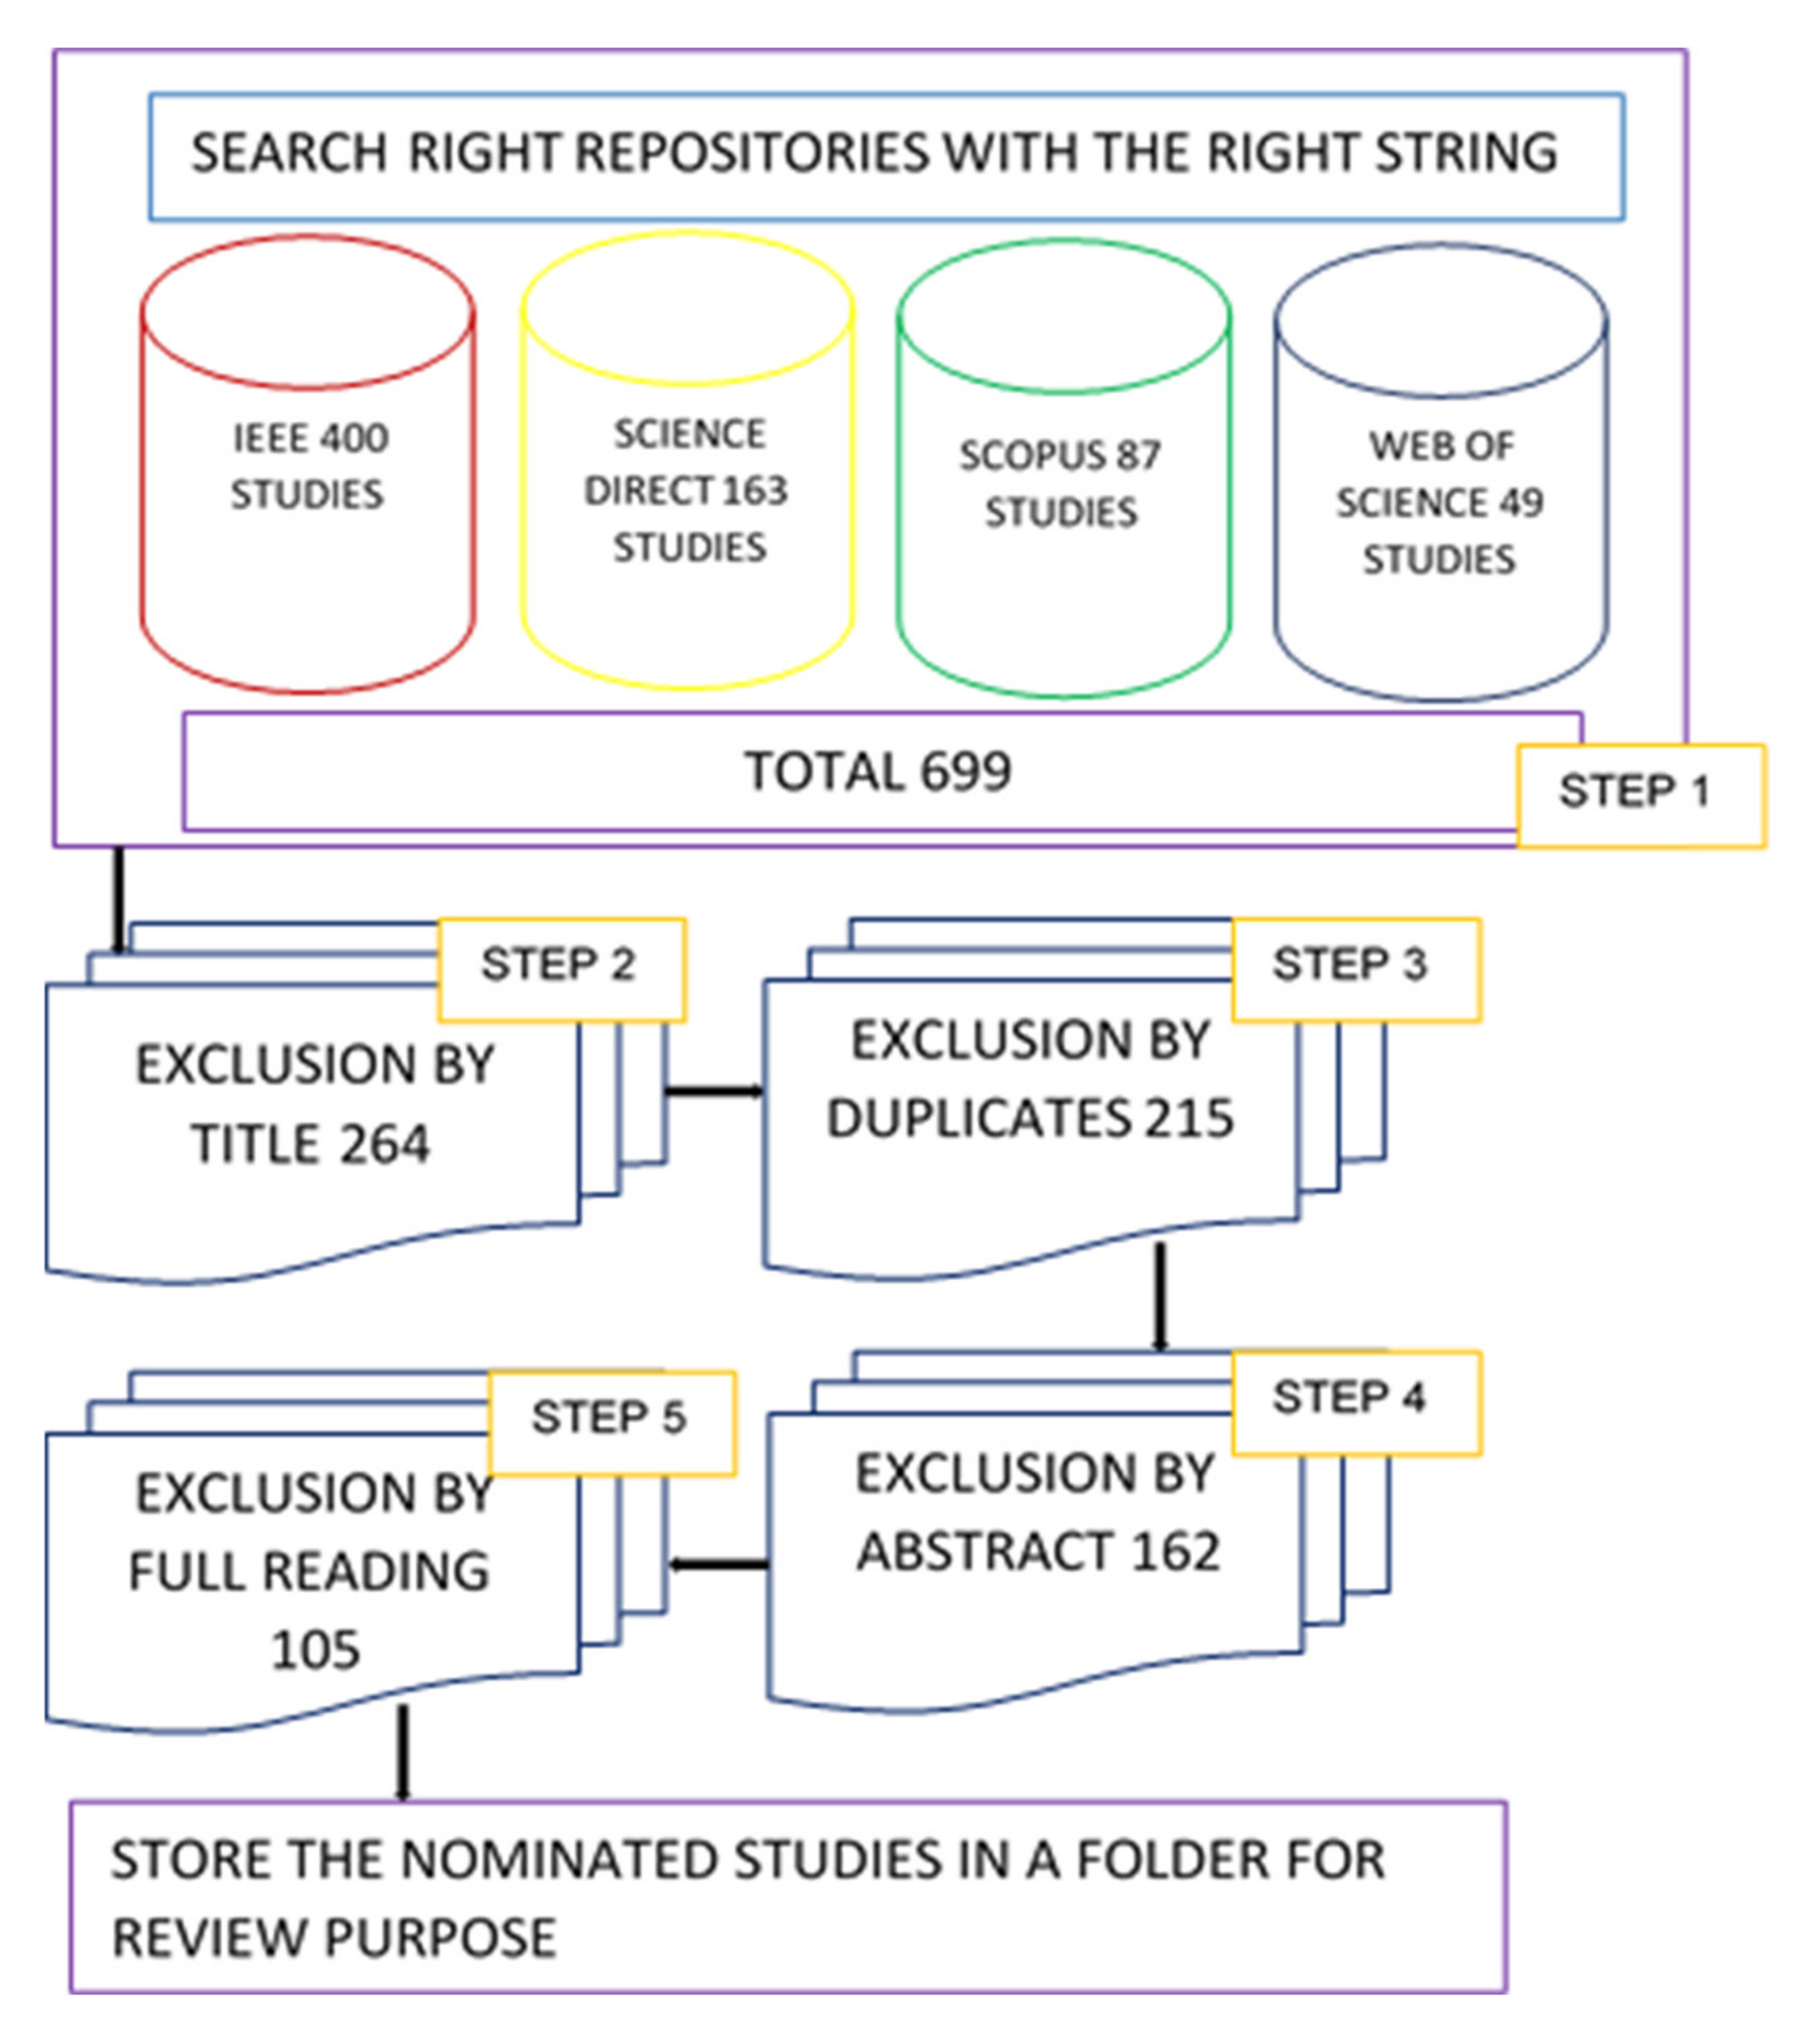
Figure 1. Search and selection steps.
Applsci 11 03117 g001
Figure 2. Number of studies by publication year.
Applsci 11 03117 g002
Figure 3. Publication distribution for the study groups.
Applsci 11 03117 g003
Figure 4. Metrics distribution in M1 group.
Applsci 11 03117 g004
Figure 5. Metrics distribution in M2 group.
Applsci 11 03117 g005
Figure 6. Metrics distribution in M3 group.
Applsci 11 03117 g006
Figure 7. Metrics distribution in M4 group.
Applsci 11 03117 g007
Figure 8. Metrics distribution in M5 group.
Applsci 11 03117 g008
Figure 9. Metrics distribution in M6 group.
Applsci 11 03117 g009
Figure 10. Top metrics distribution over the study groups.
Applsci 11 03117 g010
Figure 11. Total studies in each group, unique metrics, and their frequencies.
Applsci 11 03117 g011
Figure 12. Studies using number of objectives.
Applsci 11 03117 g012
Figure 13. Studies by applied areas in SE.
Applsci 11 03117 g013
Figure 14. SE applied areas over the study groups.
Applsci 11 03117 g014
Table 1. Related terms to execute.
GroupQuery StringKeyword
Software EngineeringGeneral termsSoftware engineering OR software development
Software engineering (SE) related termsSoftware requirement OR software design OR software modeling OR quality attributes OR software component OR reusable components OR software testing OR test cases OR test cases generation OR test case prioritization OR test specification OR test suite OR software specifications OR software verifications OR model checking OR fault tolerance OR fault localization OR refactoring OR reverse engineering OR object-oriented design OR software development methodology
Search-Based Software EngineeringMulti-objective evolutionary related termsMulti-criteria optimization OR multi-objective optimization OR multi-objective optimization OR multi-objective optimization algorithms OR multi-objective evolutionary algorithms OR many-objective optimization OR many-objective optimization OR many-objective optimization algorithms OR many-objective evolutionary algorithms OR bi-objective evolutionary algorithm OR bi-objective optimization OR MOEA
Performance MetricGeneral termsPerformance indicator OR performance metrics OR quality indicator
Table 2. List of performance metrics.
No.MetricSymbol
1HypervolumeHV
2Hypervolume ratioHVR
3Hypervolume with R-metricR-HV
4Pareto front sizePFS
5Number of non-dominated solutionsNDS
6Generalized spreadGS
7Error ratioER
8Inverted generational distanceIGD
9Generational distanceGD
10R-metricR2
11Maximum spreadMS
12Contribution metric-
13Maximum Pareto front errorMPFE
14Hypercube-based diversity metric-
15Spread: Delta measure
16Convergence metricCM
17Coverage differenceD
18Two set coverageC
19Euclidean distanceED
20Epsilon familyϵ
21SpacingS
22Inverted generational distanceIGD+
23Overall nondominated vector generationONVG
24PercentageP
25Lp-norm-based diversityLp-norm
26Number of solutions in the region of interestProi
27Convergence measureρ
Table 3. Units for list rank of used metrics.
MetricsFrequency%
HV5432.1
IGD1710.1
GD127.1
Hypercube-based diversity metric106.0
∆, ϵ, S84.8
NDS, ED63.6
PFS, GS, C53.0
HVR, ER, Contribution metric, CM31.8
MS21.2
R-HV, R2, MPFE, D, IGD+, ONVG, Norm-based, Proi, ρ, γ10.6
Table 4. List of study groups and their references.
Study GroupReferenceTotal
M0[7,47,48,49,50,51,52,53,54,55,56,57,58,59,60,61,62,63,64,65,66,67,68,69,70,71,72,73,74,75,76,77,78,79,80,81,82]37
M1[83,84,85,86,87,88,89,90,91,92,93,94,95,96,97,98,99,100,101]19
M2[3,46,102,103,104,105,106,107,108,109,110,111,112,113,114,115,116,117,118,119,120,121,122,123]24
M3[124,125,126,127,128,129,130,131,132,133,134]11
M4[135,136,137,138,139,140]6
M5[141,142,143,144]4
M6[6,145,146,147]4
Table 5. Number of objectives used in the studies and their references list.
Number of ObjectiveReference
Two Objectives[7,46,47,50,51,56,57,62,63,64,67,69,72,73,74,76,80,81,84,86,88,89,90,91,95,99,100,104,106,108,109,113,114,115,119,120,121,123,124,125,126,130,131,132,134,137,138,139,140,142,144]
Three Objectives[49,53,55,66,68,70,71,75,76,77,78,82,83,85,86,87,91,94,95,97,102,103,105,107,109,110,116,117,118,122,123,124,125,127,128,129,136,145]
Four Objectives[3,48,52,54,58,60,65,75,79,96,102,108,117,122,133,138,141,146,147]
Five Objectives[6,59,61,93,98,101,109,133,135,143,146,147]
Six Objectives[92]
Seven Objectives[96]
Nine Objectives[111,112]
Table 6. List of references of the applied areas.
MetricsReferences
Management[7,49,56,71,78,89,102,122,128,129,135,141]
Requirements[6,69,88,90,96,101,104,105,106,107,116,121,126,130,131,133,134,137,143,146,147]
Design[3,47,48,51,52,53,54,55,58,59,61,62,63,65,67,68,77,79,87,95,98,99,103,109,110,111,112,113,114,115,123,132,136,145]
Testing[46,50,57,60,64,66,70,72,73,74,75,76,80,81,82,83,84,85,86,91,92,93,94,97,100,108,117,118,120,124,125,127,138,139,140,142,144]
Verification[119]
Publisher’s Note: MDPI stays neutral with regard to jurisdictional claims in published maps and institutional affiliations.