Abstract
Movement analytics and mobility insights play a crucial role in urban planning and transportation management. The plethora of mobility data sources, such as GPS trajectories, poses new challenges and opportunities for understanding and predicting movement patterns. In this study, we predict highway speed using a gated recurrent unit (GRU) neural network. Based on statistical models, previous approaches suffer from the inherited features of traffic data, such as nonlinear problems. The proposed method predicts highway speed based on the GRU method after training on digital tachograph data (DTG). The DTG data were recorded in one month, giving approximately 300 million records. These data included the velocity and locations of vehicles on the highway. Experimental results demonstrate that the GRU-based deep learning approach outperformed the state-of-the-art alternatives, the autoregressive integrated moving average model, and the long short-term neural network (LSTM) model, in terms of prediction accuracy. Further, the computational cost of the GRU model was lower than that of the LSTM. The proposed method can be applied to traffic prediction and intelligent transportation systems.
1. Introduction
The emergence of advanced location-aware technology has led to the generation of various mobility data. The massive amount of movement data could completely reshape our understanding of urban planning, transport management, and human mobility, because movement analytics enables us to reveal valuable and hidden patterns from big spatiotemporal data [1,2,3,4,5]. In particular, accurate traffic forecasting, including traffic flow and speed, is an essential factor for smart cities and transportation management [6]. Highway traffic speed prediction plays a crucial role in route guidance, congestion avoidance, and carbon dioxide emission reduction. Therefore, this paper aims to predict the future traffic speeds of highway road sections.
However, much of the research up to now has limitations in performing accurate traffic speed prediction. Traffic data are non-stationary and nonlinear, which results in the ineffectiveness of previous approaches based on statistical models.
The paper addresses two key challenges that arise in the design of traffic speed prediction models. First, this study uses the data-driven approach of deep learning. In particular, we use a neural network for time-series problems such as gated recurrent units (GRUs) because deep learning approaches are robust to nonlinear problems. Furthermore, this study determines the optimal hyperparameters for the network. We compared the number of hidden layers and investigated a couple of factors to make a better model. The proposed methodology is compared with the state-of-the-art alternative methods.
In addition, this study utilizes the dynamic tachometer graph (DTG) data to predict the average speed on highway sections. The DTG records vehicles’ operational information, such as speed. It is compulsory to install a DTG recorder for buses, trucks, and taxis in the Republic of Korea. Remarkably, the experiment area—the Gyeongbu Expressway—has a bus-only lane. We divided the analysis of buses and other cars, which enabled a better understanding of the traffic flows in the experimental area.
The remainder of this paper is organized as follows. Section 2 begins by examining the strengths and limitations of previous research on traffic speed prediction in more detail. Section 3 presents the experimental data and methodology. The experimental evaluation and comparisons of the GRU method with other methods are presented in Section 4. Finally, the paper concludes with a summary and suggestions for future work in Section 5.
2. Background
A considerable amount of literature has been published on traffic forecasting. The traffic prediction methods can be broadly categorized into a parametric approach, a non-parametric approach, and a hybrid approach, based on parametric and non-parametric methods [7,8]. Parametric methods are based on statistical models. For example, the traffic speed can be calculated using analytical equations. These equations are based on a variety of parameters, such as demand, capacity, or weather. However, it is not easy to estimate the parameters accurately under dynamic traffic conditions. Among parametric approaches, the auto-regressive integrated moving average model (ARIMA) has been widely utilized for traffic forecasting [9]. The ARIMA model assumes that the time series data are stationary when mean and variance are constant. Although the ARIMA model presents an acceptable performance in predicting short-term traffic speed, it is unlikely to accurately conduct traffic forecasting due to the nonlinearity and randomness of traffic data [8,10].
Moreover, the Kalman filter model also has been applied to traffic forecasting [11,12]. The Kalman filter model is a recursive estimation algorithm that continuously updates the travel-time state variable using new observations. The state transition model performs prediction and estimation, and error covariance is minimized. It has the advantage of using only the information from the previous time period and has excellent accuracy in real-time prediction. However, the prediction accuracy is dependent on the state transition model, and a time-lag problem may occur if the travel time changes rapidly at each time interval [13].
The stochastic and nonlinear features negatively impact the parametric approach in traffic data. Therefore, recent studies have concentrated on non-parametric approaches. Mainly, machine learning algorithms have been applied to predict traffic speed and flow. For example, the support vector machine (SVM) model has been applied to highway travel time prediction. The SVM is a supervised learning-based linear classification model that can find the spatial boundaries of the given data [14]. Even though the SVM is suitable for binary classification, it has a disadvantage of sensitivity to parameter and kernel selection [15,16].
Further, the k-nearest neighbors (k-NN) model predicts highway travel time using similar patterns based on large-capacity historical data. For similarity measurement, a Euclidean distance function is generally used, and matching with past historical data is conducted according to the similarity of distance. In this model, each step’s parameter setting (historical data smoothing, similarity function, k-number, or prediction function) plays a vital role in the prediction accuracy. The k-NN model has shown higher accuracy than the ARIMA and Kalman filter models by matching similar history data through trend reflection [17].
However, it is still a challenge to perform accurate traffic forecasting due to the shallow structure of the model mentioned above. Data-driven approaches, such as deep learning, have launched a new era of traffic prediction. Deep learning is a sub-field of machine learning, which uses an artificial neural network (ANN) to learn representations from data. The ANN’s deep learning model automatically obtains the weight parameters’ optimal values from the training data. The goal of learning is to find the weight parameters that minimize the loss function, representing better complex non-linear relationships from data accurately [18,19].
With the development of deep learning, the convolutional neural network (CNN) has been utilized to predict traffic flow [20]. The traffic flow information over the traffic network is converted to a series of images. These images are fed into a CNN. Although this approach has merit in terms of spatial dependency, it cannot represent various traffic information, including speed, density, or weather within the images. Thus, recurrent neural networks (RNNs) are proposed to handle the temporal evolution of traffic status [21]. An RNN comprises hidden layers having closed-loops, thereby capturing nonlinear time-series problems. However, the chain-like structure of the RNN is unable to train time series data with long time lags due to a gradient vanishing problem during the back-propagating process.
The gradient vanishing problem, an inherent problem of the RNN, is addressed by a long short-term neural network (LSTM). The LSTM is designed to model long-term dependencies and determine the optimal time lag for time series problems by giving the memory unit the ability to decide to remember or forget certain information. Thus, the LSTM has been exploited in traffic forecasting [7,8,22,23]. Even though the LSTM has a substantial ability to memorize long-term dependencies for traffic forecasting, it has a complex structure, and its training takes a long time. Therefore, the gated recurrent unit (GRU) is applied to resolve traffic problems. The GRU has fewer parameters than the LSTM, which accelerates training and equivalent capability [22,24,25,26].
In addition, in recent research, hybrid integrated deep learning models for traffic forecasting have been proposed. For example, the graph neural network or the spatio-temporal residual network have been integrated into the LSTM in order to improve its prediction accuracy, and computational cost [27,28,29,30].
This study aims to predict traffic speed on highway sections using the GRU method. The prediction performance is compared with alternative methods, i.e., the ARIMA and LSTM models. Furthermore, this study investigates the computational cost of the GRU method compared with the LSTM.
3. Materials and Methods
3.1. Materials
This study used dynamic tachometer graph (DTG) data to predict the average speed on highway sections. The DTG is a device that stores vehicle operation records, including GPS location, speed, RPM, acceleration, sudden braking, and travel distance. All commercial buses, taxis, and trucks in the Republic of Korea must be equipped with a DTG. However, DTG data do not include data from private cars. The experimental data were recorded from 1–30 September 2016, and consisted of approximately 300 million records (about 800 GB). The number of buses was 1,139,865, taxis 110,116, and trucks 165,638. The system architecture of this study is represented in Figure 1.
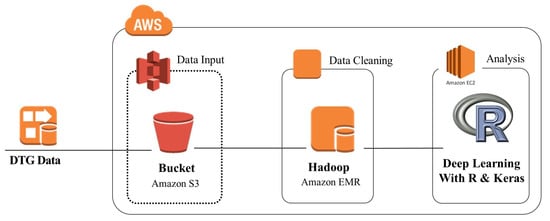
Figure 1.
System architecture.
All data were uploaded to the S3 bucket in Amazon Web Service (AWS). We utilized Amazon Elastic MapReduce (EMR), similar to the Hadoop system, in AWS to conduct data preprocessing. We used the r4.4xlarge instance (i.e., 16 CPU and 128 GiB Memory), which is a memory-optimized instance to deliver fast performance for workloads that process large data sets in memory. In particular, we developed a Pig script to conduct data preprocessing (e.g., road link matching or aggregation of the data). Afterwards, deep learning was implemented using R with Keras.
Figure 2 presents the experimental area, which consists of some upward and downward sloping parts of the Gyeongbu Expressway. The downward-sloping highway sections included the following: Seoul toll gate to Singal junction, Singal junction to Suwon Singal interchange, and Suwon Singal interchange to Giheung interchange. The upward-sloping sections included the following: Giheung interchange to Suwon Singal interchange, Suwon Singal interchange to Singal junction, and Singal junction to Seoul toll gate.
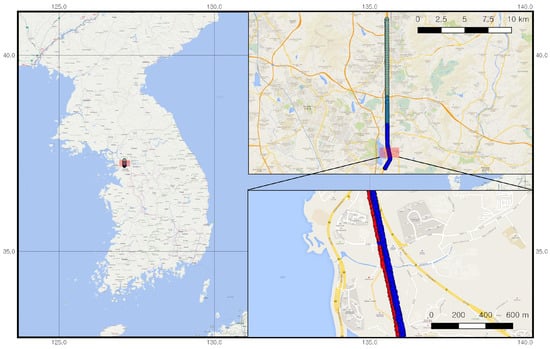
Figure 2.
Experimental area.
The average speed during the one month period between the Singal junction and Seoul toll gate is shown in Figure 3. The vehicle operation information was recorded every 10 s. We averaged the vehicle speed of each road section every 15 min. Thus, each day was divided into 96 time intervals. Furthermore, the Gyeongbu Expressway has bus lanes. We divided the DTG data into two datasets: bus lane data and regular lane data. Remarkably, there were rare historical data for buses between 0 a.m. and 5 a.m. Thus the experimental data for bus lanes had 76 time intervals after removing non-operational time. In addition, we removed outliers (e.g., wrong coordinate position or extraordinary speed) using the standard boxplot approach based on the interquartile range. To evaluate the deep learning algorithms, we used ten days of the data as training data, ten days as validation data, and ten days as test data.
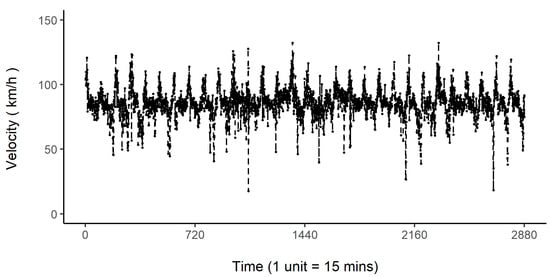
Figure 3.
Traffic speed for one month between Singal junction and Seoul toll gate.
3.2. Methods
RNN refers to a neural network with one or more recurrent layers in a hidden layer. The RNN differs from other networks in its reception of input data. It is mainly used for sequence data, closely related to time-series data, including weather, stock prices, and language.
The RNN has a feedback structure that receives and uses the output of a layer again as its input. Thereby, the previous data affect the results. Figure 4 presents the unfolded structure of an RNN. The RNN is well-designed to process time-series data; it uses weights and biases repeatedly by passing information via cyclic vectors.
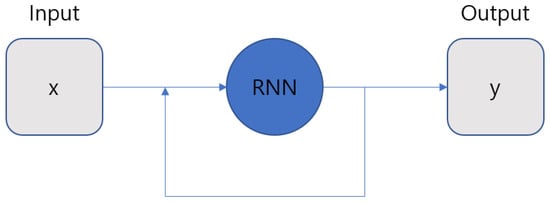
Figure 4.
Unfolded structure of recurrent neural network.
Figure 5 shows an RNN architecture. The RNN receives the input vector X and generates the output vector y. RNNs are characterized by no limit on the length of input and output and have fully connected structures. Networks of various shapes and styles can be formed by modifying their architecture. However, existing RNNs have a long-term dependency problem [31]. The weights converge to 0 or diverge to infinity as the time lag increases.
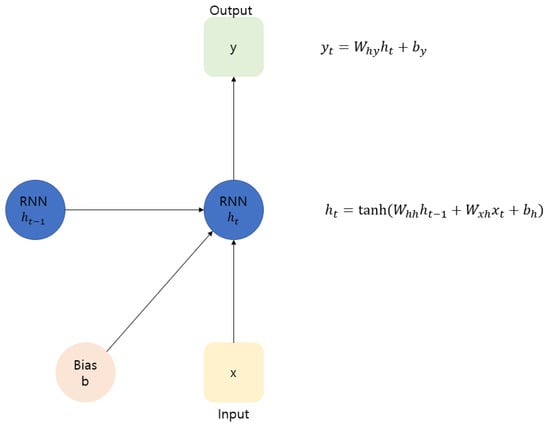
Figure 5.
Recurrent neural network architecture.
Thus, the LSTM was proposed to solve the long-term dependence problem of the existing RNN. It is a modified architecture of the RNN and is characterized by the existence of a cell state (Figure 6). The LSTM is composed of three gates, namely the input, forget, and output gates. Each gate controls its value through the sigmoid layer and pointwise multiplication.
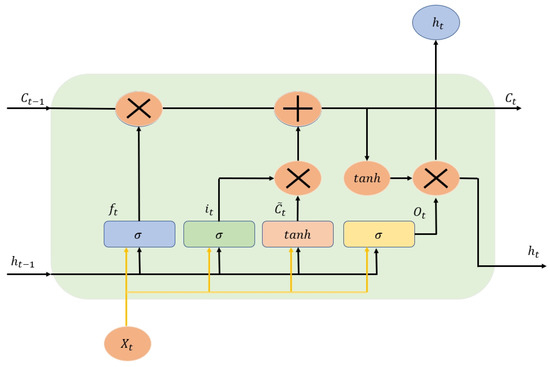
Figure 6.
Long short-term neural network architecture.
The input gate () utilizes a sigmoid function (). The sigmoid function determines which of the new information is to be stored in the cell input state. Next, the tanh function creates new data candidate values as the cell candidate state, .
The forget gate determines what is forgotten using the weights of how much to forget and updates the state by multiplying the previous state, , by the output value of the forget gate. In addition, the output values of the input gate are multiplied and added to the cell state .
The output gate () determines the output value and uses a sigmoid function. The final output value is calculated by multiplying the value obtained by applying tanh to the cell state () and the sigmoid output value ().
Although the LSTM has an excellent ability to memorize long-term dependencies, it takes a long time to train the model owing to its complex structure. Thus, the GRU was proposed to accelerate the training process [32].
The GRU is a type of RNN framework with a gate mechanism applied, inspired by LSTM, and with a simpler structure [33]. The GRU architecture is described in Figure 7.
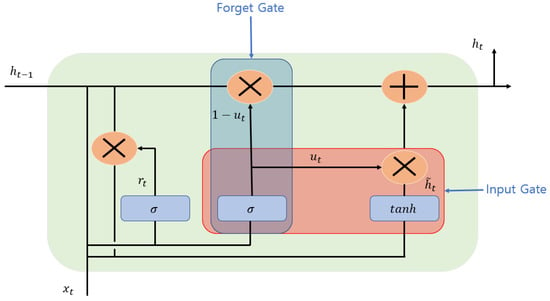
Figure 7.
Gated recurrent unit architecture.
The reset gate () uses the sigmoid function as an output to properly reset the past information and multiplies the (0.1) value by the previously hidden layer. The output value can be obtained by multiplying the hidden layer’s value at the previous point and the information at the present point by weight.
The update gate is a combination of the forget and input gates of the LSTM model. The update gate determines the rate of update of past and present information. In the update gate, the result output as sigmoid determines the amount of information at present, and the value subtracted from is multiplied by the information of the hidden layer at the most recent time. Each update gate is similar to the input and forget gates of the LSTM.
This study employs the GRU to predict traffic speed on highway sections. Figure 8 presents a flow chart of the study design. We first conducted data preprocessing and hyperparameter tuning. It is essential to conduct hyperparameter tuning for better prediction. We considered batch size, two factors (i.e., speed and volume), and the number of hidden layers. The details are discussed in Section 4.1. Then we compared the proposed model with state-of-the-art alternative methods, such as LSTM and ARIMA, based on the training model.

Figure 8.
Flow chart of the study.
4. Results
The GRU method described in the previous section was evaluated with respect to two key features: prediction performance and model scalability. In terms of prediction performance, this study compared the proposed algorithm results with those obtained using alternative methods, LSTM and ARIMA.
4.1. Hyperparameter Tuning
This study used the GRU to predict highway section speed. Time-series data were normalized, and only one GRU layer was used for the model. The GRU layer learned in the form of a 3D array, with batch size, time steps, and features.
Hyperparameter tuning was performed to obtain results with the highest accuracy. When the batch size is small, the learning time is short, and when the batch size is large, the generalization ability is reduced, and the learning time is extended. Therefore, it was necessary to ascertain the optimal batch size, which we determined with a manual search.
As shown in Table 1, the batch size of 96, equivalent to the value of one day, was the best in terms of speed and accuracy. This study utilized the mean absolute error (MAE), mean absolute percentage error (MAPE) and mean squared error (MSE) to measure the effectiveness of the different batch sizes.

Table 1.
Batch size comparisons.
Extra features, such as rainfall, car accidents, and traffic volume, were included to predict highway speed. However, it had rained twice in September. The precipitation was less than 20 mL. Similarly, there were two traffic accidents in September. These two factors could not be included due to the small number of cases. Thus we added traffic volume as a factor in addition to speed. The Korea Expressway Corporation shares the traffic volume in the experiment areas. Notably, we can get different traffic volumes for bus lanes and regular lanes. Thus we trained the DTG data and predicted speed for bus lanes and regular lanes differently.
While building the model, we considered the number of nodes (factors) and layers. In general, there is no absolute rule of thumb on how to choose the number of nodes and layers. Tests based on various configurations and the evaluation of outcomes can lead to the best results. We examined two factors (i.e., speed and volume) and three different layers (i.e., one fully connected layer, two fully connected layers, and two fully connected layers with dropout). In terms of layers, the ANOVA test revealed no significant effect of model design on MAE levels, , . Comparing time efficiency, one fully connected layer is twice as fast as other architectures. Therefore, we used one fully connected layer for the GRU architecture.
With regard to factors, we considered two cases (i.e., speed and speed with traffic volume). The ANOVA test revealed a significant effect of two models on levels of MAE, , . Considering one factor, such as speed, outperformed considering two factors. Thus our final model is one fully connected layer with one factor (i.e., speed).
This study used the RMSProp optimizer during the training process. By training the model with several epochs, we found that the optimal number of epochs was 5, each epoch with 500 steps. The models were trained with these hyperparameters to compare their accuracies.
4.2. Prediction Performance
This study compared the GRU with two alternative methods, ARIMA and LSTM, regarding their prediction performance. We analyzed the prediction performance for bus lanes and regular lanes separately. Figure 9 shows the prediction comparisons for bus lanes using MAE for one test day on the section from Seoul toll gate to Sihingal junction. The MAE of GRU was 3.42, the MAE of LSTM was 4.06, and the MAE of ARIMA was 4.24. In a similar fashion, Figure 10 presents the prediction comparisons for regular lanes. The MAE of GRU was 7.36, the MAE of LSTM was 8.37, and the MAE of ARIMA was 10.61.
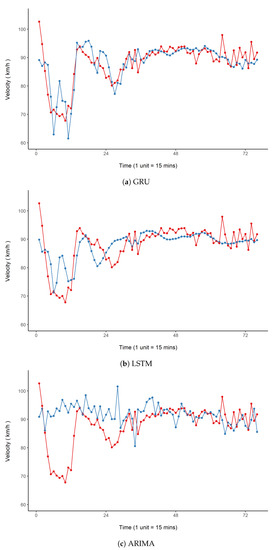
Figure 9.
Performance comparisons in bus lanes: red color for ground truth and blue color for prediction.
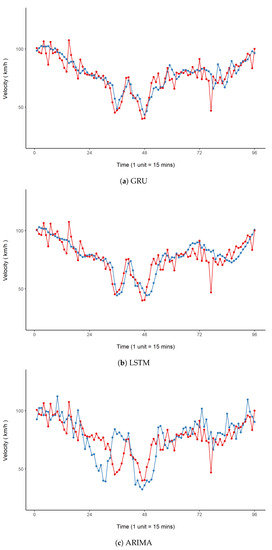
Figure 10.
Performance comparisons in regular lanes: red color for ground truth and blue color for prediction.
In Figure 9, the X-axis has 76 time intervals after removing non-operational time. Each interval (unit) is 15 min. The X-axis of Figure 10 has 96 time intervals because vehicles operated on general lanes during the whole day.
The results with ten sets of test data in bus lanes are displayed in Table 2, and it can be seen that there are no outperformed methods. This visual impression was confirmed using an ANOVA test. The analysis revealed that prediction performance was not significantly affected by the type of method ().

Table 2.
Prediction performance comparisons in bus lanes.
Similarly, Table 3 presents the results with ten sets of test data in regular lanes. It can be seen that the GRU outperformed other methods. This visual impression was confirmed using an ANOVA test. The analysis revealed that prediction performance was significantly affected by the type of method (). A post hoc test (i.e., false discovery rate) indicated that there was a statistically significant difference between ARIMA and other methods (). However, there was no statistically significant difference between LSTM and GRU in prediction accuracy ().

Table 3.
Prediction performance comparisons in regular lanes.
In brief, there is no difference among methods for bus lanes. However, there are statistically significant differences among methods for regular lanes. The rationale behind this is that the DTG data include most vehicle information in the bus lane. However, the DTG data were not representative of general lanes because the DTG data did not include private vehicle information. Thus, it is non-trivial to predict general lane speed based on linear mathematics models such as ARIMA.
4.3. Scalability
Overall, scalability was tested by measuring the time used by the GRU and LSTM algorithms over the five epochs (one epoch with 500 steps). Figure 11 shows a regression analysis of the results of the experimental runs of the two methods. Our experimental data included six highway sections; thus, each epoch had six time measurements for each method.
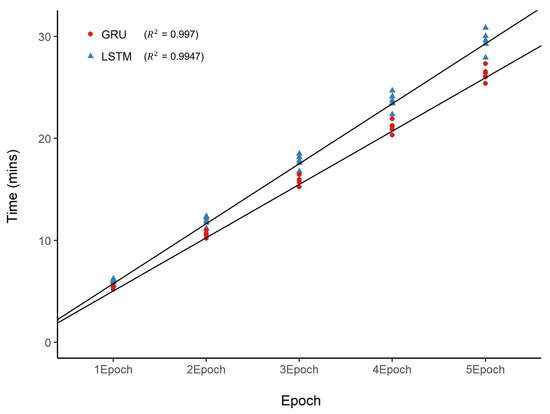
Figure 11.
Scalability comparisons between gated recurrent unit (GRU) and long short-term neural network (LSTM) models.
Comparing the two methods in Figure 11 shows that the GRU has marginally better efficiency than the LSTM. A t-test revealed that the differences between the two algorithms were statistically significant at the 5% level in all cases (6 out of 6 sets of experimental runs showed a significant reduction in computational cost for the GRU method). Further, the two methods showed a strong linear relationship between epochs and time (). In terms of ARIMA, we cannot compare it with GRU and LSTM because there is no training process for ARIMA.
5. Discussion and Conclusions
This study investigated highway traffic speed prediction using GRU, a recurrent neural network. In terms of prediction accuracy, this study compared the proposed method with alternative methods, ARIMA and LSTM. The experimental results show that the GRU outperformed other methods, which was statistically confirmed by an ANOVA test. However, the current model used only one factor (i.e., vehicle velocity). Although this study included another factor, i.e., traffic volume, the one factor (i.e., speed) model performed better. The rationale behind this is that not all cars are equipped with the DTG device. The traffic volume from the Korea Expressway Corporation includes all cars in the Gyeongbu Expressway. This discrepancy causes the one-factor model to have better prediction performance.
It is also noteworthy that there is no statistically significant difference for the prediction performance in bus lanes among GRU, LSTM, and ARIMA. However, there are statistically significant differences in regular lanes. While the DTG data include most bus operation information, they do not include all private car information. This difference makes the speed prediction of regular lanes difficult. Moreover, this study did not attempt to investigate two-lane intersection operations due to the difficulty of getting the exact data. Besides, the currently trained model may fail to predict speed when events (e.g., car accidents) occur. The current model was not fully trained in various environments. This study would be more useful if these limitations were investigated.
Furthermore, this study examined the computational cost of the GRU and LSTM models. The comparison between the GRU and LSTM showed statistically significant differences in the time reduction of GRU as compared to LSTM. The GRU is more scalable than the LSTM because it is designed with fewer parameters than the LSTM.
Although road traffic managers can directly use the proposed model to predict traffic speed in the experimental area, it is reasonable to train new datasets in other areas or leverage transfer learning. Transfer learning can improve the efficiency of solving new tasks without relearning everything from scratch.
In addition, it is worth noting that the GRU method is limited to time dependency problems. Further investigation should focus on the design of a robust algorithm for capturing spatiotemporal traffic speed or flow. Such research will lead to increased knowledge and a better understanding of traffic movement patterns.
Author Contributions
Conceptualization, M.-H.J.; methodology, M.-H.J. and T.-Y.L.; software, M.-H.J. and T.-Y.L.; validation, M.-H.J. and S.-B.J.; formal analysis, M.-H.J., S.-B.J. and T.-Y.L.; investigation, M.-H.J., S.-B.J. and T.-Y.L.; resources, M.-H.J., S.-B.J. and T.-Y.L.; data curation, S.-B.J. and T.-Y.L.; writing—original draft preparation, M.-H.J.; writing—review and editing, M.-H.J. and M.Y.; visualization, M.-H.J. and T.-Y.L.; supervision, M.Y.; project administration and funding acquisition, M.-H.J. All authors have read and agreed to the published version of the manuscript.
Funding
This research was supported by a grant (2020-MOIS31-014) from the Fundamental Technology Development Program for Extreme Disaster Response funded by the Ministry of the Interior and Safety (MOIS, Korea).
Conflicts of Interest
The authors declare no conflict of interest. The funders had no role in the design of the study; in the collection, analyses, or interpretation of data; in the writing of the manuscript, or in the decision to publish the results.
References
- Mazimpaka, J.D.; Timpf, S. Exploring the potential of combining taxi GPS and flickr data for discovering functional regions. In AGILE 2015; Springer: Berlin, Germany, 2015; pp. 3–18. [Google Scholar]
- Suh, W.; Park, J.W.; Kim, J.R. Traffic safety evaluation based on vision and signal timing data. Proc. Eng. Technol. Innov. 2017, 7, 37–40. [Google Scholar]
- Jeong, M.H.; Yin, J.; Wang, S. Outlier Detection and Comparison of Origin-Destination Flows Using Data Depth. In Leibniz International Proceedings in Informatics (LIPIcs), Proceedings of the 10th International Conference on Geographic Information Science (GIScience 2018), Melbourne, Australia, 28–31 August 2018; Winter, S., Griffin, A., Sester, M., Eds.; Schloss Dagstuhl–Leibniz-Zentrum fuer Informatik: Dagstuhl, Germany, 2018; Volume 114, pp. 6:1–6:14. [Google Scholar]
- Li, L.; Ma, Y.; Wang, B.; Dong, H.; Zhang, Z. Research on traffic signal timing method based on ant colony algorithm and fuzzy control theory. Proc. Eng. Technol. Innov. 2019, 11, 21. [Google Scholar]
- Chang, L.H.; Lee, T.; Chu, H.; Su, C. Application-Based Online Traffic Classification with Deep Learning Models on SDN Networks. Adv. Technol. Innov. 2020, 5, 216–229. [Google Scholar]
- Liao, B.; Zhang, J.; Cai, M.; Tang, S.; Gao, Y.; Wu, C.; Yang, S.; Zhu, W.; Guo, Y.; Wu, F. Dest-ResNet: A deep spatiotemporal residual network for hotspot traffic speed prediction. In Proceedings of the 26th ACM International Conference on Multimedia; ACM: New York, NY, USA, 2018; pp. 1883–1891. [Google Scholar]
- Ma, X.; Tao, Z.; Wang, Y.; Yu, H.; Wang, Y. Long short-term memory neural network for traffic speed prediction using remote microwave sensor data. Transp. Res. Part C Emerg. Technol. 2015, 54, 187–197. [Google Scholar] [CrossRef]
- Mou, L.; Zhao, P.; Xie, H.; Chen, Y. T-LSTM: A long short-term memory neural network enhanced by temporal information for traffic flow prediction. IEEE Access 2019, 7, 98053–98060. [Google Scholar] [CrossRef]
- Ahmed, M.S.; Cook, A.R. Analysis of Freeway Traffic Time-Series Data by Using Box-Jenkins Techniques; Number 722; Transportation Research Board: Washington, DC, USA, 1979. [Google Scholar]
- Tian, Y.; Pan, L. Predicting short-term traffic flow by long short-term memory recurrent neural network. In Proceedings of the 2015 IEEE International Conference on Smart City/SocialCom/SustainCom (SmartCity), Chengdu, China, 19–21 December 2015; pp. 153–158. [Google Scholar]
- Chien, S.I.; Liu, X.; Ozbay, K. Predicting travel times for the South Jersey real-time motorist information system. Transp. Res. Rec. 2003, 1855, 32–40. [Google Scholar] [CrossRef]
- Van Lint, J. Online learning solutions for freeway travel time prediction. IEEE Transp. Intel. Trans. Syst. 2008, 9, 38–47. [Google Scholar] [CrossRef]
- Chen, M.; Liu, X.; Xia, J.; Chien, S.I. A dynamic bus-arrival time prediction model based on APC data. Comput. Aided Civ. Infrastruct. Eng. 2004, 19, 364–376. [Google Scholar] [CrossRef]
- Smola, A.J.; Schölkopf, B. A tutorial on support vector regression. Stat. Comput. 2004, 14, 199–222. [Google Scholar] [CrossRef]
- Vanajakshi, L.; Rilett, L.R. Support vector machine technique for the short term prediction of travel time. In Proceedings of the 2007 IEEE Intelligent Vehicles Symposium, Istanbul, Turkey, 13–15 June 2007; pp. 600–605. [Google Scholar]
- Long, K.; Yao, W.; Gu, J.; Wu, W. Predicting Freeway Travelling Time Using Multiple-Source Data. Appl. Sci. 2018, 9, 104. [Google Scholar] [CrossRef]
- Qiao, W.; Haghani, A.; Hamedi, M. A nonparametric model for short-term travel time prediction using bluetooth data. J. Intel. Transp. Syst. 2013, 17, 165–175. [Google Scholar] [CrossRef]
- Chollet, F.; Allaire, J.J. Deep Learning with R; Manning Publications: New York, NY, USA, 2018. [Google Scholar]
- Liu, Y.H.; Maldonado, P. R Deep Learning Projects: Master the Techniques to Design and Develop Neural Network Models in R; Packt Publishing Ltd.: Birmingham, UK, 2018. [Google Scholar]
- Ma, X.; Dai, Z.; He, Z.; Ma, J.; Wang, Y.; Wang, Y. Learning traffic as images: A deep convolutional neural network for large-scale transportation network speed prediction. Sensors 2017, 17, 818. [Google Scholar] [CrossRef] [PubMed]
- Van Lint, J.; Hoogendoorn, S.; van Zuylen, H.J. Freeway travel time prediction with state-space neural networks: Modeling state-space dynamics with recurrent neural networks. Transp. Res. Rec. 2002, 1811, 30–39. [Google Scholar] [CrossRef]
- Dai, G.; Ma, C.; Xu, X. Short-term traffic flow prediction method for urban road sections based on space–time analysis and GRU. IEEE Access 2019, 7, 143025–143035. [Google Scholar] [CrossRef]
- Jeon, S.B.; Jeong, M.H.; Lee, T.Y.; Lee, J.H.; Cho, J.M. Bus Travel Speed Prediction Using Long Short-term Memory Neural Network. Sens. Mater. 2020, 32, 4441–4447. [Google Scholar]
- Zhang, D.; Kabuka, M.R. Combining weather condition data to predict traffic flow: A GRU-based deep learning approach. IET Intel. Transp. Syst. 2018, 12, 578–585. [Google Scholar] [CrossRef]
- Do, L.N.; Vu, H.L.; Vo, B.Q.; Liu, Z.; Phung, D. An effective spatial-temporal attention based neural network for traffic flow prediction. Transp. Res. Part C Emerg. Technol. 2019, 108, 12–28. [Google Scholar] [CrossRef]
- Zhao, J.; Gao, Y.; Yang, Z.; Li, J.; Feng, Y.; Qin, Z.; Bai, Z. Truck traffic speed prediction under non-recurrent congestion: Based on optimized deep learning algorithms and GPS data. IEEE Access 2019, 7, 9116–9127. [Google Scholar] [CrossRef]
- Lu, Z.; Lv, W.; Cao, Y.; Xie, Z.; Peng, H.; Du, B. LSTM Variants Meet Graph Neural Networks for Road Speed Prediction. Neurocomputing 2020, 400, 34–45. [Google Scholar] [CrossRef]
- Ren, Y.; Chen, H.; Han, Y.; Cheng, T.; Zhang, Y.; Chen, G. A hybrid integrated deep learning model for the prediction of citywide spatio-temporal flow volumes. Int. J. Geogr. Inf. Sci. 2020, 34, 802–823. [Google Scholar] [CrossRef]
- Zhang, Y.; Cheng, T.; Ren, Y.; Xie, K. A novel residual graph convolution deep learning model for short-term network-based traffic forecasting. Int. J. Geogr. Inf. Sci. 2020, 34, 969–995. [Google Scholar] [CrossRef]
- Zhang, Y.; Cheng, T.; Ren, Y. A graph deep learning method for short-term traffic forecasting on large road networks. Comput. Aided Civ. Infrastruct. Eng. 2019, 34, 877–896. [Google Scholar] [CrossRef]
- Hochreiter, S.; Schmidhuber, J. LSTM can solve hard long time lag problems. Adv. Neural Inf. Proces. Syst. 1996, 9, 473–479. [Google Scholar]
- Fu, R.; Zhang, Z.; Li, L. Using LSTM and GRU neural network methods for traffic flow prediction. In Proceedings of the IEEE 31st Youth Academic Annual Conference of Chinese Association of Automation, Wuhan, China, 11–13 November 2016; pp. 324–328. [Google Scholar]
- Cho, K.; Van Merriënboer, B.; Gulcehre, C.; Bahdanau, D.; Bougares, F.; Schwenk, H.; Bengio, Y. Learning phrase representations using RNN encoder-decoder for statistical machine translation. arXiv 2014, arXiv:1406.1078. [Google Scholar]
Publisher’s Note: MDPI stays neutral with regard to jurisdictional claims in published maps and institutional affiliations. |
© 2021 by the authors. Licensee MDPI, Basel, Switzerland. This article is an open access article distributed under the terms and conditions of the Creative Commons Attribution (CC BY) license (http://creativecommons.org/licenses/by/4.0/).