Article

A New Real-Time Detection and Tracking Method in Videos for Small Target Traffic Signs

School of Electrical Engineering, Guangxi University, Nanning 530004, China
*
Author to whom correspondence should be addressed.
Appl. Sci. 2021, 11(7), 3061; https://doi.org/10.3390/app11073061
Submission received: 28 February 2021 / Revised: 19 March 2021 / Accepted: 26 March 2021 / Published: 30 March 2021
(This article belongs to the Special Issue Artificial Intelligence for Computer Vision)

Abstract

:

Featured Application

The proposed video object detection and recognition method has a wide range of applications in self-driving vehicle scenarios, as well as intelligent transportation systems and video surveillance.

Abstract

It is a challenging task for self-driving vehicles in Real-World traffic scenarios to find a trade-off between the real-time performance and the high accuracy of the detection, recognition, and tracking in videos. This issue is addressed in this paper with an improved YOLOv3 (You Only Look Once) and a multi-object tracking algorithm (Deep-Sort). First, data augmentation is employed for small sample traffic signs to address the problem of an extremely unbalanced distribution of different samples in the dataset. Second, a new architecture of YOLOv3 is proposed to make it more suitable for detecting small targets. The detailed method is (1) removing the output feature map corresponding to the 32-times subsampling of the input image in the original YOLOv3 structure to reduce its computational costs and improve its real-time performances; (2) adding an output feature map of 4-times subsampling to improve its detection capability for the small traffic signs; (3) Deep-Sort is integrated into the detection method to improve the precision and robustness of multi-object detection, and the tracking ability in videos. Finally, our method demonstrated better detection capabilities, with respect to state-of-the-art approaches, which precision, recall and mAP is 91%, 90%, and 84.76% respectively.

1. Introduction

Traffic sign detection and tracking is a critical task of self-driving vehicles in Real-World traffic scenarios, which provides real-time decision support for the autopilot system.
Traffic sign detection can be broadly divided into two categories [1,2,3,4,5,6]. One is the traditional method based on manual features [1,2,3,4,5], and the other is the deep learning algorithm based on CNN (Convolutional Neural Network) [6]. Traditional traffic signs are mainly detected based on the appearance characteristics of some traffic signs. In [2,3], RGB (Red, Green, Blue) and HSI (Hue, Saturation, Intensity) color model methods are used for detection owing to different color information (red, yellow, blue) for multifarious traffic signs. In [4], HOG (Histogram of Gradient) is employed to describe shape features used for detection. However, due to the small target of traffic signs, they are easily affected by external adverse factors such as lighting, weather, and shielding [5]. It is necessary to use nontraditional algorithms to extract features such as color, texture, context, etc. in order to have higher commonality. In contrast, deep learning-based object detection algorithms are more accurate and capable of evolving to more complex environments [6].
CNN-based object detection methods can be further divided into two types [7,8,9,10,11,12,13,14]: two-stage schemes and one-stage schemes, where the two-stage schemes combine RPN (Region Proposal Network) with the CNN network at first, then classify and regress these candidate regions [7] such as R-CNN [8] (Region-Convolutional Neural Network), Fast R-CNN [9], Mask R-CNN [10], etc. Even though it is possible to achieve a high detection accuracy with the two-step schemes, it is demanding because of its complicated computation. Two-stage schemes are slower at detection, but end-to-to-end ones provide more accurate results. SSD (Single Shot Detector) [11], YOLO [12], YOLO 9000 [13], YOLOv3 [14], etc. are typical representatives of one-stage schemes.
Because of the progress of deep learning, there have been new deep learning-based object detection algorithms that have progressively released. Yang et al. [15] proposed a new traffic sign detection method. They used a two-stage strategy to extract region proposals and introduced AN (Attention Network), combining Faster R-CNN with traditional computer vision algorithms to find regions of interest by using color characteristics. Finally, the experimental results showed that its mAP was 80.31%. Lu et al. [16] improved the detection effect of Faster R-CNN by introducing a visual attention model which can integrate a series of regions for locating and classifying small objects. Their mAP is 87.0%, and the efficiency is 3.85 FPS.
The detection algorithms mentioned above have achieved excellent detection results on the dataset PASCAL VOC (Pattern Analysis Statistical Modelling and Computational Learning Visual Object Classes) [17] and COCO (Common Objects in Context) [18]. In [19], good performance on the most commonly used traffic sign dataset GTSDB (German Traffic Sign Detection Benchmark) [20] has been achieved. The improved YOLOv2 achieved 99.61% and 96.69% precision in CCTSDB (CSUST Chinese Traffic Sign Detection Benchmark) and GTSDB [21]. At the same time, however, only classifying all traffic signs as detectable or non-detectable (i.e., prohibitory signs, command, and notification signs) is a fair categorization due to the great disparities between detection types and their corresponding traffic signs. It is far from meeting the actual scenario requirements in the self-driving task. The TT100K (Tsinghua-Tencent 100 K) [22] benchmark dataset subdivides the three types of traffic signs into 128 categories, covering varieties of factors under different light conditions and climatic conditions, which is closer to the Real-World traffic scenarios, and it also contains more backgrounds and smaller targets.
Although [23,24] have achieved better detection accuracy on TT100K, their real-time performances are poor. In [25], the real-time problem is well addressed with a less-parameter and low-computational cost model MF-SSD, but its performance on small object detection is poor. Li et al. [26] proposed a Perceptual GAN (Generative Adversarial Network) model to improve the detection of small traffic signs in the TT100K by minimizing the differences between large and small objects. Zhang et al. [19] proposed a multiscale cascaded R-CNN and multiscale features in pyramids that fuse high-level semantic information and low-level spatial information. Moreover, the features extracted from the ROI (Region of Interest) for each scale are fined and then fused to improve the detection accuracy of traffic signs. Precision and recall achieved 98.7% and 90.5% respectively. Nevertheless, they only roughly divided the small traffic signs into three types. Obviously, it is not enough in practice.
Actually, road object detection has reached a bottleneck for further improvement because of the small scale of targets [27,28]. Infrared (IR) small object detection has been established [29] recently, as well as the remote sensing radar [30] and LiDAR [31]. Ref. [32] uses infrastructure-based LiDAR sensors for the detection and tracking of both pedestrians and vehicles at intersections and obtains good results on small objects.
However, most of the above-mentioned detection methods are expensive which strongly limit their deployment in practical applications [33], and their deployment in day-to-day use is currently impeded by a number of unsolved problems: (1) Low detection accuracy of small traffic signs in large images. Compared with medium and large objects, small traffic signs lack appearance information needed to be distinguished from the background or other similar categories [34]. (2) The prior achievements in detecting small objects can’t be verified since the vast majority of the research efforts are focused on large object detection [35]. Besides, due to the extremely uneven distribution of different traffic signs, it is generally easy to result in the problem of low recognition rate in those very-low-frequency samples. It is difficult but necessary to ensure high accuracy and robustness in traffic sign detection at the same time, especially in videos [36]. (3) Efficient simultaneous detection and tracking in videos. Owing to the lighting and weather interference in the real traffic environment and the onboard camera motion blur, bumps, etc. in the video detection [37,38], the bounding box is prone to flickering and missing targets [39], resulting in missed detections and false detections [40]. The safety of self-driving vehicles may probably be threatened.
Hence, this paper proposes an improved YOLV3 algorithm to help minimize the problems associated with small traffic signs and increase the overall YOLV3 performance. Furthermore, motivated from MOT (Multi-Object Tracking) [41], which is widely used to mark and track vehicles and pedestrians in videos in traffic surveillance systems and noisy crowd scenes most recently [42,43]. Deep-Sort (Simple Online and Real-time Tracking) [44] is adopted to overcome a series of adverse factors brought by camera motion to real-time video detection. Compared to several latest detection methods, the proposed method has higher accuracy and real-time performance and meets the requirements of small target traffic signs detection. The main contributions of this paper are summarized as follows:
(1) To address the problem of low detection accuracy resulted from exceptionally unbalanced samples distribution of different traffic signs in the TT100K, several image enhancement methods, such as adding noise, snow, frost, fog, blur, and contrast, etc., are applied to those categories of traffic signs that rarely appeared. These images obtained by enhancement are added to the original sample database to complete data augmentations, increasing the proportion of low-frequency traffic signs in the dataset, improving the equilibrium of sample distributions, and then improve the overall detection accuracy.
(2) It’s proposed that a new YOLOv3 architecture to better enable it to detect small targets. The detailed step is deleting the output feature map corresponding to the 32-times subsampling, adding the output feature map of the 4-times subsampling and concatenating it to the original network, which will more fit for small target features and will not reduce the detection effect of medium and big targets in the meanwhile.
(3) In order to strengthen object detection and object tracking in real-time, the false detection and missed detection levels caused by the external environment must be reduced. Deep-Sort is applied to object detection, which uses Mahalanobis distance, the smallest cosine distance, and other indicators to associate various targets in the video frames. While stabilizing the actual video bounding box, the error rate and omission rate of video detection are effectively decreased, and the anti-interference performance of the detection algorithm is enhanced too.
The remainder of this paper is organized as follows: Section 2 proposes the data enhancement method, detection framework, loss function, and multi-object tracking additionally. Section 3 presents the experimental results, and Section 4 concludes the paper.

2. Materials and Methods

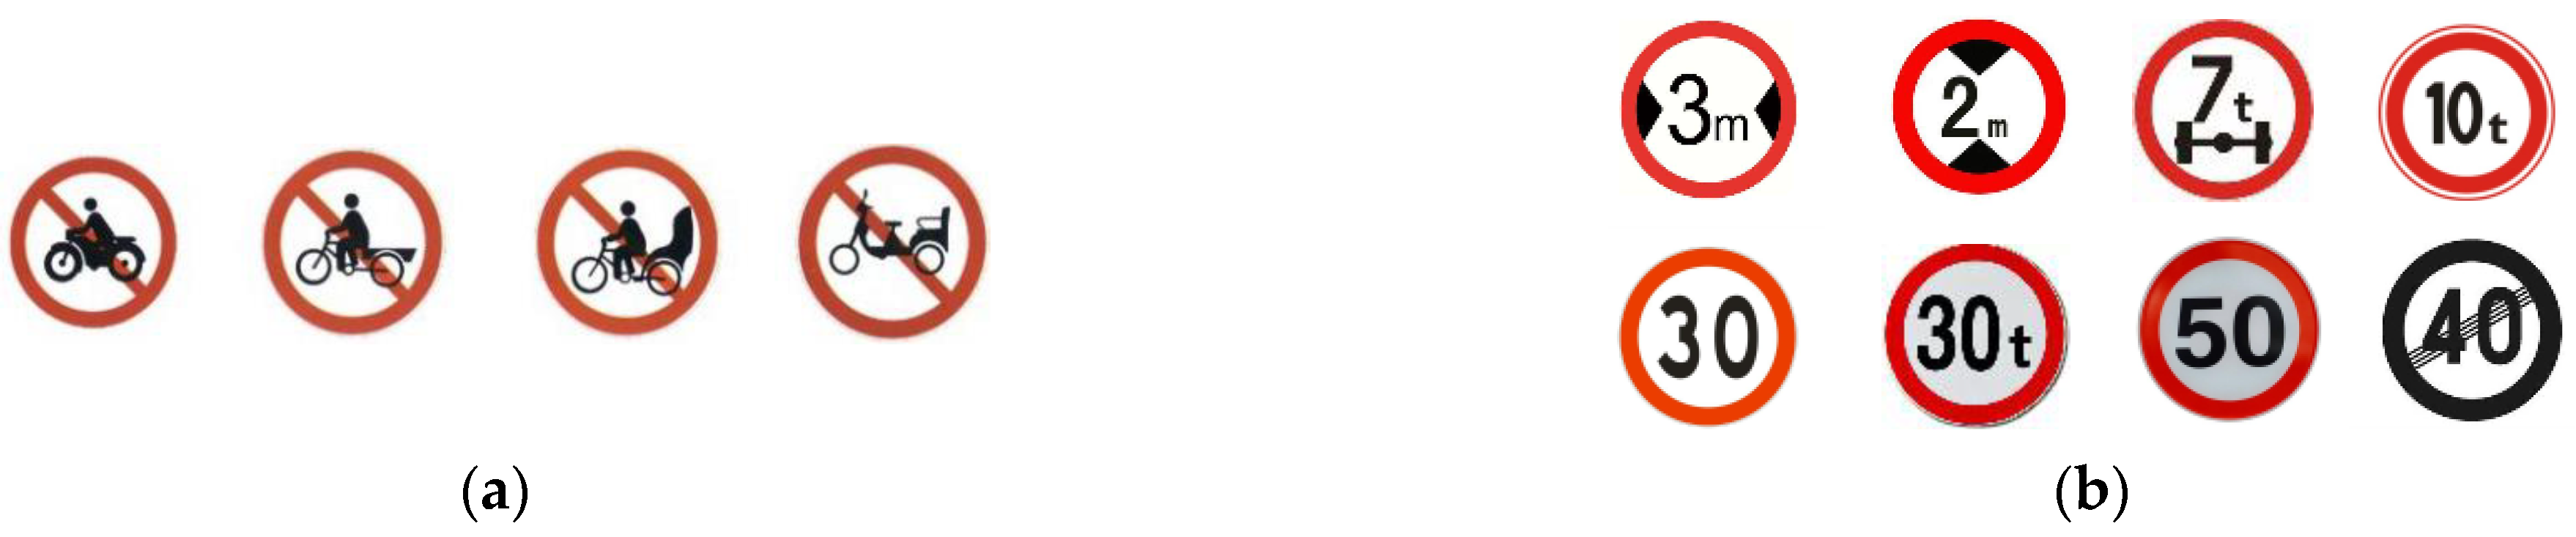
2.1. Fine-Grained Classifications and Sample Equalizations

Fine-grained image classification [45] is a challenging problem aiming to differentiate subordinate classes of a typical superior class. The purpose of the paper is to distinguish between superior and subordinate classes. There are two difficulties of fine-grained classification for traffic signs. Similarly, on the other hand, there is little difference between those of the same subordinate classes in the superior class. As shown in Figure 1a, the four symbols are all signs of prohibition, but the differences in characteristics are not significant. On the other hand, some specific traffic signs are shown in Figure 1b which reveal large differences between the same subordinate categories, such as height, width, speed limit, etc. Thus, traffic signs are more difficult to detect, and especially when self-driving cars are involved. Unfortunately, TT100K has an unbalanced proportion of traffic signs.
As shown in Figure 2 (the blue part), nearly half of the traffic sign categories in the dataset have very few samples, which can easily cause insufficient deep learning training, and eventually result in incorrect detection of small sample signs. Snell et al. [46] proposed few-shot learning that addressed the problem of detection caused by the insufficient training set or large training set but insufficient labeling information such as face detections and cell classifications. However, promising results are seldom if the dataset is combined with small or large samples added to it. Moreover, the primary detection object is small targets, which lead to even more undesirable results. According to the Vicinal Risk Minimization (VRM) principle, the generalization capacity should be improved by creating samples similar to the training samples for data augmentation [47]. Therefore, data augmentation is employed for small sample traffic signs in the TT100K to achieve the purpose of sample equilibrium, which is inspired by [48]. The details are as follows: 15 methods of data enhancement (e.g., noise enhancement, weather enhancement, fuzzy enhancement, and data enhancement). Finally, this paper applies these 15 types of data enhancement to the TT100K benchmark dataset, including Gaussian Noise, Shot Noise, Impulse Noise, Defocus Blur, Frosted Glass Blur, Motion Blur, Zoom Blur, Snow, Frost, Fog, Brightness, Contrast, Elastic, Pixelate, and JPEG.
The comparison of the distribution of various traffic signs between the TT100K and the enhanced TT100K is shown in Figure 2. After data augmentation, the number of small samples has definitely increased, as well as the category distribution of traffic signs has improved. Most of the training data contains a mix of signs, so augmenting smaller sets of data would necessitate data augmentation for the large category as well.

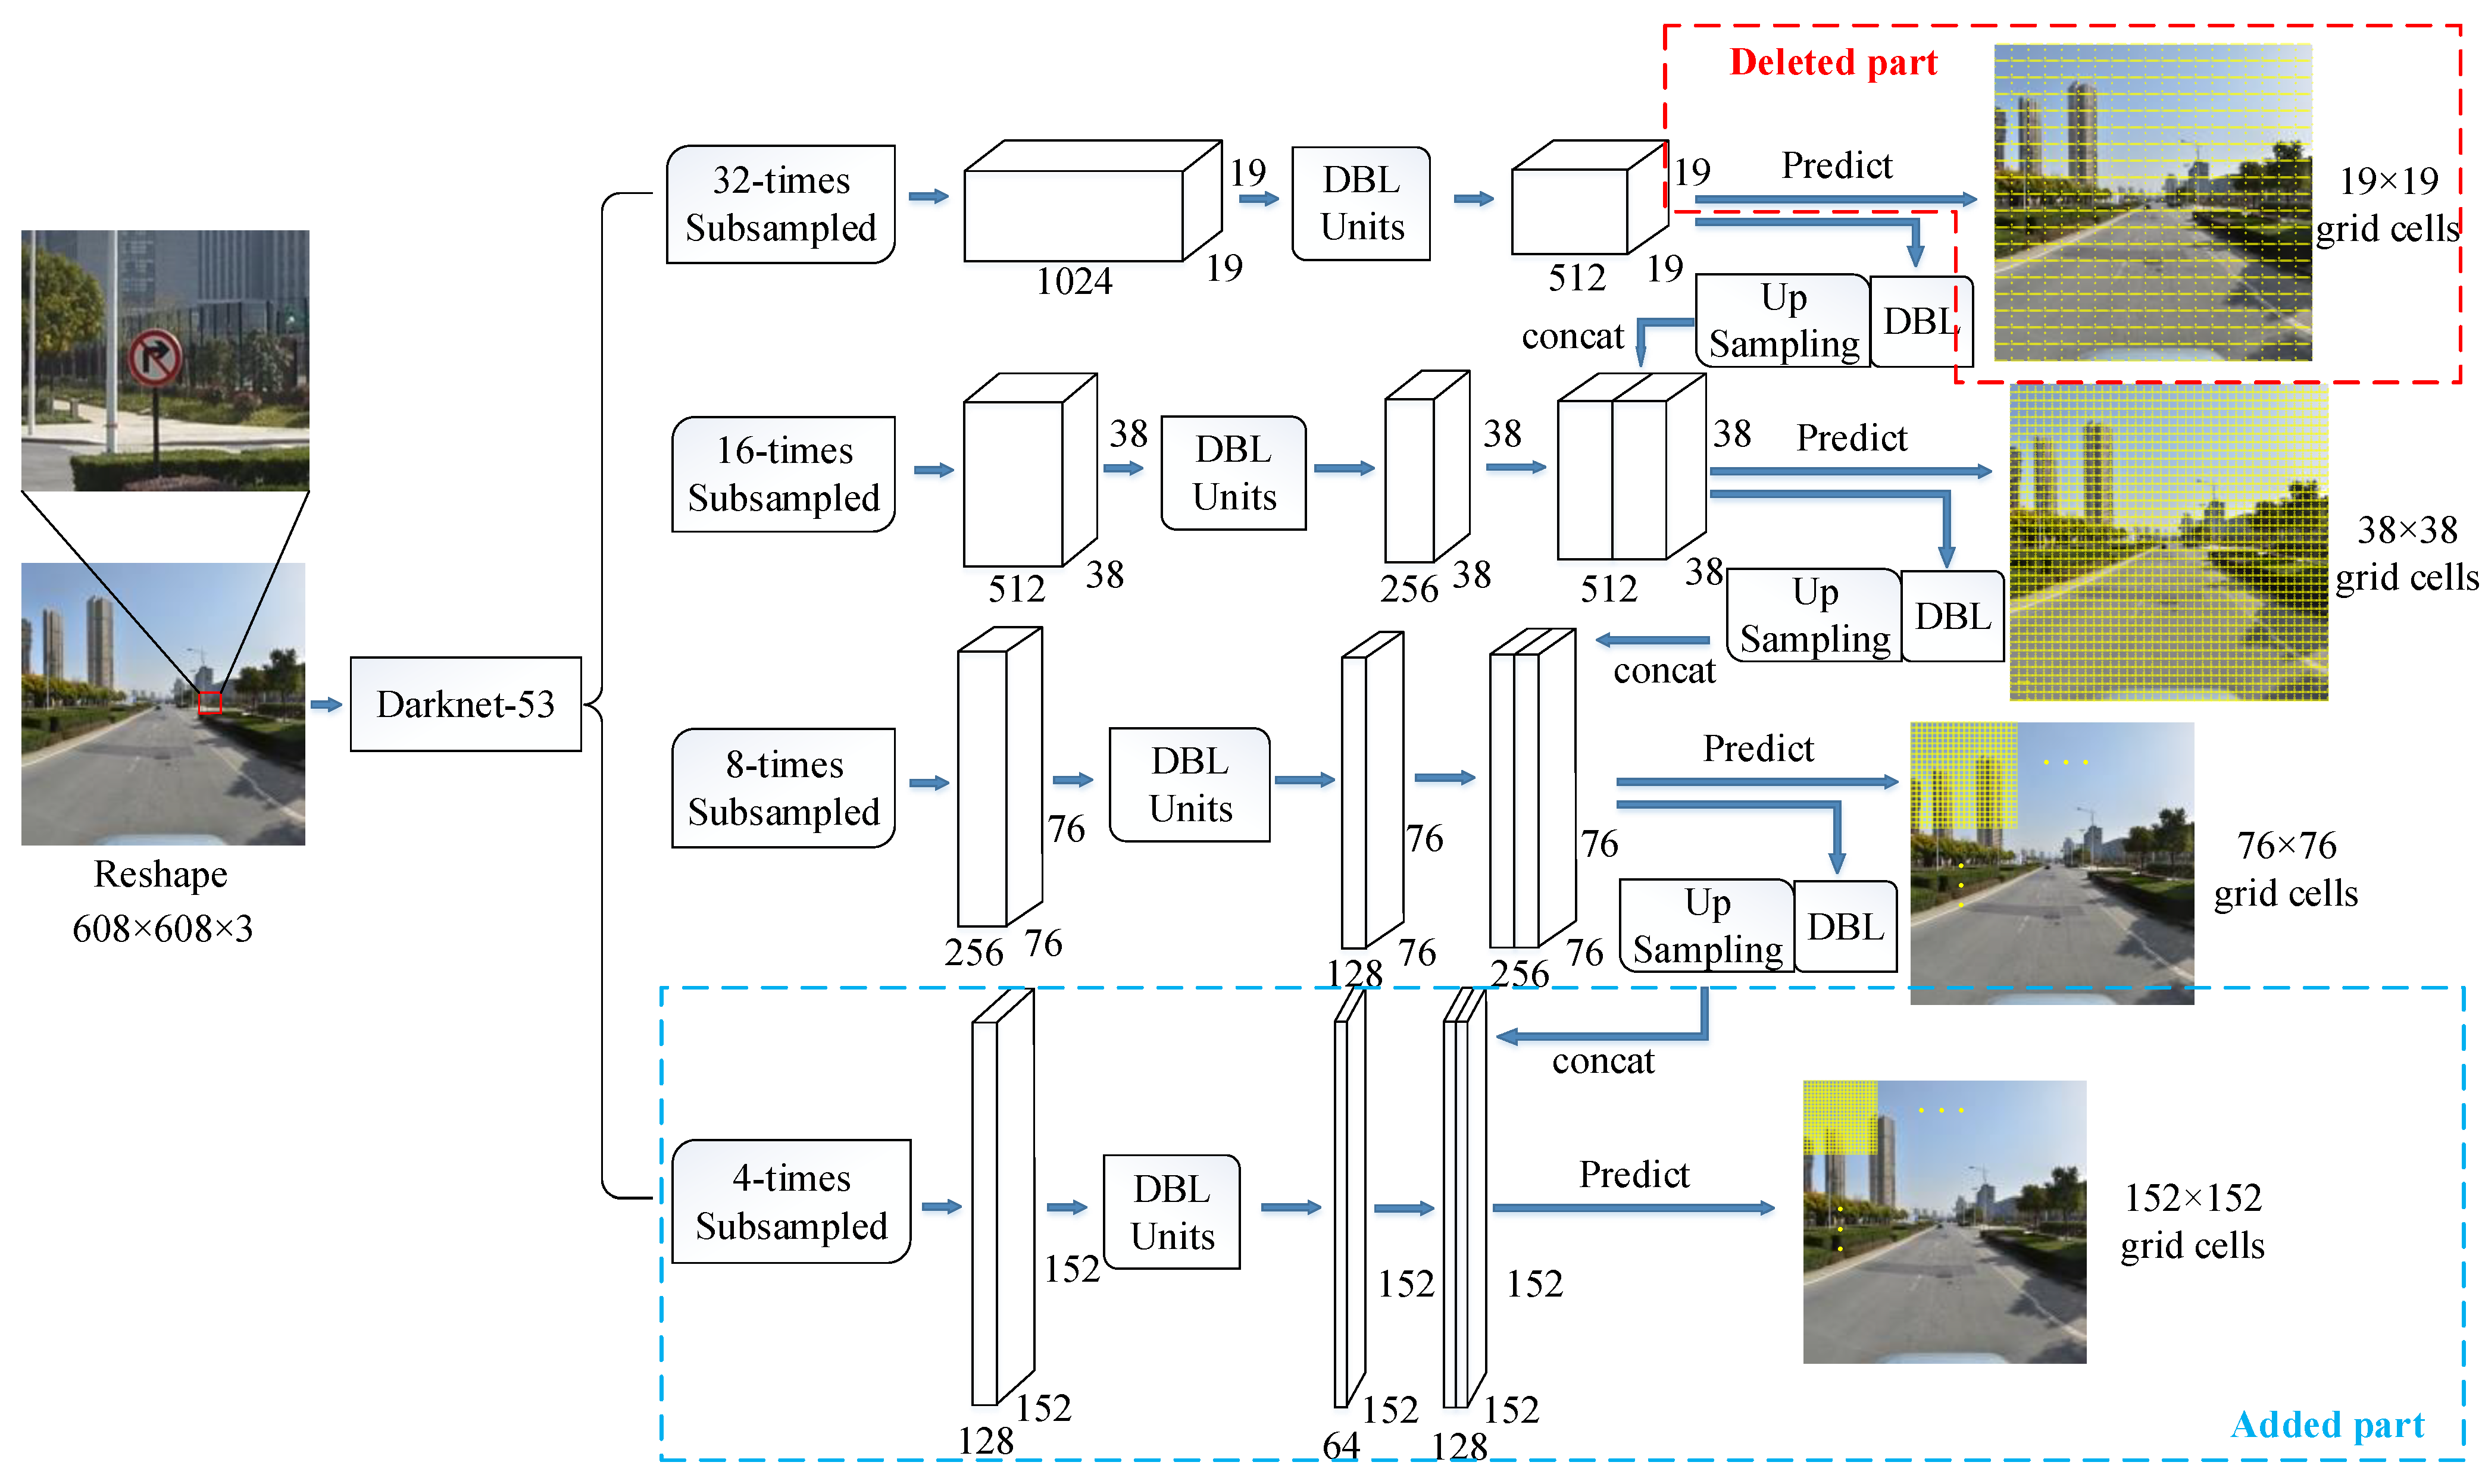
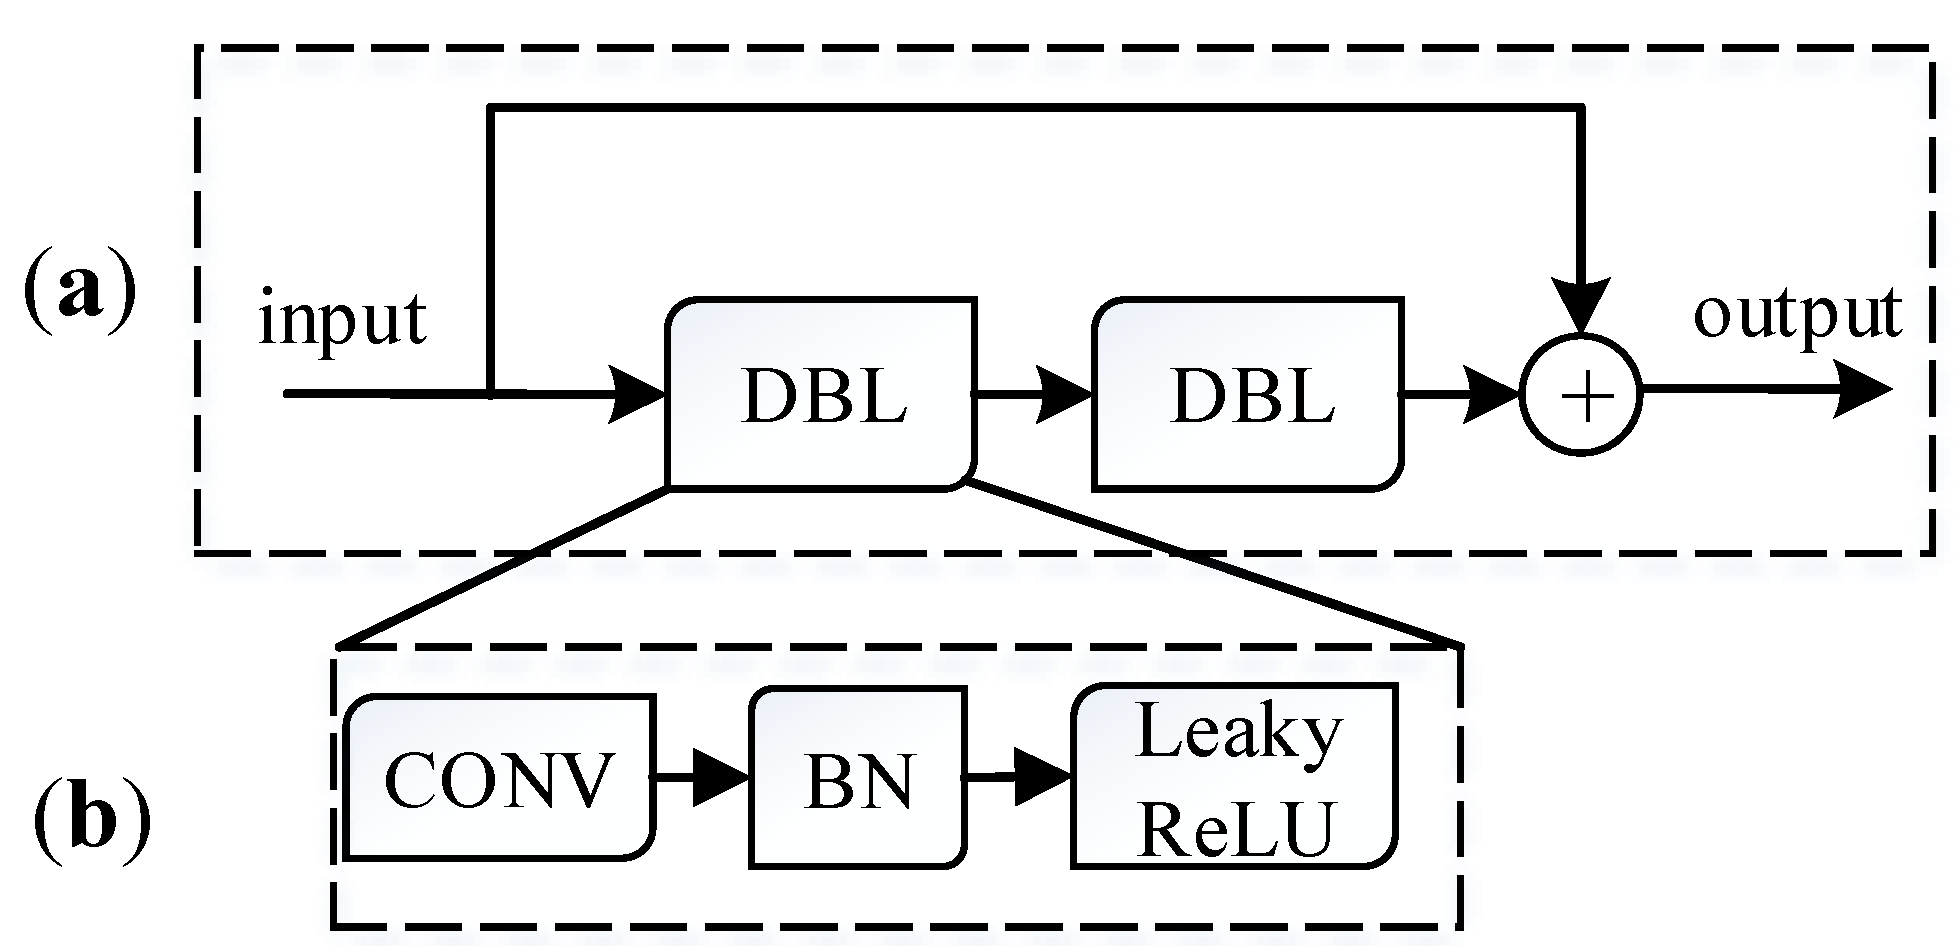
2.2. The Improvement of YOLOv3

To balance the real-time performance and high accuracy of the detection architecture, a new modified YOLOv3 structure is presented (shown in Figure 3), which using Darknet-53 [14] as the backbone network for feature extraction. As shown in Figure 4a, YOLOv3, compared with YOLOv2, refers to the residual structure of ResNet [49], which consists of 2 DBL (Darknetconv2d BN Leaky) units, aiming to increase identity mapping to relieve the model degradation by introducing shortcut. Where the DBL unit shown in Figure 4b, includes CONV (Convolution layer), BN (Batch Normalization), and the activation function LeakyReLU. The predicted output in Figure 3 mimics FPN (Feature Pyramid Networks) and upsampling feature fusion and uses multi-layer feature fusion to acquire a richer feature representation. By continuous subsampling, the 608 × 608 pixel image is capable of dividing into grid cells, corresponding to anchor boxes of different scales that are available from the K-means clustering algorithm. The specific grid cell is responsible for detecting the target when the center of the target’s ground truth falls within it.
As shown in Figure 3, the YOLOv3 turns the original image into 19 × 19, 38 × 38, 76 × 76 feature maps after feature extraction. The larger the size of the output feature map, the more grid cells in the feature map there are and the smaller the receptive field is. The receptive field is the size of the region mapped by each grid cell in the feature map in its corresponding input image. The larger the receptive field is, the larger the range in the initial image mapped by it will be, and the features contained will be more global and have a higher semantic level. The smaller the receptive field, the smaller the range in the image of the corresponding mapping, and the features contained tend to be local and more detailed [50]. Thus, the original three-scale feature maps of YOLOv3 are improved due to the limited extraction capability for small target features of 8-times subsampling. The output feature map with four-times subsampling is employed as an alternative to 32-times subsampling. Somehow, the ability to detect small targets can be strengthened. In contrast, extra features can be turned off to save computing resources.

2.3. Loss Function

As with YOLOv3, the loss function of proposed method is shown in the following equalization:
l o s s = E r r o r b o x e s E r r o r c o n f i d e n c e E r r o r c l a s s e s
Errorboxes is the coordinate regression of the bounding box, representing the location and coordinates of the bounding boxes, which is defined as follows:
E r r o r b o x e s = λ c o o r d i = 0 S 2 j = 0 K l i j o b j [ ( t x t x ) 2 + ( t y t y ) 2 + ( t w t w ) 2 + ( t h t h ) 2 ]
where S2 is the number of cells, K is the number of bounding boxes predicted by each grid cell, tx, ty, tw, th represent coordinates, width, and height of the bounding boxes. λcoord is the weight of the coordinate error. If there is a target in the i-th cell, the t-th bounding box of that cell is responsible for predicting the target, and if there is a corresponding ground truth, then l i j o b j = 1, otherwise, l i j o b j = 0.
Errorconfidence concludes the loss of confidence in the bounding box of the existing object and the objects that do not exist, which is defined as follows:
E r r o r c o n f i d e n c e = i = 0 S 2 j = 0 K l i j o b j [ c i log ( c i ) + ( 1 c i ) log ( 1 c i ) ] + λ n o o b j i = 0 S 2 j = 0 K l i j n o o b j [ c i log ( c i ) + ( 1 c i ) log ( 1 c i ) ]
In (3), c is the number of classes, and λnoobj is the weight of the confidence error.
Errorclasses is the classification loss of the grid cell in which the object exists and it is defined as follows:
E r r o r c l a s s e s = i = 0 S 2 l i o b j c c l a s s e s [ p i ( c ) log ( p i ( c ) ) + ( 1 p i ( c ) ) log ( 1 p i ( c ) ) ]
In (4), p is the probability, and cross-entropy is introduced to the loss function.

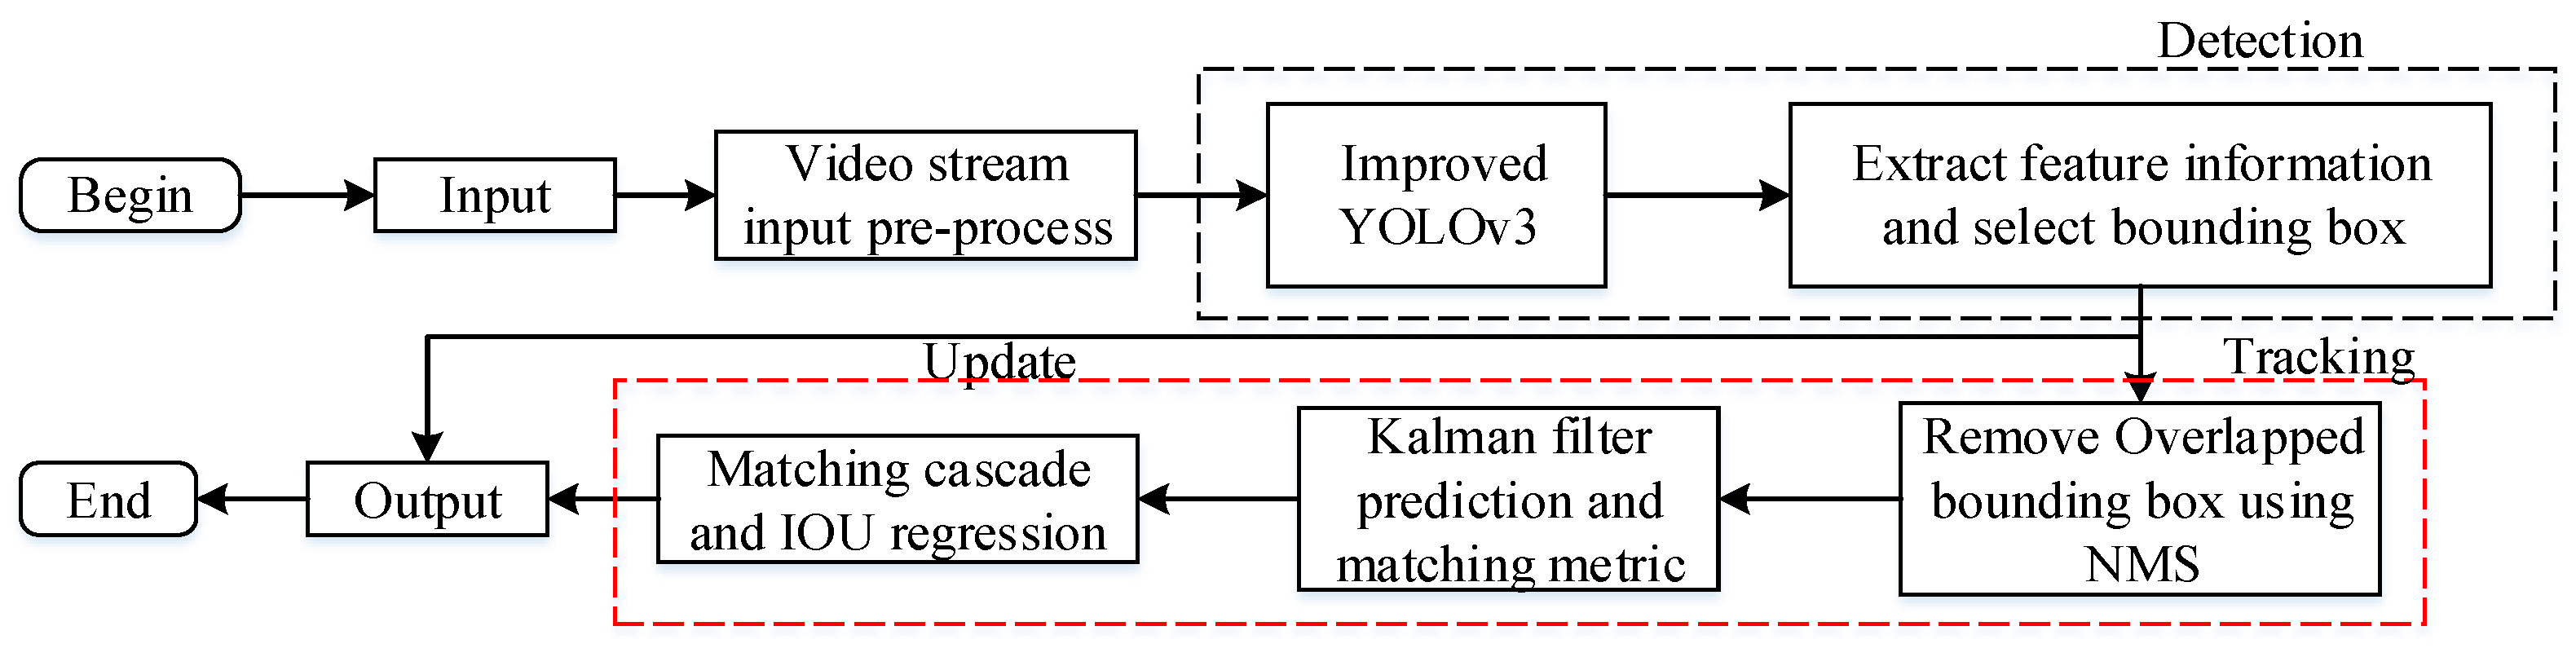
2.4. The Improvement of Detection Method with Multi-Object Tracking

A challenge for video detection when the bounding boxes become tiny due to frequent flickering and drifting results in missed and false detections. Significant external factors such as camera movement, occlusion, blur, etc. are also inherent issues that may occur with traffic signs. To address this problem, multi-object tracking of Deep-Sort, which has been verified validity by [51] in 2017, is adopted after YOLOv3. It is capable of improving the stability of the continuous frame target trajectory and eliminating the long-term mismatches of detection targets with recursive Kalman filtering and frame-by-frame data association. Figure 5 shows the structure for the tracking-by-detection used in this paper and the specific process of the method is described with pseudo-code in the Algorithm 1.
There are mainly two parts of Deep-Sort: appearance descriptor and data association. The matching measure is divided into Mahalanobis distance represents the motion matching metric, and the smallest cosine distance represents the appearance matching metric. When performing detection on a video, the bounding box of a target in the t frame can be obtained by the object detection algorithm or modeling and predicting the target’s bounding box in previous t frames by Kalman filtering. Finally, Kalman filtering can combine two bounding boxes to get the best estimate of the target in the current frame.
Algorithm 1 Detection and Tracking
Input: input = (width, height, channel, batch) Output: output = (matched detections, unmatched detections)
  1: Width, Height, Channel, Batch
  2: Compute Box = B × ( 4 + 1 + C )
  3: Bounding Box Logic regression (Dimension priors, location prediction)
  4: Compute Loss function = [ l o s s ] using (1)
  5: Detection indices D = { 1 , , M } , Track indices T = { 1 , , N } , Maximum age A max
  6: Compute gate matrix B = [ b i , j ] using (7) and (9)
  7: Compute cost matrix C = [ c i , j ] using (10)
  8: Initialize set of matched detections M
  9: Initialize set of unmatched detections U D
  10: for n { 1 , , A max } do
  11:     Select tracks by age T n { i T | a i = n }
  12:    [ x i , j ] min _ cos t _ matching ( C , T n , U )
  13:    M M { ( i , j ) | b i , j x i , j > 0 }
  14:    U U \ { j | i b i , j x i , j > 0 }
  15: end for
  16: return M , U
Each target has its trajectory in the video; thus, the 8-dimensional space is introduced as follows to describe the state of the target trajectory at a specific time.
( u , v , r , h , x * , y * , r * , h * )
where u, v represent center coordinates of the bounding box, r and h represent ratio and height, x*, y*, r*, h* respectively represent target speed information.
The Mahalanobis distance is defined as follows:
d ( 1 ) ( i , j ) = ( d j y i ) T S i 1 ( d j y i )
In (6), Si represent the covariance matrix of the observation space at the current moment predicted by the Kalman filtering, represent the prediction of the trajectory in the current frame to the next frame, dj represent the observed variable of the j-th target. It reflects the matching degree between j-th target an i-th trajectory. If the Mahalanobis distance between the bounding box of the target in the current frame and the previous trajectory prediction observation is less than 9.4877, expressed as t(1), the corresponding target and trajectory are related, expressed as b i , j ( 1 ) , as follows:
b i , j ( 1 ) = 1 [ d ( 1 ) ( i , j ) t ( 1 ) ]
While the Mahalanobis distance is capable of ensuring the continuity of the bounding box during driving, the motion of the onboard camera will cause a large number of mismatches in the Mahalanobis distance. Therefore, the smallest cosine distance is introduced as follows to match different target trajectories:
d ( 2 ) ( i , j ) = min { 1 r j T r k ( i ) | r k ( i ) R i }
where | r j | = 1 , which represents the feature description factor of j-th target, rj represents the appearance of the tracking target in different frames, Ri represents the entire trajectory of tracking, r k i represents the description factors for all trajectories. If the two trajectories are related if the smallest cosine distance between two trajectories is less than b(2) i,j which can be obtained by training:
b i , j ( 2 ) = 1 [ d ( 2 ) ( i , j ) t ( 2 ) ]
And combine both two metrics:
c i , j = λ d ( i ) ( i , j ) + ( 1 λ ) d ( 2 ) ( i , j )
where λ represents the weight, the Mahalanobis distance measure is particularly valid for short-term prediction and matching. In contrast, the smallest cosine distance measure is more effective for long-term mismatched trajectories. The Mahalanobis distance measure is ignored owing to the large jitter of motion onboard camera in this paper.
Finally, cascade matching and IOU (Intersection over Union) association are employed to relieve trajectory changes or loss caused by occlusion.

3. Results

3.1. Experimental Setups

Our experiment is carried out on a personal computer-based python 3.7 environment, which uses Intel (R) Core (TM) i5-9400F 2.90GH CPU(Shanghai, China) and Nvidia GeForce RTX 2070 GPU (8 GB memory), using Darknet-53 as the deep learning framework. The parameters of the algorithm are set as follows: the initial learning rate is set to 0.001, and the learning strategy of steps is adopted. The SGD (Stochastic Gradient Descent) optimizer with a momentum of 0.9 is utilized to adjust the parameters of the network. Moreover, a weight decay of 0.0005 is used to prevent model overfitting. In all experiments, we use the same superior parameters to train 51,000 batches. The 35,000th and 46,000th batches of the method reduced the learning rate to 1/10 of the original value.

3.2. Effectiveness Analyses

In this section, we will make a detailed experimental evaluation of our method. The detection performance on small objects is tested on the TT100K. Each iteration contains 64 images. The input resolutions of training and testing images are both 608 × 608, and the weight of the pre-trained model on ImageNet [52] is used as the initial weight. This section demonstrates four aspects, including small sample equalization effects, comparisons of YOLOv3 detection results before and after improvement, comparisons of this method with the range pole methods, and comparisons of whether to adopt Deep-Sort, in order to verify the validity of the proposed method.

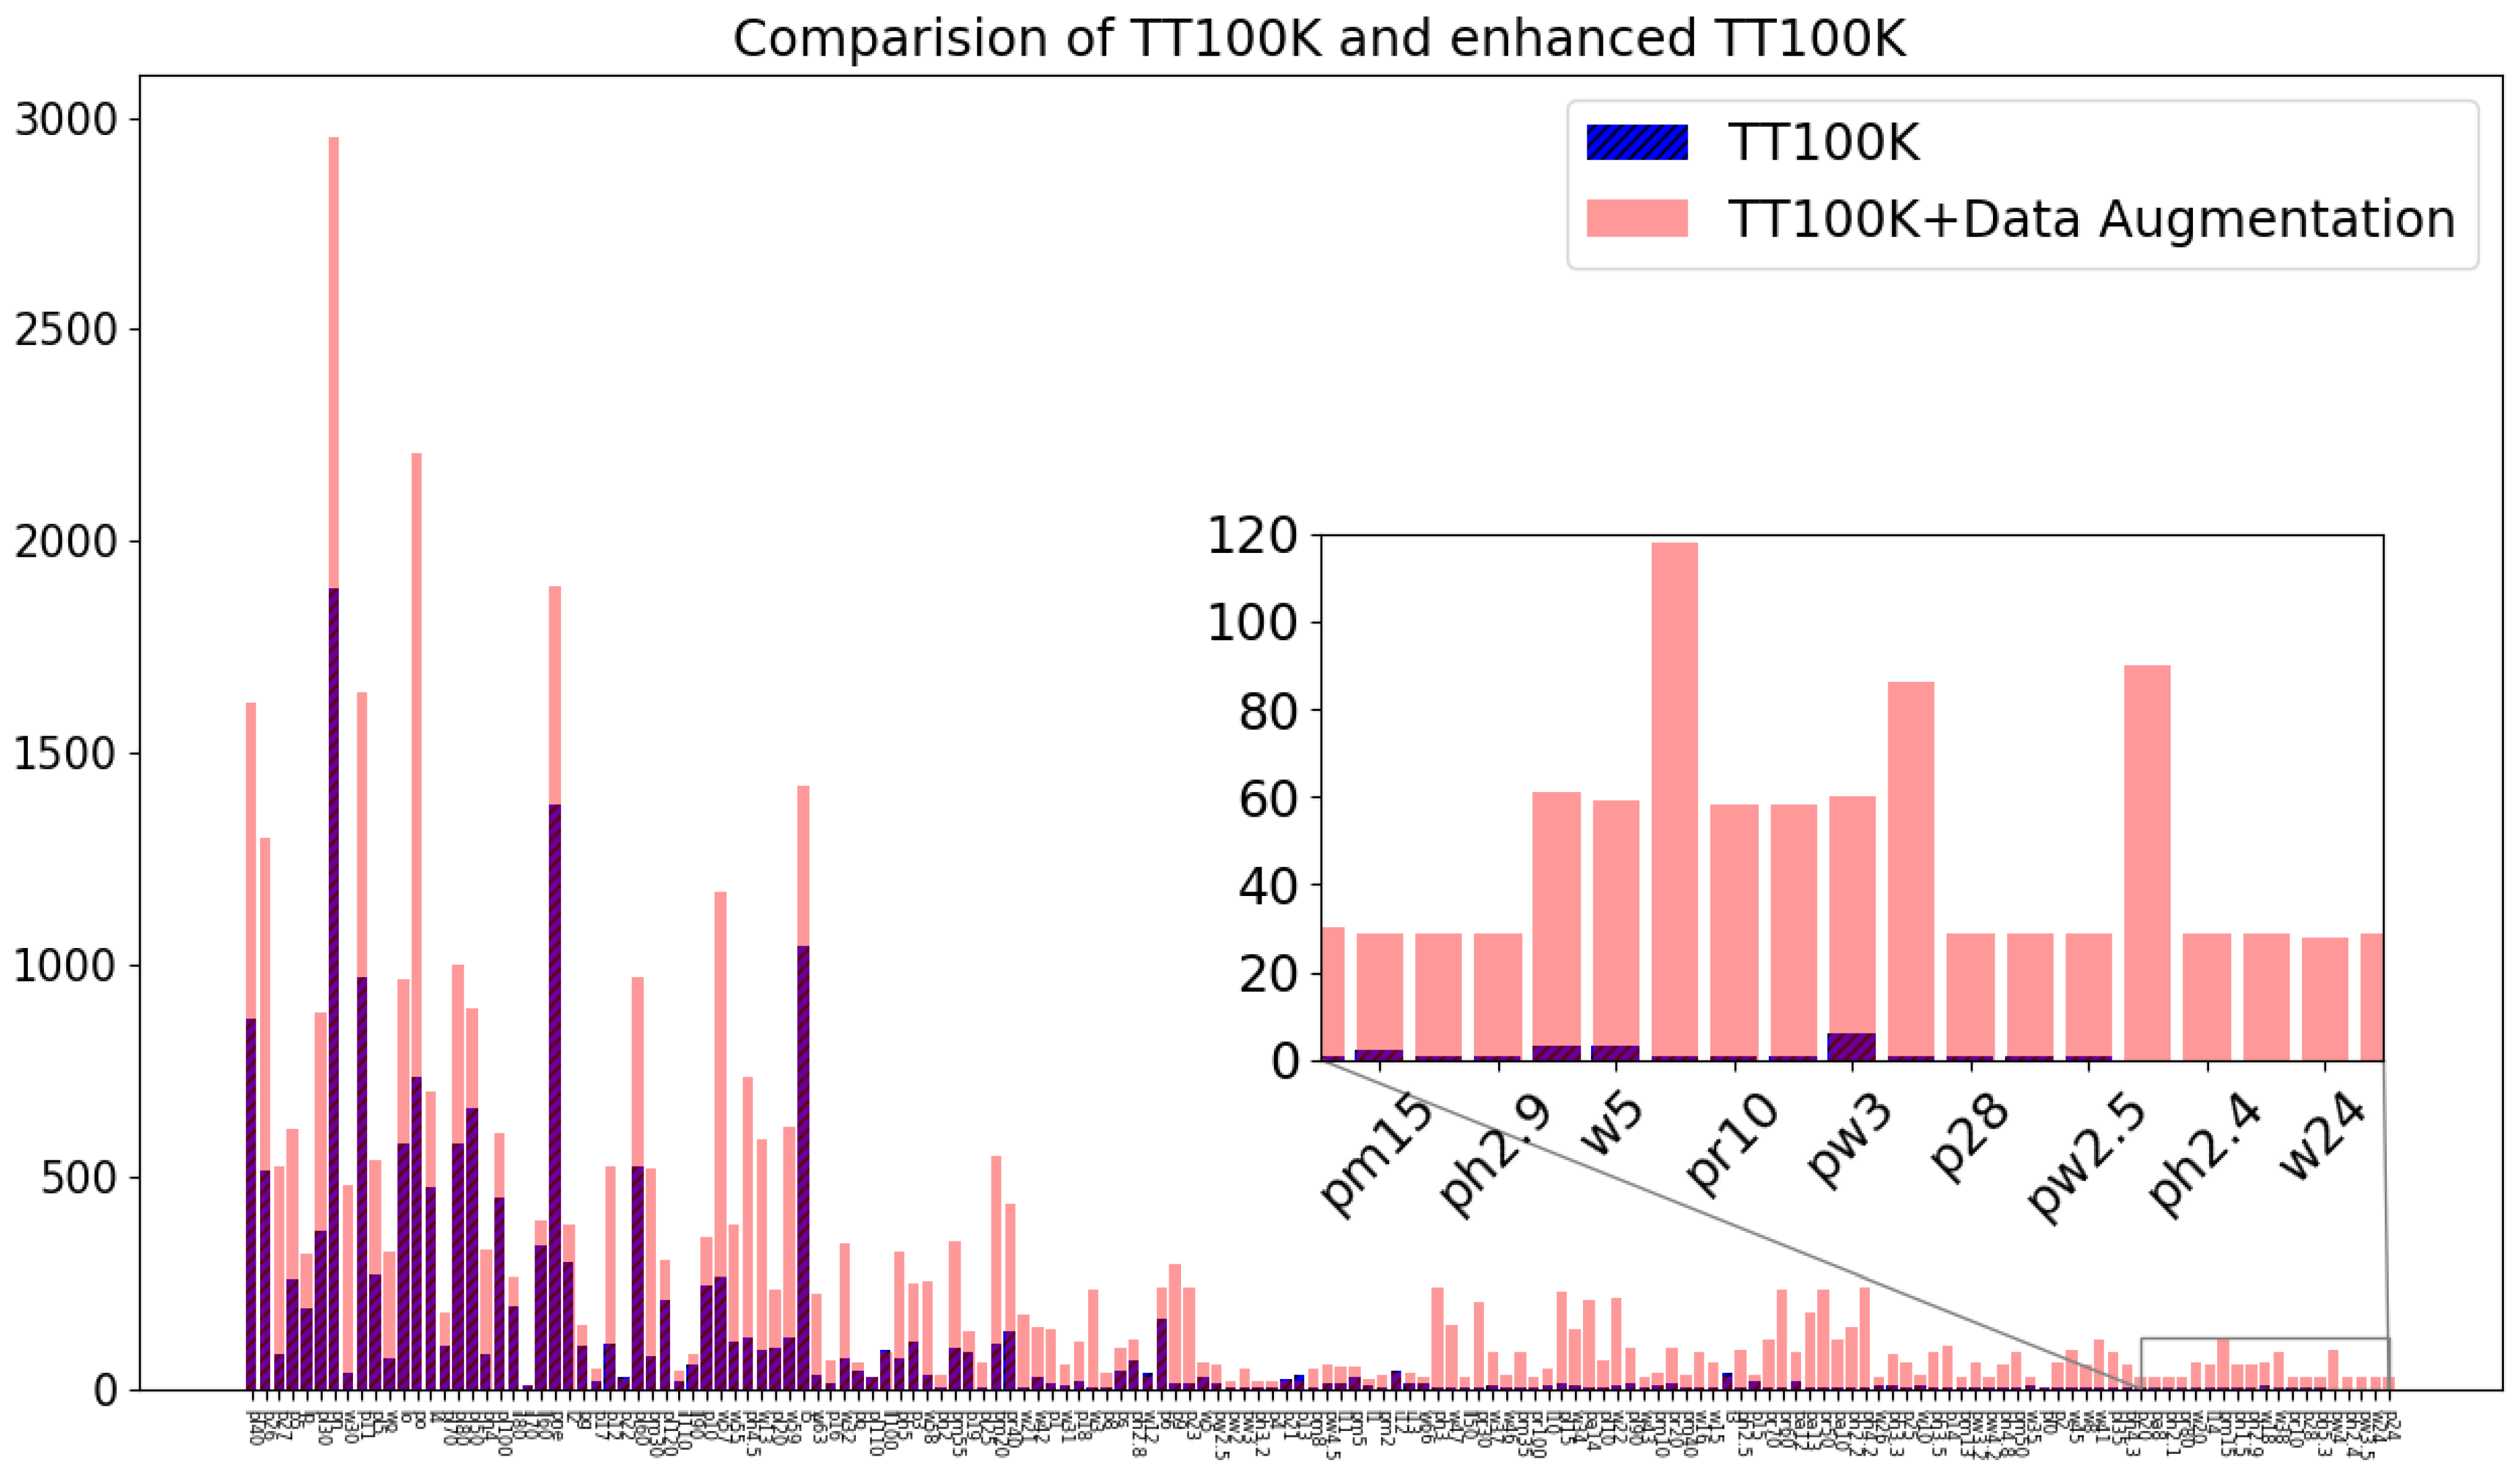
3.2.1. Small Sample Equalization

A total of 6605 training images, including 128 different categories of traffic signs, are all with resolutions of 2048 × 2048 in the TT100K. It is challenging to meet the detection requirements in Real-World traffic scenarios because road conditions vary from region to region, subordinate classes are not classified in detail in the original dataset like speed limit is 60 km/h, so as to ignore the numerical difference (speed limit 40 km/h, 80 km/h). Thus, this paper subdivides some categories of the TT100K, which increases the number of categories from 128 to 152, using data enhancement (such as noise, weather, blur, etc.) to expand the TT100K from 6605 training images to 13,238 images. 90% of the images are randomly selected for training and the remaining 10% for testing. 152 types of traffic signs are detected to obtain the precision rate and recall rate during the test, which are evaluated as follows:
P = TP TP + FP
R = TP TP + FN
A P c = 1 N c r c R c p ( r c )
m A P = 1 N A P c
where TP represents true positive which indicates the detections of traffic signs are correct, FP represents false positive which indicates the detections of traffic signs are wrong, FN is false negative and it represents the number of lost traffic signs, Nc presents the number of class c, p(rc) is precision value when class c recall is rc. Table 1 proves the validity of the data augmentation. After performing data augmentation, the precision and recall rate of the model are improved by 4% and 9% respectively on the TT100K. As shown in Table 1, it is easy to find that YOLOv3 will work better as the small sample training images increases.

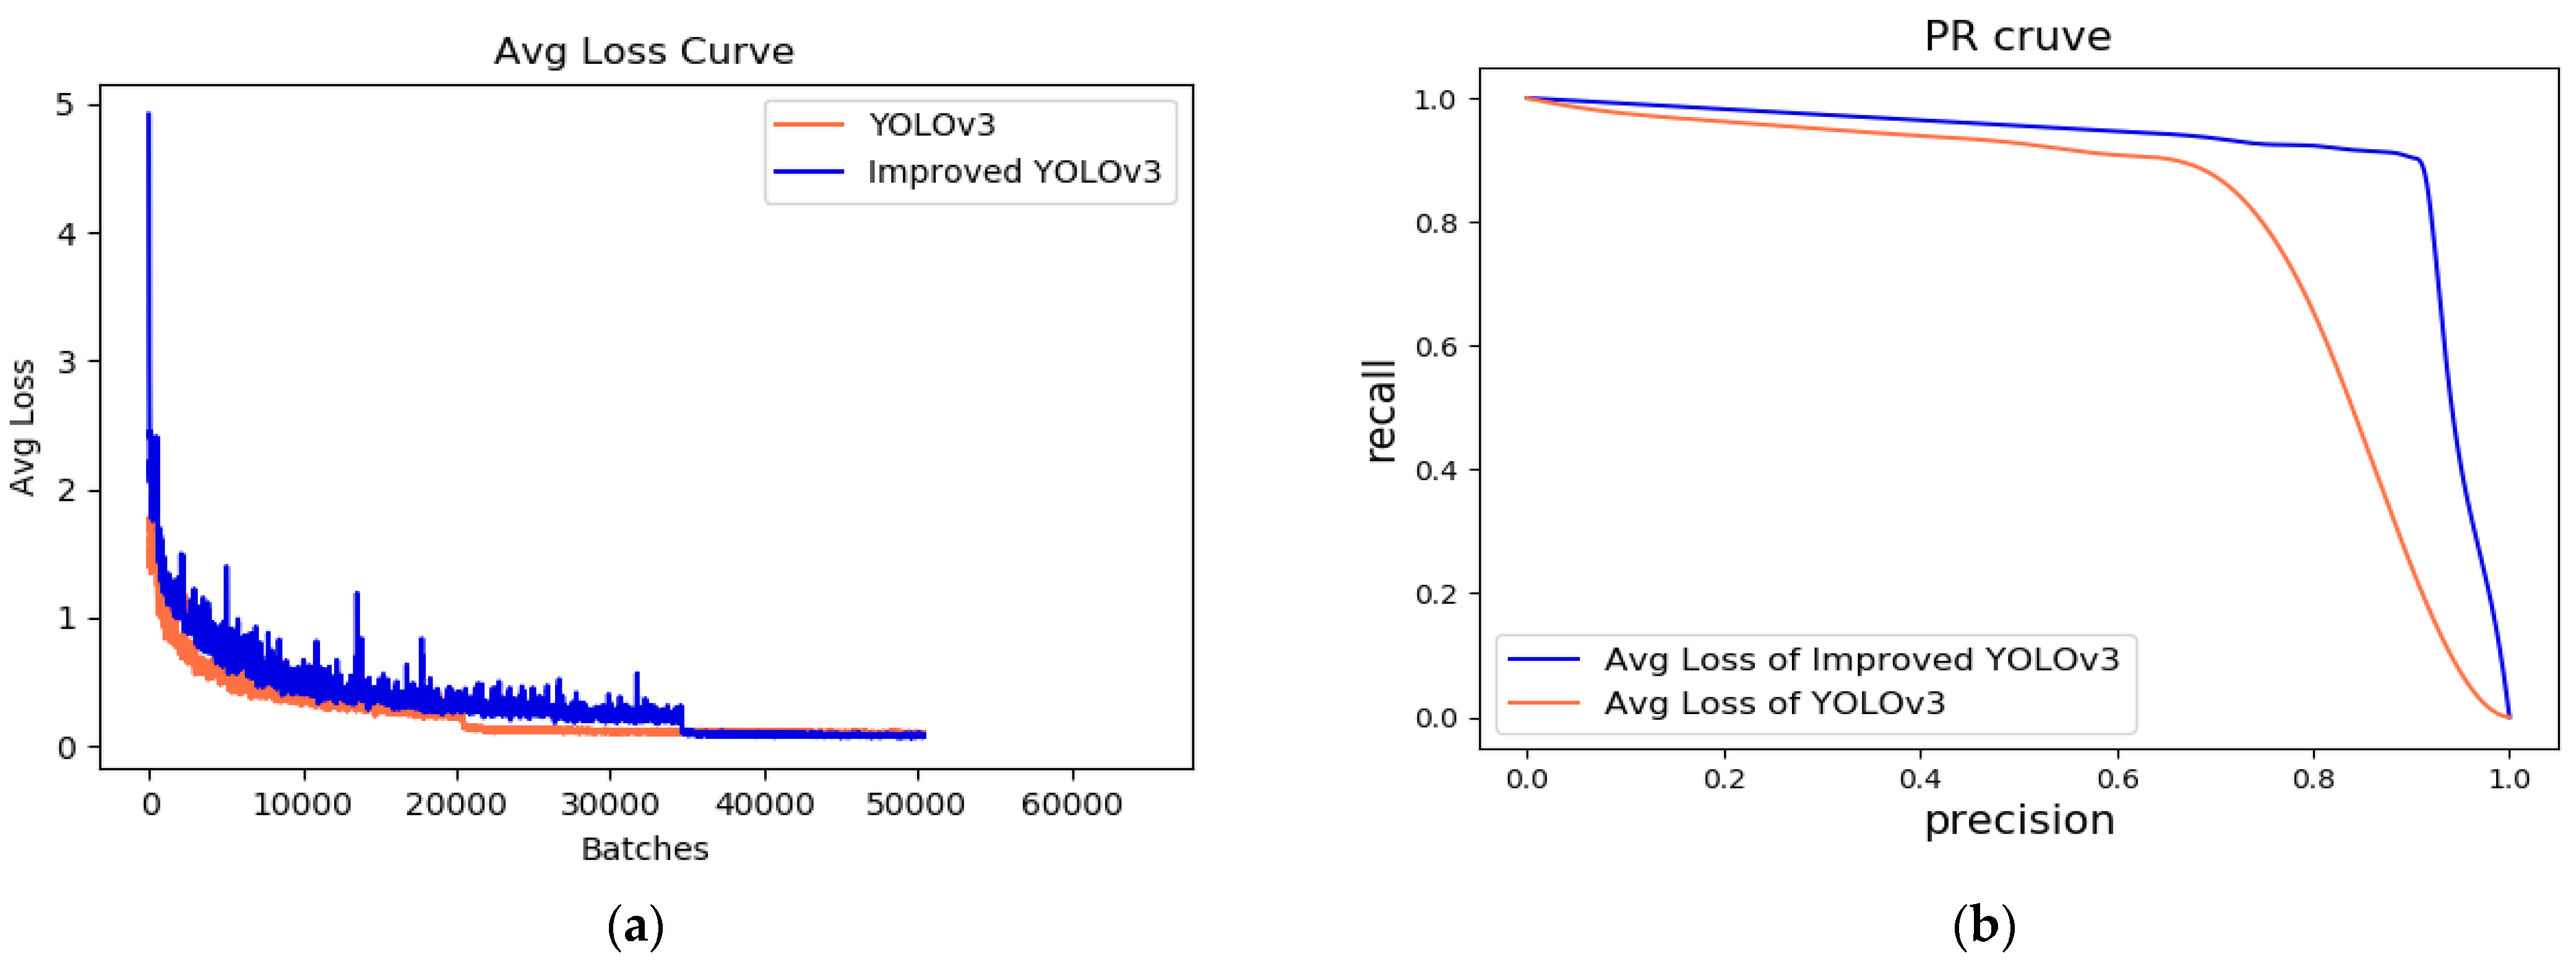
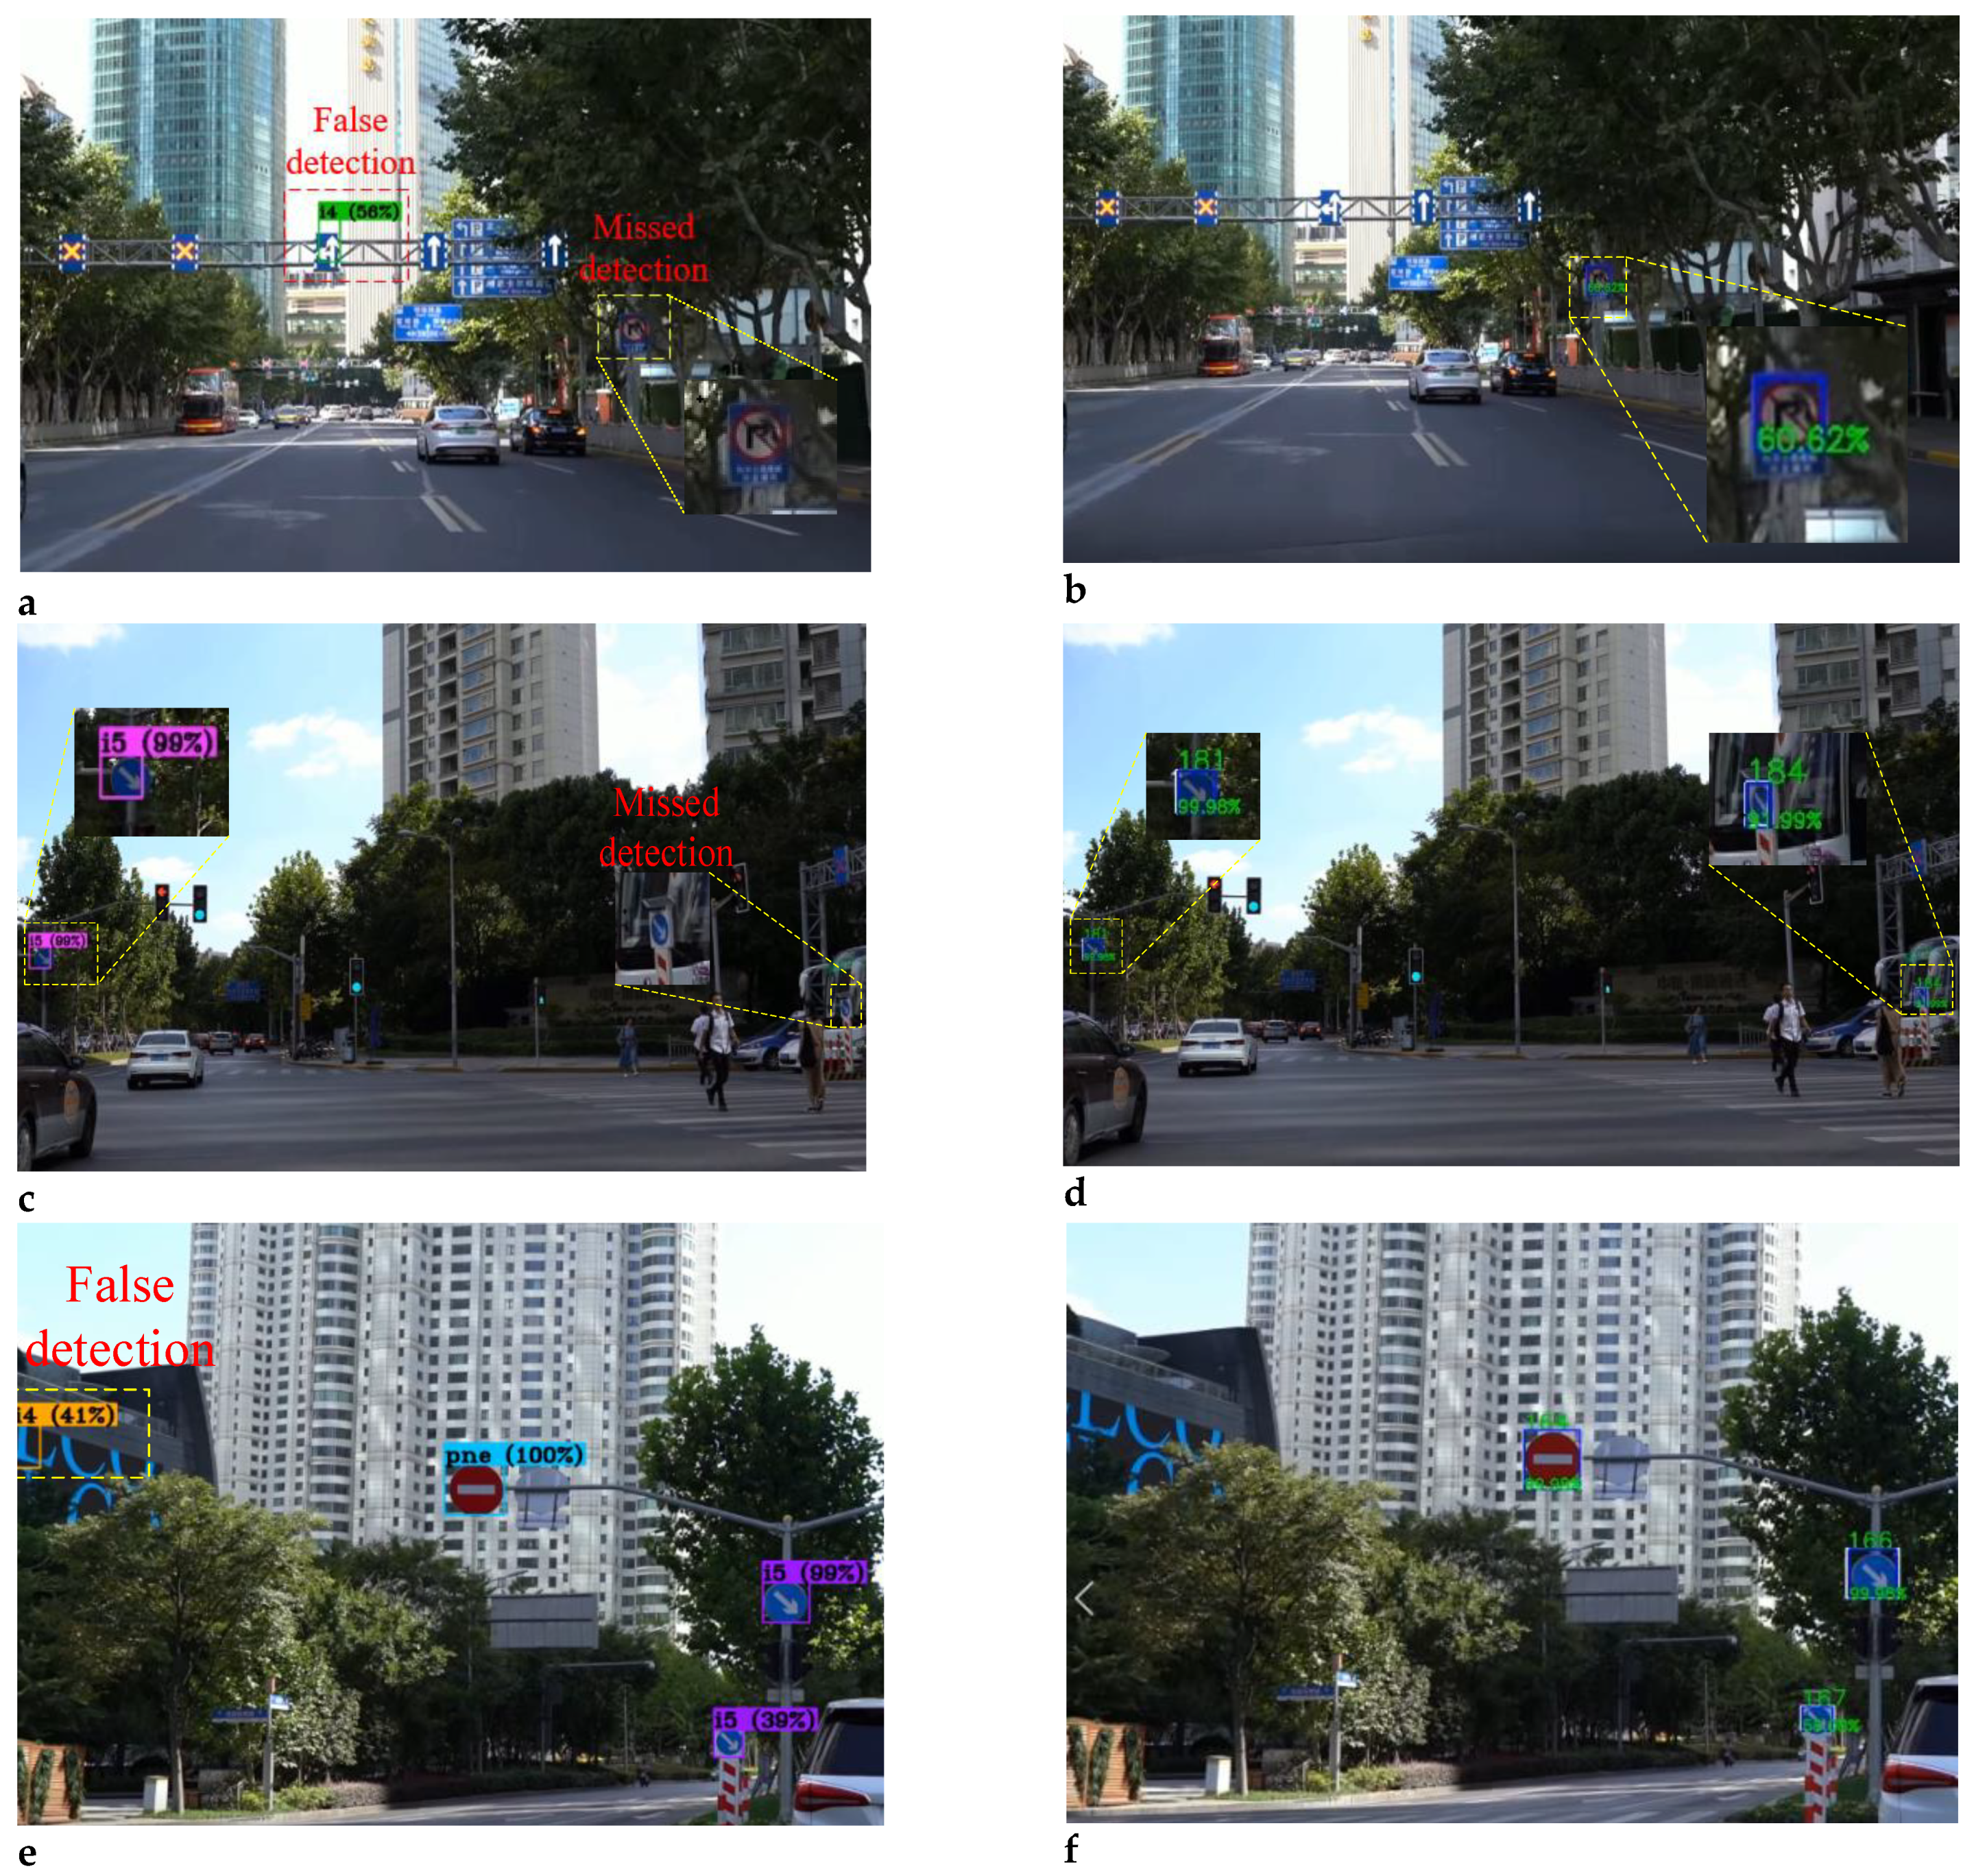
3.2.2. Comparisons of YOLOv3 Detection Results before and after Improvements

The precision, recall, and speed of YOLOv3 and Improved YOLOv3 are shown in Table 2. An additional output layer is added, resulting in a slight increase in computing cost, but the detection results, which are made up of precision and recall, have the greatest impact on sensitivity. Besides, the loss curve and P-R curve of YOLOv3 and improved YOLOv3 are shown in Figure 6.
In order to further verify the efficiency of the model for small targets and to ensure the detection ability of other scale targets, the Microsoft COCO benchmark [44] evaluation metrics are adopted. According to the size of traffic signs, Ref. [44] attributes the pixel value of object length and width between 0 and 32 to small objects, the pixel value of target length and width between 32 and 96 to medium objects, and the pixel value of target length and width between 96 and 400 to large objects. YOLOv3 and the improved YOLOv3 are tested on the TT100K, which has performed data augmentation. As suggested in Table 3, meanwhile, the method enhances the detection ability of YOLOv3 for small targets and slightly enhances the detection effect for medium targets and large targets.

3.2.3. Comparison with State-Of-The-Art Methods

The proposed method is compared with state-of-the-art methods [16,23,26,53,54] on the same dataset. In [23], the Overfeat model proposed by Zhu et al. achieved the highest accuracy on the TT100K, which obtained 91% precision, 93% recall, and 93% mAP. However, the image pyramid must be adopted, which greatly increases the computing cost. Zhang et al. [54] proposed MSA-YOLOv3, which adopted the augmentation path merge with FPN to detect targets with different sizes. Compared with [23], the speed is significantly improved; the detection precision and recall rate are slightly reduced, and the main reason is that our model has as many as 152 detection categories, which is much higher than the 45 categories in [23,54]. Nevertheless, as shown in Table 4, the detection speed is much higher than the method in [23], the precision and recall rate are also higher than that in [54]. And our model achieves the fastest detection speed on 45 categories of traffic signs, and mAP is slightly less than [23]. Detailed comparisons of the average precision (AP) of different signs on the enhanced TT100K are shown in Table 5, including Zhu [23], YOLOv3, and improved YOLOv3. It is evident that the model proposed in this paper is capable of detecting more traffic signs and achieving higher average precision of different categories. Moreover, it effectively improves the performance of fine classification for subordinate classes with highly similar appearance such as height limit signs (e.g., ph2.1, ph2.2, etc.) and weight limit signs (e.g., pm10, pm15, pm55, etc.).
In conclusion, the proposed method has achieved better results in terms of small targets, multi-classification, and real-time performance compared with current state-of-the-art methods. Compared to the latest method [54], both the detection accuracy and speed have been greatly improved, which obtains 91% precision, 92% recall, and 91.77% mAP under the condition of the same detection categories. Table 5 also indicates the improvement of average precision of the proposed method on different traffic signs in comparison with Zhu [23].

3.2.4. Comparisons of Detection Results with or without Deep-Sort

As shown in Figure 7, it can obviously be seen the difference in whether or not to add the Deep-Sort MOT algorithm. The figures on the right column (b), (d), and (f) are the detection results of adding Deep-Sort in the video detection process, and the left column (a), (c), and (e) are the video detection result without adding Deep-Sort, respectively intercepted part of the video in the same frame in the two results. In the case of low light, there is missed detection and false detection for the images with a complex background or objects of the same shape and color as the traffic sign. It effectively improves the situation when performing Deep-Sort after video detection.

4. Discussion and Conclusions

It is still a challenge to compromise between computational cost and accuracy in small targets detecting for self-driving vehicles in actual scenarios. An improved YOLOv3 object detection and tracking method is proposed in this paper, and it has the following advantages: (1) The modified model is accurate in small object detection but can be done at real-time, which comes at the expense of slower performance. (2) This paper applies data augmentation techniques to make up for the lack of proper representation of the imbalance in the dataset. Experimental results show that equalization of extremely low-frequency traffic signs improves the detection accuracy. (3) To improve video detection accuracy, Deep-Sort is added in the process of video detection, which effectively reduces the false detection and missed detection caused by external factors, and improves the robustness of the proposed model. Consequently, compared with the comparative methods [16,23,26,53,54], the proposed method has more advantages in real-time traffic sign video detection, including detection accuracy, speed, and robustness.
Traffic sign detection is an important part of driving in the autonomous environment. However, even in the Real World, pedestrian and vehicle movements must be accounted for in self-driving systems. We will discuss this matter and put it to the test in the coming researches.

Author Contributions

Conceptualization, Y.L. and S.S.; methodology, Y.L.; software, S.S.; validation, S.S., Q.H. and G.L.; investigation, Y.L., S.S., Q.H., and G.L.; resources, Y.L.; writing—original draft preparation, Y.L. and S.S.; writing—review and editing, S.S.; visualization, Q.H., and G.L.; supervision, Y.L.; project administration, S.S. All authors have read and agreed to the published version of the manuscript.

Funding

This research was funded by National Natural Science Foundation of China, grant number 61863003 and Natural Science Foundation of Guangxi Province, grant number 2016GXNSF AA380327.

Institutional Review Board Statement

Not applicable.

Informed Consent Statement

Not applicable.

Data Availability Statement

Data sharing not applicable.

Acknowledgments

This work was supported in part by the National Natural Science Foundation of China, and in part by the Natural Science Foundation of Guangxi Province.

Conflicts of Interest

The authors declare no conflict of interest.

References

  1. Sugiharto, A.; Harjoko, A. Traffic Sign Detection Based on HOG and PHOG Using Binary SVM and k-NN. In Proceedings of the 2016 3rd International Conference on Information Technology, Computer, and Electrical Engineering (ICITACEE), Semarang, Indonesia, 19–20 October 2016. [Google Scholar]
  2. Khan, J.F.; Bhuiyan, S.M.A.; Adhami, R.R. Image Segmentation and Shape Analysis for Road-Sign Detection. IEEE Trans. Intell. Transp. Syst. 2010, 12, 83–96. [Google Scholar] [CrossRef]
  3. De La Escalera, A.; Moreno, L.E.; Salichs, M.A.; Armingol, J.M. Road traffic sign detection and classification. IEEE Trans. Ind. Electron. 1997, 44, 848–859. [Google Scholar] [CrossRef] [Green Version]
  4. Berkaya, S.K.; Gunduz, H.; Ozsen, O.; Akinlar, C.; Gunal, S. On circular traffic sign detection and recognition. Expert Syst. Appl. 2016, 48, 67–75. [Google Scholar] [CrossRef]
  5. Wang, C. Research and application of traffic sign detection and recognition based on deep learning. In Proceedings of the 2018 International Conference on Robots & Intelligent System (ICRIS), Changsha, China, 26–27 May 2018. [Google Scholar]
  6. Zhao, Z.-Q.; Zheng, P.; Xu, S.-T.; Wu, X. Object Detection with Deep Learning: A Review. IEEE Trans. Neural Netw. Learn. Syst. 2019, 30, 3212–3232. [Google Scholar] [CrossRef] [Green Version]
  7. Ren, S.; He, K.; Girshick, R.; Sun, J. Faster R-CNN: Towards real-time object detection with region proposal networks. IEEE Trans. Pattern. Anal. Mach. Intell. 2017, 39, 1137–1149. [Google Scholar] [CrossRef] [PubMed] [Green Version]
  8. Girshick, R.; Donahue, J.; Darrell, T.; Malik, J. Rich feature hierarchies for accurate object detection and semantic segmentation. In Proceedings of the IEEE Conference on Computer Vision and Pattern Recognition (CVPR), Columbus, OH, USA, 23–28 June 2014; pp. 580–587. [Google Scholar]
  9. Girshick, R. Fast R-CNN. In Proceedings of the 2015 IEEE International Conference on Computer Vision (ICCV), Santiago, Chile, 7–13 December 2015; pp. 1440–1448. [Google Scholar]
  10. He, K.; Gkioxari, G.; Dollar, P.; Girshick, R. Mask R-CNN. In Proceedings of the IEEE International Conference on Computer Vision(ICCV), Venice, Italy, 22–29 October 2017; pp. 2961–2969. [Google Scholar]
  11. Liu, W.; Anguelov, D.; Erhan, D.; Szegedy, C.; Reed, S. SSD: Single shot multibox detector. In Proceedings of the European Conference on Computer Vision(ECCV), Amsterdam, The Netherlands, 8–16 October 2016; pp. 21–37. [Google Scholar]
  12. Redmon, J.; Divvala, S.; Girshick, R.; Farhadi, A. You only look once: Unified real-time object detection. In Proceedings of the IEEE Conference on Computer Vision and Pattern Recognition (CVPR), Las Vegas, NV, USA, 27–30 June 2016; pp. 779–788. [Google Scholar]
  13. Redmon, J.; Farhadi, A. YOLO9000: Better, faster, stronger. In Proceedings of the IEEE Conference on Computer Vision and Pattern Recognition (CVPR), Honolulu, HI, USA, 21–26 July 2017; pp. 6517–6525. [Google Scholar]
  14. Miao, F.; Tian, Y.; Jin, L. Vehicle Direction Detection Based on YOLOv3. In Proceedings of the 2019 11th International Conference on Intelligent Human-Machine Systems and Cybernetics (IHMSC), Zhejiang, China, 24–25 August 2019; pp. 268–271. [Google Scholar]
  15. Yang, T.; Long, X.; Sangaiah, A.K.; Zheng, Z.; Tong, C. Deep detection network for real-life traffic sign in vehicular networks. Comput. Netw. 2018, 136, 95–104. [Google Scholar] [CrossRef]
  16. Lu, Y.; Lu, J.; Zhang, S.; Hall, P. Traffic signal detection and classification in street views using an attention model. Comput. Vis. Media 2018, 4, 253–266. [Google Scholar] [CrossRef] [Green Version]
  17. Everingham, M.; Van Gool, L.; Williams, C.K.I.; Winn, J.; Zisserman, A. The Pascal visual object classes (VOC) challenge. Int. J. Comput. Vis. 2010, 88, 303–338. [Google Scholar] [CrossRef] [Green Version]
  18. Gauen, K.; Dailey, R.; Laiman, J.; Zi, Y.; Asokan, N.; Lu, Y.H.; Thiruvathukal, G.K.; Shyu, M.L.; Chen, S.C. Comparison of visual datasets for machine learning. In Proceedings of the 2017 IEEE International Conference on Information Reuse and Integration (IRI), San Diego, CA, USA, 4–6 August 2017; pp. 346–355. [Google Scholar]
  19. Zhang, J.; Xie, Z.; Sun, J.; Zou, X.; Wang, J. A Cascaded R-CNN With Multiscale Attention and Imbalanced Samples for Traffic Sign Detection. IEEE Access 2020, 8, 29742–29754. [Google Scholar] [CrossRef]
  20. Ibrahem, H.; Salem, A.; Kang, H.S. Weakly Supervised Traffic Sign Detection in Real Time Using Single CNN Architecture for Multiple Purposes. In Proceedings of the 2020 IEEE International Conference on Consumer Electronics (ICCE), Las Vegas, NV, USA, 4–6 January 2020; pp. 1–4. [Google Scholar]
  21. Houben, S.; Stallkamp, J.; Salmen, J.; Schlipsing, M.; Igel, C. Detection of traffic signs in realworld images: The German Traffic Sign Detection Benchmark. In Proceedings of the 2013 International Joint Conference on Neural Networks (IJCNN), Dallas, TX, USA, 4–9 August 2013; pp. 1–8. [Google Scholar]
  22. Li, Y.; Wang, J.; Xing, T. TAD16K: An enhanced benchmark for autonomous driving. In Proceedings of the 2017 IEEE International Conference on Image Processing (ICIP), Beijing, China, 17–20 September 2017; pp. 2344–2348. [Google Scholar]
  23. Zhu, Z.; Liang, D.; Zhang, S.; Huang, X.; Hu, S. Traffic-sign detection and classification in the wild. In Proceedings of the IEEE Conference on Computer Vision and Pattern Recognition (CVPR), Las Vegas, NV, USA, 27–30 June 2016; Volume 1, pp. 2110–2118. [Google Scholar]
  24. Liu, L.; Wang, Y.; Li, K.; Li, J. Focus First: Coarse-to-Fine Traffic Sign Detection with Stepwise Learning. IEEE Access 2020, 8, 171170–171183. [Google Scholar] [CrossRef]
  25. Jin, Y.; Fu, Y.; Wang, W.; Guo, J.; Ren, C.; Xiang, X. Multi-Feature Fusion and Enhancement Single Shot Detector for Traffic Sign Recognition. IEEE Access 2020, 8, 38931–38940. [Google Scholar] [CrossRef]
  26. Li, J.; Liang, X.; Wei, Y.; Xu, T.; Feng, J.; Yan, S. Perceptual generative adversarial networks for small object detection. In Proceedings of the IEEE Conference on Computer Vision and Pattern Recognition (CVPR), Honolulu, HI, USA, 21–26 July 2017; Volume 1, pp. 1951–1959. [Google Scholar]
  27. Li, G.; Li, S.E.; Zou, R.; Liao, Y.; Cheng, B. Detection of road traffic participants using cost-effective arrayed ultrasonic sensors in low-speed traffic situations. Mech. Syst. Signal Process. 2019, 132, 535–545. [Google Scholar] [CrossRef] [Green Version]
  28. Yuan, Y.; Xiong, Z.; Wang, Q. VSSA-NET: Vertical Spatial Sequence Attention Network for Traffic Sign Detection. IEEE Trans. Image Proc. 2019, 28, 3423–3434. [Google Scholar] [CrossRef] [PubMed]
  29. Zhu, H.; Zhang, J.; Xu, G.; Deng, L. Balanced Ring Top-Hat Transformation for Infrared Small-Target Detection With Guided Filter Kernel. IEEE Trans. Aerosp. Electron. Syst. 2020, 56, 3892–3903. [Google Scholar] [CrossRef]
  30. Deng, H.; Sun, X.; Zhou, X. A Multiscale Fuzzy Metric for Detecting Small Infrared Targets Against Chaotic Cloudy/Sea-Sky Backgrounds. IEEE Trans. Cybern. 2018, 49, 1694–1707. [Google Scholar] [CrossRef]
  31. Liu, L.; Tang, X.; Xie, J.; Gao, X.; Zhao, W.; Mo, F.; Zhang, G. Deep-Learning and Depth-Map Based Approach for Detection and 3-D Localization of Small Traffic Signs. IEEE J. Sel. Top. Appl. Earth Obs. Remote Sens. 2020, 13, 2096–2111. [Google Scholar] [CrossRef]
  32. Zhao, J.; Xu, H.; Liu, H.; Wu, J.; Zheng, Y.; Wu, D. Detection and tracking of pedestrians and vehicles using roadside LiDAR sensors. Transp. Res. Part C: Emerg. Technol. 2019, 100, 68–87. [Google Scholar] [CrossRef]
  33. Li, G.; Xie, H.; Yan, W.; Chang, Y.; Qu, X. Detection of Road Objects With Small Appearance in Images for Autonomous Driving in Various Traffic Situations Using a Deep Learning Based Approach. IEEE Access 2020, 8, 211164–211172. [Google Scholar] [CrossRef]
  34. Hu, Q.; Paisitkriangkrai, S.; Shen, C.; Hengel, A.V.D.; Porikli, F. Fast Detection of Multiple Objects in Traffic Scenes With a Common Detection Framework. IEEE Trans. Intell. Transp. Syst. 2015, 17, 1002–1014. [Google Scholar] [CrossRef] [Green Version]
  35. Tong, K.; Wu, Y.; Zhou, F. Recent advances in small object detection based on deep learning: A review. Image Vis. Comput. 2020, 97, 103910. [Google Scholar] [CrossRef]
  36. Tian, W.; Lauer, M.; Chen, L. Online Multi-Object Tracking Using Joint Domain Information in Traffic Scenarios. IEEE Trans. Intell. Transp. Syst. 2019, 21, 374–384. [Google Scholar] [CrossRef]
  37. Zhang, Y. Detection and Tracking of Human Motion Targets in Video Images Based on Camshift Algorithms. IEEE Sens. J. 2019, 20, 11887–11893. [Google Scholar] [CrossRef]
  38. Dong, X.; Shen, J.; Yu, D.; Wang, W.; Liu, J.; Huang, H. Occlusion-Aware Real-Time Object Tracking. IEEE Trans. Multimed. 2016, 19, 763–771. [Google Scholar] [CrossRef]
  39. Harikrishnan, P.M.; Thomas, A.; Gopi, V.P.; Palanisamy, P. Fast approach for moving vehicle localization and bounding box estimation in highway traffic videos. Signal Image Video Process. 2021, 1–8. [Google Scholar] [CrossRef]
  40. Ciaparrone, G.; Sánchez, F.L.; Tabik, S.; Troiano, L.; Tagliaferri, R.; Herrera, F. Deep learning in video multi-object tracking: A survey. Neurocomputing 2020, 381, 61–88. [Google Scholar] [CrossRef] [Green Version]
  41. Yang, H.; Li, J.; Liu, J.; Zhang, Y.; Wu, X.; Pei, Z. Multi-Pedestrian Tracking Based on Improved Two Step Data Association. IEEE Access 2019, 7, 100780–100794. [Google Scholar] [CrossRef]
  42. Fernández-Sanjurjo, M.; Bosquet, B.; Mucientes, M.; Brea, V.M. Real-time visual detection and tracking system for traffic monitoring. Eng. Appl. Artif. Intell. 2019, 85, 410–420. [Google Scholar] [CrossRef]
  43. Ma, Q.; Zou, Q.; Wang, N.; Guan, Q.; Pei, Y. Looking ahead: Joint small group detection and tracking in crowd scenes. J. Vis. Commun. Image Represent. 2020, 72, 102876. [Google Scholar] [CrossRef]
  44. Griffin, B.A.; Corso, J.J. Bubblenets: Learning to select the guidance frame in video object segmentation by deep sorting frames. In Proceedings of the IEEE Conference on Computer Vision and Pattern Recognition (CVPR), Long Beach, CA, USA, 16–20 June 2019; pp. 8914–8923. [Google Scholar]
  45. Huang, H.; Yang, M.; Wang, C.; Wang, B. A unified hierarchical convolutional neural network for fine-grained traffic sign detection. In Proceedings of the 2018 Chinese Automation Congress (CAC), Xi’an, China, 30 November–2 December 2018; pp. 2733–2738. [Google Scholar]
  46. Snell, J.; Swersky, K.; Zemel, R.S. Prototypical networks for few-shot learning. In Proceedings of the 31st Annual Conference on Neural Information Processing Systems (NIPS), Long Beach, CA, USA, 4–9 December 2017. [Google Scholar]
  47. Song, S.; Zhu, J.; Li, X.; Huang, Q. Integrate MSRCR and Mask R-CNN to Recognize Underwater Creatures on Small Sample Datasets. IEEE Access 2020, 8, 172848–172858. [Google Scholar] [CrossRef]
  48. Hendrycks, D.; Dietterich, T.G. Benchmarking Neural Network Robustness to Common Corruptions and Surface Variations. 2018. Available online: https://arxiv.org/abs/1807.01697 (accessed on 27 April 2019).
  49. He, K.; Zhang, X.; Ren, S.; Sun, J. Deep Residual Learning for Image Recognition. In Proceedings of the IEEE Conference on Computer Vision and Pattern Recognition (CVPR), Las Vegas, NV, USA, 27–30 June 2016; Volume 1, pp. 770–778. [Google Scholar]
  50. Wan, J.; Ding, W.; Zhu, H.; Xia, M.; Huang, Z.; Tian, L.; Zhu, Y.; Wang, H. An Efficient Small Traffic Sign Detection Method Based on YOLOv3. J. Signal Process. Syst. 2020, 1–13. [Google Scholar] [CrossRef]
  51. Hou, X.; Wang, Y.; Chau, L.P. Vehicle Tracking Using Deep SORT with Low Confidence Track Filtering. In Proceedings of the 2019 16th IEEE International Conference on Advanced Video and Signal Based Surveillance (AVSS), Taipei, Taiwan, 18–21 September 2019; pp. 1–6. [Google Scholar]
  52. Russakovsky, O.; Deng, J.; Su, H.; Krause, J.; Satheesh, S.; Ma, S.; Huang, Z.; Karpathy, A.; Khosla, A.; Bernstein, M.; et al. ImageNet Large Scale Visual Recognition Challenge. Int. J. Comput. Vis. 2015, 115, 211–252. [Google Scholar] [CrossRef] [Green Version]
  53. Wang, G.; Xiong, Z.; Liu, D.; Luo, C. Cascade mask generation framework for fast small object detection. In Proceedings of the 2018 IEEE International Conference on Multimedia and Expo (ICME), San Diego, CA, USA, 23–27 July 2018; pp. 1–6. [Google Scholar]
  54. Zhang, H.; Qin, L.; Li, J.; Guo, Y.; Zhou, Y.; Zhang, J.; Xu, Z. Real-Time Detection Method for Small Traffic Signs Based on Yolov3. IEEE Access 2020, 8, 64145–64156. [Google Scholar] [CrossRef]
Figure 1. (a) Some examples of prohibitory signs. (b) Specific traffic signs, including height, width, and the speed limit.
Applsci 11 03061 g001
Figure 2. Comparison diagram of TT100K and enhanced TT100K traffic sign category distribution.
Applsci 11 03061 g002
Figure 3. The structure of improved YOLOv3 (Red is the deleted part, blue is the newly added part).
Applsci 11 03061 g003
Figure 4. The constituent structural unit of Residual Networks. (a) Residual unit. (b) DBL unit.
Applsci 11 03061 g004
Figure 5. Improved structure for detection-and-tracking.
Applsci 11 03061 g005
Figure 6. The comparison of the (a) Avg Loss Curve and (b) P-R Curve between YOLOv3 and improved YOLOv3.
Applsci 11 03061 g006
Figure 7. The left column (a,c,e) show the original video detection results, and the right column (b,d,f) show the video detection results after adding Deep-Sort.
Applsci 11 03061 g007
Table 1. Test Results of YOLOv3 on TT100K after Applying Data Augmentation Technology.
Data AugmentationTPFPFNPR
-15245864610.720.77
Image corruption24745915920.810.81
(P: Precision, R: Recall, “-” Means No Data Augmentation is Used).
Table 2. Comparisons of YOLOv3 Detection Results before and after Improvements ([email protected]).
Detection AlgorithmPRmAPSpeedFPS
YOLOv30.810.810.7040.0269s37.94
Ours0.910.900.84760.0323s24.22
Table 3. YOLOv3 and Improved YOLOv3 Test Results for Targets at Different Sizes ([email protected]).
SizePrecision 1Precision 2Recall 1Recall 2mAP 1mAP 2
(0,32]0.640.740.670.760.620.75
(32,96]0.830.940.840.920.810.87
(96,400]0.850.930.860.940.830.88
(1: YOLOv3, 2: Improved YOLOv3).
Table 4. Detection Results of Different Detection Models on TT100K, “-” Means No Parameters Are Given ([email protected]).
ModelPRmAPSpeedFPSClasses
Lu et al. [16]0.9170.8340.8700.26 s3.8545
Zhu_model [23]0.910.930.9310.83s545
Li et al. [26]0.8790.930.93-<1.645
Wang et al. [53]0.9270.868--9.645
MSA-YOLOv3 [54]0.8250.8410.8630.042s23.8745
Ours10.910.920.91770.027 s29.3345
Ours20.910.900.84760.0323s24.22152
Table 5. Comparing the AP values (%) on Zhu [23] and the model in this paper, “-” indicates that the model does not contain this flag category.
Classioi1i2i3i4i5i10i11i12i13i14
Zhu [23]--77.68-88.0493.04-----
Ours178.41100.093.73090.9796.5866.670000
Ours288.84100.089.04100.091.197.99100.00100.083.33100.0
Classi15il50il60il70il80il90il100il110il120ipp1
Zhu [23]--86.97-85.16--50.00-82.31-
Ours10093.33085.7191.67100.0100.0071.9850.00
Ours2050.096.87085.9877.5488.8976.0091.8184.21
Classp2p3p4p5p6p7p8p9p10p11p12
Zhu [23]--------78.7287.4786.50
Ours13577.78093.974.860070.086.7683.2550.00
Ours2100.099.76085.4780.400100.0100.079.1886.7393.63
Classp13p14p15p16p17p18p19p20p21p22p23
Zhu [23]-----------
Ours10000100.083.3338.2700100.085.21
Ours2075.00100.060.083.3377.2666.67070.5483.05
Classp24p25p26p27p28p29pa10pa12pa13pa14pb
Zhu [23]-----------
Ours10100.00100.000005083.33100.0
Ours2100.091.6793.6199.94100.00100.0100.0100.092.3882.36
Classpcpepgph1.5ph2ph2.1ph2.2ph2.5ph2.8ph2.9ph3
Zhu [23]-----------
Ours10052.080000000100.0
Ours20088.24100.075.00100.0100.0100.0100.0100.0100.0
Classph3.3ph3.5ph4ph4.2ph4.5ph4.8ph4.3ph2.4woph5ph5.3
Zhu [23]--71.92-76.53----66.25-
Ours10056.67083.3300083.3393.060
Ours2100.0100.088.33100.096.40100.0100.0100.080.3393.82100.0
Classpl5pl10pl15pl20pl25pl30pl35pl40pl50pl60pl70
Zhu [23]---74.53-86.84-90.2389.3879.4487.22
Ours183.9202547.69076.92086.4485.0972.9765.95
Ours282.25100.094.7367.67100.084.9180.0087.0186.7181.9688.24
Classpl80pl90pl100pl110pl120pm15pm35pm40pm50pm10pm20
Zhu [23]87.39-92.48-93.92-----83.96
Ours167.7966.6783.5191.6781.900000056.43
Ours280.6789.3287.1966.6774.70100.0100.0100.0100.085.7189.63
Classpm30pm55popnpnepnlpr10pr20pr50pr70pr80
Zhu [23]87.6279.99-89.7591.16------
Ours130.5784.9267.5693.0496.190066.6710000
Ours292.6395.7588.5295.7995.100100.0100.0100.0100.0100.0
Classpr100pr40pr30pr60pspw3pw3.2pw3.5pw4pw4.2w3
Zhu [23]-87.16---------
Ours10100.050012.50000000
Ours2100.0100.098.77100.075.00100.0100.0100.0100.0100.00
Classw5w8w10w12w13w16w18w20w21w22w24
Zhu [23]----77.69------
Ours10000089.14000050
Ours2100.00100.0100.0100.097.37100.0100.0100.0100.090.0
Classw26w30w31w32w34w35w37w38w41w42w43
Zhu [23]---54.56-------
Ours10075050000000
Ours2100.0100.095.78100.096.42100.00100.0100.080.086.92
Classw45w46w47w55w57w58w59w63w66--
Zhu [23]-----------
Ours10100.00085.1987.5480.090.380--
Ours2100.083.3350.0084.6293.5496.0890.9399.4887.50--
(Ours1 represents detection of TT100K without enhancement, Ours2 represents detection of enhanced TT100K).
Publisher’s Note: MDPI stays neutral with regard to jurisdictional claims in published maps and institutional affiliations.

